 Open Access
ARTICLE
Facial Emotion Recognition Using Swarm Optimized Multi-Dimensional DeepNets with Losses Calculated by Cross Entropy Function
1 Department of Computer Science & Engineering, Sri Venkateswara Institute of Science and Technology, Tiruvallur, Tamilnadu, India
2 Department of Electronics and Communication Engineering, Anna University, Trichy, Tamilnadu, India
* Corresponding Author: A. N. Arun. Email:
Computer Systems Science and Engineering 2023, 46(3), 3285-3301. https://doi.org/10.32604/csse.2023.035356
Received 17 August 2022; Accepted 28 December 2022; Issue published 03 April 2023
Abstract
The human face forms a canvas wherein various non-verbal expressions are communicated. These expressional cues and verbal communication represent the accurate perception of the actual intent. In many cases, a person may present an outward expression that might differ from the genuine emotion or the feeling that the person experiences. Even when people try to hide these emotions, the real emotions that are internally felt might reflect as facial expressions in the form of micro expressions. These micro expressions cannot be masked and reflect the actual emotional state of a person under study. Such micro expressions are on display for a tiny time frame, making it difficult for a typical person to spot and recognize them. This necessitates a place for Machine Learning, where machines can be trained to look for these micro expressions and categorize them once they are on display. The study’s primary purpose is to spot and correctly classify these micro expressions, which are very difficult for a casual observer to identify. This research improves upon the accuracy of the recognition by using a novel learning technique that not only captures and recognizes multimodal facial micro expressions but also has features for aligning, cropping, and superimposing these feature frames to produce highly accurate and consistent results. A modified variant of the deep learning architecture of Convolutional Neural Networks combined with the swarm-based optimality technique of the Artificial Bee Colony Algorithm is proposed to effectively get an accuracy of more than 85% in identifying and classifying these micro expressions in contrast to other algorithms that have relatively less accuracy. One of the main aspects of processing these expressions from video or live feeds is aligning the frames homographically and identifying these concise bursts of micro expressions, which significantly increases the accuracy of the outcomes. The proposed swarm-based technique handles this in the research to precisely align and crop the subsequent frames, resulting in much superior detection rates in identifying the micro expressions when on display.Keywords
The face is the index of the mind. As humans, this index is expressed outward by various facial expressions. Some of these expressions reveal our inner emotions, like happiness, sadness, anger, excitement/surprise, fear, disgust, or just being neutral. Emotions thus play a significant role in building a form of a non-verbal cue in society. These expressions and various communication modes give a holistic perspective on the ideas we try to put across. But there are times wherein the actual expression felt by the person may differ from that of what is projected outside. For instance, the person who puts on a happy face on the surface for others to see may internally hide a ton of other contrasting emotions that might be felt within. Even though the brain system tries to conceal these inner feelings, our brains are wired so that, unconsciously, genuine emotions are revealed even without us realizing it. These emotional qualities are known as micro-expressions. The micro-expressions are very brief emotions that might be on display for 0.5 to 1 s at max; hence, only someone specialized and trained to detect them will be able to focus on and find them. Thus, the challenge of finding the micro-expressions falls mainly in Artificial Intelligence and Deep Learning, where research systems train machines to spot these expressions when on display. Micro-expressions knowledge is used in criminology, job recruitment, customer feedback surveys, online learning portals, etc. The model uses Deep Neural Networks to recognize and spot these micro expressional changes. Once the changes are identified, they are mapped to Action Units through a modified swarm-based Artificial Bee Colony algorithm, which effectively categorizes the exhibited micro expressions.
2.1 Static Facial Expression Analysis
Facial recognition of emotions has long been the field of interest for many research works. The static analysis of facial expression is done by extracting feature sets from images and thereby using algorithms to infer the exhibited expression. Ekman [1], in his work on facial emotions, analyzed the various references on the cross-cultural impacts of different groups of people for similar sets of expression classes. Tang [2], in his work on the FER2013 Kaggle competition, used datasets like the FER2013 Dataset, Japanese Female Facial Expression Dataset, Mobile Web App Dataset, and the Extended Cohn-Kanade Dataset to train his model on static images. The study used a combination of a Neural Network along with a Support Vector Machine model to classify the emotions. Most facial emotion recognition research using static expression analysis used images or discrete video frames captured as images. This leads to a loss of continuity in the expressions being exhibited, where a person might display emotion for less and then change their emotions to an entirely different category of emotions. Thus, analyzing static images helped pick the emotional cues for discrete emotions. Still, it lacked the continuous monitoring of emotions essential for spotting and correctly identifying micro expressional emotions.
2.2 Dynamic Facial Expression Analysis
The dynamic facial expressions are mainly captured from existing video data or acquired from real-time live video feeds. The main objective of this approach is to first extract the apex frames from the video data and then apply techniques to recognize facial expressions. In analyzing micro expressions, this task is made more difficult to data’s temporal nature. Micro expressions being very short-lived in expression, capturing the frames that transform from an existing state of expression to a micro expression and then resuming its prior form becomes difficult. Data sets like In the Wild [3] (ITW). The work of Allaert et al. made significant progress in classifying micro expressions by using the elasticity and deformations produced in the face when emotion is exhibited and created accuracies close to 70% in the CASME II dataset. Introducing the CK+ dataset with video data on micro expression vastly improved the research on micro expression analysis. With the introduction of standardized deep learning architectures, the field of micro expression analysis gained good momentum in which vastly improved techniques and architectures were employed to increase the accuracy of detection and classification of the micro expressions on a real-time basis. Some of the standard methods that are being utilized for the recognition of micro facial expressions are tabulated in Table 1:
3.1 Data Sets for Facial Expressions
The proposed work is implemented using the following publicly available datasets: FER2013 [17], Google Data Set, CK+ [18], FEC, and the In the Wild dataset. Pierre-Luc Carrier and Aaron Courville developed the FER2013 dataset. The dataset consists of 48 × 48 pixel greyscale images with about 28,709 examples for the training set. The emotions are categorized into 6 classes: Angry, Disgust, Fear, Happy [19], Sad, surprised, and Neutral. The Extended Cohn-Kanade (CK+) Dataset was released as an extension to the original CK dataset. The Ck dataset is one of the most widely used datasets for evaluating facial expressions in the research domain. It consists of 97 subjects recorded over 486 sequences. The frames are labeled using the standardized Facial Action Coding System (FACS). In addition, 26 more topics and 107 series were added to create the CK+ dataset. These classify expressions like Anger, Contempt, Disgust, Fear, Happy [20], Sadness, and Surprise.
The video sequences are collected from various datasets mentioned above and represented as a normalized dataset. The video sequences are fed into a frame grabber that isolates each frame into a series of images depending on the duration of the video file considered. Each of these frames is then analyzed for the presence of facial topologies; if present, those frames are sequenced and preserved. The rest of the frames that contain non-facial information are discarded.
The frames obtained from the above process are aligned using a sequence of basic affine transforms like rotation, scaling, and translation. This changes the input coordinates of the image to the desired output coordinate system that is expected from the resultant reference frames. The Harr Cascade Classifier of the OpenCV toolkit is used to detect the facial and eye regions in the presented structure. The facial region is seen from the rest of the image and is marked. Then within the area, the left and right eye are caught and observed, and their coordinates are calculated as Region of Interest. The mid-point of each of these eye regions is calculated. A line is drawn from the mid-points of these two regions, and the line's slope gives the directionality of the rotation of the image, as shown in Figs. 1 and 2.
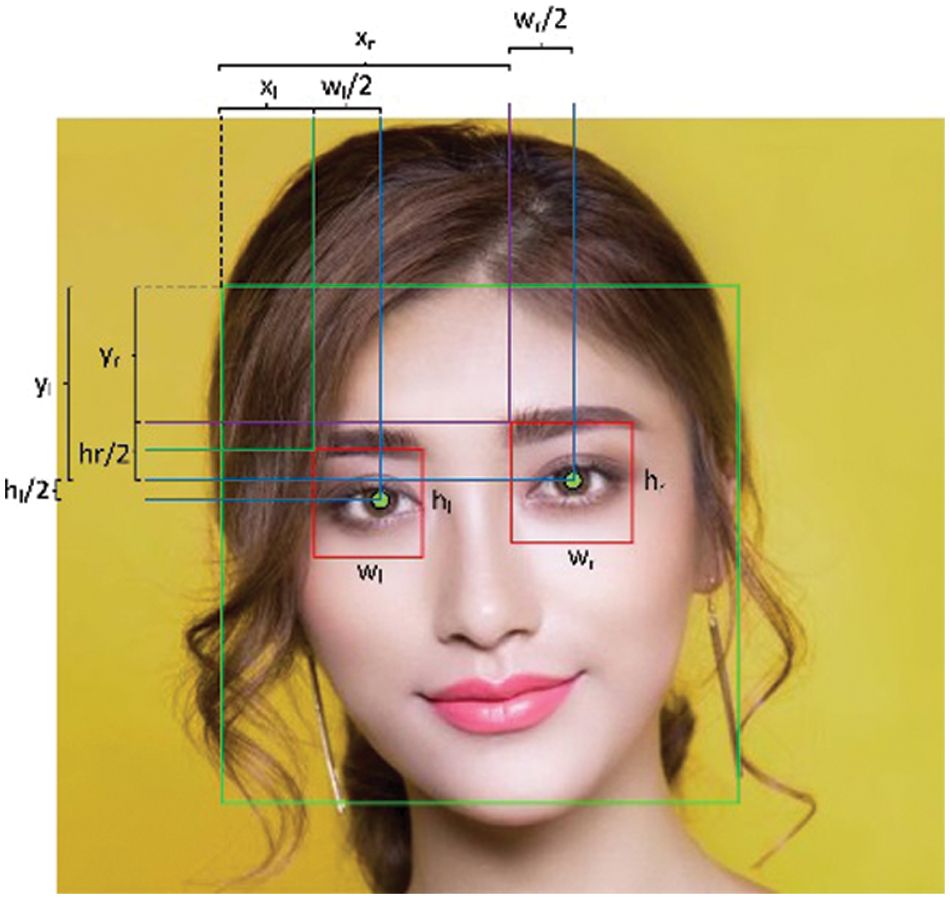
Figure 1: Calculating the alignment of the facial features
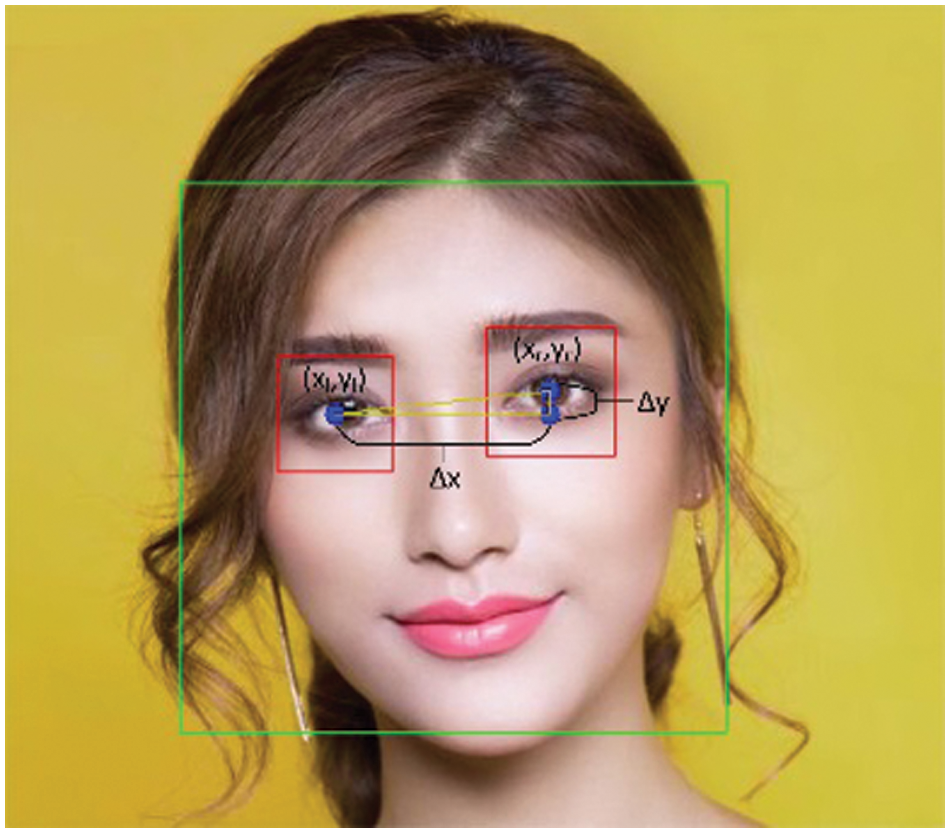
Figure 2: Calculating the rotational coefficient to align frames
For the left eye,
And for the right eye,
The angle of rotation is computed as
The angle that is obtained is used in rotating the image for vertical alignment for stacking all related image frames.
3.4 Optical Flow and Homography Using Ensemble Learning
Homography of the different image planes is done after stacking the various facial images one behind the other and looking for points of similarity to precisely align points of interest on the different apex frames. The points or regions of interest are mainly chosen over the eye and nasal regions for defining the homography matrix, as shown in Fig. 3. For instance, if ‘x’ is a point of interest in one image and ‘x′’ is another pointin the next image to be aligned, they can be represented as:
Then the homography matrix ‘M’ can be represented as
where every pixel in the second image x′ is wrapped around the original image x by the homographic transform

Figure 3: Rotation and crop of required facial landmark features
The ensemble learning algorithm being used is the Artificial Bee Colony algorithm. This acts as an evolutionary particle swarm optimizer in the way that there are three sets of bees that enable the detection and learning of the optical flow patterns between the consecutive frames of the apex images chosen and homographically aligned [21]. An additional feedback loop is added to the swarm intelligence layer, which acts as a reinforcement loop to increase the efficacy of the inputs supplied for the training based on the losses calculated by a cross-entropy function. Micro-expressions mainly focus on facial landmarks like eyebrows, eyes, and lips. These regions are marked and segmented, and variance in the general optical flow vector is computed.
The Artificial Bee Colony algorithm employs three groups of bees: the employed bees, the onlooker bees, and the scout bees. This algorithm is used to train the bees in detecting the apex frames from the video segments that display the micro expressions and then to relate the associated structures that are temporally linked with the critical micro expression. The nectar, the food source, represents the video segment’s individual frames. The employed bees and the onlooker bees continuously exploit these frames or food sources until all the video frames are processed. The employed bees associate themselves with the food source, and the onlooker bees watch the dance of the employed bees. Thus, they find and align the optimal food source or the video frames that maximize the chance of finding the related micro expression being displayed. Once all the food sources are found, the employed bee becomes a scout bee and waits for the following video frames showing the next micro expression category. Based on the variance of the optical flow vector calculated between consecutive frames, losses are calculated based on the cross entropy function and again fed back to the loop. This reinforces the learning process and thereby trains the bees to become competent by associating themselves with important food sources to optimize the solution’s output. The scout bees are initialized with the optical vectors of the population of food sources,
where
As more onlooker bees join the search, the resulting solution’s quality keeps increasing, and a positive reinforcement behavior is established. The scout bees randomly check for the food sources till all the frames have been exhausted and wait for the following sequence of new structures to be supplied. Solutions with poor fitness value are rejected and removed from the source. This technique dramatically improves the classification accuracy of the result when contrasted with other research solutions because only frames with high fitness constraints that genuinely contribute to the solution’s usefulness are retained. The frames with high fitness values are aligned, cropped, and stacked to be given as inputs to the CNN for further categorizing the micro expressions into their respective emotional classes.
The images are aligned and resized to 127 × 127 pixels in dimension, and the optical flow between each consecutive apex frame is determined, as shown in Fig. 4. The optical flow is computed using the Lucas Kanade feature tracker method [22]. The motion estimation is calculated as displacing the pixels on one frame of the apex image to the next successive frame [23]. The magnitude of the vector implies the rate of change of the facial features as a function of time and is modeled as a partial differential equation in Fig. 5.
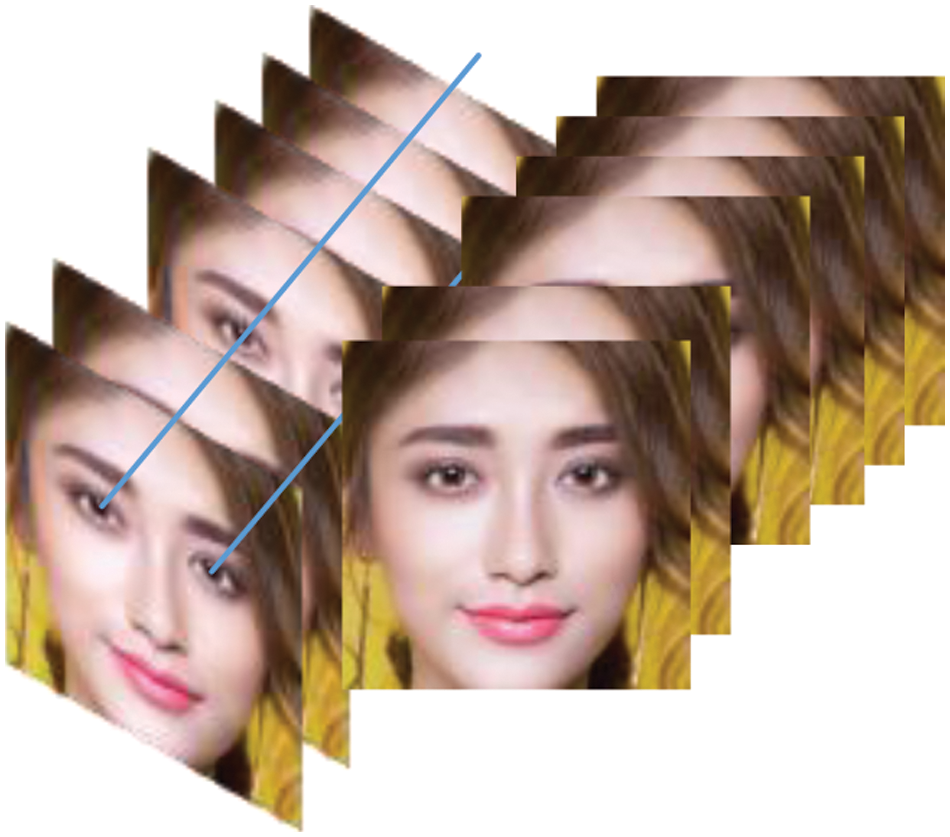
Figure 4: Homographic alignment of consecutive frames
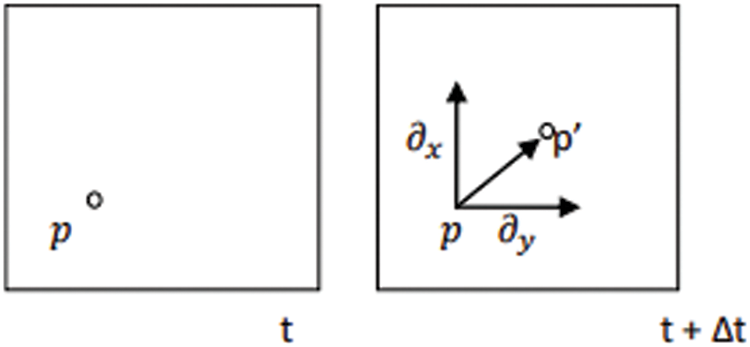
Figure 5: Calculating the vector of rate of the change of facial features
The matrix form of the transform can be described as
where the partial derivatives of image I, are
where I is the identity matrix.
The Facial Action Coding System (FACS) was initially developed by Carl-Herman Hjortsjö [24] as a template to taxonomize the movements of the facial muscles in human beings. The Facial Action Coding System (FACS) is a standardized marker for analyzing facial emotion features. This constantly evolved to be one of the standards to categorize the expressions exhibited by the face and facial structures. The coding of the muscle groups is used as an index to represent the facial expressions called the Action Units (AU). This index can identify specific facial regions of interest, which could be tagged as particular expressions. The minute changes in the facial features of the micro expressions are captured and aggregated to form a model organized into one or more of 44 Action Units and supplied later as inputs to the CNN for training. The emotion-related action units can be tabulated, as shown in Table 2:

A total of 16 AU are used to map the facial expressions that belong to a particular class of emotions. In addition, relaxed facial features like brows, eyelids, nose, lips, cheeks, and jaw are considered to be the baseline for a neutral emotion. All these 22 emotional classes are represented in Table 3, of an Image ‘I’ are encoded as an attribute vector ‘a’ and are computed as a sparse matrix representing the image ‘I’ dimensionality.

3.6 Modelling and Training the Convolutional Neural Network
The flow map is supplied as an input to the modified Convolutional Neural Network, wherein the inputs are trained by tagging them based on their respective Action Units. The whole architecture of the system is shown below in Fig. 6:
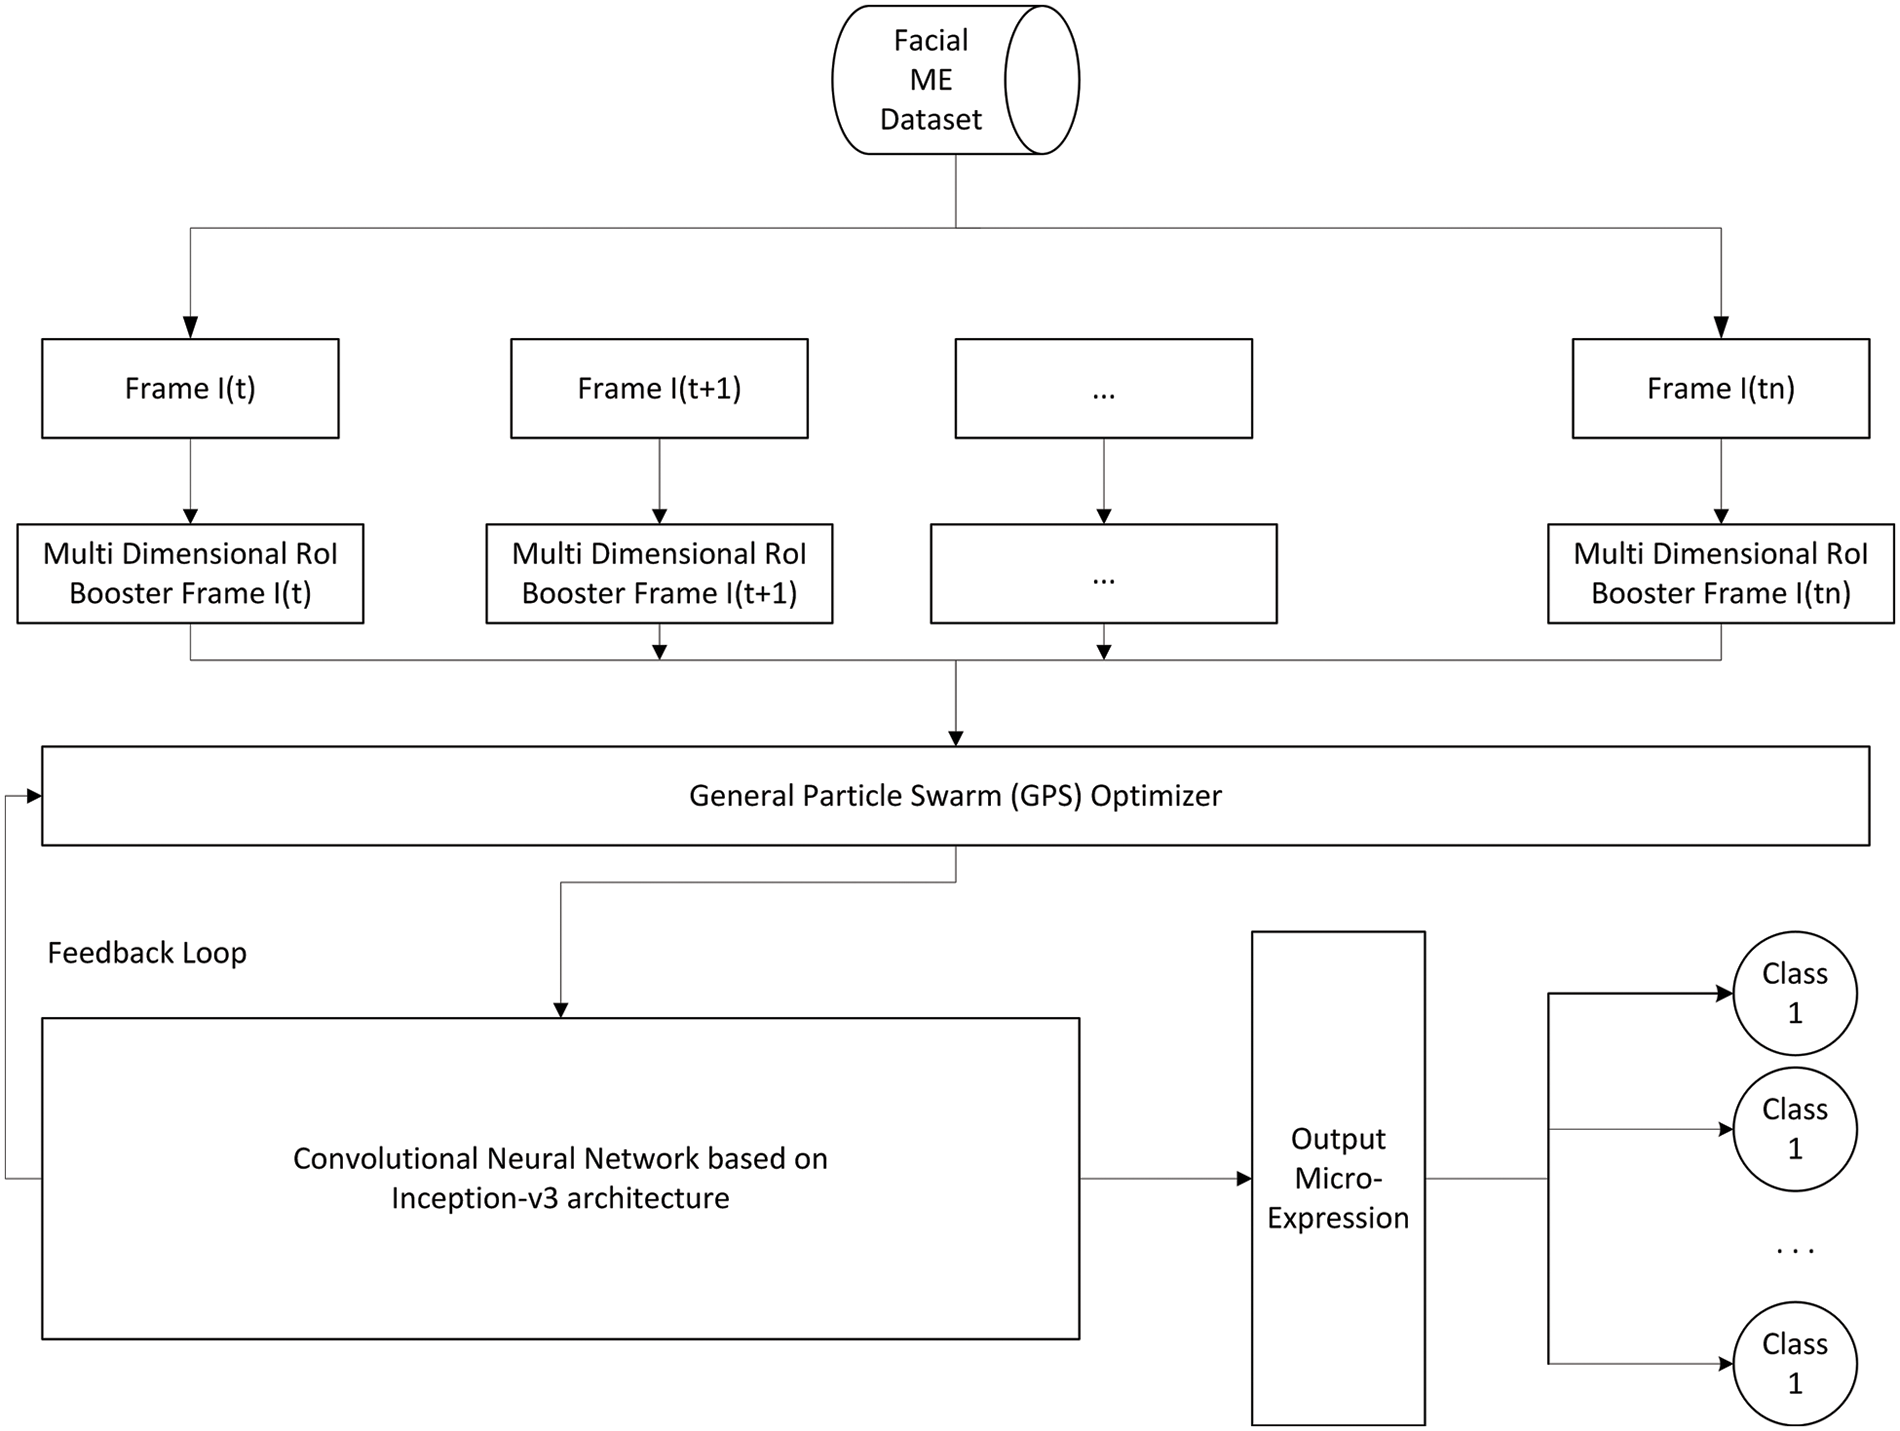
Figure 6: Architecture of the proposed system
The internal architecture of the Convolutional Neural Network is designed based on the Inception V3 architecture [25]. This architecture is modified to have a factorized 3 × 3 convolutional filter for improved granularity of convergence and also has features like label smoothing and auxiliary classifiers to propagate the information obtained from the ensemble learners down the pipeline along the network. A feedback loop is added to the CNN Layer which provides the swarm module with constant reinforcement control to reward and punish behaviors that eventually converge to highly accurate modules for identifying the specific micro-expressional features. With machines getting faster, this considerably reduces the training time of the model as the multi-dimensional boosting and swarm model takes up the heavy load of convolutions that are mapped by using the modified Convolutional Neural Network.
The Inception v3 model is chosen for the deep learning model because it consumes less memory in the order of around 92 MB and can have a topological depth of 159 layers and 23 M parameters [26]. The modified CNN uses a 3 × 3 standard convolutional kernel to train the network and has a Rectified Linear Unit (ReLU) and a pooling layer to flatten the model to be supplied for the fully connected classification layer. Hence the proposed DeepNet model takes less time to train as the taught inputs are already presented by the pre-processing stage, with weightage given to certain special features to look for in the inputs. The modified architecture sub-modules A, C, and E help factorize the parameter values, and sub-modules B and D enable reducing the grid size, as shown below in Fig. 7.
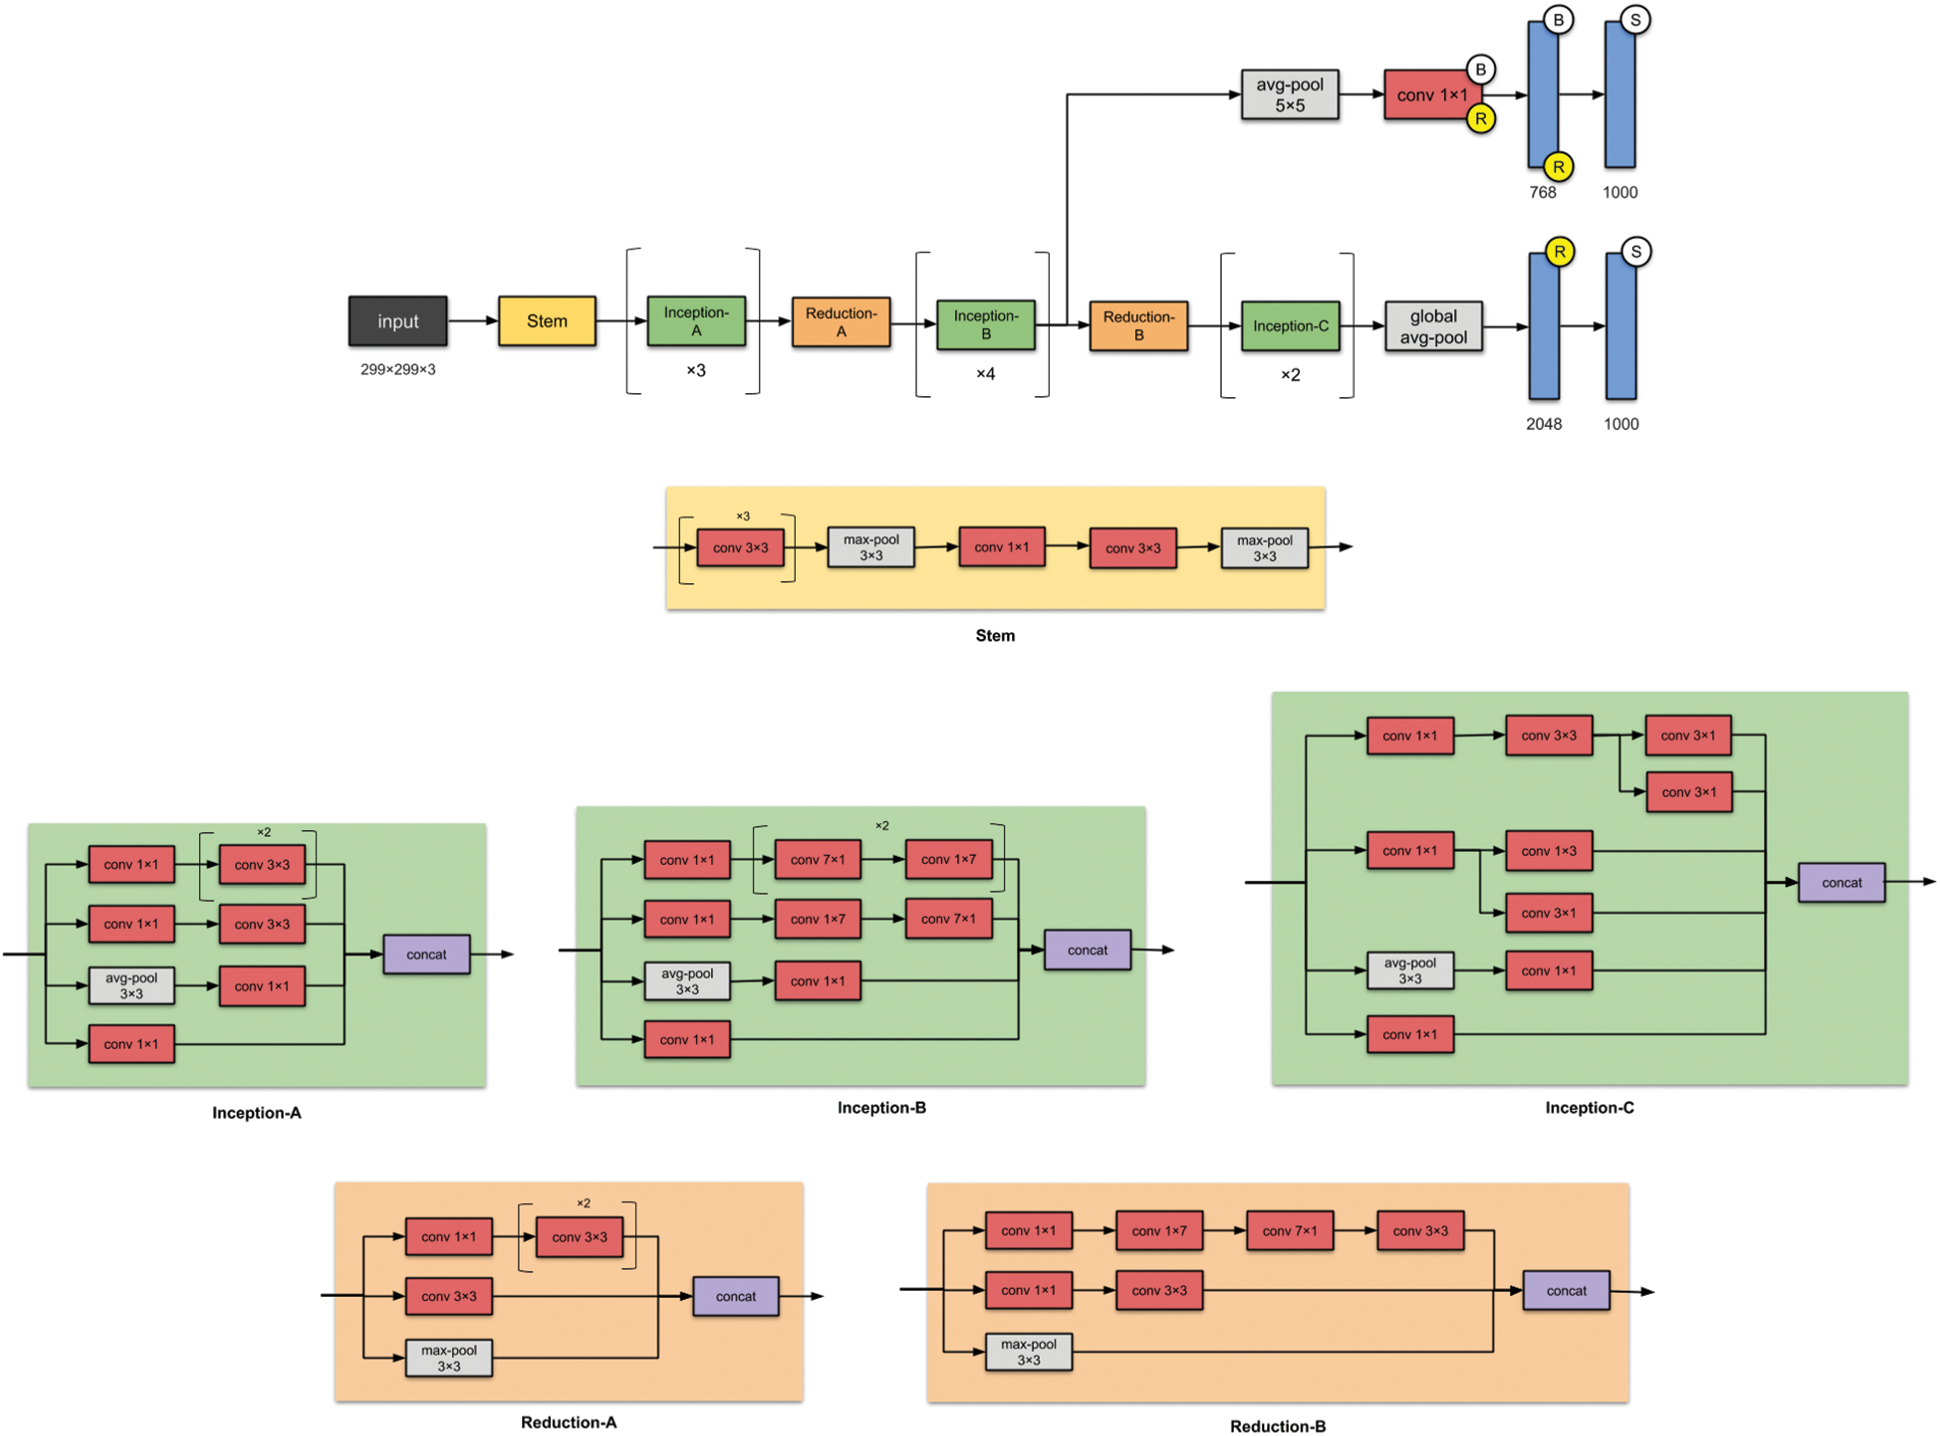
Figure 7: Inception v3–Higher-level architecture
The Inception V3 architecture is a base model because it comprises different filters and stacks up on the different layers after adding nonlinearity to the network. The model typically uses a 1 × 1 2D convolution filter which results in faster training of the model by shrinking the number of channels, thereby reducing the computational cost and increasing the performance of the design as represented in Fig. 8. The neural network processes the Spatio-temporal feature vectors encoded to produce classes categorized into mapping that is supplied during the training of the network.
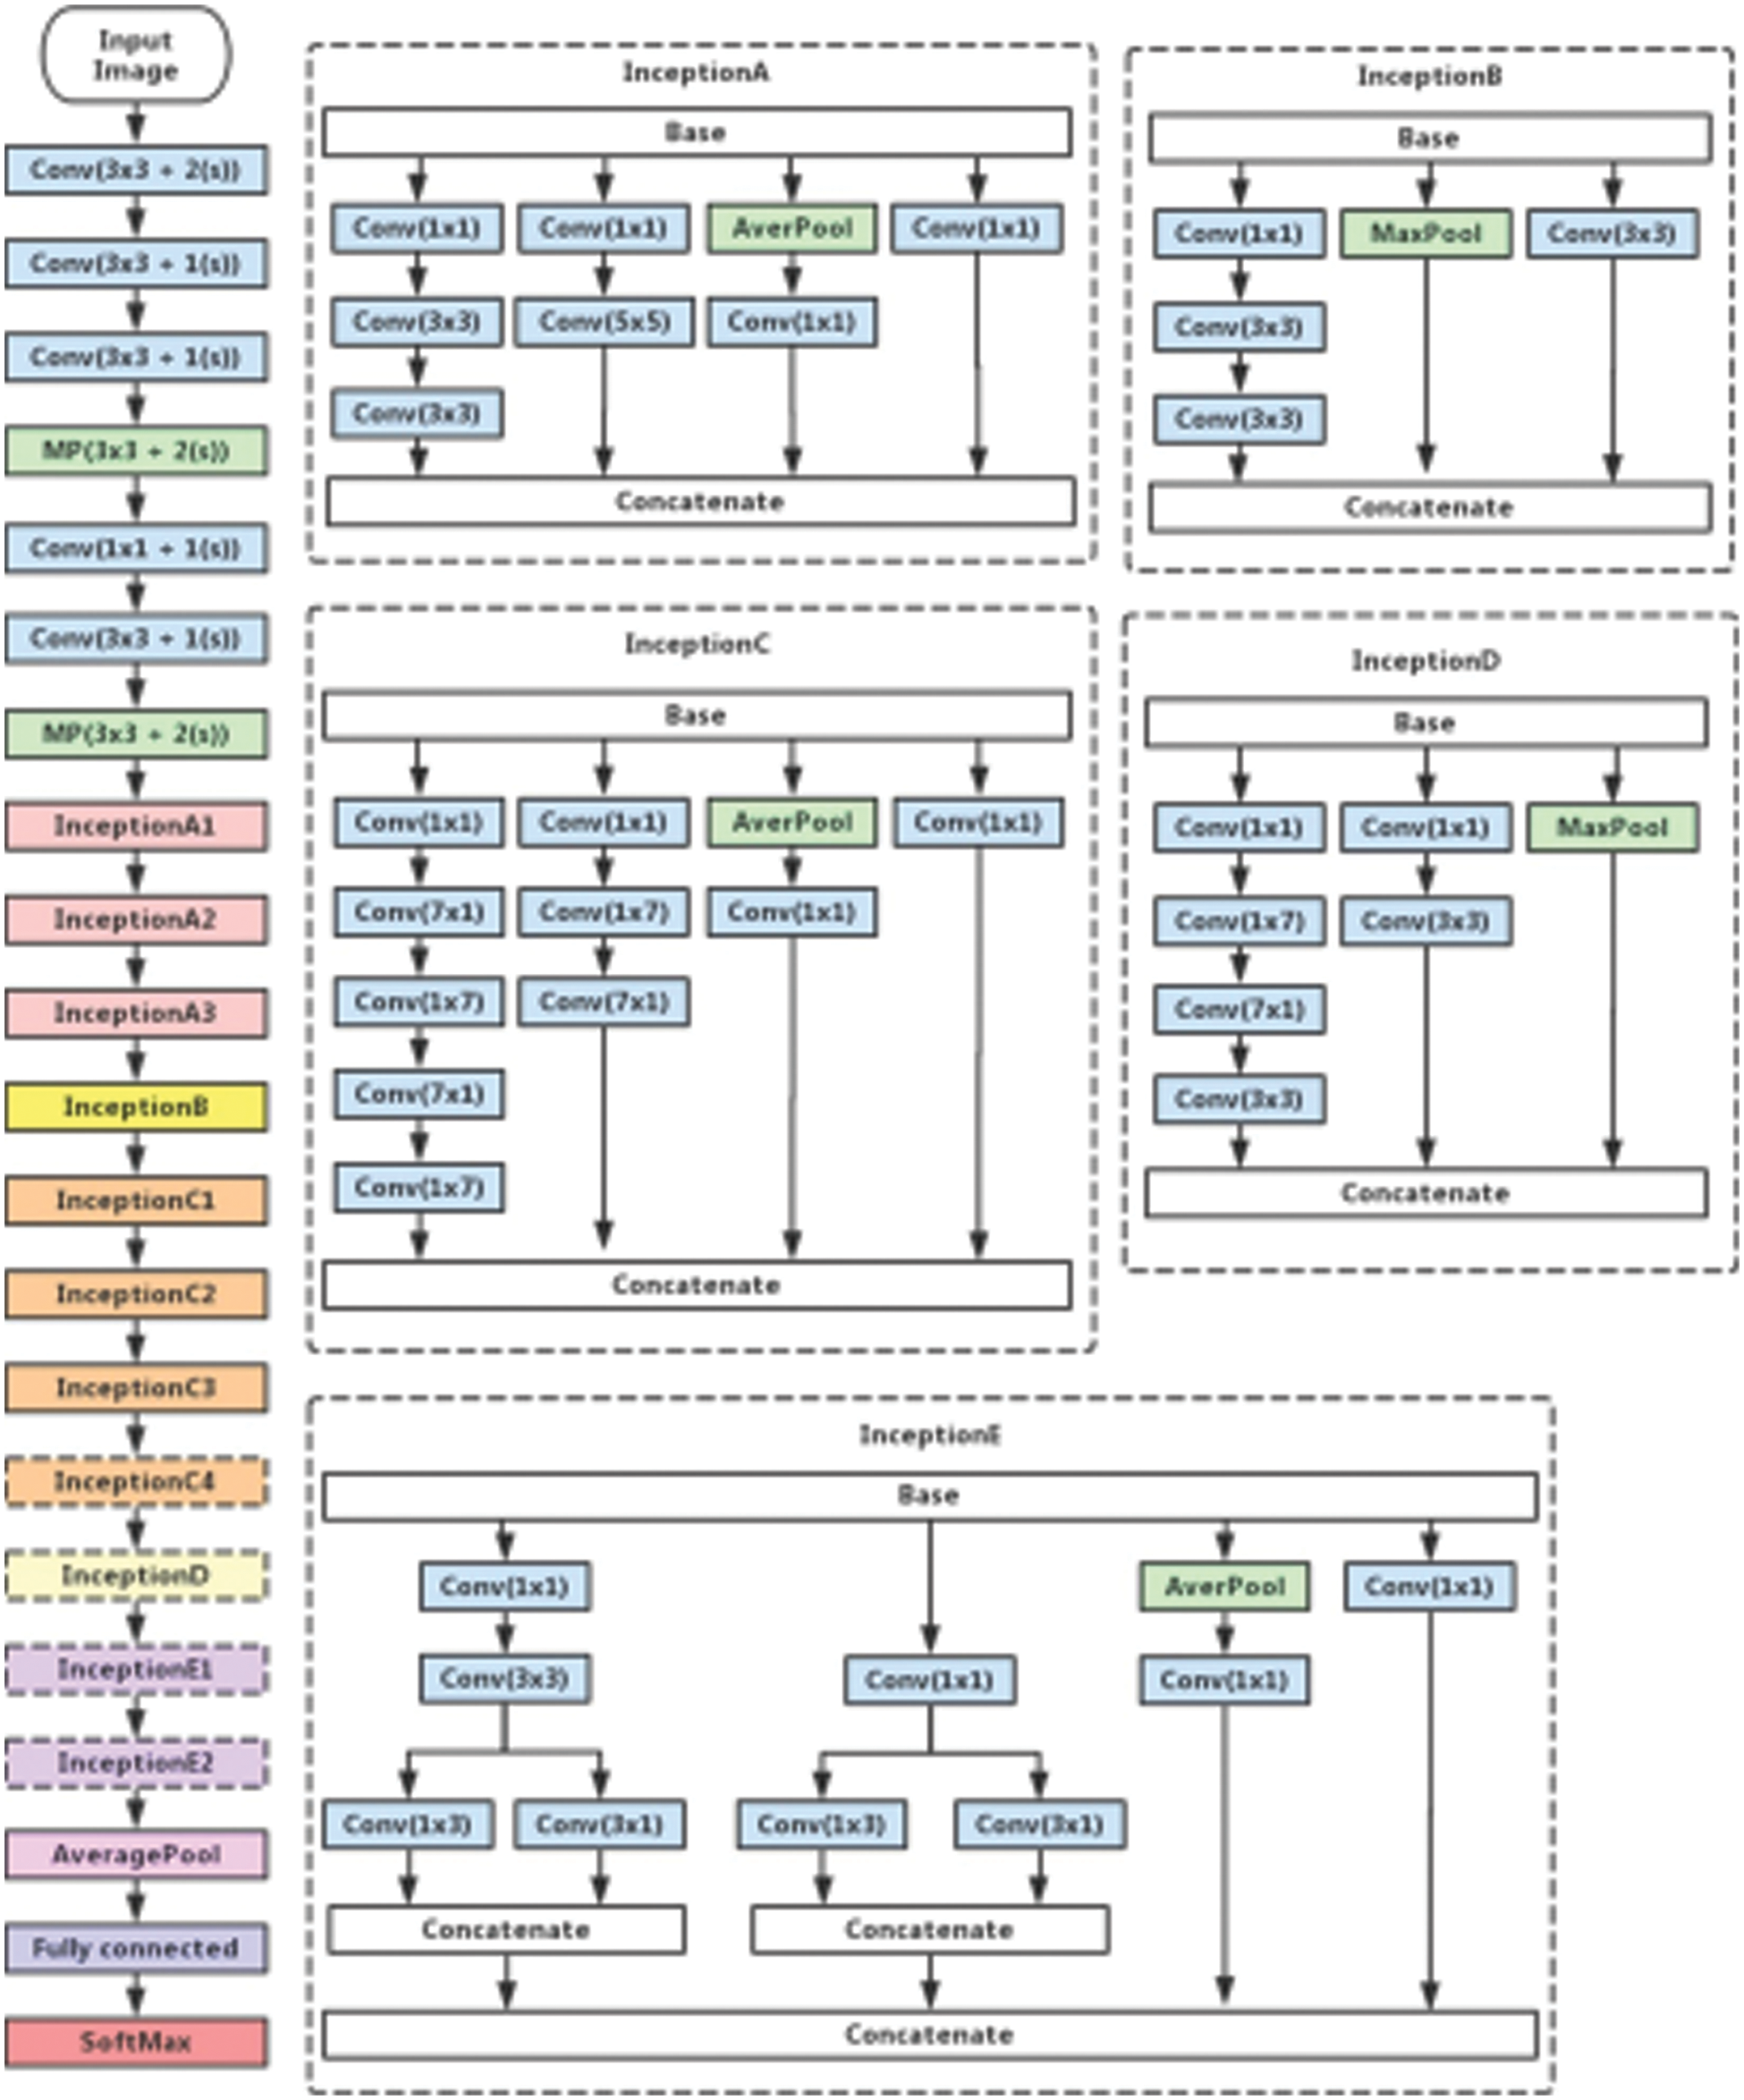
Figure 8: Inception v3–Detailed layer architecture
Experiments were conducted on the following datasets: CK+, In the Wild, and FER2013. These data sets have more than 800 video and image sequences from which a randomized sample of 80%–20% split is used for training and testing. The output of the training was classified into one among the 6 emotions: Angry (A), Disgust (D), Fear (F), Happy (H), Sad (S), Surprise (Su), and Neutral (N). The optical flow characteristics of the images are supplied as inputs to the CNN for training. The video dataset is split into frames and these images are analyzed for the micro expressions on the above categorical classes. The testing was done using the composite data files from In the Wild (ITW), FER 2013, and CK+ datasets. The network can correctly identify the apex frame, as shown in Fig. 9 for the corresponding facial emotion shown in Fig. 10, in which the micro expression is exhibited most of the time with higher levels of accuracy. Table 4 shown the magnitude for all the emotional values being registered.
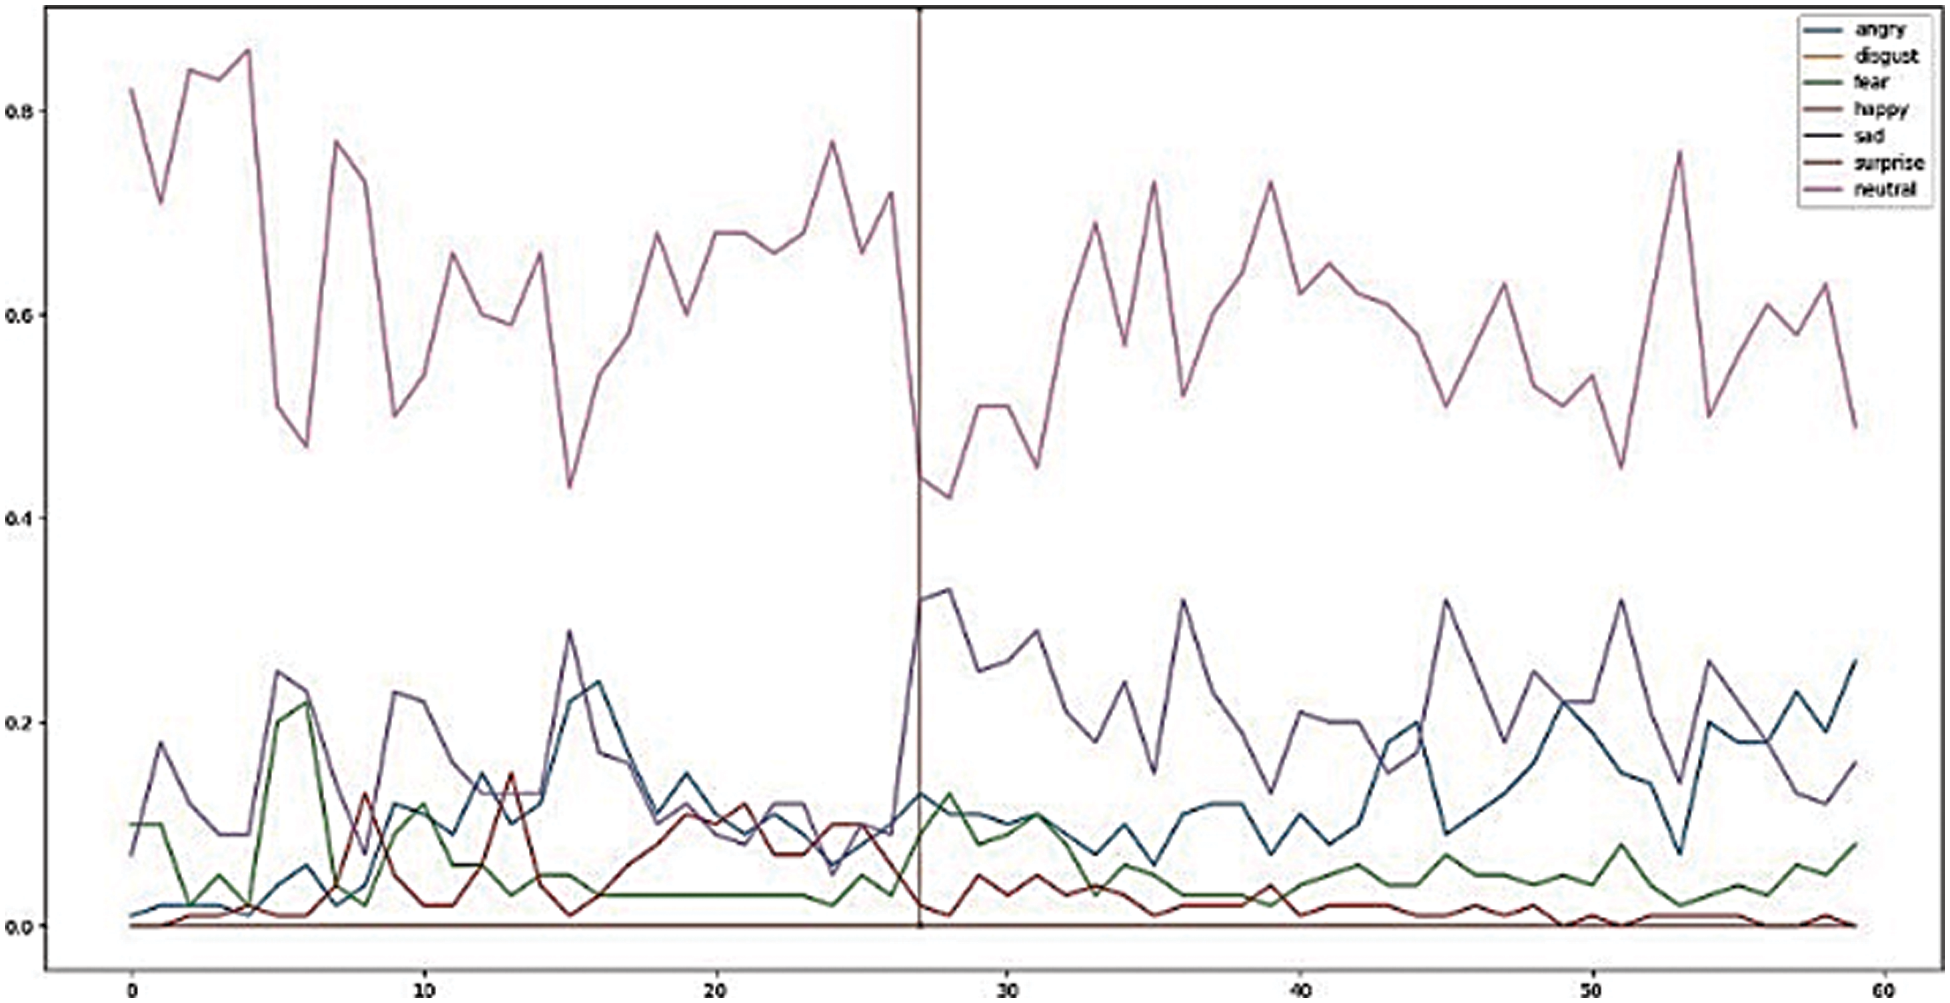
Figure 9: Various micro expressions on display at time, Tn
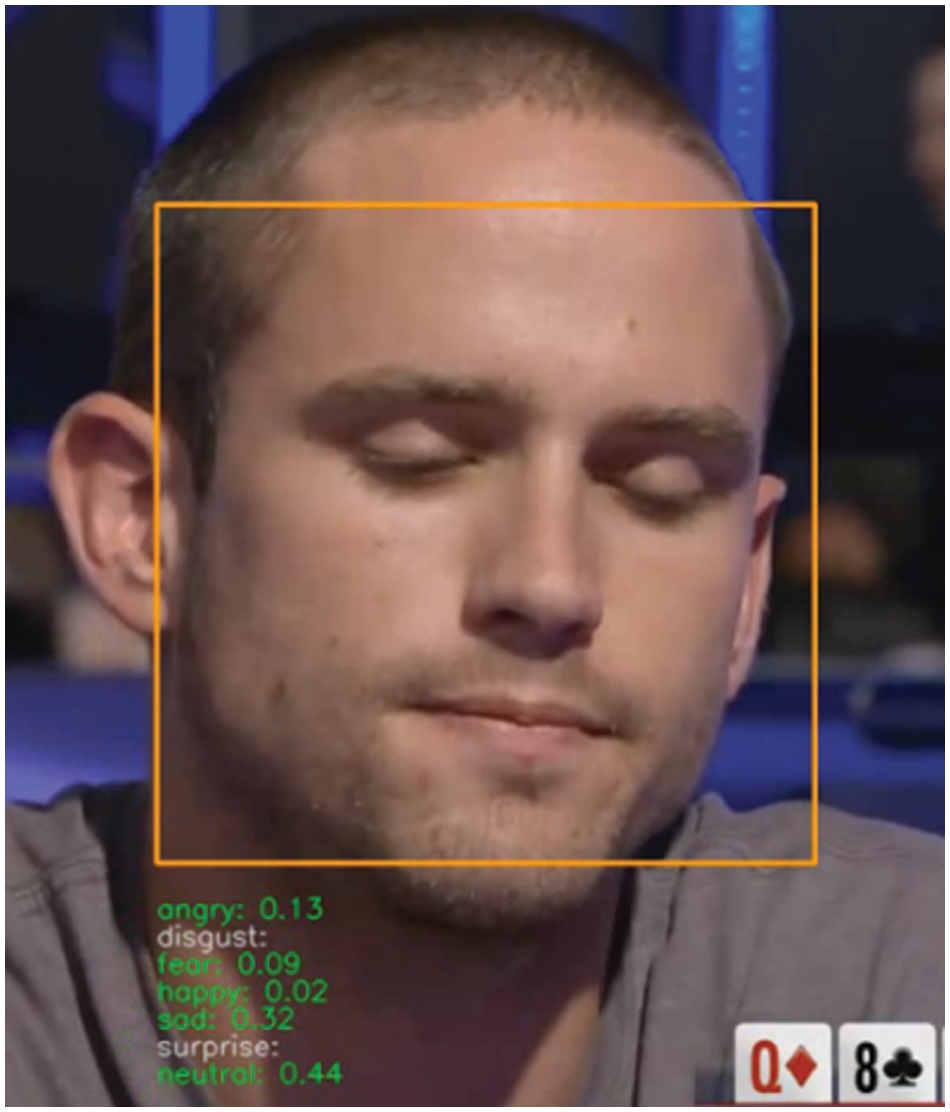
Figure 10: Micro expression on display and various magnitudes identified

The proposed approach was trained and evaluated on Nvidia GTX 1060 processor and also tested on the TPU architecture of the Google Cloud. The training and validation took approximately 28–30 s for each epoch on the local cluster. There were around 28,709 files that were trained and 7178 files that were tested for accuracy.
The model resulted in an overall training accuracy of more than 90% and an average validation accuracy of around 85% for the different classes of micro emotions being recognized after 20 epochs of training as depicted in Table 5. This is a significant improvement over the rest of the models being evaluated.

The maximum accuracy on the prior approach tends to be in the range of around 38%–64% [27,28]. The training accuracy of the model consistently increases over each epoch, and the validation accuracy closely follows the trend depicting that the model does not overfit the data, as shown in Figs. 11 and 12.
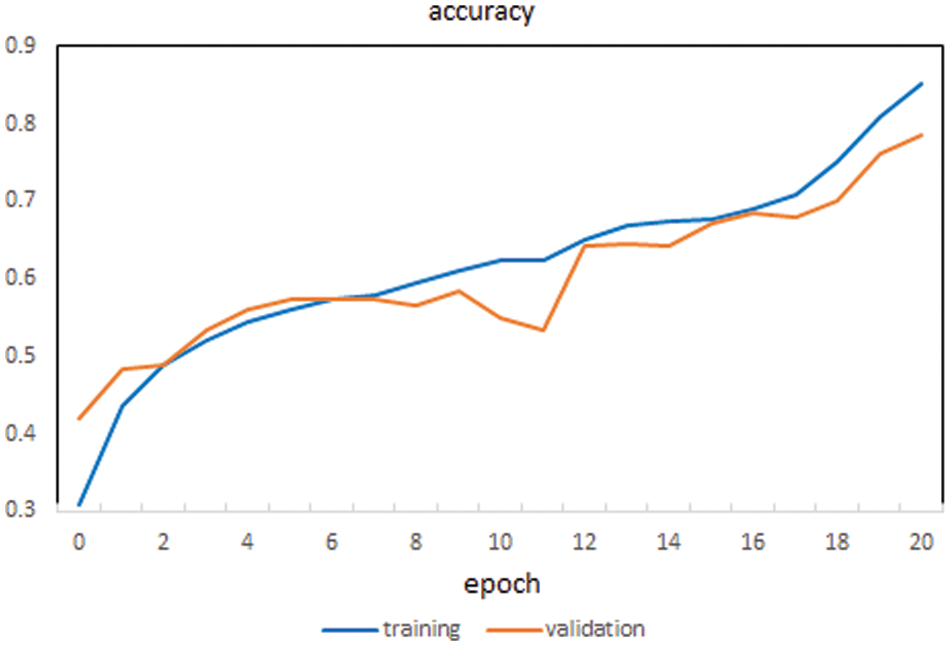
Figure 11: Accuracy of the proposed method
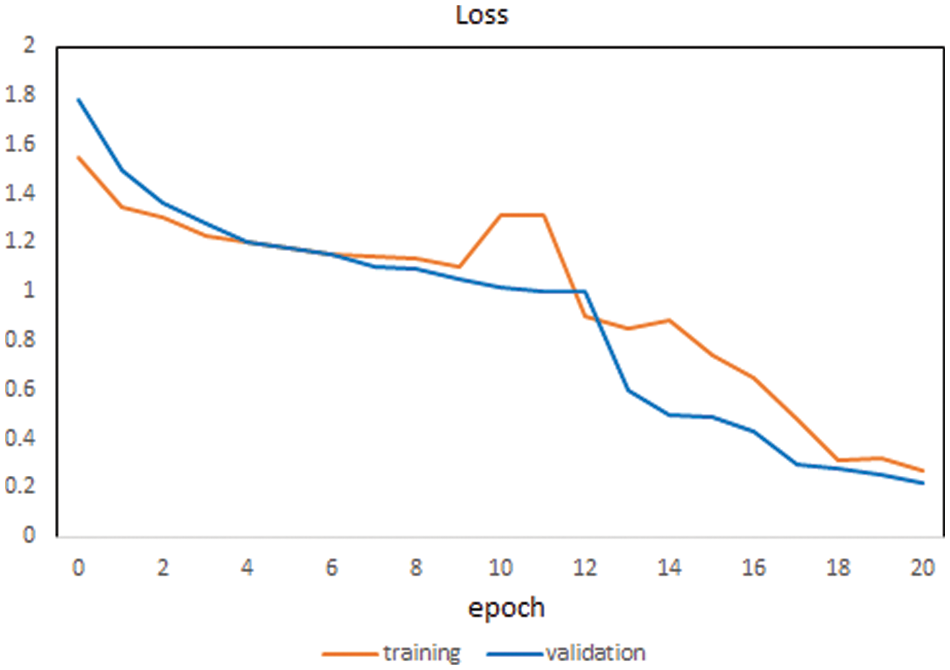
Figure 12: Loss of the proposed method for each epoch
At each epoch, the training & validation losses have also decreased as expected and result in the convergence of weights to best suit the learning parameters of the modeled neural network. The classification accuracy plot is created on the test data comparing the existing models to the proposed model to identify the instances of correctly classifying the different class assignments of the various categories of micro expressions, as displayed in Fig. 13.
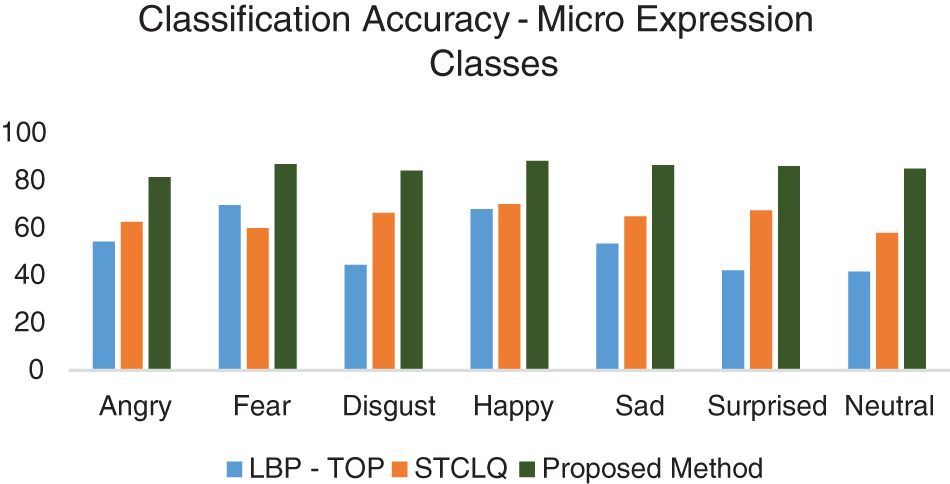
Figure 13: Classification accuracy of different methods
The main objective of the research is to improve the recognition and classification capacities of the Neural Network in the field of micro expression analysis. The challenges arise due to the very short duration of capturing the apex frames and the limited number of data sets available for training the network. The proposed model addresses these issues by providing a pre-processing stage by using additional learners in the form of boosting and swarm-based flow vector detection to simplify the functioning of the modified CNN kernel. This ultimately results in compensating the poor lighting conditions, variations in the orientation and topological morphologies in the facial structures, color and contrast variations, etc. The model is designed with low memory requirements and training time needed to optimize the CNN. The learning and convergence rates of the proposed architecture are pretty high, and the output in recognition rates is more accurate than the currently existing methods. The hyperparameters of the Deep Learning ConvNet can be tuned for good performance so that even real-time micro-expression analysis can be performed on live video feeds for real-time implementations. This presents a lot of applications for facial micro-emotion recognition in fields like detection of emotional intelligence, deep fake detections, medical research, market research surveys, job recruitments, and so on, and it is estimated that the technology has a market potential of $56 billion by the year 2024. The research can be further extended by involving audio elements in the training so that a more accurate model can be formed based on the context of the spoken word, correlated with the associated micro expressions displayed.
Funding Statement: The authors received no specific funding for this study.
Conflicts of Interest: The authors declare that they have no conflicts of interest to report regarding the present study.
References
1. P. Ekman, “Facial expression and emotion,” American Psychologist, vol. 48, no. 4, pp. 384–392, 1993. [Google Scholar] [PubMed]
2. Y. Tang, “Deep learning using linear support vector machines,” in Proc. Int. Conf. on Machine Learning 2013: Challenges in Representation Learning Workshop, Atlanta, Georgia, USA, pp. 1–18, 2013. [Google Scholar]
3. P. Husák, J. Cech and J. Matas, “Spotting facial micro-expressions in the wild,” in 22nd Computer Vision Winter Workshop, Retz, Austria, pp. 1–9, 2017. [Google Scholar]
4. K. Kulkarni, C. A. Corneanu, I. Ofodile, S. Escalera, X. Baro et al., “Automatic recognition of facial displays of unfelt emotions,” IEEE Transactions on Affective Computing, vol. 12, no. 2, pp. 377–390, 2018. [Google Scholar]
5. B. Allaert, I. M. Bilasco and C. Djeraba, “Micro and macro facial expression recognition using advanced local motion patterns,” IEEE Transactions on Affective Computing, vol. 13, no. 1, pp. 147–158, 2019. [Google Scholar]
6. D. Y. Choi and B. C. Song, “Facial micro-expression recognition using two-dimensional landmark feature maps,” IEEE Access, vol. 8, pp. 121549–121563, 2020. [Google Scholar]
7. Y. Li, X. Huang and G. Zhao, “Joint local and global information learning with single apex frame detection for micro-expression recognition,” IEEE Transactions on Image Processing, vol. 30, pp. 249–263, 2020. [Google Scholar] [PubMed]
8. T. Zhang, Y. Zong, W. Zheng, C. P. Chen, X. Hong et al., “Cross-database micro-expression recognition: A benchmark,” IEEE Transactions on Knowledge and Data Engineering, vol. 34, no. 2, pp. 544–559, 2020. [Google Scholar]
9. E. Pei, M. C. Oveneke, Y. Zhao, D. Jiang and H. Sahli, “Monocular 3D facial expression features for continuous affect recognition,” IEEE Transactions on Multimedia, vol. 23, pp. 3540–3550, 2020. [Google Scholar]
10. B. Sun, S. Cao, D. Li, J. He and L. Yu, “Dynamic micro-expression recognition using knowledge distillation,” IEEE Transactions on Affective Computing, vol. 13, no. 2, pp. 1037–1043, 2020. [Google Scholar]
11. S. K. Jarraya, M. Masmoudi and M. Hammami, “Compound emotion recognition of autistic children during meltdown crisis based on deep spatio-temporal analysis of facial geometric features,” IEEE Access, vol. 8, pp. 69311–69326, 2020. [Google Scholar]
12. Y. Zhang, H. Jiang, X. Li, B. Lu, K. M. Rabie et al., “A new framework combining local-region division and feature selection for micro-expressions recognition,” IEEE Access, vol. 8, pp. 94499–94509, 2020. [Google Scholar]
13. C. Dalvi, M. Rathod, S. Patil, S. Gite and K. Kotecha, “A survey of AI-based facial emotion recognition: Features, ML & DL techniques, age-wise datasets and future directions,” IEEE Access, vol. 9, pp. 165806–165840, 2021. [Google Scholar]
14. X. Ben, Y. Ren, J. Zhang, S. J. Wang and K. Kpalam, “Video-based facial micro-expression analysis: A survey of datasets, features and algorithms,” IEEE Transactions Pattern Analysis and Machine Intelligence, vol. 44, no. 9, pp. 1–16, 2021. [Google Scholar]
15. S. J. Wang, Y. He, J. Li and X. Fu, “MESNet: A convolutional neural network for spotting multi-scale micro-expression intervals in long videos,” IEEE Transactions on Image Processing, vol. 30, pp. 3956–3969, 2021. [Google Scholar] [PubMed]
16. J. Li, Z. Dong, S. Lu, S. J. Wang, W. J. Yan et al., “CAS(ME)3: A third generation facial spontaneous micro-expression database with depth information and high ecological validity,” IEEE Transactions on Pattern Analysis and Machine Intelligence, Early Access, pp. 1–18, 2022. [Google Scholar]
17. J. Shi, S. Zhu and Z. Liang, “Amending facial expression representation via de-albino,” in Proc. 41st Chinese Control Conf. (CCC), Hefei, China, pp. 6267–6272, 2022. [Google Scholar]
18. P. Lucey, J. F. Cohn, T. Kanade, J. Saragih, Z. Ambadar et al., “The extended Cohn-Kanade dataset (CK+A complete dataset for action unit and emotion-specified expression,” in Proc. IEEE Computer Society Conf. on Computer Vision and Pattern Recognition, San Francisco, CA, USA, pp. 94–101, 2010. [Google Scholar]
19. L. Zhang and O. Arandjelović, “Review of automatic microexpression recognition in the past decade,” Machine Learning and Knowledge Extraction, vol. 3, no. 2, pp. 414–434, 2021. [Google Scholar]
20. O. A. Hassen, N. Azman Abu, Z. Zainal Abidin and S. M. Darwish, “Realistic smile expression recognition approach using ensemble classifier with enhanced bagging,” Computers, Materials & Continua, vol. 70, no. 2, pp. 2453–2469, 2022. [Google Scholar]
21. O. A. Hassen, N. A. Abu, Z. Z. Abidin and S. M. Darwish, “A new descriptor for smile classification based on cascade classifier in unconstrained scenarios,” Symmetry, vol. 13, no. 5, pp. 1–18, 2021. [Google Scholar]
22. H. M. Hang, Y. M. Chou and S. C. Cheng, “Motion estimation for video coding standards,” Journal of VLSI Signal Processing Systems for Signal, Image and Video Technology, vol. 17, no. 2, pp. 113–136, 1997. [Google Scholar]
23. H. Pan, L. Xie, Z. Wang, B. Liu, M. Yang et al., “Review of micro-expression spotting and recognition in video sequences,” Virtual Reality & Intelligent Hardware, vol. 3, no. 1, pp. 1–17, 2021. [Google Scholar]
24. E. A. Clark, J. N. Kessinger, S. E. Duncan, M. A. Bell, J. Lahne et al., “The facial action coding system for characterization of human affective response to consumer product-based stimuli: A systematic review,” Frontiers in Psychology, vol. 11, pp. 920, 2020. [Google Scholar] [PubMed]
25. Y. Sato, Y. Horaguchi, L. Vanel and S. Shioiri, “Prediction of image preferences from spontaneous facial expressions,” Interdisciplinary Information Sciences, vol. 28, no. 1, pp. 45–53, 2022. [Google Scholar]
26. C. Szegedy, V. Vanhoucke, S. Ioffe, J. Shlens and Z. Wojna, “Rethinking the inception architecture for computer vision,” in Proc. of the IEEE Conf. on Computer Vision and Pattern Recognition, Las Vegas, USA, pp. 2818–2826, 2016. [Google Scholar]
27. Q. Ji, J. Huang, W. He and Y. Sun, “Optimized deep convolutional neural networks for identification of macular diseases from optical coherence tomography images,” Algorithms, vol. 12, no. 3, pp. 51, 2019. [Google Scholar]
28. D. Patel, X. Hong and G. Zhao, “Selective deep features for micro-expression recognition,” in Proc. Int. Conf. on Pattern Recognition (ICPR), Cancun, Mexico, pp. 2258–2263, 2016. [Google Scholar]
Cite This Article
 Copyright © 2023 The Author(s). Published by Tech Science Press.
This work is licensed under a Creative Commons Attribution 4.0 International License , which permits unrestricted use, distribution, and reproduction in any medium, provided the original work is properly cited.


 Submit a Paper
 Propose a Special lssue
 View Full Text
 Download PDF
 Downloads
 Citation Tools