
 Submit a Paper
 Propose a Special lssue
 Open Access
ARTICLE

Machine Learning for Detecting Blood Transfusion Needs Using Biosignals
1 Department of Biomedical Engineering, College of Electronics and Information, Kyung Hee University, Yongin, 17104, Korea
2 Department of Internal Medicine, Wonkwang University School of Medicine, Iksan, 54538, Korea
3 Department of Trauma Surgery, Jeju Regional Trauma Center, Cheju Halla General Hospital, Jeju, 63127, Korea
4 Department of Computer Science and Engineering, Soonchunhyang University, Asan, 31538, Korea
5 Department of Biomedical Systems Informatics, Yonsei University College of Medicine, Yongin, 03722, Korea
* Corresponding Author: Jinseok Lee. Email:
Computer Systems Science and Engineering 2023, 46(2), 2369-2381. https://doi.org/10.32604/csse.2023.035641
Received 29 August 2022; Accepted 08 December 2022; Issue published 09 February 2023
 View Full Text
 Download PDF
Abstract
Adequate oxygen in red blood cells carrying through the body to the heart and brain is important to maintain life. For those patients requiring blood, blood transfusion is a common procedure in which donated blood or blood components are given through an intravenous line. However, detecting the need for blood transfusion is time-consuming and sometimes not easily diagnosed, such as internal bleeding. This study considered physiological signals such as electrocardiogram (ECG), photoplethysmogram (PPG), blood pressure, oxygen saturation (SpO2), and respiration, and proposed the machine learning model to detect the need for blood transfusion accurately. For the model, this study extracted 14 features from the physiological signals and used an ensemble approach combining extreme gradient boosting and random forest. The model was evaluated by a stratified five-fold cross-validation: the detection accuracy and area under the receiver operating characteristics were 92.7% and 0.977, respectively.Keywords
Blood volume, hematological values, and immune systems vary depending on various clinical situations, which change the response to hypovolemia or hypoxia situations [1]. Thus, blood transfusion must be carefully determined between its benefits and risks. For example, in adults, if the hemoglobin level decreases below 10 g/dL, an increase in cardiac output or redistribution in the organ may occur to improve oxygen transport capacity. In addition, it is known that the frequency and type of transfusion abnormalities that may occur during the transfusion process are different due to differences in underlying diseases [1,2]. According to the report from Korean Blood Safety Monitoring System in 2021 [3], a total of 2,847 blood transfusion-related symptoms were reported; 1,675 cases of febrile non-hemolytic transfusion reaction (FNHTR), 761 cases of an allergic reaction, 58 cases of transfusion-associated dyspnea, 37 cases of transfusion-associated hypotensive reaction, 18 cases of transfusion-associated circulator overload, three cases of post-transfusion purpura, two cases of acute hemolytic transmission reaction, two cases of transfusion-related acute lung injury, and one case of a delayed serologic transfusion reaction. The FNHTR and allergic reaction accounted for 85.6% of all blood transfusion-related symptoms.
Especially for trauma patients, blood transfusion is one of the critical management [4]. Pre-transfusion testing is essential for safe blood transfusion, but in situations such as severe trauma or massive bleeding, a delay in blood delivery in minutes has a specificity that causes sesecvere consequences for patients. In these emergency cases, even if some pre-transfusion tests are omitted, the risk of delayed blood transfusion and omission of pre-transfusion tests are comprehensively considered as they may benefit the patients [5]. Therefore, the recipient’s vital sign is monitored during pre- and post-transfusion in trauma patients with suspected or confirmed bleeding and used as a basis for evaluating the transfusion-related adverse reaction. Most studies associated with variations of vital signs by transfusion in previously published studies were case reports of non-traumatic subjects or numerical values, including systolic blood pressure, diastolic pressure, pulse rate, and temperature recorded in the monitor device [6–8]. Furthermore, several studies have been conducted to detect blood transfusion, but most were limited to patients with gastrointestinal bleeding or bleeding as a complication after specific surgery [9–11]. The numeric data is less continuous, and the difference in measurement intervals for each study utilized is bound to include bias.
Recently, various studies have been conducted on the detection of hypovolemia [12–15]. A few studies detected blood loss based on photoplethysmogram (PPG) waveforms via time-frequency spectral analysis [12–14]. Another study detected surgical blood loss based on PPG waveforms and arterial blood pressure (ABP) [15]. However, the previous studies collected data from anesthetized animals from bleeding protocol or patients in a controlled environment rather than the actual bleeding or transfusion. Machine learning is a very powerful utility for automating various decision-making tasks. Machine learning models are now widely used in various fields, including authentication mechanisms, drug response models, diagnosis, data prediction, and a broad range of medical applications [16–21]. Especially, machine learning in healthcare helps to simplify complicated diagnosis procedures. Given the lack of data on changes in vital signs before and after blood transfusion, this study aims to collect the physiological signals from blood transfusion patients in the trauma intensive care unit (TICU) and to develop a machine learning model to detect the need for blood transfusion. For the signals, this study considered electrocardiogram (ECG) waveform, PPG waveform, the values of diastolic, systolic, and mean blood pressure, oxygen saturation (SpO2) value, and mean respiration. In addition, this study extracted 14 features from the physiological signals for the machine learning model inputs.
The main contributions of this study can be summarized as follows. First, this study collected 40 blood transfusion patients based on a prospectively built TICU registry. Because it is difficult to acquire physiological signals from patients in need of blood transfusion in the TICU, related studies have not been actively conducted. The patient data were collected for four years (2019 to 2022) for this study. Second, this study considered a variety of physiological signals for detecting blood transfusion needs. Last, this study performed the feature importance analysis indicating the order of importance among the features.
The rest of the paper is organized as follows. Section 2 describes patient data, feature extraction from physiological signals, and the proposed ensemble approach. Section 3 presents the results of the ranked feature importance and cross-validation results. In Section 4, the result interpretation and discussion are presented. Finally, in Section 5, this study concludes the paper with a summary and addresses future work.
This study was approved by the institutional review board from Wonkwang University Hospital (WKHU), Iksan, Korea (IRB No. 2020–12-024). This study waived the requirement for informed consent as it used only deidentified data retrospectively collected as part of clinical practice. All methods were performed by relevant guidelines and regulations.
Fig. 1 depicts a flowchart for the development and evaluation processes of the machine model to detect the need for blood transfusion. First, this study considered the inputs as physiological signals and collected the data in WHKU. The data were waveforms and numeric data. Subsequently, the features were extracted from the data collected for machine learning model input variables. Thereupon, the five different machine learning models were developed, after which the models were evaluated using cross-validation.
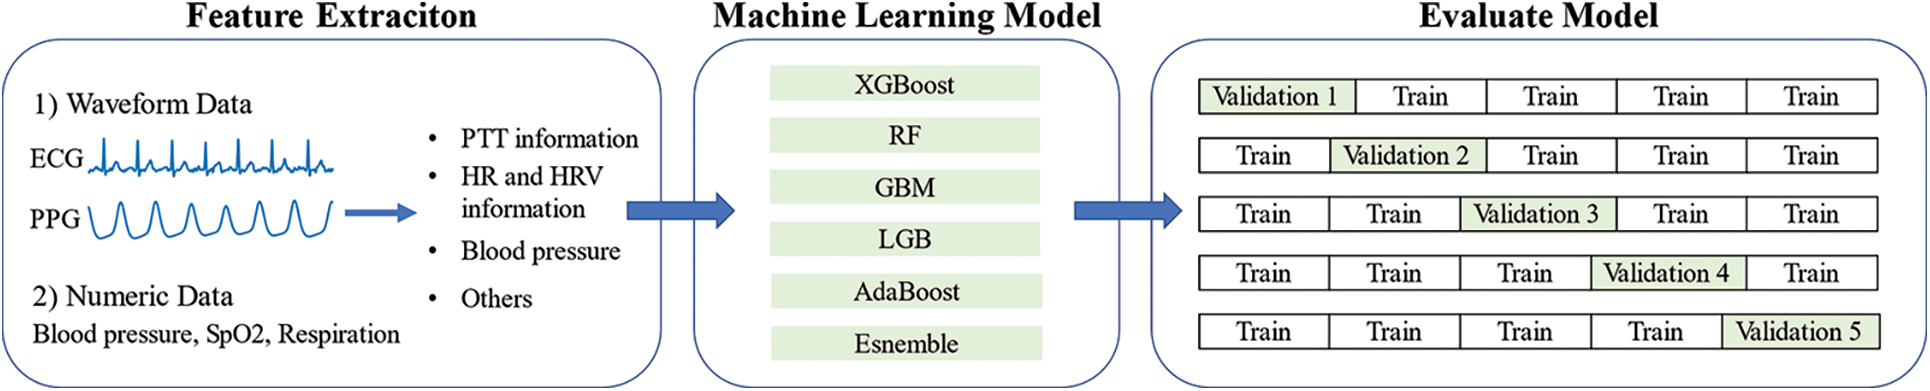
Figure 1: Development and evaluation processes of the machine learning model to detect the need for blood transfusion
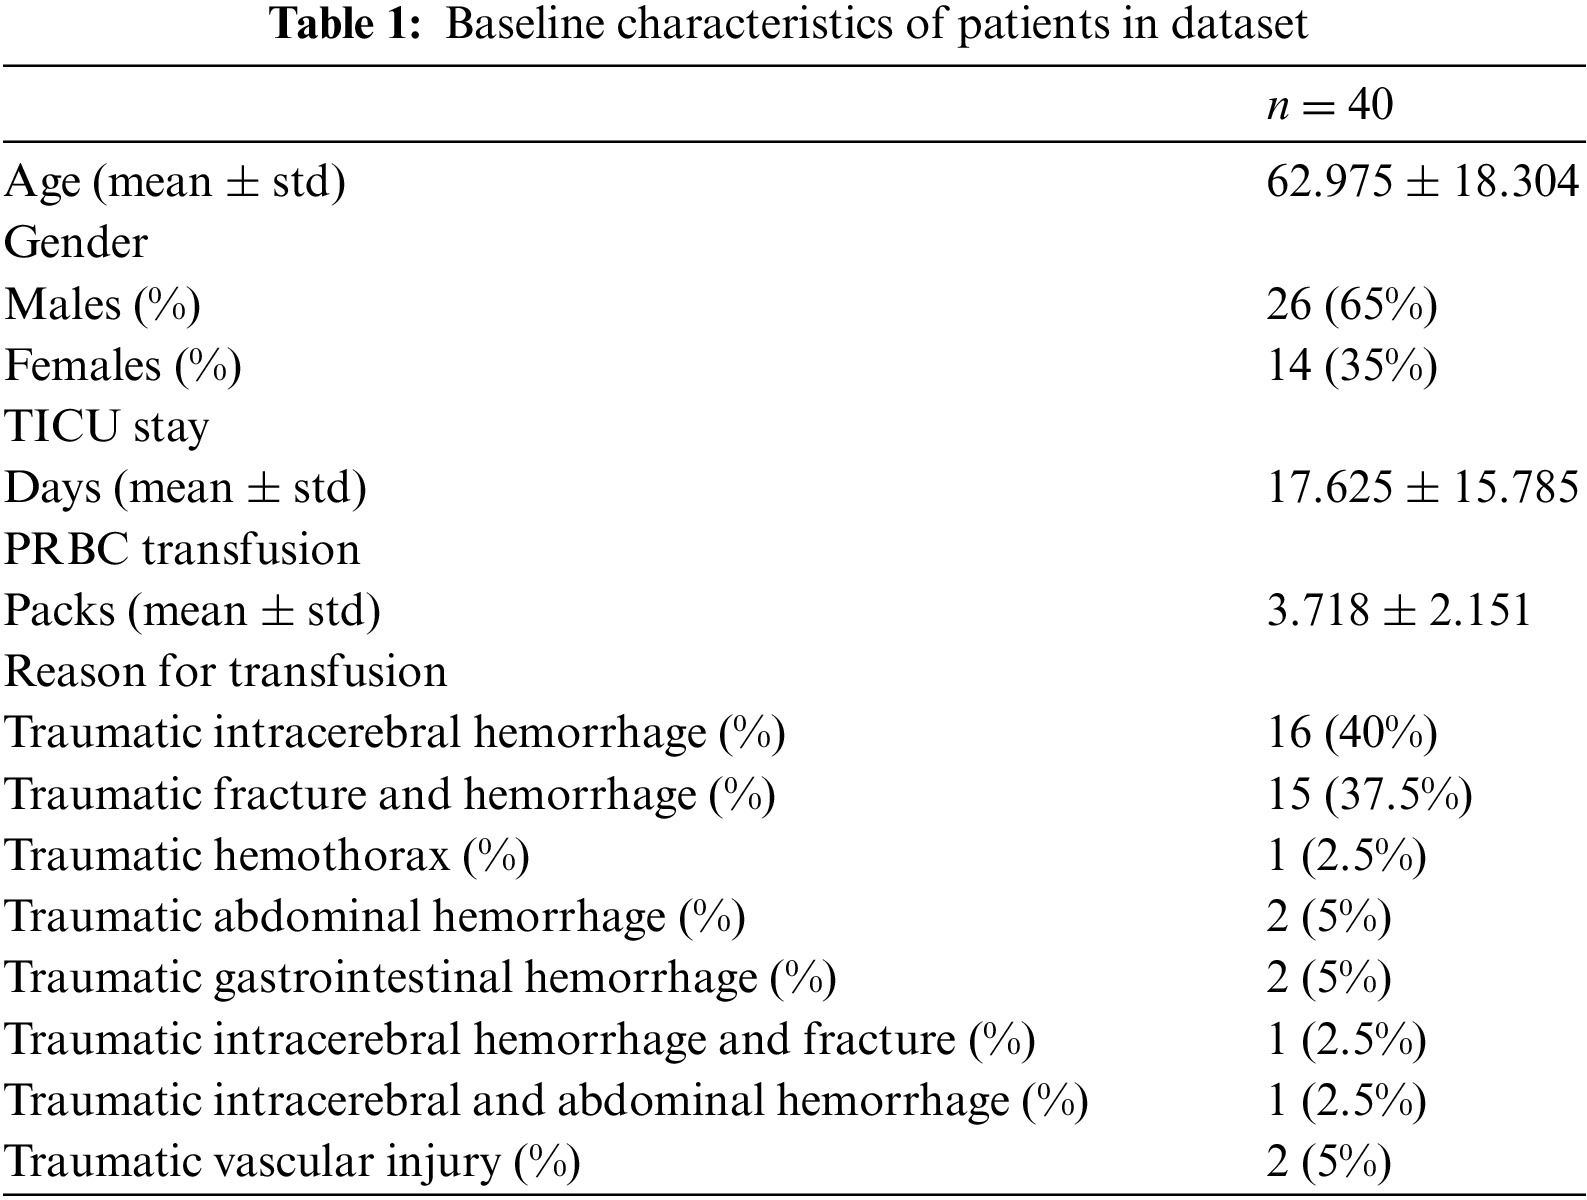
This study has collected TICU patient data from 2019 to 2022 in WKHU. The patient data includes real-time ECG and PPG waveforms, blood pressure, respiration, and SpO2. The patient data were collected using Nihon Kohden and Philips devices in the TICU. The device yields numerical data (heart rate, respiration, SpO2), and the other one produces waveform data, including ECG, PPG, and blood pressure readings. This study measured the numerical data at 1-min intervals and collected waveform data at 250 Hz. For the machine learning model to detect the need for blood transfusion, this study considered the patients who received two units or more of packed red blood cells (PRBCs) after admission to the TICU. Typically, one unit of PRBCs is approximately 350 mL in volume, of which red blood cell (RBC) volume is 200 to 250 mL [6]. Initially, this study collected 727 patients and considered 40 patients satisfying the criteria. The reasons for the blood transfusions are traumatic intracerebral hemorrhage, traumatic fracture and hemorrhage, traumatic hemothorax, traumatic abdominal hemorrhage, traumatic gastrointestinal hemorrhage, traumatic intracerebral hemorrhage and fracture, traumatic intracerebral and abdominal hemorrhage, and traumatic vascular injury. The average values of TICU stay and the units of PRBC were 17.625 days and 3.718 units, respectively. The patient information, including age, gender, PRBC transfusion volume, and reasons for transfusion, is summarized in Table 1. The mean of PRBC transfusion was 3.718 on average. The transfusion reasons were classified into eight categories. The most common cause of transfusion was traumatic intracerebral hemorrhage (n = 16). The following common cause was traumatic fracture and hemorrhage (n = 15). The other causes of transfusion were traumatic hemothorax (n = 1), abdominal hemorrhage (n = 2), gastrointestinal hemorrhage (n = 2), intracerebral hemorrhage and fracture (n = 1), intracerebral and abdominal hemorrhage (n = 1), and vascular injury (n = 1).
For the forty patient’s data, this study divided them into pre- and post-blood transfusion groups. For the pre-blood transfusion group, 30-min data measured one hour after admission to the TICU were used. For the post-blood transfusion group, 30-min data measured one hour before discharge from the TICU were used. Fig. 2 illustrates the data grouping for pre- and post-blood transfusion.
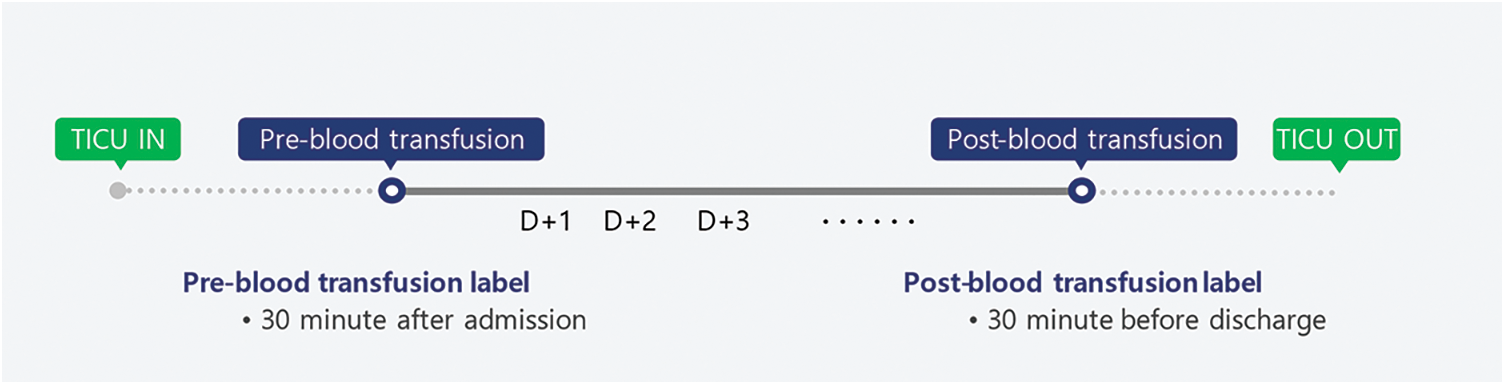
Figure 2: Data grouping for pre- and post-blood transfusion
The 30-min data includes ECG waveform, PPG waveform, blood pressure, respiration, and SpO2. In this study, each 30-min data was segmented into 30 1-min segments. Then, 1,200 pre-blood transfusion segments and 1,200 post-blood transfusion segments were finally obtained for training and testing machine learning models. Then, each segment includes seven 1-min vital sign data: 1-min ECG waveform, 1-min PPG waveform, the values of diastolic, systolic, and mean blood pressure (mmHg), mean SpO2 (%) and mean respiration (per minute).
Given the physiological signals of ECG waveforms, PPG waveforms, non-invasive blood pressure (NIBP) values, SpO2 values, and respiration values, this study extracted 14 features for the inputs of machine learning models. The 14 features include four pulse transit time (PTT) related features from ECG and PPG waveforms, four heart rate variability (HRV) related features from ECG waveforms, three BP-related features from NIBP, and three additional features from PPG, SpO2, and respiration. More specifically, this study first extracted four features from 1-min ECG and PPG waveforms: mean of PTT-peak (mPTT-peak), variance of PTT-peak (vPTT-peak), mean of PTT-foot (mPTT-foot), variance of PTT-foot (vPTT-foot) and variance of PPG peak amplitudes (vPPG-amp). Fig. 3 illustrates the five extracted features from 1-min ECG and PPG waveforms. PTT is the time measured for the arterial pulse pressure wave to travel from the aortic valve to a peripheral site [21–23]. The mPTT-peak represents the mean time interval between the R-peak of ECG and the pulse peak of PPG. Similarly, the vPTT-peak represents the variance of time intervals between the R-peak of ECG and the pulse peak of PPG. The mPTT-foot represents the mean time interval between the R-peak of ECG and the pulse foot of PPG. Similarly, the vPTT-foot represents the variance of time intervals between the R-peak of ECG and the pulse foot of PPG. For the vPPG-amplitude, the amplitude was defined as the difference between the pulse peak and pulse foot within a cardiac cycle.
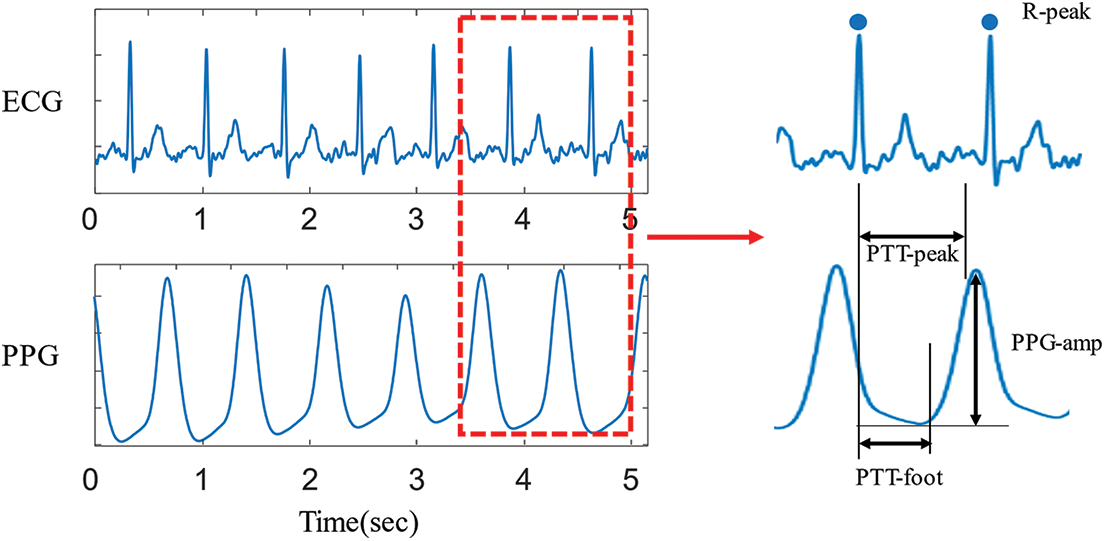
Figure 3: Extracted four features from ECG and PPG waveforms
Second, this study extracted four features regarding HR and HRV features from a 1-min ECG waveform: mean HR (mHR), HRV metrics using a standard deviation of normal-to-normal (NN) intervals (HRV-SDNN), HRV metrics using root mean squared successive difference (HRV-RMSSD), and HRV metrics using a ratio of low frequency to high-frequency power (HRV-LF/HF). HRV is one of the non-invasive methods to analyze the balance of sympathetic and parasympathetic activities [24,25]. In addition, a few studies found that HRV is also associated with thalassemia, a blood disorder that causes the body to have less hemoglobin than normal [21,26,27]. For the features of the HRV time domain, this study used HRV-SDNN and HRV-RMSSD, which reflect the beat-to-beat variance in HR and are widely used time domain measures to estimate the vagally mediated changes reflected in HRV. The HRV-SDNN was calculated with a standard deviation of all the NN intervals for each 1-min segment. The HRV-RMSSD was calculated with the root mean square of successive differences between NN intervals. For the features of the HRV frequency domain, this study used HRV-LF/HF indicating the amount of sympathovagal modulation of the instantaneous heart rates [22,25]. Frequency-domain HRV analysis utilizes a power spectral density curve and provides basic information on power distribution across frequencies. In this study, the LF was calculated with the total spectral power of all RR intervals with frequencies ranging from 0.04 to 0.15 Hz, and the HF was calculated with the total spectral power of all RR intervals with frequencies ranging from 0.15 to 0.4 Hz. The low ratio reflects parasympathetic dominance while the high ratio reflects sympathetic dominance.
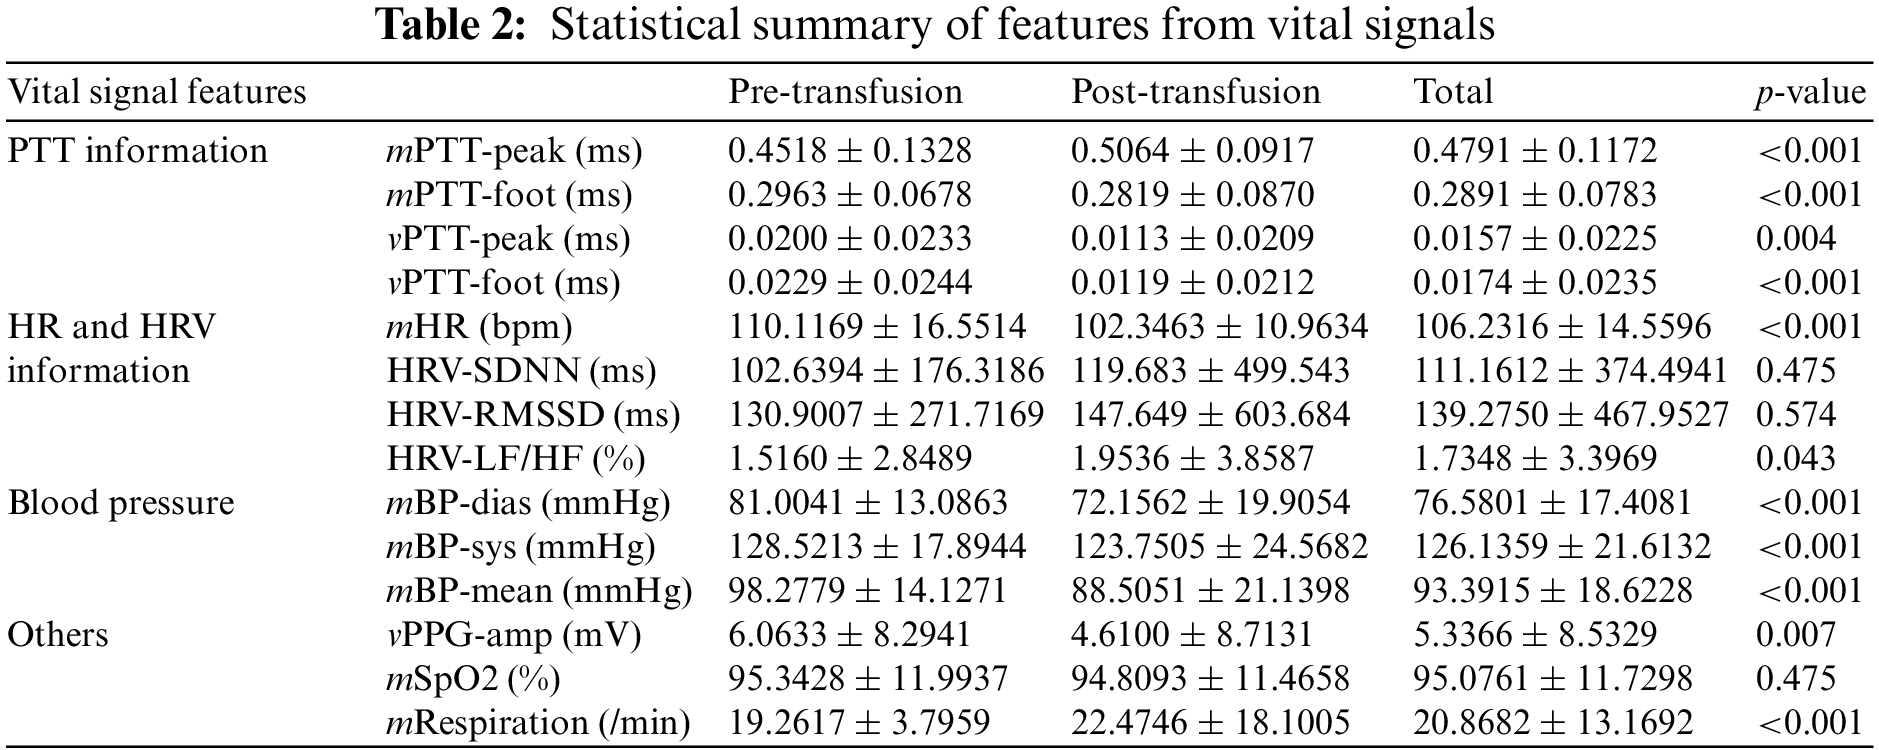
Third, this study extracted three features from NIBP: mean diastolic BP (mBP-dias), mean systolic BP (mBP-sys), and mean of mean arterial BP (mBP-mean). A few studies observed that BP is associated with transfusion [23,28]. Last, this study considered the variance of PPG amplitudes (vPPG-amp), mean of SpO2 level (mSpO2), and mean respiration. The full 14 input features and their statistical summary is presented in Table 2.
2.4 Model Training and Cross-Validation
Based on the 14 extracted features, this study first performed data standardization, a common requirement for training data for machine learning algorithms. The standardization changes the data distribution of each variable with a mean of zero and a standard deviation of one using the equation:
where mean(train) and SD(train) are the mean and standard deviation of each variable in the training dataset, respectively.
This study proposed an ensemble approach combining extreme gradient boosting (XGBoost) [29] and random forest (RF) [30] for detecting the need for blood transfusion. For the model selection, this study separately trained XGBoost, RF, gradient boosting machine (GBM) [31], light gradient boosting machine (LGB) [32], and adaptive boosting (Adaboost) [33], and found the best hyperparameters. Subsequently, this study selected the top three models and investigated all combination models. Thereafter, this study chose the XGBoost-RF combination, which outcomes are with soft voting. For training and evaluation, this study used a grid search approach. The data set (n = 2,400) was randomly shuffled and partitioned into five equal folds in a stratified manner. Of the five-folds, a single fold was retained as the validation data set for testing the model, and the remaining four folds were used as the training data set. The process was then repeated five times, with each of the five folds used exactly once as the validation data. In the model using XGBoost, the optimal hyperparameters were the maximum depth of 10, the learning rate of 0.1, and the number of tree estimators of 50. For random forest, the optimal hyperparameters were the number of tree estimators of 50, the learning rate of 0.1, the maximum depth of 10, and balanced class weights. The implementation and analysis of the machine learning models were performed using NumPy (version 1.17), Scikit-learn (version 0.24.2), Pandas (version 0.24.2), Matplotlib (version 3.1.0), XGBoost (version 0.90), and LightGBM (version 3.3.0). For training the data, this study used a machine equipped with an intel core i5 8400 octa-core, DDR4 32 GB RAM, and NVIDIA GeForce GTX 1080 Ti 11 GB GPU.
To evaluate the performance of our model for detecting pre-blood transfusion, this study used accuracy metrics of sensitivity, specificity, accuracy, recall, precision, and F1 score. TP represents the samples belonging to this class and correctly classified; TN represents the samples belonging to the class and misclassified; FP represents the sample that does not belong to the class and is classified as the class; FN represents samples that do not belong to the class and are classified as not belonging to the class. The sensitivity confirms that a prediction is positive and the subject requires blood transfusion (positive). The specificity confirms that a prediction is negative, and the subject does not need blood transfusion. The accuracy is the percentage of test samples correctly classified by the model. The precision is calculated by dividing the true positives by the samples that were predicted as positives. This study also included an F1 score in computing the harmonic mean of two scores to reflect the trade-off between precision and sensitivity. Based on these components, the following metrics can be calculated:
In addition, this study used the area under the receiver operating characteristics (AUROC). The receiver operating characteristic (ROC) expresses the relationship between sensitivity and one minus specificity. AUROC value is calculated from the area under the ROC curve.
3.1 Stratified K-Fold Cross-Validation Results
Table 3 summarizes the stratified cross-validation results with comparison. Based on the stratified five-fold cross-validation, our proposed model shows a sensitivity of 0.920 ± 0.010, a specificity of 0.934 ± 0.028, an accuracy of 0.927 ± 0.012, a precision of 0.933 ± 0.031, an F1-score 0.926 ± 0.013 and an AUROC of 0.977 ± 0.004. From the single model results from XGBoost, RF, GBM, LGB, and Adaboost, this study found the top three models: XGBoost, RF, and GBM. Then, this study considered all combinations of the three models and summarized the top three combination model results in Table 3. It shows that the combination models provide higher accuracy metrics than the single model. Among the combination models, the XGBoost and RF combination provided the best accuracy metrics.
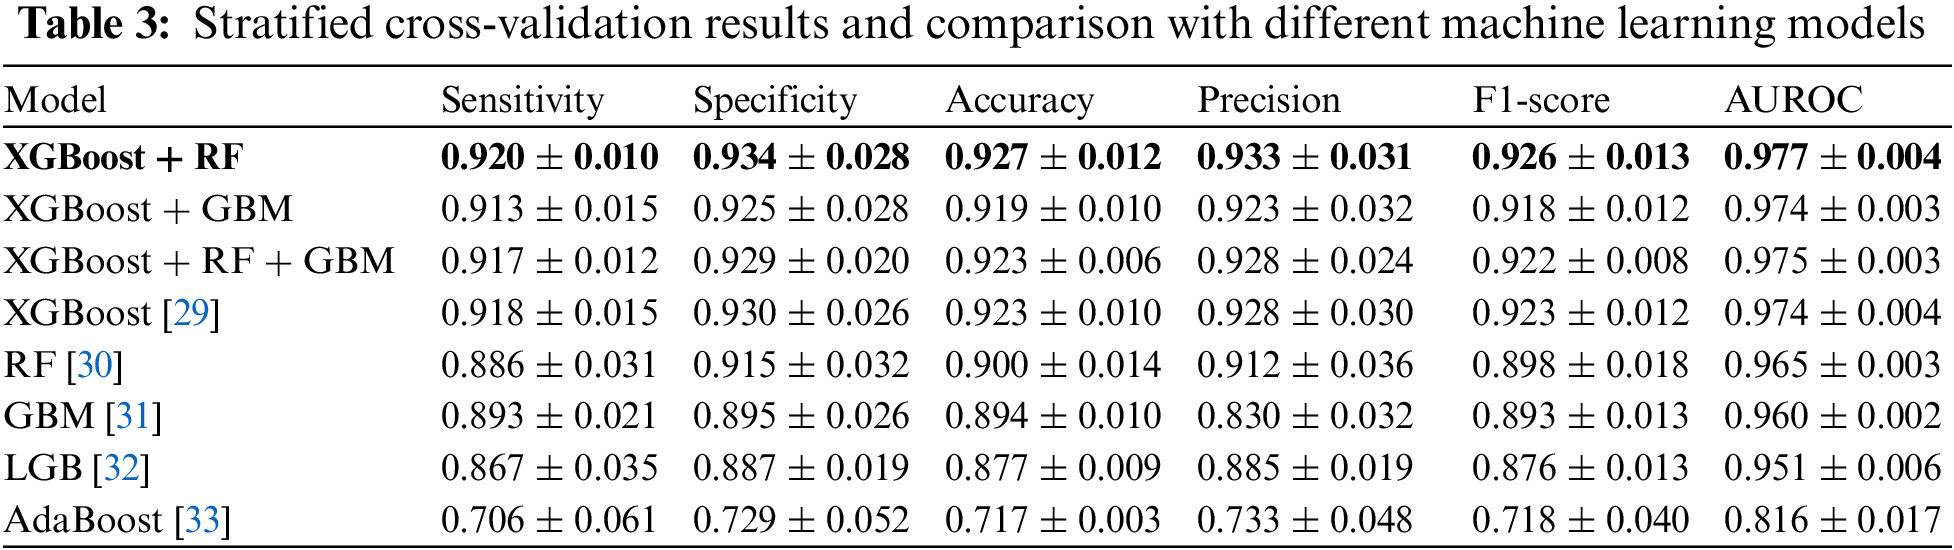
Fig. 4 shows ROC curves for comparison. This study plotted the curves by averaging the models from five-fold cross-validation. Fig. 4a compares the curves when a single model was considered. The results show that XGBoost provides the highest AUROC (0.974), followed by RF (0.965), GBM (0.960), LGB (0.951), and Adaboost (0.816). Fig. 4b compares the curves when a combined model from the top three models was considered. The results show that the AUROC results were similar, but the XGBoost-RF combination provides the highest AUROC (0.977), followed by the XGBoost-RF-GBM combination (0.975), and XGBoost-GBM combination (0.974). Note that the combination was slightly better than XGBoost only.
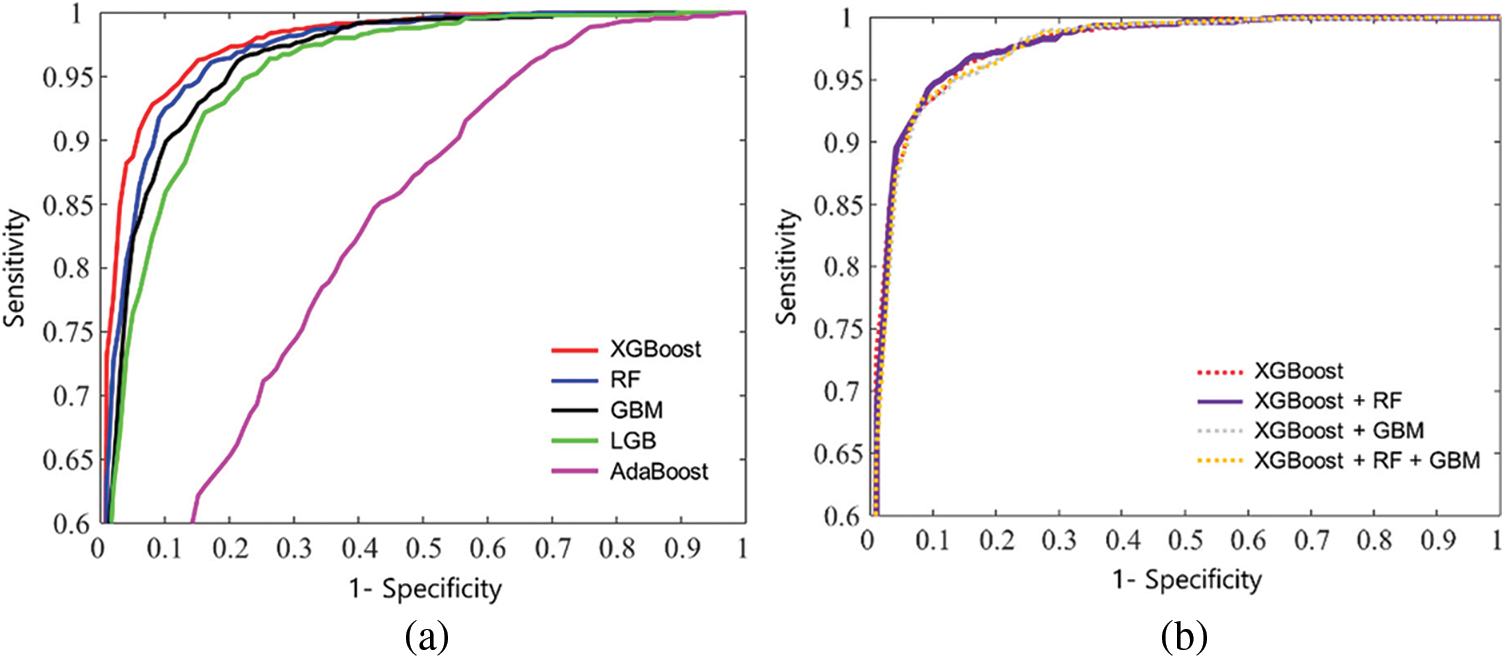
Figure 4: Mean receiver operating characteristic curves of k-fold cross validation: (a) XGboost, RF, GBM, LGB, and AdaBoost, and (b) a combined model from the top three models: XGBoost-RF, XGboost-GBM, and XGBoost-RF-GBM, respectively
3.2 Feature Importance Analysis
Fig. 5 shows the results of the ranked feature importance analysis from the single top models (XGBoost, RF, GBM), and the proposed combined model (XGBoost-RF). The results from XGBoost show that the feature of vPTT-foot had the highest importance value, followed by vPTT-peak, mRespiration, mBP-dias, and mPB-mean, shown in Fig. 5a. They indicate that XGBoost emphasized the information on PTT, respiration, and BP to detect the need for blood transfusion. The results from RF show that mBP-sys had the highest importance value, followed by mPTT-peak, mPB-mean, mBP-dias, and vPTT-foot, shown in Fig. 5b. They indicate that RF emphasized the information on BP and PTT to detect the need for blood transfusion. Results from GBM show that vPTT-foot had the highest importance value, followed by vPTT-peak, mRespiration, mBP-dias, and mPB-mean, shown in Fig. 5c. They indicate that GBM emphasized the information on PTT, respiration, and BP to detect the need for blood transfusion. Regarding the proposed ensemble model, the results from the combination of mBP-sys had the highest importance value, followed by mBP-dias, vPTT-foot and mPB-mean, shown in Fig. 5d. They indicate that the ensemble model emphasized the information on BP and PTT to detect the need for blood transfusion. On the other hand, HRV-LF/HF, vPPG-amp, and HRV-RMSSD rarely contributed to the detection model.
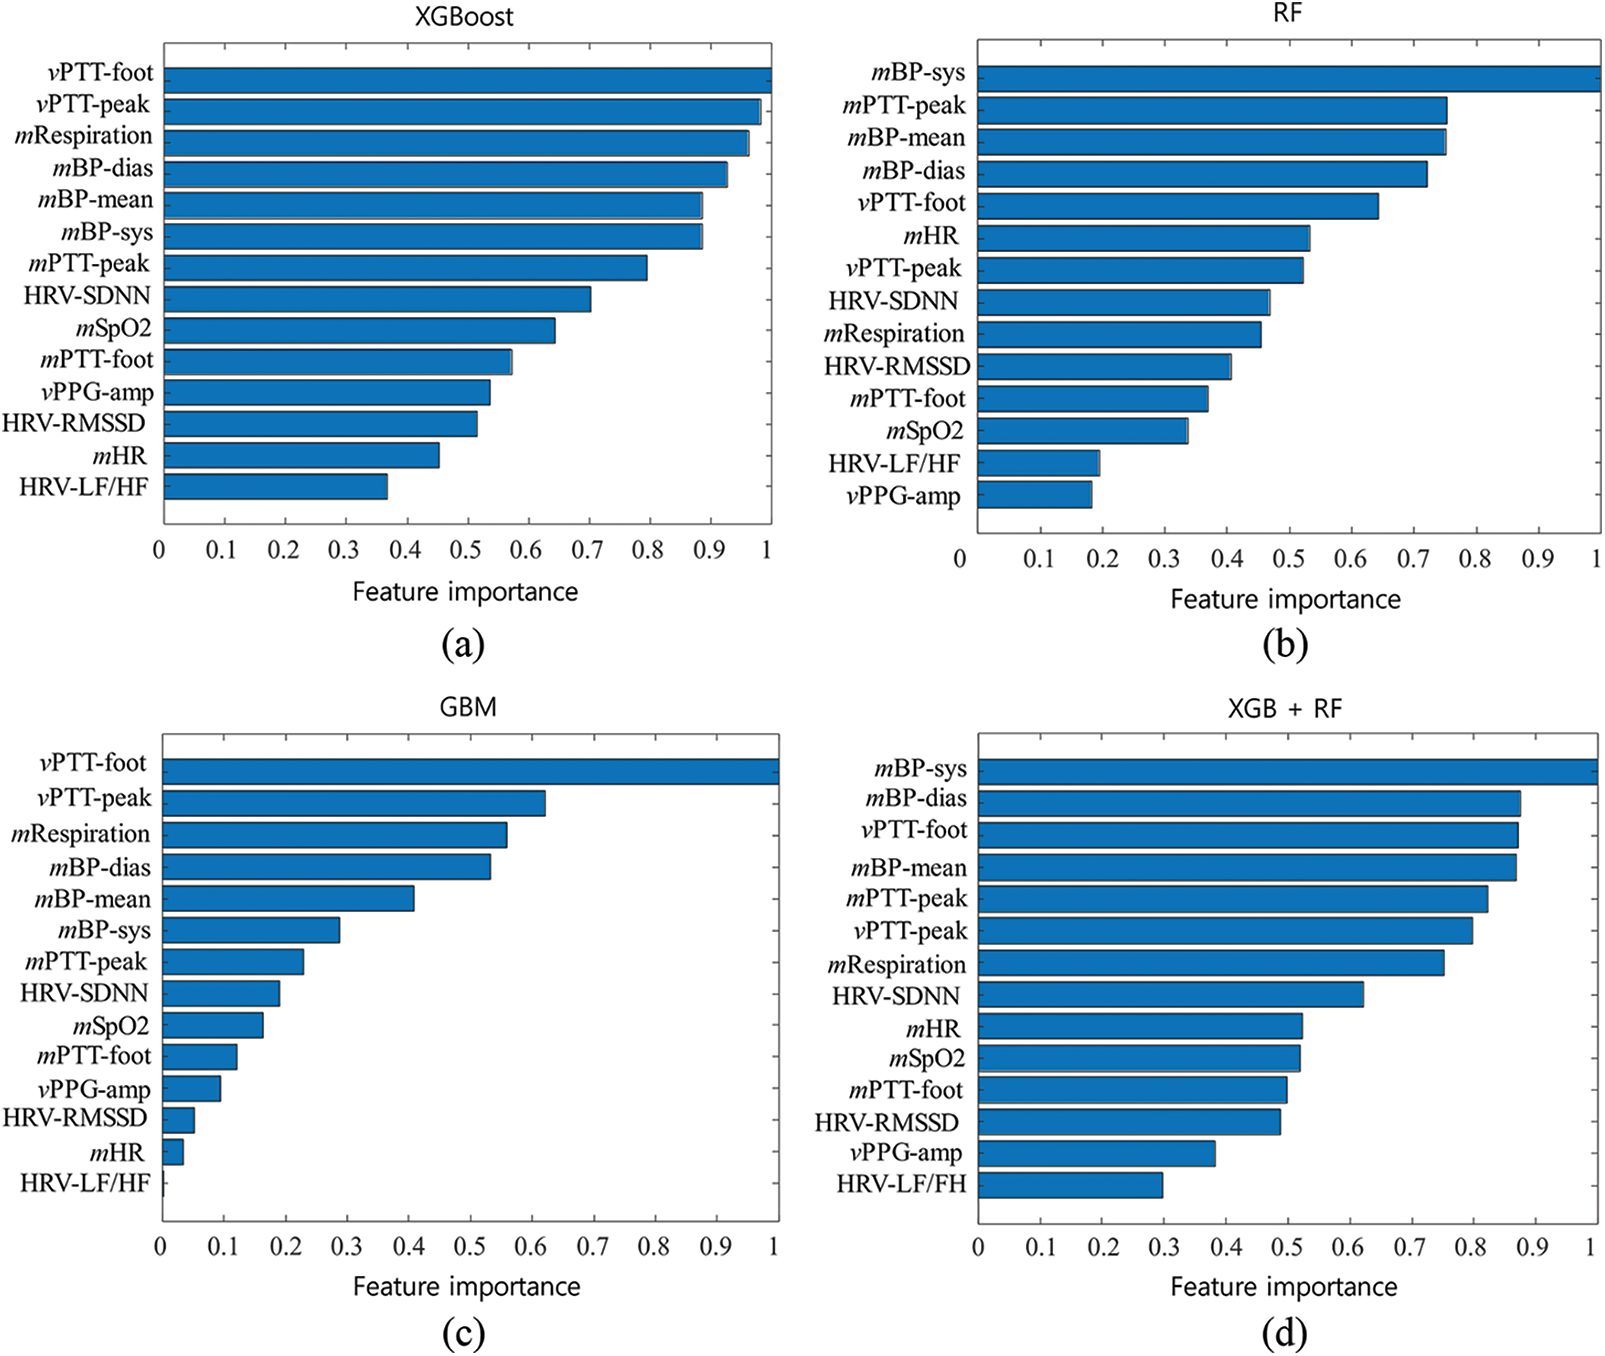
Figure 5: Results of the normalized feature importance analysis from (a) eXtreme Gradient Boosting (XGBoost), (b) random forest (RF), (c) gradient boosting machine (GBM), and (d) the combined model of XGBoost and RF
This study presented an ensemble model combining XGBoost and RF to detect the need for blood transfusion. The cross-validation results showed that the model provided sensitivity of 92.08%, specificity of 93.4%, accuracy of 92.7%, precision of 92.6%, F1 score of 92.6%, and AUROC of 0.977. Regarding the single model, RF provided the best AUROC value, followed by GBM, and LGB. When considering the combination among the top three models, our model combining XGBoost and RF provided the best AUROC value, followed by the three-model combination (XGBoost, RF, and GBM) and the two-model combination (XGBoost and GBM). Overall, the ensemble model with XGBoost and RF provided the highest accuracy over all accuracy metrics such as sensitivity, specificity, accuracy, precision, F1-score, and AUROC. This study has the following contributions. First, this study collected 40 blood transfusion patients based on a prospectively built TICU registry from 2019 to 2022 in WKHU. Second, this study considered physiological signals such as ECG waveforms, PPG waveforms, NIBP values, SpO2 values, and respiration values. It then extracted four PTT-related features from ECG and PPG waveforms, four HRV-related features from ECG waveforms, three BP-related features from NIBP, and three additional features from PPG, SpO2, and respiration. Third, this study investigated the prediction performance from the state-of-the-art machine learning models and found the best combination among them. Fourth, the contribution of each feature could be confirmed using feature importance analysis. Last, this study found the best ensemble model to provide the best performance: XGBoost and RF combination.
The ensemble approach is the process of using multiple related- but different analytical models and then combining the results into a single score to improve the accuracy of predictive analytics and data mining applications. The XGBoost model has recently dominated the applied machine learning algorithms for its efficiency and accuracy. As a gradient boosting, new models are created that predict residuals of prior models and then are added to make the final decision. When the new models are added, a gradient descent algorithm is used to minimize the loss. A gradient descent algorithm is used to update weights in neural networks. However, regarding gradient boosting, the gradient descent algorithm is used to optimize the boosted model predictions. That is, gradient boosting is to find the best loss function by taking lots of simple functions corresponding to weak trees and adding them together. Thus, the gradients are added to the training process by fitting the subsequently optimized tree. The RF is also a commonly used machine learning algorithm, which combines the outputs from smaller weak decision trees. The unique characteristic of RF is that many uncorrelated weak models operating as a committee will outperform any of the strong individual models. Regarding the accuracy of blood transfusion need detection, our ensemble model yielded the highest detection accuracy compared with other models, including GBM, LGB, Adaboost, and their possible combination models. This study performed a stratified 5-fold cross-validation against overfitting and found the best hyperparameters with a grid search against underfitting. The cross-validation generates multiple mini train-test splits. For each split, this study partitioned the data into k folds (k = 5), and iteratively trained the algorithm on k-1 folds while using the remaining fold as the test set. In the grid search, this study changed the values of the maximum depth, the learning rate, and the number of tree estimators for both XGBoost and RF, and found the best hyperparameters.
In addition, to investigate the contributions of the extracted features, this study performed the feature importance analysis. The results showed the feature of mBP-sys made the most significant contribution to detecting blood transfusion needs. On the other hand, HRV-LF/HF, vPPG-amp, and HRV-RMSSD contributed little. The feature importance value was calculated as the decrease in node impurity weighted by the probability of reaching the node. The node probability was calculated as the number of samples reaching the node was divided by the total number of samples. The node impurity was based on the Gini index, which measures the degree of a particular variable being incorrectly classified when it is randomly chosen. This study also could consider entropy and classification error for the impurity measures, but the results were the same.
Several traditional prediction models to detect the need for transfusion have been introduced [34]. However, these models showed insufficient accuracy and did not incorporate continuous vital signs. The expert trauma surgeon may have difficulties predicting significant hemorrhage [35]. Our machine learning model would provide new guidance to excellent prediction models. Indeed, vital sign monitoring could be applied to prehospital settings as well as emergency departments. Interestingly, part of the results demonstrated that the top six features contributing outcomes were related BP and PTT: mBP-sys, mBP-dias, vPTT-foot, mBP-mean, mPTT-peak, and vPTT-peak. These results showed that incorporating the information of BP and PTT improved the detection performances of the model. The seventh top feature was mRespiration, which indicates that respiration is also one of the important factors for detecting the need for blood transfusion. On the other hand, HRV features were ranked low, which indicates a low contribution to the detection model.
This study developed an ensemble machine learning model to detect the need for blood transfusion using physiological signals. For the model, this study has collected 40 blood transfusion patients based on a prospectively built TICU registry, and considered physiological signals as the model input. For the model input, this study extracted PTT-related features, HRV-related features, BP-related features, and three additional features from PPG, SpO2, and respiration. Subsequently, this study investigated the prediction performance from the state-of-the-art machine learning models and found the best combination among them. Finally, this study found the best ensemble model to provide the best performance: XGBoost and RF combination. Our performance in detecting the need for blood transfusion is overall accurate and may be helpful for healthcare providers, especially in the field of trauma surgery and care. Though our model demonstrated high accuracy in detecting the need for blood transfusion, several limitations should be considered. First, our model was trained using data from a single TICU medical center. In addition, the sample size is small. For the data selection, this study considered only the patients who received two units or more of PRBCs after admission to the TICU. Due to the restriction, this study could use only 40 of 727 patient data. Furthermore, this study validated the proposed model using a stratified five-fold cross-validation. Next, our data included patients from Korea only. Thus, this study should extend to upgrade the model with more datasets comprising more diverse subjects. To overcome the generalization issues, it may be necessary to validate our model using external datasets, such as data from various medical institutions. In addition, this study needs to consider more variables for the model input. Finally, this study needs to consider several conditions that require blood transfusion, such as chemotherapy treatments, blood loss, severe anemia, bleeding disorders, pregnancy, and autoimmune disorders.
Funding Statement: This work was supported by the Korea Medical Device Development Fund from the Korean government (the Ministry of Science and ICT; Ministry of Trade, Industry and Energy; Ministry of Health and Welfare; and Ministry of Food and Drug Safety) (KMDF_PR_20200901_0095) and the Soonchunhyang University Research Fund.
Conflicts of Interest: The authors declare that they have no conflicts of interest to report regarding the present study.
References
1. G. Barshtein, R. Ben-Ami and S. Yedgar, “Role of red blood cell flow behavior in hemodynamics and hemostasis,” Expert Review of Cardiovascular Therapy, vol. 5, no. 4, pp. 743–752, 2007. [Google Scholar]
2. A. G. Greenburg, “A physiologic basis for red blood cell transfusion decisions,” The American Journal of Surgery, vol. 170, no. 6, pp. S44–S48, 1995. [Google Scholar]
3. Korean Hemovigliance System, “Annual report,” 2021. [Online]. Available: http://www.kohevis.or.kr/sub/catalog.php?CatNo=19&Mode=view&start=&Keyword=&no=14. [Google Scholar]
4. S. Rastogi, “Transfusion practices in trauma,” Indian Journal of Anaesthesia, vol. 59, no. 4, pp. 263, 2015. [Google Scholar]
5. E. A. Gehrie, J. E. Hendrickson and C. A. Tormey, “Variation in vital signs resulting from blood component administration in adults,” Transfusion, vol. 55, no. 8, pp. 1866–1871, 2015. [Google Scholar]
6. C. Andrzejewski Jr., M. A. Popovsky, T. C. Stec, J. Provencher, L. O’Hearn et al., “Hemotherapy bedside biovigilance involving vital sign values and characteristics of patients with suspected transfusion reactions associated with fluid challenges: Can some cases of transfusion-associated circulatory overload have proinflammatory aspects?,” Transfusion, vol. 52, no. 11, pp. 2310–2320, 2012. [Google Scholar]
7. E. Gehrie, J. Hendrickson and C. A. Tormey, “Measuring the influence of blood component infusion rate on recipient vital signs,” Vox Sanguinis, vol. 109, no. 4, pp. 353–358, 2015. [Google Scholar]
8. E. A. Gehrie, N. H. Roubinian, D. Chowdhury, D. J. Brambilla, E. L. Murphy et al., “A multicentre study investigating vital sign changes occurring in complicated and uncomplicated transfusions,” Vox Sanguinis, vol. 113, no. 2, pp. 160–169, 2018. [Google Scholar]
9. A. Meyer, D. Zverinski, B. Pfahringer, J. Kempfert, T. Kuehne et al., “Machine learning for real-time prediction of complications in critical care: A retrospective study,” The Lancet Respiratory Medicine, vol. 6, no. 12, pp. 905–914, 2018. [Google Scholar]
10. A. Bonde, K. M. Varadarajan, N. Bonde, A. Troelsen, O. K. Muratoglu et al., “Assessing the utility of deep neural networks in predicting postoperative surgical complications: A retrospective study,” The Lancet Digital Health, vol. 3, no. 8, pp. e471–e485, 2021. [Google Scholar]
11. R. Levi, F. Carli, A. R. Arévalo, Y. Altinel, D. J. Stein et al., “Artificial intelligence-based prediction of transfusion in the intensive care unit in patients with gastrointestinal bleeding,” BMJ Health & Care Informatics, vol. 28, no. 1, pp. e100245, 2021. [Google Scholar]
12. N. Selvaraj, K. H. Shelley, D. G. Silverman, N. Stachenfeld, N. Galante et al., “A novel approach using time-frequency analysis of pulse-oximeter data to detect progressive hypovolemia in spontaneously breathing healthy subjects,” IEEE Transactions on Biomedical Engineering, vol. 58, no. 8, pp. 2272–2279, 2011. [Google Scholar]
13. A. A. Alian, N. J. Galante, N. S. Stachenfeld, D. G. Silverman and K. H. Shelley, “Impact of central hypovolemia on photoplethysmographic waveform parameters in healthy volunteers part 2: Frequency domain analysis,” Journal of Clinical Monitoring and Computing, vol. 25, no. 6, pp. 387–396, 2011. [Google Scholar]
14. C. G. Scully, N. Selvaraj, F. W. Romberg, R. Wardhan, J. Ryan et al., “Using time-frequency analysis of the photoplethysmographic waveform to detect the withdrawal of 900 mL of blood,” Anesthesia & Analgesia, vol. 115, no. 1, pp. 74–81, 2012. [Google Scholar]
15. Y. Chen, C. Hong, M. R. Pinsky, T. Ma and G. Clermont, “Estimating surgical blood loss volume using continuously monitored vital signs,” Sensors, vol. 20, no. 22, pp. 6558, 2020. [Google Scholar]
16. Z. Zhang, Z. Cao and H. Qian, “Chosen-ciphertext attack secure public key encryption with auxiliary inputs,” Security and Communication Networks, vol. 5, no. 12, pp. 1404–1411, 2012. [Google Scholar]
17. A. Alsirhani, M. M. Ezz and A. M. Mostafa, “Advanced authentication mechanisms for identity and access management in cloud computing,” Computer Systems Science and Engineering, vol. 43, no. 3, pp. 967–984, 2022. [Google Scholar]
18. M. Ragab, H. A. Abdushkour, A. F. Nahhas and W. H. Aljedaibi, “Deer hunting optimization with deep learning model for lung cancer classification,” Computers, Materials & Continua, vol. 73, no. 1, pp. 533–546, 2022. [Google Scholar]
19. X. Zhang, W. Zhang, W. Sun, X. Sun and S. K. Jha, “A robust 3-D medical watermarking based on wavelet transform for data protection,” Computer Systems Science and Engineering, vol. 41, no. 3, pp. 1043–1056, 2022. [Google Scholar]
20. Y. Y. Ghadi, I. Akhter, S. A. Alsuhibany, T. al Shloul, A. Jalal et al., “Multiple events detection using context-intelligence features,” Intelligent Automation & Soft Computing, vol. 34, no. 3, pp. 1455–1471, 2022. [Google Scholar]
21. S. Pattanakuhar, A. Phrommintikul, A. Tantiworawit, S. Konginn, S. Srichairattanakool et al., “Decreased heart rate variablity is associated with increased cardiac iron deposit determined by cardia T2* MRI and decreased left ventricular function in transfusion dependent thalassemia patients,” Journal of the American College of Cardiology, vol. 69, no. 11S, pp. 897, 2017. [Google Scholar]
22. R. Perini and A. Veicsteinas, “Heart rate variability and autonomic activity at rest and during exercise in various physiological conditions,” European Journal of Applied Physiology, vol. 90, no. 3, pp. 317–325, 2003. [Google Scholar]
23. A. Tanaka, A. Yokohama, S-i. Fujiwara, Y. Fujii, M. Kaneko et al., “Transfusion-associated circulatory overload and high blood pressure: A multicentre retrospective study in Japan,” Vox Sanguinis, vol. 116, no. 7, pp. 785–792, 2021. [Google Scholar]
24. C. M. van Ravenswaaij-Arts, L. A. Kollee, J. C. Hopman, G. B. Stoelinga and H. P. van Geijn, “Heart rate variability,” Annals of Internal Medicine, vol. 118, no. 6, pp. 436–447, 1993. [Google Scholar]
25. R. E. Kleiger, P. K. Stein and J. T. Bigger Jr., “Heart rate variability: Measurement and clinical utility,” Annals of Noninvasive Electrocardiology, vol. 10, no. 1, pp. 88–101, 2005. [Google Scholar]
26. K. Wijarnpreecha, N. Siri-Angkul, K. Shinlapawittayatorn, P. Charoenkwan, S. Silvilairat et al., “Heart rate variability as an alternative indicator for identifying cardiac iron status in non-transfusion dependent thalassemia patients,” PLoS One, vol. 10, no. 6, pp. e0130837, 2015. [Google Scholar]
27. S. Silvilairat, P. Charoenkwan, S. Saekho, A. Tantiworawit, A. Phrommintikul et al., “Heart rate variability for early detection of cardiac iron deposition in patients with transfusion-dependent thalassemia,” PLoS One, vol. 11, no. 10, pp. e0164300, 2016. [Google Scholar]
28. B. Saugel, M. Klein, A. Hapfelmeier, V. Phillip, C. Schultheiss et al., “Effects of red blood cell transfusion on hemodynamic parameters: A prospective study in intensive care unit patients,” Scandinavian Journal of Trauma, Resuscitation and Emergency Medicine, vol. 21, no. 1, pp. 1–7, 2013. [Google Scholar]
29. T. Chen and C. Guestrin, “Xgboost: A scalable tree boosting system,” KDD '16:Proceedings of the 22nd ACM SIGKDD International Conference on KnowledgeDiscovery and Data Mining, pp. 785–794, 2016. [Google Scholar]
30. A. Liaw and M. Wiener, “Classification and regression by randomForest,” R News, vol. 2, no. 3, pp. 18–22, 2002. [Google Scholar]
31. A. Natekin and A. Knoll, “Gradient boosting machines, a tutorial,” Frontiers in Neurorobotics, vol. 7, pp. 21, 2013. [Google Scholar]
32. G. Ke, Q. Meng, T. Finley, T. Wang, W. Chen et al., “Lightgbm: A highly efficient gradient boosting decision tree,” Advances in Neural Information Processing Systems, vol. 30, pp. 3146–3154 2017. [Google Scholar]
33. G. Rätsch, T. Onoda and K. -R. Müller, “Soft margins for AdaBoost,” Machine Learning, vol. 42, no. 3, pp. 287–320, 2001. [Google Scholar]
34. A. W. Shih, S. Al Khan, A. Y. -H. Wang, P. Dawe, P. Y. Young et al., “Systematic reviews of scores and predictors to trigger activation of massive transfusion protocols,” Journal of Trauma and Acute Care Surgery, vol. 87, no. 3, pp. 717–729, 2019. [Google Scholar]
35. M. J. Pommerening, M. D. Goodman, J. B. Holcomb, C. E. Wade, E. E. Fox et al., “Clinical gestalt and the prediction of massive transfusion after trauma,” Injury-International Journal of the Care of the Injured, vol. 46, no. 5, pp. 807–813, 2015. [Google Scholar]
Cite This Article
 Copyright © 2023 The Author(s). Published by Tech Science Press.
This work is licensed under a Creative Commons Attribution 4.0 International License , which permits unrestricted use, distribution, and reproduction in any medium, provided the original work is properly cited.
 Downloads
 Citation Tools