
 Submit a Paper
 Propose a Special lssue
 Open Access
ARTICLE

Computer-Aided Diagnosis Model Using Machine Learning for Brain Tumor Detection and Classification
1 Department of Computer Science and Engineering, School of Computing, College of Engineering and Technology, SRM Institute of Science and Technology, Kattankulathur, Chengalpattu, 603203, Tamilnadu, India
2 Department of Computing Technologies, School of Computing, College of Engineering and Technology, SRM Institute of Science and Technology, Kattankulathur, Chengalpattu, 603203, Tamilnadu, India
* Corresponding Author: M. Baskar. Email:
Computer Systems Science and Engineering 2023, 46(2), 1811-1826. https://doi.org/10.32604/csse.2023.035455
Received 22 August 2022; Accepted 14 December 2022; Issue published 09 February 2023
 View Full Text
 Download PDF
Abstract
The Brain Tumor (BT) is created by an uncontrollable rise of anomalous cells in brain tissue, and it consists of 2 types of cancers they are malignant and benign tumors. The benevolent BT does not affect the neighbouring healthy and normal tissue; however, the malignant could affect the adjacent brain tissues, which results in death. Initial recognition of BT is highly significant to protecting the patient’s life. Generally, the BT can be identified through the magnetic resonance imaging (MRI) scanning technique. But the radiotherapists are not offering effective tumor segmentation in MRI images because of the position and unequal shape of the tumor in the brain. Recently, ML has prevailed against standard image processing techniques. Several studies denote the superiority of machine learning (ML) techniques over standard techniques. Therefore, this study develops novel brain tumor detection and classification model using met heuristic optimization with machine learning (BTDC-MOML) model. To accomplish the detection of brain tumor effectively, a Computer-Aided Design (CAD) model using Machine Learning (ML) technique is proposed in this research manuscript. Initially, the input image pre-processing is performed using Gaborfiltering (GF) based noise removal, contrast enhancement, and skull stripping. Next, mayfly optimization with the Kapur’s thresholding based segmentation process takes place. For feature extraction proposes, local diagonal extreme patterns (LDEP) are exploited. At last, the Extreme Gradient Boosting (XGBoost) model can be used for the BT classification process. The accuracy analysis is performed in terms of Learning accuracy, and the validation accuracy is performed to determine the efficiency of the proposed research work. The experimental validation of the proposed model demonstrates its promising performance over other existing methods.Keywords
Brain tumours (BT), one of the most terrifying diseases, are brought on by the unchecked growth of brain cells and can be considered the most complex organ in the human body. All age groups can be affected by BT [1]. Inappropriately, the root cause of many brain cancers becomes unknown. Some of the risk factors relevant to brain cancers are genetic conditions, age, and radiation. Yet, there exist above 120 different brain cancers documented. But it is classified into two groups they are metastatic and primary brain cancers [2]. Brain cells from healthy brains are the source of primary BT. The fundamental BT types were determined by the cells of origin. For instance, primary BTs arise from gliomas, which are glial cells. Moreover, certain cancers originate from many cell types, like oligo-astrocytoma. The proposed research is being carried out for finding the root cause of primary BTs however certain factors related to the tumors, which include genetic conditions, age, and radiation [3].
The uncontrollable growth of tumors necessitates a precise primary BT diagnosis, which will be beneficial for the treatment, particularly in the early stages. Because the patient who receives treatment in the initial stage is likely to survive [4]. Presently, many diagnosis outcomes were done through medical imaging. MRI is the first choice for primary BT identification because it may provide better imaging results for soft tissues than computed tomography (CT). Experts will have difficulty manually interpreting MRIs due to high intra-and inter-observer variability, however [5]. Because CAD systems could help medical professionals in their diagnosis, industry and academia became very interested in computer-aided diagnosis (CAD). With the unprecedented advancement of artificial intelligence (AI) and computer vision (CV) technology, CAD mechanism could enforce automated brain MRI analysis and present the diagnosis outcomes. For the past few years, an ocean of CAD techniques was devised for diagnosing BTs [6].
The CAD of tissues and cancers has increased with the development of healthcare technologies and the expansion of digital image processing [7]. Since there will be no risk of ionising radiation and MRI can precisely identify blood circulation in veins, it was chosen for this diagnosing system. In recent years, various methods were suggested for CAD systems for BT, namely deep networks (NWs), fused vectors, transfer learning (TL), and Support Vector Machine (SVM). With recent developments in deep NWs, CNN was extensively used for many CAD systems [8]. According to CNN, there are numerous layers in which distinct features are extracted, and complex inputs are transformed into activated forms using partial differential functions [9]. It is possible to build the layers on top of one another. The FC layer, the convolution layer, and the pooling layer are the three core layers of the CNN stricture. A vanishing gradient issue might occur if small numbers occur during gradient computation [10]. To evade vanishing gradient complexity, a Re-LU layer was included after every convolution layer as an element-wise activator function.
This study focuses on the design of a novel brain tumor detection and classification model employing metaheuristic optimization with a machine learning (BTDC-MOML) model. Initially, the input image pre-processing is performed using Gabor filtering (GF) based noise removal, contrast enhancement, and skull stripping. Then, mayfly optimization with Kapur’s thresholding-based segmentation process takes place. For feature extraction proposes, Local Diagonal Extrema Patterns (LDEP) are exploited. At long last, the BT classification process can make use of the extreme gradient boosting (XGBoost) model. The experimental verification of the suggested model shows that it outperforms other models in a positive way.
1.1 Advantages of the Proposed Work
On implementing the proposed work, better detection of the Brain Tumor (BT) can be achieved with a high level of accuracy. The learning accuracy and the prediction accuracy of brain tumor detection can be achieved to be more in this proposed work. This enhanced efficiency is achieved in the proposed work on implementing the Computer Aided Design in the Machine Learning model.
1.2 Organization of the Research Article*
This research article is organized with a brief introduction in Section 1. The results of the related works are listed in Section 2, assisting in framing the objectives of the proposed work. A detailed illustration of the proposed methodology is performed in Section 3, followed by the validation of evaluated results in Section 4. Finally, the article is concluded by listing the merits and the future scope of research in Section 5.
2 Related Worksfor Prior BT Classification Models
In [11], the authors have formulated an automatic computer-aided network for finding MR-BT class that is LGG and HGG. For BT classification, the authors favour a Gabor-modulated Convolutional filter-oriented classifier. This mere modulation of standard Convolutional filters by GF allows the presented structure to study comparatively small feature maps reducing the demand for network parameters. Rasool et al. [12] presented a novel hybrid CNN-oriented structure for classifying 3 BT types by using MRI images. The technique recommended in this study will use hybrid DL classification related to CNN with 2 techniques. In [13], the MRI images were pre-processed, and segmentation can occur by altered Level set technique for segmenting cancer. Moreover, it becomes significant to derive valuable features for predicting the image class precisely. In the adaptive ANN, the layer neurons were maximized through WOA.
Noreen et al. [14] devise a technique of concatenation and multilevel feature extraction for the initial diagnosis of BT. Two pre-trained DL methods they are DensNet201, and Inception-v3, make this method valid. In [15], CNN can be utilized for performing BT segmentation. The research scholars formulated a new optimized method related to the firefly technique for maximizing segmentation efficiency. The presented firefly technique maximizes the CNN method’s indispensable hyper-parameters. Sajjad et al. [16] present a new CNN-related multi-grade BT classifying mechanism. At First, cancer parts from an MR image were segregated by a DL method. The presented mechanism was then effectively trained using extensive data augmentation, which avoided data problems when dealing with MRI for multi-grade BT classification.
In [17], a DL-related technique employing various MRI modalities was offered for segmenting BT. The presented hybrid CNN structure leverages the patch-based method and considers both contextual and local information during the prediction of the output label. The presented network handles over-fitting issues by using dropout regularized alongbatch normalization in which data imbalance issue deals with utilizing a 2-stage training process. Polly et al. [18] formulates a computerized system for distinguishing abnormal brains and normal brains with cancer in MRI images and even categorizing the abnormal BT into LGG or HGG cancers. The presented computerized system will use k-means as the segmenting method for clustering, while PCA and Discrete Wavelet Transform (DWT) were the main parts of the feature reduction and feature extraction systems.
An innovative BTDC-MOML approach was proposed for the BT classification process in this article. The BTDC-MOML technique encompasses image pre-processing, optimal Kapur’s thresholding-based segmentation, LDEP feature extraction, and XG-Boost classification. Here, input image pre-processing is performed using GF-based noise removal, contrast enhancement, and skull stripping. Next, the MFO with Kapur’s thresholding-based segmentation process takes place. Besides, LDEP feature extraction and XG-Boost classification model is performed in this study. Fig. 1 portrays the complete process of BTDC-MOML approach.

Figure 1: Architecture of BTDC-MOML approach
In this proposed work, the input image pre-processing can be performed using GF-based noise removal, contrast enhancement, and skull stripping. The biological pertinence and computational dynamics of Gabor wavelets make them appropriate for using in image analysis [19]. They were maximized in space and frequency domain. Gabor wavelets (
Whereas
At this stage, the BTDC-MOML technique applies MFO with Kapur’s thresholding-based image segmentation model. Kapur’s entropy operates on the identification of optimum threshold values, which partitions the comparable regions in the image by the maximization of the entropy of the histogram [20]. At the bi-level threshold, it is needed to determine the threshold value t, which partitions the image to background and foreground, such as B and F, for maximization of the succeeding functions:
Whereas
Initialization: At the
Estimation of performance: The primary function (F) defines the efficiency of MFs. In all the iterations, the global position (gbest) and best personal (pbest) are saved in the algorithm. One cycle (Cyc) is the period between the total vacation, charging, and travel duration for each visited node and two charging demands. The fitness function aims to minimise MC’s overall distance travelled, the cycle count, and system total power utilization that exploits mobile charging vacation time.
Velocity and position upgrades: Every MFs location can be attuned based on its neighbour and its own experiences. The male MFs position and velocity update are given below:
However, it should endure in its nuptial dance, and the optimal male MF update the velocity based on Eq. (17) for the functionality of the algorithm.
The female MFs velocity and position are upgraded based on Eq. (17):
In Eq. (18),
Selection: Parent MFs are selected for mating according to their fitness value. Consequently, the high the fitness values, the more significant probability of selection.
Crossover: Accordingly, one parent is chosen from the male population and the other from the female population when two MFs mate. Similarly, parents are chosen based on a female’s attraction to MFs. After that, the ideal female breeds with the ideal male, the ideal female with the ideal male, etc. In the following, two offspring (children) are generated:
Mutation: The mutation was familiarised after estimating the execution of children. Mutating the offspring thwarted the model’s ability to obtain local minima. To induce a mutation, a value with a random uniform distribution is added to the chosen children, as represented in Eq. (20),
In Eq. (21),
Population Fusion: The mutated offspring are merged with a non-mutated offspring before being equally divided. As a result, new children are produced.
For the purpose of choosing the next generation of MFs to optimise, the performance of the parent and child populations is arranged.
During the feature extraction process, the images which are segmented were sent into the LDEP model. The overall procedure of computation of
Where
whereas,
The value denotes the local diagonal extrema and the mean pixel values. Here,
At last,
Finally, the XG-Boost model is utilized for BT classification purposes. XG-Boost is an optimization technique that integrates a linear mechanism with a boosting tree algorithm [23]. It employs the initial and second derivatives of the loss function for second-order derivation. This enables the approach to converge to increase the efficacy of the optimum solution and the global optimality faster. For a provided n samples and m feature dataset
In Eq. (27), l denotes the loss function, hence the small l is, the improved the performance of the model.
In Eq. (28),
While applying the XG-Boost incorporated learning model to forecast protein sub-mitochondria, the fundamental step is to improve the learning, booster, and general parameters of the XG-Boost.
The Brain Tumor (BT) classification performance of the BTDC-MOML method is examined in this section. As shown in Table 1, the dataset consists of 7004 samples from four classes. In Fig. 2, some sample images are shown.


Figure 2: Sample images
In Fig. 3, it was established the confusion matrices produced by the BTDC-MOML method in various classes. The figure showed that the four distinct class labels had been correctly classified using the BTDC-MOML method.

Figure 3: Confusion matrices of BTDC-MOML approach (a) 80% of TR data, (b) 20% of TS data, (c) 70% of TR data, and (d) 30% of TS data
Table 2 and Fig. 4 highlight the BT classification effect of the BTDC-MOML model. The obtained values denote that the BTDC-MOML method has accomplished enhanced performance. For instance, with 80% of the TR dataset, the BTDC-MOML approach has offered average


Figure 4: Average analysis of BTDC-MOML approach (a) 80% of TR data, (b) 20% of TS data, (c) 70% of TR data, and (d) 30% of TS data
Fig. 5 illustrates the training accuracy (TRA) and validation accuracy (VLA) gains made by the BTDC-MOML methodology in the test dataset. The results of the experiment showed that the BTDC-MOML approach had attained maximum TRA and VLA values. VLA appears to be greater than TRA. In the test dataset, the training loss (TRL) and validation loss (VLL) gained by the BTDC-MOML technique are shown in Fig. 6. The experimental findings show that the BTDC-MOML method has the lowest TRL and VLL values. Particularly, the VLL is lower than the TRL.

Figure 5: TRA and VLA analysis of BTDC-MOML approach

Figure 6: TRL and VLL analysis of BTDC-MOML approach
Fig. 7 shows a precise precision-recall analysis of the test dataset using the BTDC-MOML algorithm. The figure shows that every class label’s precision-recall values have improved as a result of the BTDC-MOML approach.
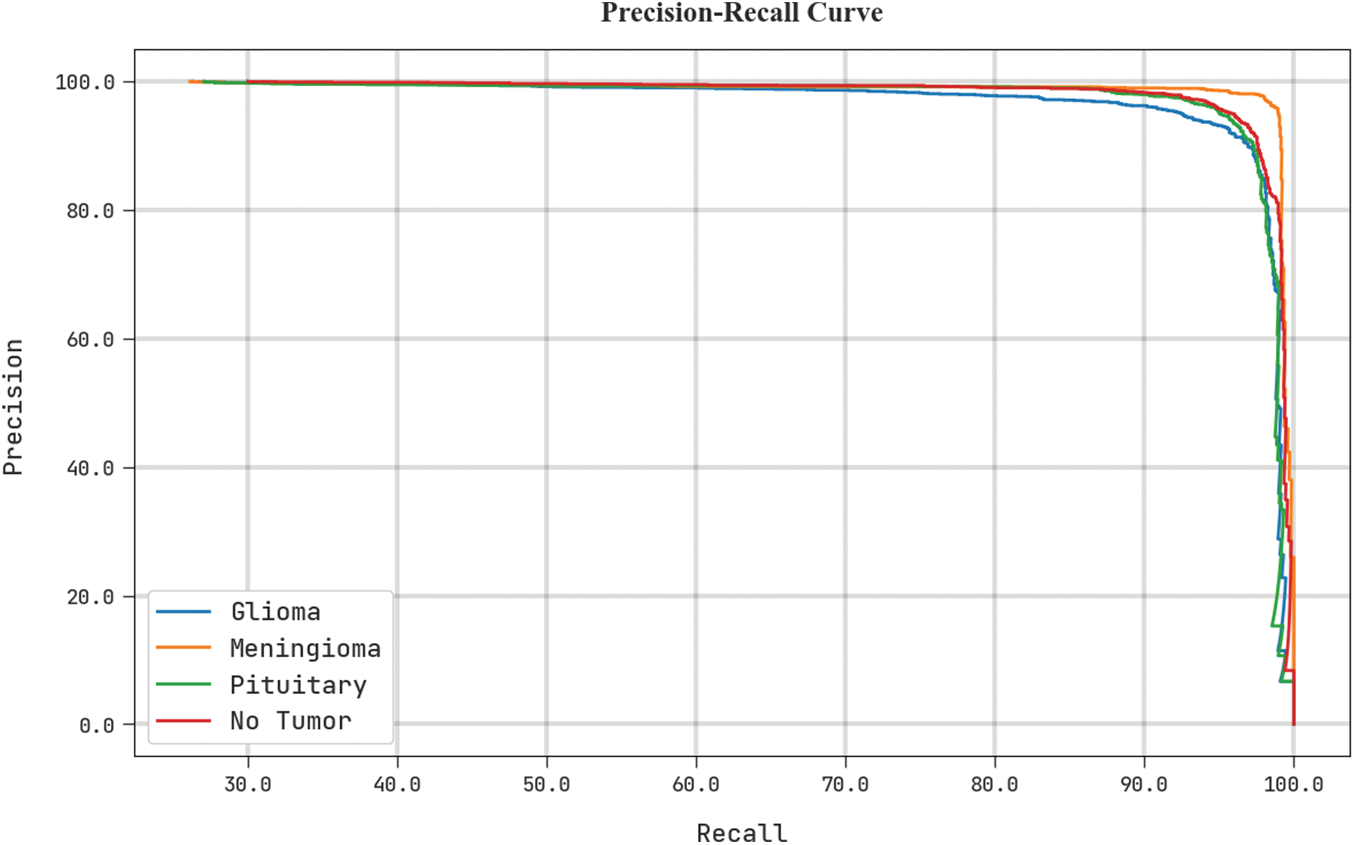
Figure 7: Precision-recall curve analysis of BTDC-MOML approach
Fig. 8 displays a quick ROC analysis of the BTDC-MOML algorithm in the test dataset. The results implied by the BTDC-MOML method have demonstrated its aptitude for classifying various groups in the test dataset.

Figure 8: ROC curve analysis of BTDC-MOML approach
To ensure the improved BT classification performance of the BTDC-MOML method, a comparative study is made in Table 3 and Fig. 9 [4,24]. The outcomes indicated the enhancements of the BTDC-MOML model over other recent approaches. For example, in terms of


Figure 9: Comparative analysis of BTDC-MOML technique with recent approaches
A detailed

Figure 10:
In this proposed work of Brain Tumor detection, a new BTDC-MOML algorithm is devised for the BT classification process. The BTDC-MOML technique encompasses image pre-processing, optimal Kapur’s thresholding-based segmentation, LDEP feature extraction, and XG-Boost classification. Here, the input image pre-processing is performed using GF-based noise removal, contrast enhancement, and skull stripping. Next, the MFO with Kapur’s thresholding-based segmentation process takes place. Besides, LDEP feature extraction and XG-Boost classification model is performed in this work. The experimental outcome of the proposed method demonstrates its promising performance over other existing models. The experimental result signified the superior results of the BTDC-MOML method to other methods. The performance analysis of the proposed work exhibits an average
Funding Statement: The authors received no specific funding for this study.
Conflicts of Interest: The authors declare that they have no conflicts of interest to report regarding the present study.
References
1. C. L. Choudhury, C. Mahanty, R. Kumar and B. K. Mishra, “Brain tumor detection and classification using convolutional neural network and deep neural network,” in Proc. Int. Conf. on Computer Science Engineering and Applications (ICCSEA), Gunupur, India, vol. 9132874, pp. 1–4, 2020. [Google Scholar]
2. T. Shelatkar, D. Urvashi, M. Shorfuzzaman, A. Alsufyani and K. Lakshmanna, “Diagnosis of brain tumor using lightweight deep learning model with fine-tuning approach,” Computational and Mathematical Methods in Medicine, vol. 2020, pp. 1–9, 2022. [Google Scholar]
3. H. Kang, H. M. Park, Y. Ahn, A. Van Messem and W. De Neve, “Towards a quantitative analysis of class activation mapping for deep learning-based computer-aided diagnosis,” Medical Imaging 2021: Image Perception, Observer Performance, and Technology Assessment, vol. 11599, pp. 119–131, 2021. [Google Scholar]
4. J. Amin, M. Sharif, A. Haldorai, M. Yasmin and R. S. Nayak, “Brain tumor detection and classification using machine learning: A comprehensive survey,” Complex & Intelligent Systems, vol. 8, pp. 3161–3183, 2021. [Google Scholar]
5. M. Viscaino, J. C. Maass, P. H. Delano, M. Torrente, C. Stott et al., “Computer-aided diagnosis of external and middle ear conditions: A machine learning approach,” PLoS One, vol. 15, no. 3, pp. 0229226, 2020. [Google Scholar]
6. T. Sadad, A. Rehman, A. Munir, T. Saba, U. Tariq et al., “Brain tumor detection and multi-classification using advanced deep learning techniques,” Microscopy Research and Technique, vol. 84, no. 6, pp. 1296–1308, 2021. [Google Scholar]
7. Z. Huang, H. Xu, S. Su, T. Wang, Y. Luo et al., “A Computer-aided diagnosis system for brain magnetic resonance imaging images using a novel differential feature neural network,” Computers in Biology and Medicine, vol. 121, pp. 103818, 2020. [Google Scholar]
8. F. J. P. Montalbo, “A Computer-aided diagnosis of brain tumors using a fine-tuned YOLO-based model with transfer learning,” KSII Transactions on Internet and Information Systems (TIIS), vol. 14, pp. 4816–4834, 2020. [Google Scholar]
9. M. E. Karar, E. E. D. Hemdan and M. A. Shouman, “Cascaded deep learning classifiers for computer-aided diagnosis of COVID-19 and pneumonia diseases in X-ray scans,” Complex & Intelligent Systems, vol. 7, no. 1, pp. 235–247, 2021. [Google Scholar]
10. D. A. Zebari, D. A. Ibrahim, D. Q. Zeebaree, H. Haron, M. S. Salih et al., “Systematic review of computing approaches for breast cancer detection based computer-aided diagnosis using mammogram images,” Applied Artificial Intelligence, vol. 35, no. 15, pp. 2157–2203, 2021. [Google Scholar]
11. R. Singh, A. Goeland and D. K. Raghuvanshi, “Computer-aided diagnostic network for brain tumor classification employing modulated Gabor filter banks,” The Visual Computer, vol. 37, no. 8, pp. 2157–2171, 2021. [Google Scholar]
12. M. Rasool, N. A. Ismail, W. Boulila, A. Ammar, H. Samma et al., “A hybrid deep learning model for brain tumor classification,” Entropy, vol. 24, no. 6, pp. 799–814, 2022. [Google Scholar]
13. B. Amarapur, “Computer-aided diagnosis applied to MRI images of brain tumor using cognition based modified level set and optimized ANN classifier,” Multimedia Tools and Applications, vol. 79, no. 5, pp. 3571–3599, 2020. [Google Scholar]
14. N. Noreen, S. Palaniappan, A. Qayyum, I. Ahmad, M. Imran et al., “A deep learning model based on concatenation approach for the diagnosis of brain tumor,” IEEE Access, vol. 8, pp. 55135–55144, 2020. [Google Scholar]
15. G. S. Sunsuhi, “Computer-aided diagnosis for brain tumor segmentation using fine-tuned convolutional neural network,” in Proc. Int. Conf. on Sustainable Computing and Data Communication Systems (ICSCDS), Erode, India, vol. 9760835, pp. 502–508, 2022. [Google Scholar]
16. M. Sajjad, S. Khan, K. Muhammad, A. Wu, A. Ullah et al., “Multi-grade brain tumor classification using deep CNN with extensive data augmentation,” Journal of Computational Science, vol. 30, pp. 174–182, 2019. [Google Scholar]
17. S. Sajid, S. Hussain and A. Sarwar, “Brain tumor detection and segmentation in MR images using deep learning,” Arabian Journal for Science and Engineering, vol. 44, no. 11, pp. 9249–9261, 2019. [Google Scholar]
18. F. P. Polly, S. K. Shil, M. A. Hossain, A. Ayman and Y. M. Jang, “Detection and classification of HGG and LGG brain tumor using machine learning,” in Proc. Int. Conf. on Information Networking (ICOIN), Chiang Mai, Thailand, vol. 8343231, pp. 813–817, 2018. [Google Scholar]
19. R. Sampath and M. Baskar, “3D brain image based Alzheimer’s disease detection techniques using fish swarm optimizer’s deep convolution Siamese neural network,” Expert Systems, vol. 39, no. 9, pp. 1–19, 2022. [Google Scholar]
20. P. Upadhyay and J. K. Chhabra, “Kapur’s entropy based optimal multilevel image segmentation using crow search algorithm,” Applied Soft Computing, vol. 97, pp. 105522, 2020. [Google Scholar]
21. R. M. Adnan, O. Kisi, R. R. Mostafa, A. N. Ahmed and A. El-Shafie, “The potential of a novel support vector machine trained with a modified mayfly optimization algorithm for streamflow prediction,” Hydrological Sciences Journal, vol. 67, no. 2, pp. 161–174, 2022. [Google Scholar]
22. S. J. Narayanan, R. Soundrapandiyan, B. Perumal and C. J. Baby, “Emphysema medical image classification using fuzzy decision tree with fuzzy particle swarm optimization clustering,” Smart Intelligent Computing and Applications, vol. 104, pp. 305–313, 2019. [Google Scholar]
23. H. Tao, M. Habib, I. Aljarah, H. Faris, H. A. Afan et al., “An intelligent evolutionary extreme gradient boosting algorithm development for modelling scour depths under submerged weir,” Information Sciences, vol. 570, pp. 172–184, 2021. [Google Scholar]
24. M. Arif, F. Ajesh, S. Shamsudheen, O. Geman, D. Izdrui et al., “Brain tumor detection and classification by MRI using biologically inspired orthogonal wavelet transform and deep learning techniques,” Journal of Healthcare Engineering, vol. 2022, pp. 1–18, 2022. [Google Scholar]
25. J. Jeyabharathi, N. G. Praveena, V. Sindhuja, M. Sreevani, R. Walia et al., “Approach to the genetic algorithm for segmenting and analysing medical images,” International Journal of Biology, Pharmacy and Allied Sciences, vol. 10, no. 11, pp. 715–724, 2021. [Google Scholar]
26. N. Aishwarya, N. G. Praveena, B. Rajalakshmi, R. Reshma, B. Rizwana Begam et al., “Detection of brain tumor by image fusion based on convolution neural network,” International Journal of Advanced Science and Technology, vol. 29, no. 6, pp. 6500–6509, 2020. [Google Scholar]
27. D. Prabakaran and K. Sheela, “A strong authentication for fortifying wireless healthcare sensor network using elliptical curve cryptography,” in 2021 IEEE Mysore Sub Section Int. Conf, Mysuru, India, vol. 2021, pp. 249–254, 2021. [Google Scholar]
28. Y. N. Wang, S. Z. Yang, M. Y. Lin, H. Nan and M. H. Yang, “Color image encryption algorithm based on DNA code and alternating quantum random walk,” Acta PhysicaSinica, vol. 70, no. 23, pp. 1–15, 2021. [Google Scholar]
Cite This Article
 Copyright © 2023 The Author(s). Published by Tech Science Press.
This work is licensed under a Creative Commons Attribution 4.0 International License , which permits unrestricted use, distribution, and reproduction in any medium, provided the original work is properly cited.
 Downloads
 Citation Tools