
 Submit a Paper
 Propose a Special lssue
 Open Access
ARTICLE

Computer-Aided Diagnosis for Tuberculosis Classification with Water Strider Optimization Algorithm
1 Department of Computational Science and Electronic, Universidad de la Costa, CUC, Barranquilla, 080002, Colombia
2 Biomedical Engineering Program, Universidad Simón Bolívar, Barranquilla, 080002, Colombia
3 Mechatronics Engineering Program, Universidad Simón Bolívar, Barranquilla, 080002, Colombia
4 Department of Medicine, Universidad del Norte, Barranquilla, 081007, Colombia
5 Department of Mathematics, Faculty of Science, New Valley University, El-Kharga, 72511, Egypt
* Corresponding Author: José Escorcia-Gutierrez. Email:
Computer Systems Science and Engineering 2023, 46(2), 1337-1353. https://doi.org/10.32604/csse.2023.035253
Received 13 August 2022; Accepted 28 October 2022; Issue published 09 February 2023
 View Full Text
 Download PDF
Abstract
Computer-aided diagnosis (CAD) models exploit artificial intelligence (AI) for chest X-ray (CXR) examination to identify the presence of tuberculosis (TB) and can improve the feasibility and performance of CXR for TB screening and triage. At the same time, CXR interpretation is a time-consuming and subjective process. Furthermore, high resemblance among the radiological patterns of TB and other lung diseases can result in misdiagnosis. Therefore, computer-aided diagnosis (CAD) models using machine learning (ML) and deep learning (DL) can be designed for screening TB accurately. With this motivation, this article develops a Water Strider Optimization with Deep Transfer Learning Enabled Tuberculosis Classification (WSODTL-TBC) model on Chest X-rays (CXR). The presented WSODTL-TBC model aims to detect and classify TB on CXR images. Primarily, the WSODTL-TBC model undergoes image filtering techniques to discard the noise content and U-Net-based image segmentation. Besides, a pre-trained residual network with a two-dimensional convolutional neural network (2D-CNN) model is applied to extract feature vectors. In addition, the WSO algorithm with long short-term memory (LSTM) model was employed for identifying and classifying TB, where the WSO algorithm is applied as a hyperparameter optimizer of the LSTM methodology, showing the novelty of the work. The performance validation of the presented WSODTL-TBC model is carried out on the benchmark dataset, and the outcomes were investigated in many aspects. The experimental development pointed out the betterment of the WSODTL-TBC model over existing algorithms.Keywords
Tuberculosis (TB) arises from the Mycobacterium bacteria that frequently affect the lungs and other parts of their bodies (extrapulmonary). As a result of misdiagnosis, lack of appropriate treatments, and diagnostic delay, many TB patients have lost their lives yearly. Even though TB is a global problem, the mortality rate is increasingly common in lower and middle-income countries [1]. TB has certainly curable when it is detected early for proper treatment. Earlier diagnoses are crucial for preventing more spread, decreasing mortality rates, and successful treatment according to the World Health Organization (WHO) End TB approach. The golden rule for TB screening is Sputum culture [2]. Nevertheless, posterior-anterior chest X-rays (CXR) are a powerful method with moderately low and low-cost radiation dosages for lung abnormality screening to accomplish prompt outcomes. Simultaneously, the application was restricted from developed countries, whereas TB is more common [3]. The higher TB burden region lacks the professional and skilled radiological experts to interpret CXR images adequately.
Computed tomography (CT) is regarded as the most standard TB recognition methodology [4]. For many of the prior cases, TB prognosis can be confirmed through chest X-rays (CXRs) provided the radiation dose, cost, accessibility, and the capability for revealing the unpredicted pathological changes between TB recognition techniques [5]. For centuries, authors have concentrated on advancing a computer-aided detection (CAD) module for the early prognosis of TB-based syndromes through medical imaging. At the initial levels, CAD is a reliable rule-oriented system for selecting and extracting valuable pathogenic characteristics in images to earn useful quantitative insight; still, these methodologies are time-consuming and demand mainly the artificial abstraction of paradigms with helpful information [6]. As the appearance of numerous ailments mainly covers a very small section of the whole image, the difficulty faced in the feature detection procedure is rapidly compounded. Additionally, with increasing therapeutic image data and growing alterations of the syndrome, issues like lousy transferability between distinct datasets and unbalanced execution regarding afresh produced data have halted the CAD method from framing a reasonable decision having more accuracy [7].
With the advent of developments in deep learning (DL), the convolutional neural network (CNN) has constantly exceeded classical recognition systems in attaining superordinate acts for image-related categorization and identification issues [8–10]. The superlative capability to mechanically abstract valuable features from the inherent features of data creates CNN the primary choice for complicated medical problems resolving [11–13]. Theretofore, CAD systems entrenched with DL methods function effectively for medical disease recognition by producing a variety of high-quality diagnostic resolutions by underlining suspicious characteristics in different fields of medical imaging [14–16].
The researchers in [17] discover transfer learning (TL) ’s utility in medical imaging for TB recognition. The researchers depict an enhanced methodology for TL on the general technique of utilizing ImageNet weights. They found the lower-level features obtained by ImageNet weights were useless for imaging tasking for modalities such as X-rays. They further suggest a brand-new methodology to acquire low-level features by drilling the systems in a multiclass multilabel state. The research scholars in [18] intended to leverage DL for detecting TB in chest radiograms in yearly health analysis facts of workers and comparing the executions of CNNs depending on image (I-CNN) and CNN’s having demographic variables (D-CNN). For TB, D-CNN and I-CNN methods are trained on 1,000 chest X-ray images, negative and positive.
Hijazi et al. [19] grant a collaborative DL for TB recognition with the help of canny edge detected and chest x-ray images. The abovementioned methodology presents a novel kind of feature for the TB recognition classifiers raising the errors of base classifiers. The primary feature set can be derived from the novel x-ray images, whereas the secondary feature sets are from the edge detection images. In [20], the authors suggested a method for TB screening utilizing Chest X-ray images in which the decision to get through 3 base learners was merged with a type-1 Sugeno fuzzy integral related ensemble approach. Fuzzy measures needed under this fuzzy integral-related ensembling methodology were fixed by experimentation in numerous advanced works. To address this manual tuning, the researchers employed meta-heuristic optimization systems to optimally improve the fuzzy measures during training.
In [21], the researchers suggest pre-processing and voting variations-related ensemble CNN methods for TB recognition. The researchers use 40 diverse variations in finely tuned CNN methodologies based on Xception and InceptionV3 through contrast-limited-adaptive-histogram-equalization (CLAHE) pre-processing method [22] and ten different image transformations for data augmentation kinds. Later examining all such grouping schemes, 3 or 5 best classifier systems were chosen as base learners for voting functions. Hwa et al. [23] performed TB recognition utilizing DL, and contrast-enhanced-canny-edge-detected (CEED-Canny) x-ray images are provided. The CEED-Canny generates pulmonary x-ray edge-detected images of two procedures of features produced; the initial one is derived from the Enhanced x-ray imageries, whereas another is from the edge-detected imageries. The presented feature difference raised the variety of mistakes of the base classifiers and enhanced the TB recognition. The authors in [24] proposed a novel hybrid method to classify TB on CXR images using the MobileNet model. In addition, the Artificial Ecosystem-based Optimization (AEO) algorithm is a feature selector.
This article develops a Water Strider Optimization with Deep Transfer Learning Enabled Tuberculosis Classification (WSODTL-TBC) model on CXRs. The presented WSODTL-TBC model undergoes image filtering techniques to discard the noise content and U-Net-based image segmentation. Besides, a pre-trained residual network with a two-dimensional convolutional neural network (2D-CNN) model is applied to extract feature vectors. In addition, the WSO algorithm with long short-term memory (LSTM) model was employed to identify and classify TB where the WSO algorithm is applied as a hyperparameter optimizer of the LSTM algorithm. The performance validation of the presented WSODTL-TBC model is carried out on the benchmark dataset, and the results are investigated in several aspects.
The rest of the paper is arranged as follows. Section 2 elaborates on the presented WSODTL-TBC model. Section 3 provides a detailed result analysis of the proposed model. Finally, Section 4 draws the concluding remarks of the study.
This study established a novel WSODTL-TBC model to identify TB on CXR images. Fig. 1 demonstrates the overall process of the WSODTL-TBC algorithm. Initially, the WSODTL-TBC model receives CXR images as input. It undergoes an image filtering technique to remove the noise, and the U-Net-based image segmentation technique is utilized to identify the affected regions in the CXR images. Followed by the pre-trained ResNet with a 2D-CNN model applied to extract feature vectors. Then, the extracted feature vectors are passed into the LSTM model for the recognition and classification of TB. Since hyperparameters significantly affect the performance of the LSTM model, implementing the WSO algorithm as a hyperparameter optimizer in the final stage determines a more efficient LSTM model.
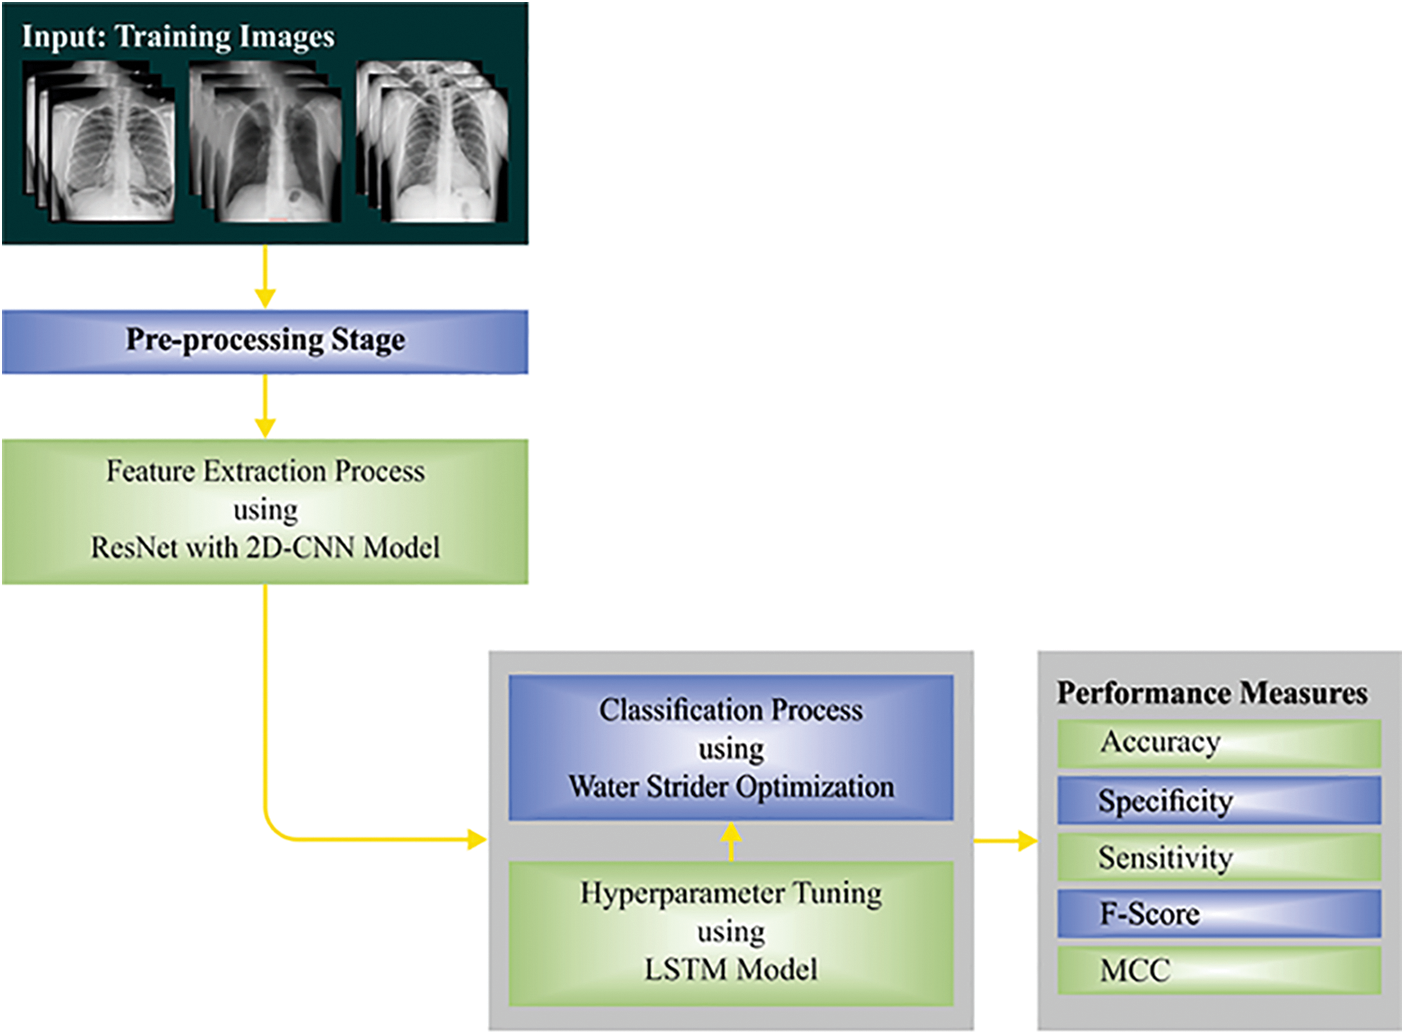
Figure 1: Overall process of WSODTL-TBC approach
Initially, the median filtering (MF) technique is utilized to discard the noise present in the CXR images. It works similarly to mean filtering by moving with the image on a pixel basis but substituting every pixel value with the median value of the adjacent pixel values. Every pixel value in the pattern of neighboring values is arranged numerically, and the pixel being treated is swapped with the median pixel value in the neighboring pixel values previously organized. It reduces noise with no minimization of the sharpness of the image.
where
2.2 U-Net-Based Image Segmentation
At this stage, the pre-processed images are fed into the U-Net model to segment the images. The performance of the DL model was severely impacted by data quality. Inappropriate features might result in a sub-optimal model and biased learning performance. As a result, it is essential to train the model and segment the lung region on the lung ROI to assist them in learning appropriate features regarding normal lungs or other indicators. The U-Net is the predominant CNN model that is utilized for accurate and precise segmentation of medical images [25]. The main benefit of U-Net is that it could manage data shortage and learn in smaller trained sets. It can be consist of a contracting or encoding path and an expanding or decoding path, carrying out pixel-wise class segmentation. The feature map from the different levels of the encoder is passed through the decoder to forecast features at different complexities and scales.
2.3 Transfer Learning-Based Feature Extraction
Once the images are segmented, the pre-trained ResNet with the 2D-CNN model is applied to extract feature vectors. In this study, we employed 2D-CNN models for classification problems. In the case of 2D images,
Further, to gain nonlinearity, ReLU and SoftMax functions are used. The activation function ReLU is formulated by the following equation:
The gradients of
where
The CNN model pooling layer is applied to output statistical analyses of the input and resizes the output shape with no data loss. There are various pooling layers, and we use the maximal pooling layer that creates the maximal value in an independently rectangular neighborhood of single point
Let
Next to the feature extraction process, the LSTM model is utilized to identify and classify TB. LSTM is a special kind of RNN that is planned for handling the vanishing or exploding problems dealt with by RNN. The LSTM, like other types of RNNs, creates its outcome dependent upon the input in the present timestep and the outcome of the initial timestep and sends the current output to the next timestep [28]. All the LSTM units contain memory cell
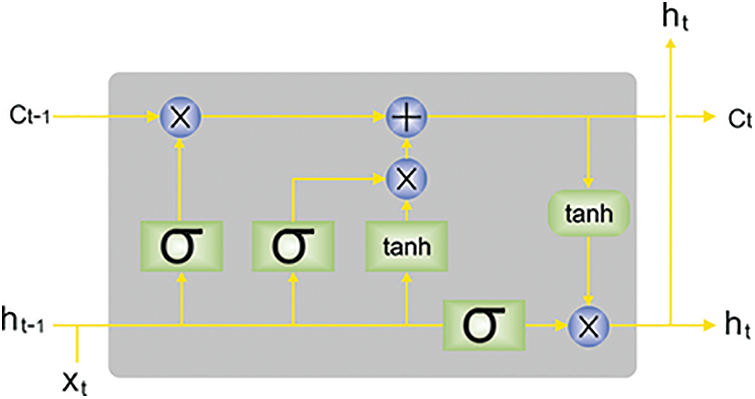
Figure 2: Architecture of LSTM (
Assume
An input gate resolves that novel data is stored by calculating
The output gate chooses that parts of cell states are outputted based on the succeeding formulas.
For capturing the future context and the previous context, BiLSTM integrates forward
In which
2.5 Hyperparameter Optimization
In this study, the WSO algorithm is applied as a hyperparameter optimizer of the LSTM model. The WSO algorithm is a metaheuristic approach, and the inspiration comes from the mating style, nature of territorial, progression of water strider (WS) bugs, feeding, and intellectual ripple interaction [29]. The mathematically modeling of the WSO algorithm has been represented as follows. The WS or candidate solution is produced arbitrarily in the searching region:
In Eq. (16), the starting location of
The length of
From the above expression, the male and female
Once the WS is present in a recently created position, the male
Let
The WSO algorithm develops a fitness function (FF) for achieving higher classifier efficacy. It solves a positive integer for demonstrating the optimal effectiveness of candidate results. The reduced classifier error rate FF is providing in Eq. (21) has been treated during this work.
The experimental validation of the WSODTL-TBC model is tested using a CXR dataset from the Kaggle repository (available at https://www.kaggle.com/datasets/tawsifurrahman/tuberculosis-tb-chest-xray-datase). The dataset holds a total of 4200 images, with 3500 images under the Normal class and 700 images under the TB class, as illustrated in Table 1. Fig. 3 shows the sample set of images produced by the different stages of the proposed model. The figures indicated that the proposed model effectually segmented and classified the images.
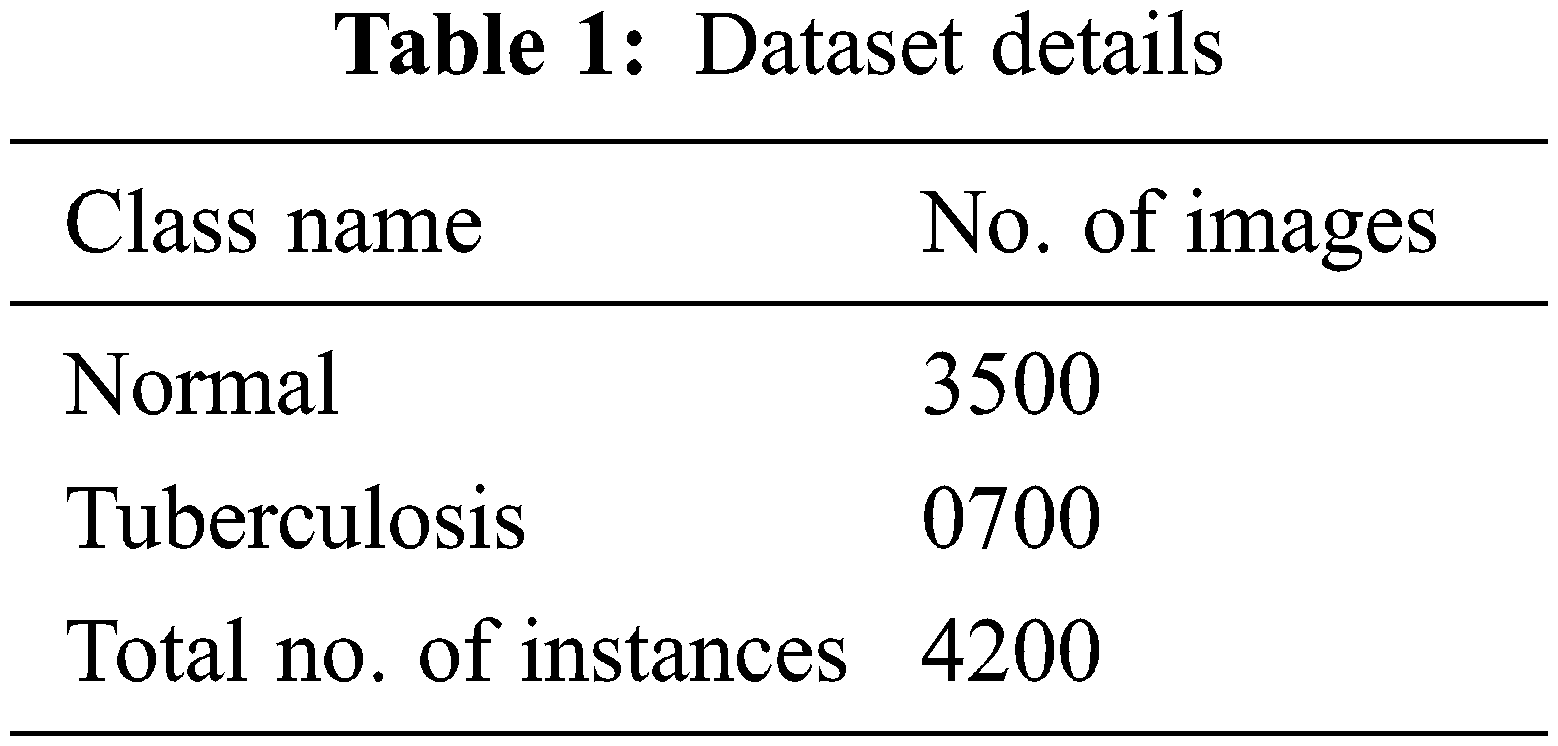
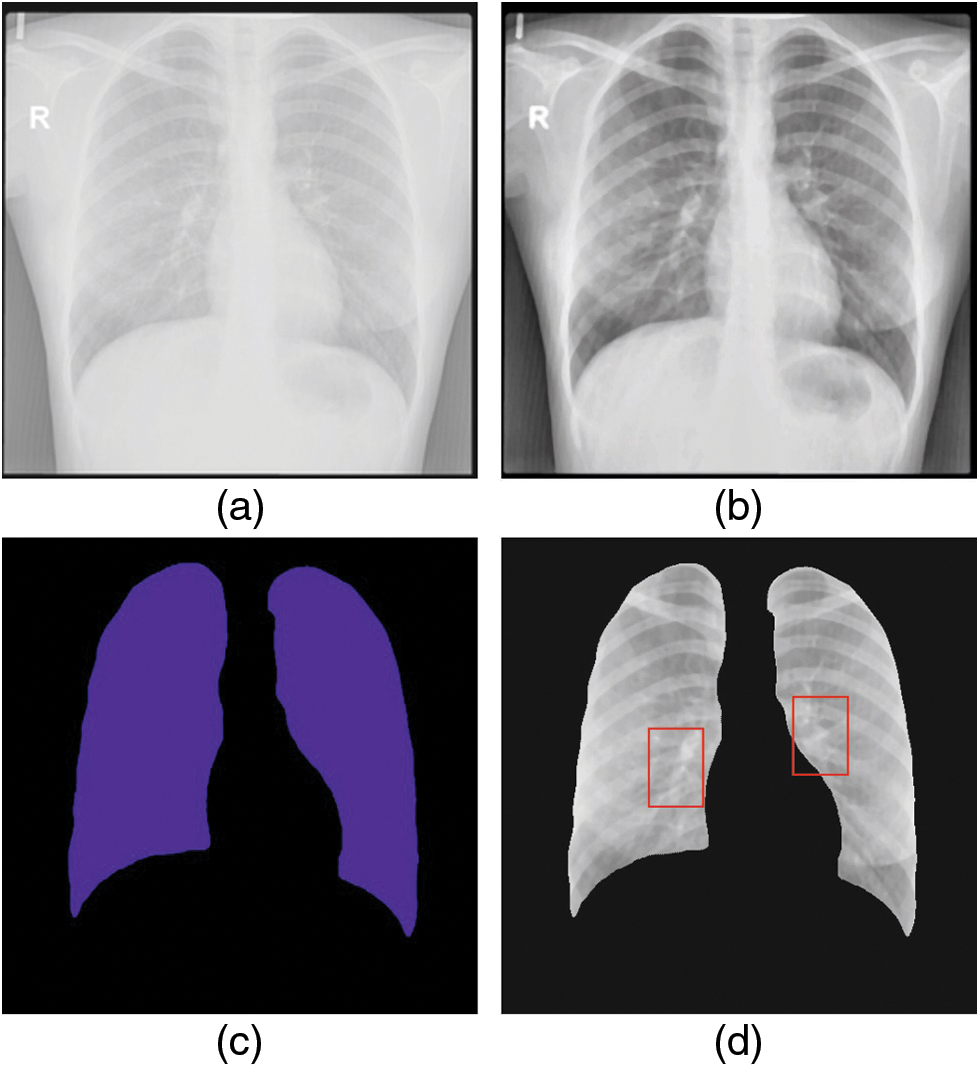
Figure 3: Sample results of WSODTL-TBC model (a) Input image, (b) Pre-processed image, (c) Segmented image, and (d) Classified image
Fig. 4 depicts the confusion matrix created by the WSODTL-TBC model on the test data. The figure implied that the WSODTL-TBC model had recognized CXR images proficiently under all epochs. For instance, with 100 epochs, the WSODTL-TBC model has categorized 3479 and 661 samples under the normal and TB classes, respectively. Moreover, with 600 epochs, it has classified 3423 and 605 samples under the the normal and TB classes, correspondingly. Moreover, with 1200 epochs, its approach has individually classified 3486 and 668 samples under the normal and the TB class.
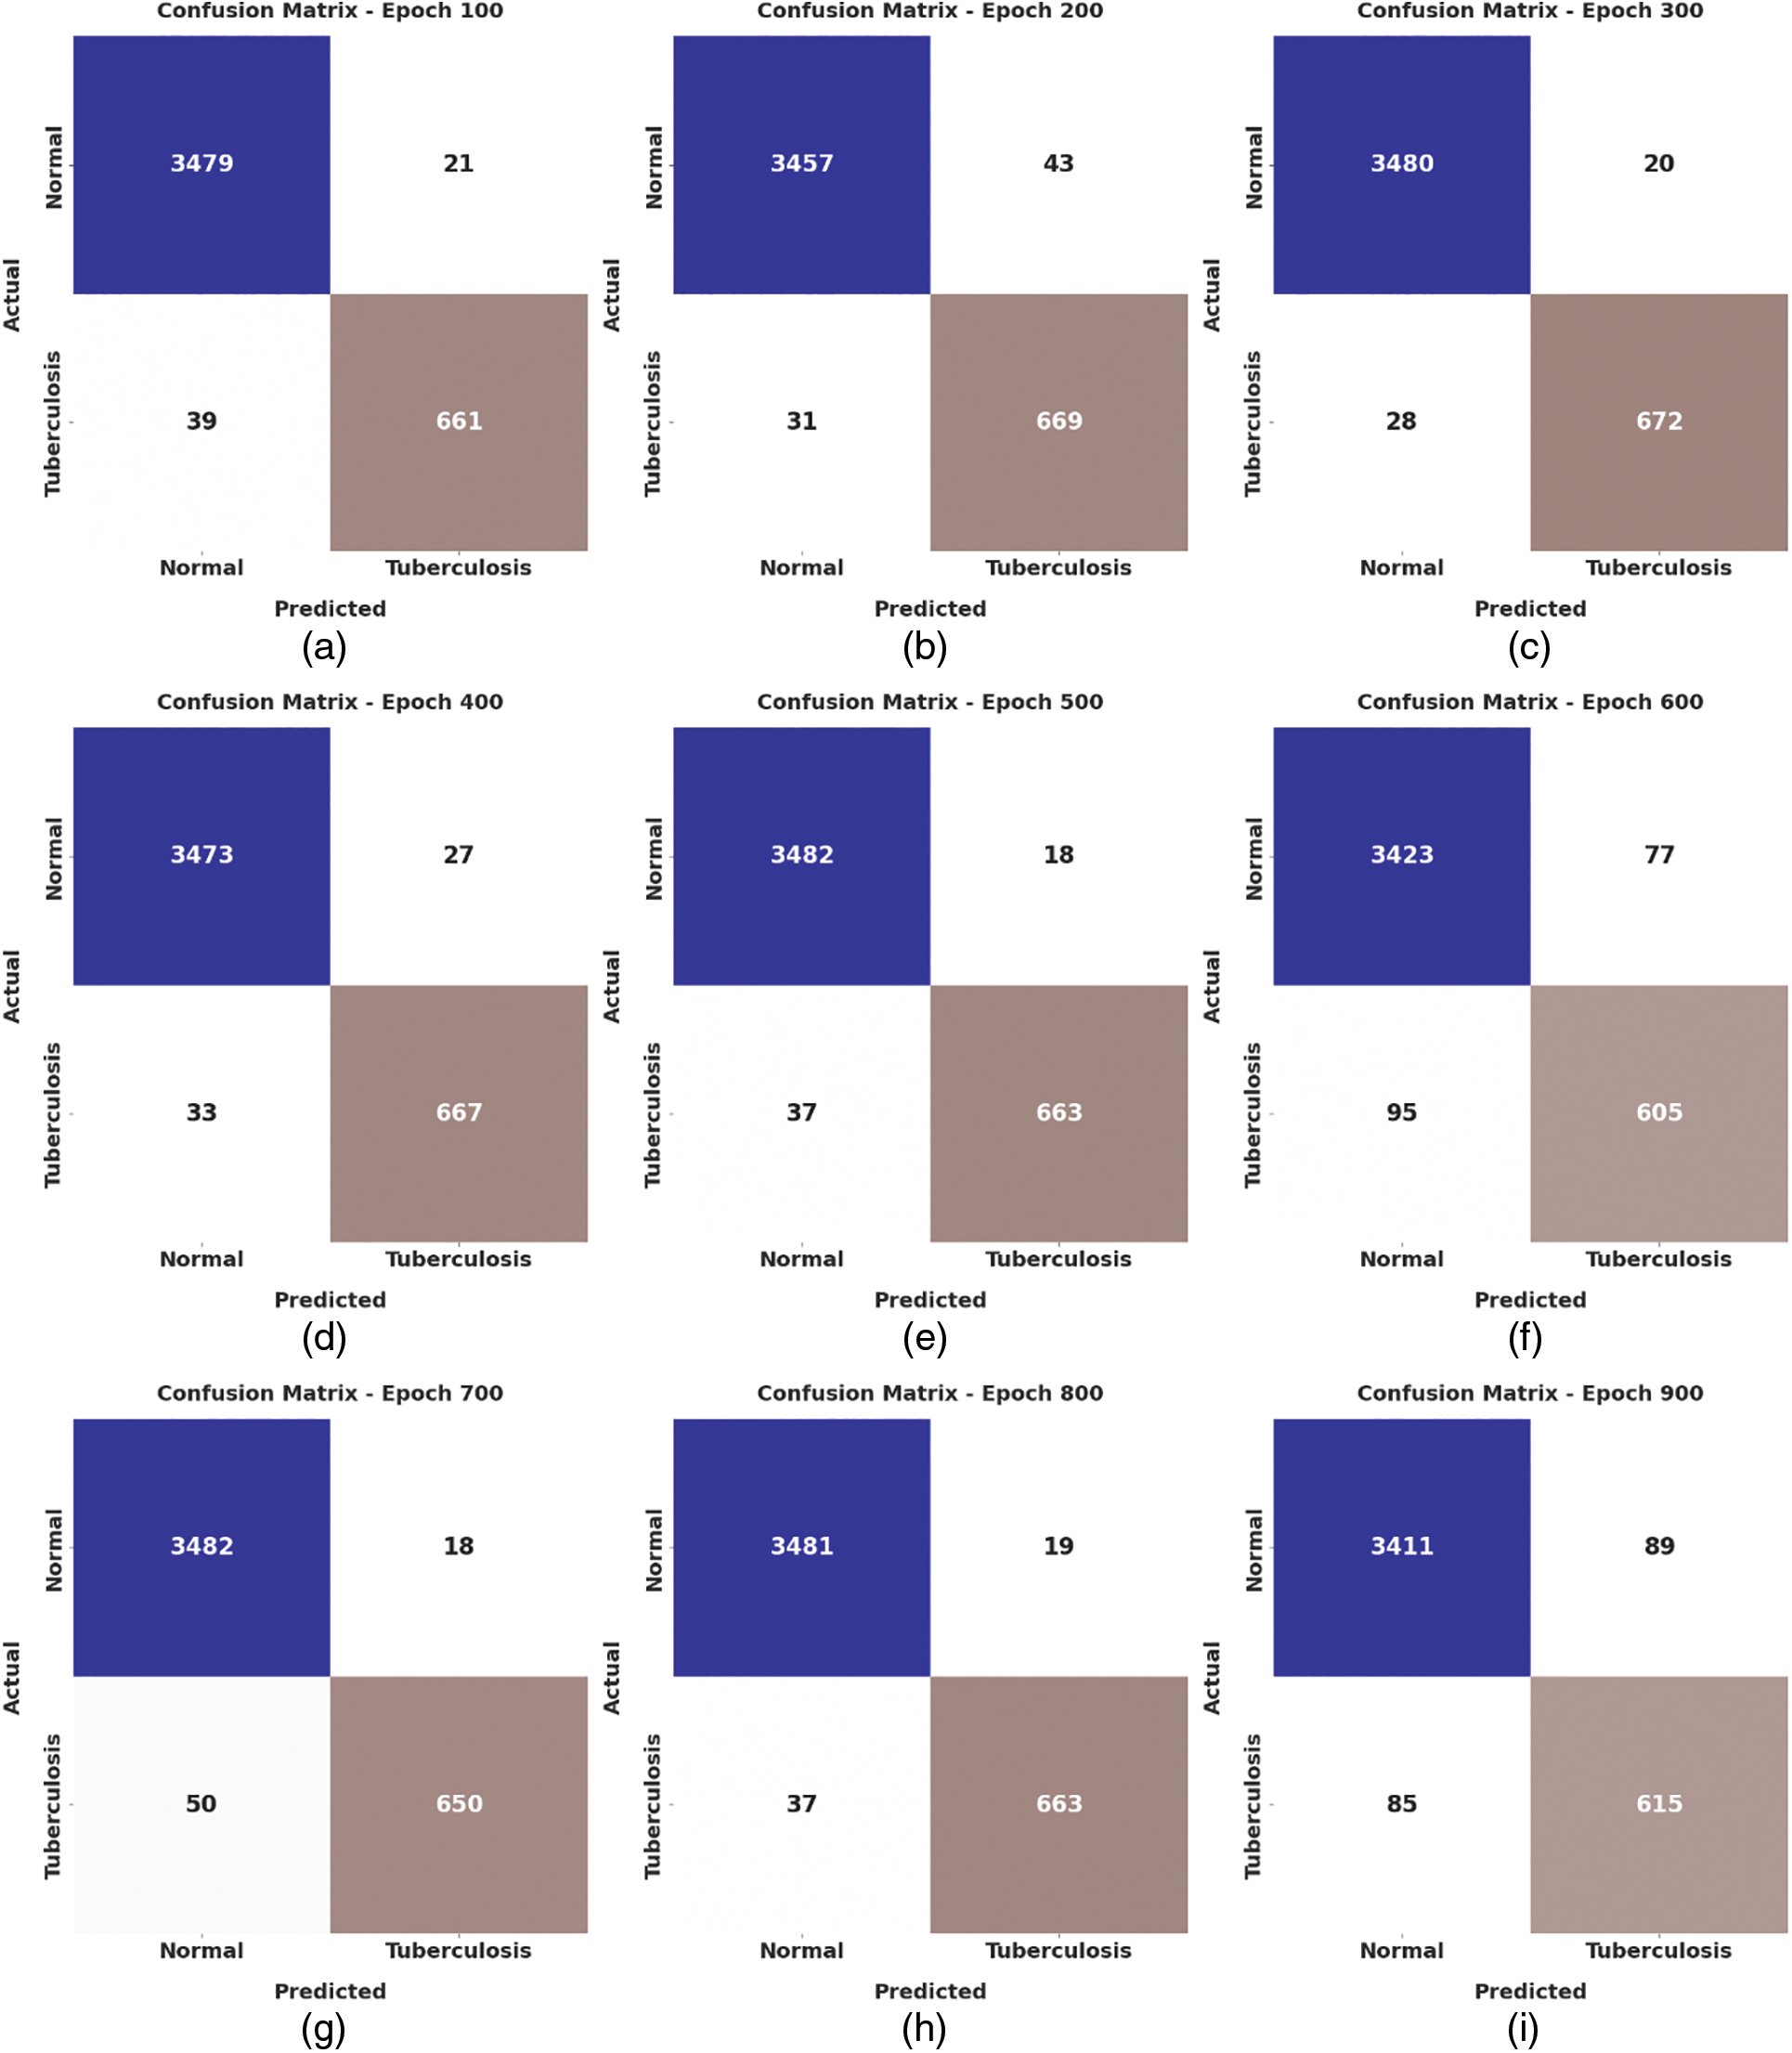
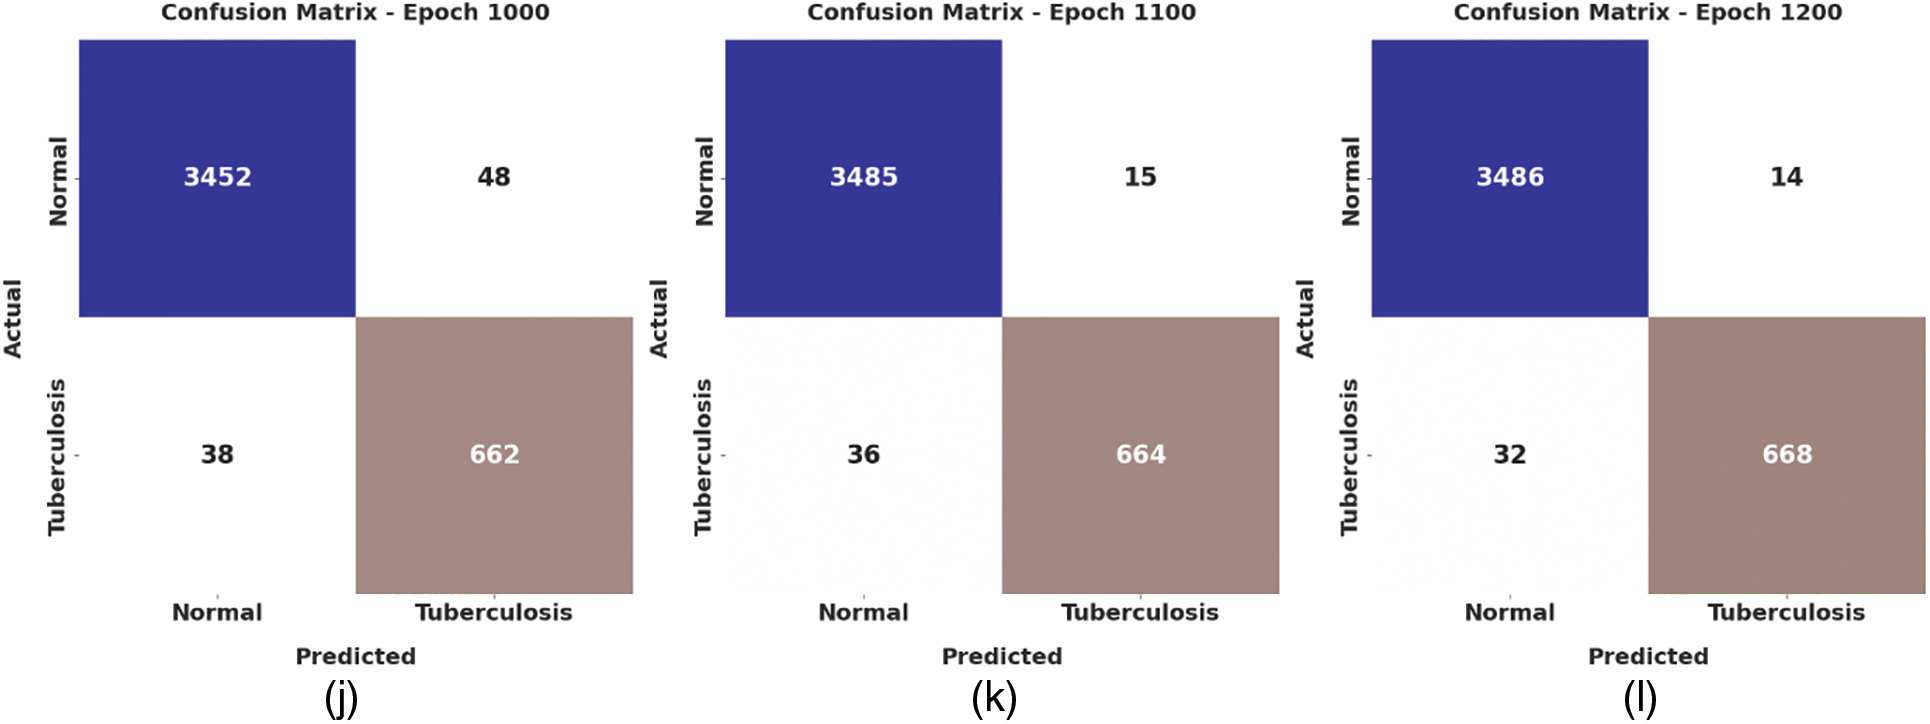
Figure 4: Confusion matrices of WSODTL-TBC approach (a) epoch 100, (b) epoch 200, (c) epoch 300, (d) epoch 400, (e) epoch 500, (f) epoch 600, (g) epoch 700, (h) epoch 800, (i) epoch 900, (j) epoch 1000, (k) epoch 1100, and (l) epoch 1200
Table 2 presents detailed TB classification outcomes of the WSODTL-TBC model under distinct epoch counts. Complementary, Fig. 5 offers a thorough average
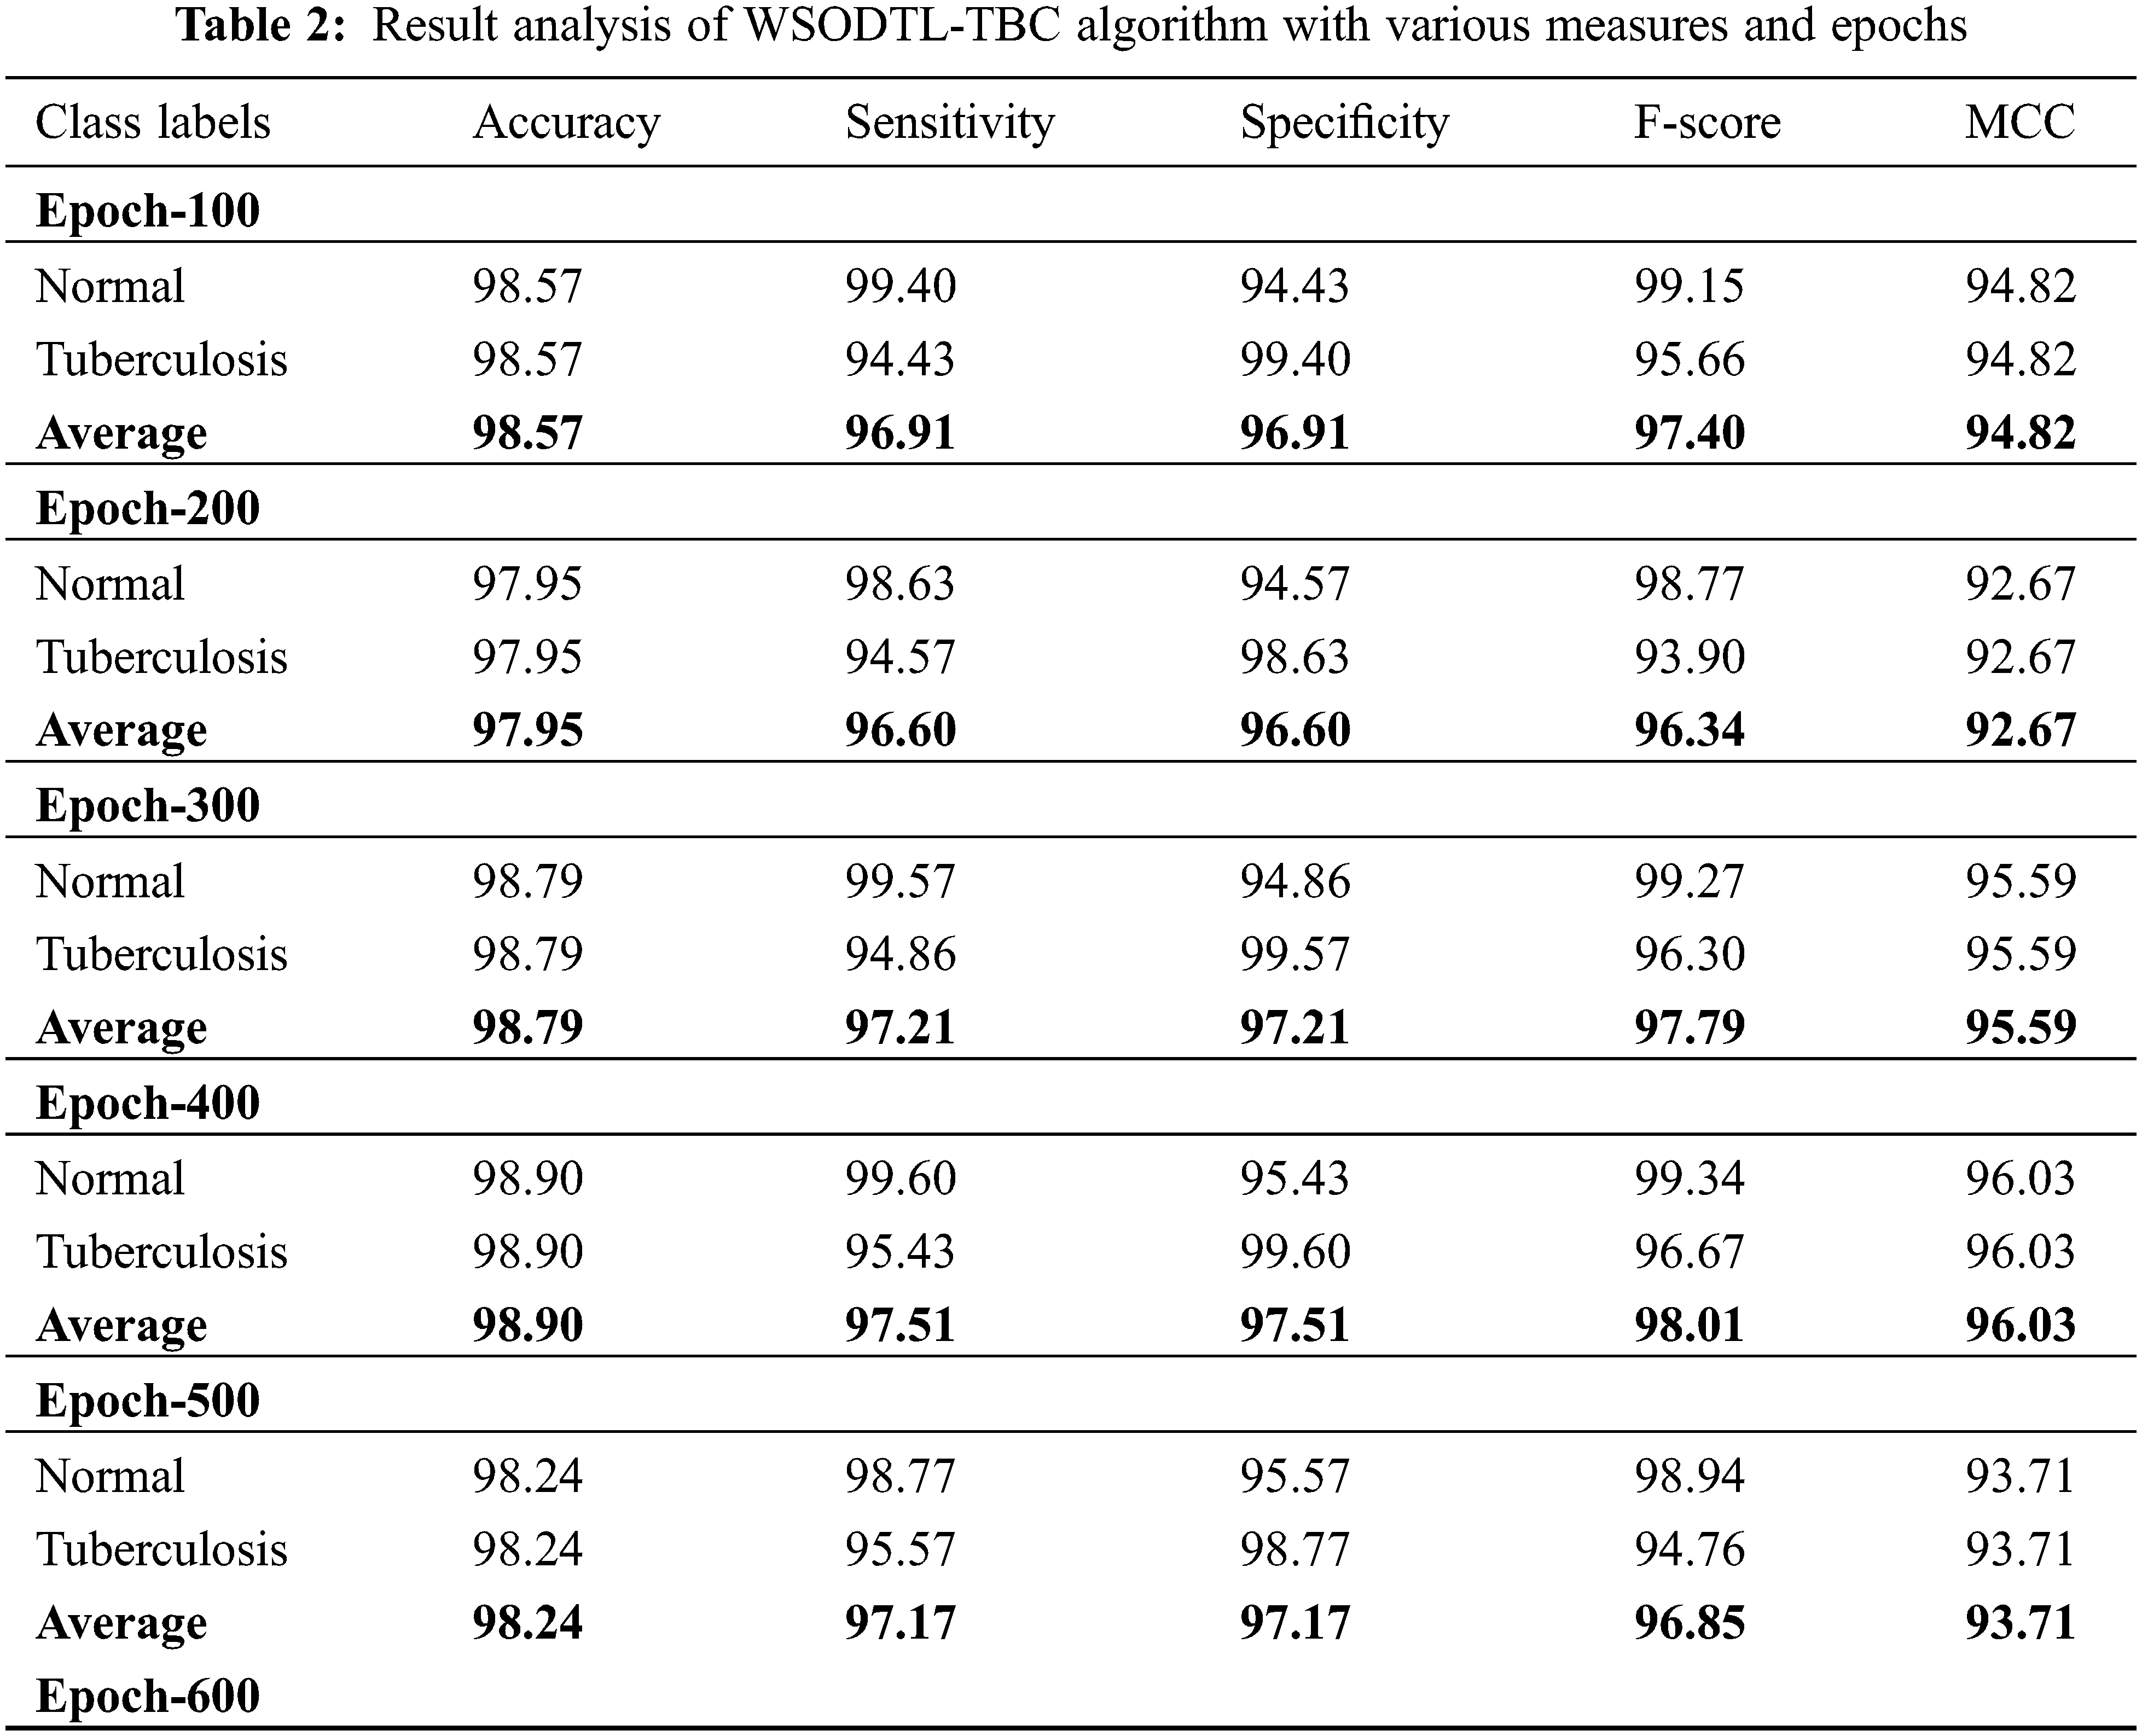
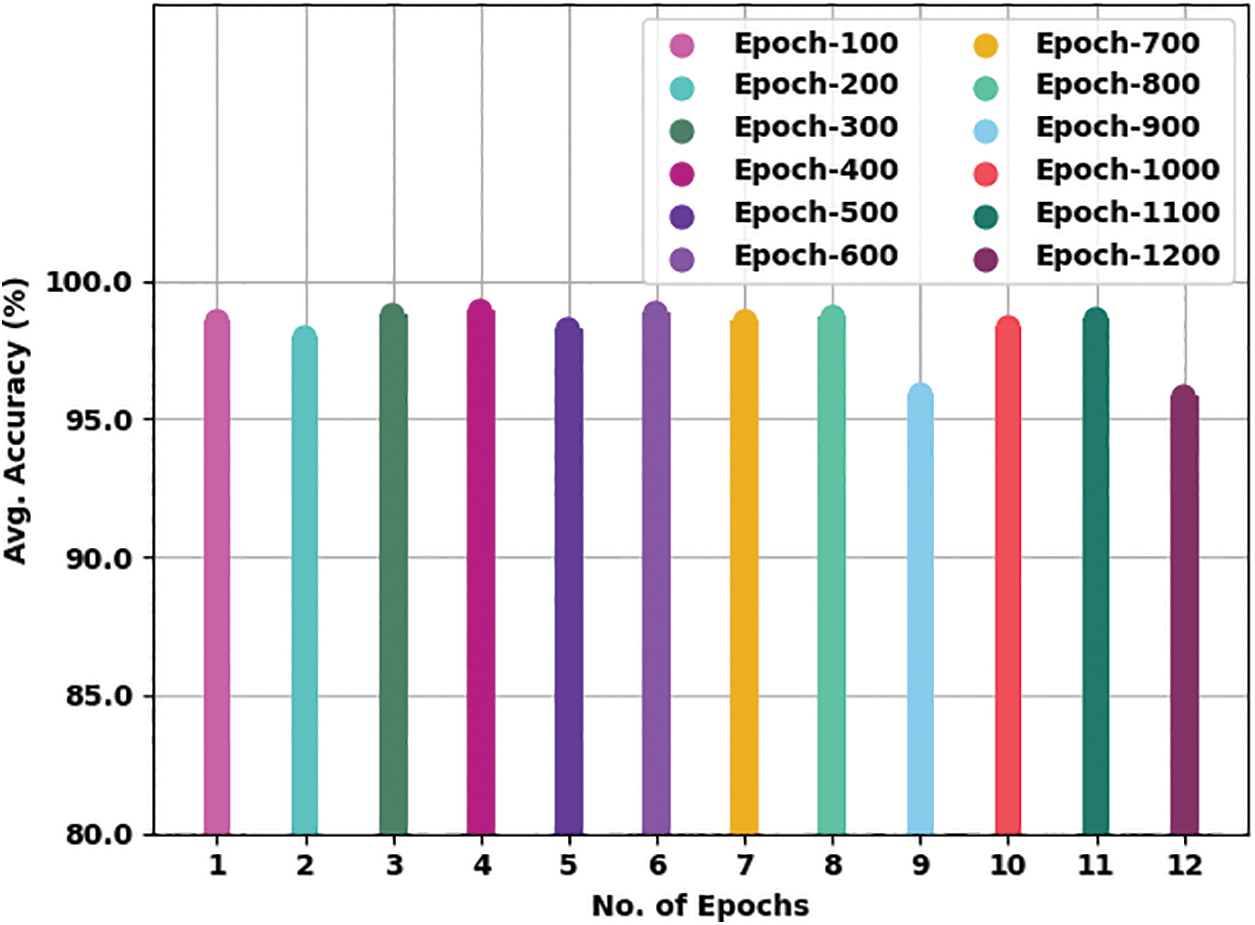
Figure 5: Average
Fig. 6 presents a brief average

Figure 6: Average
Fig. 7 offers an average
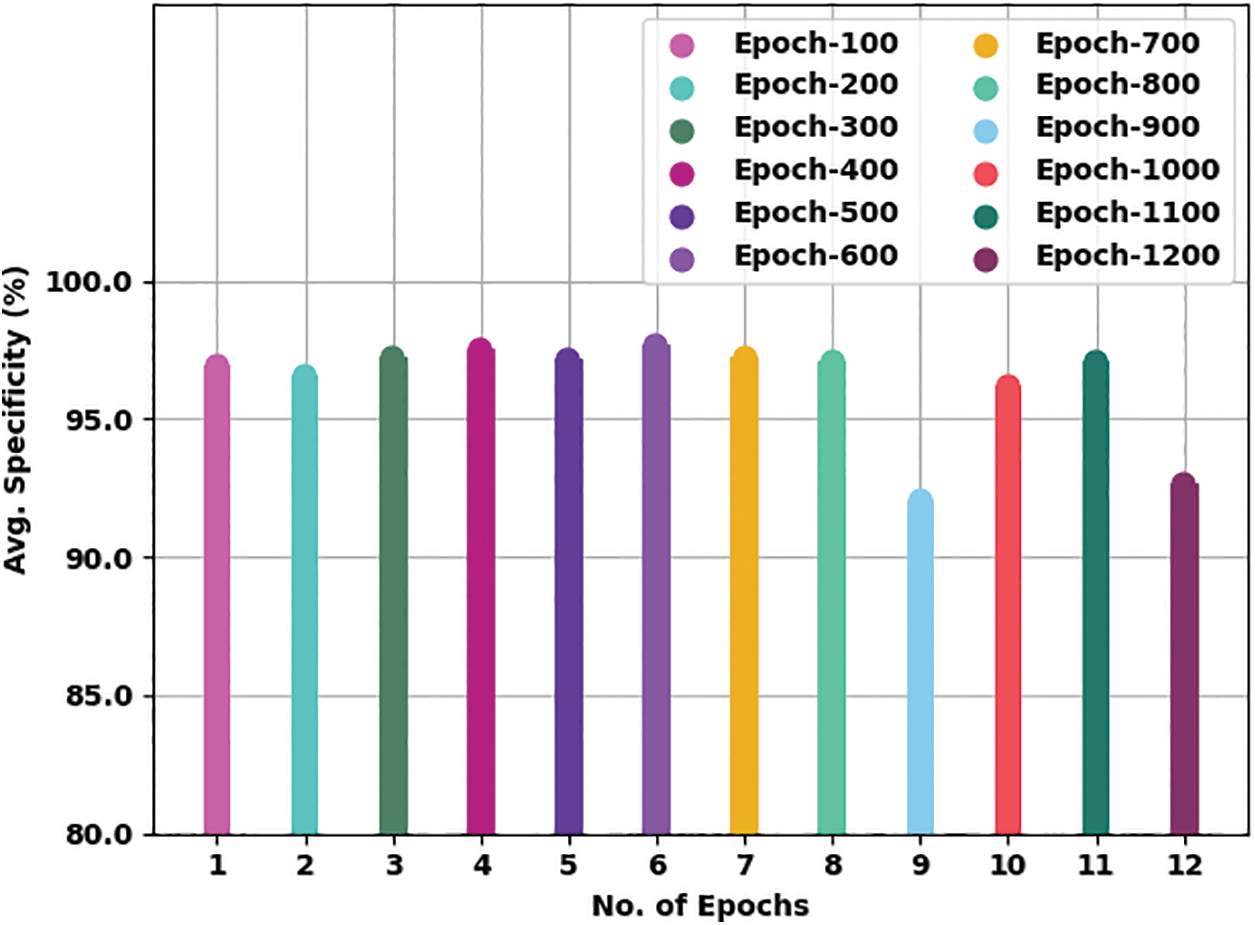
Figure 7: Average
Fig. 8 gives a comprehensive average
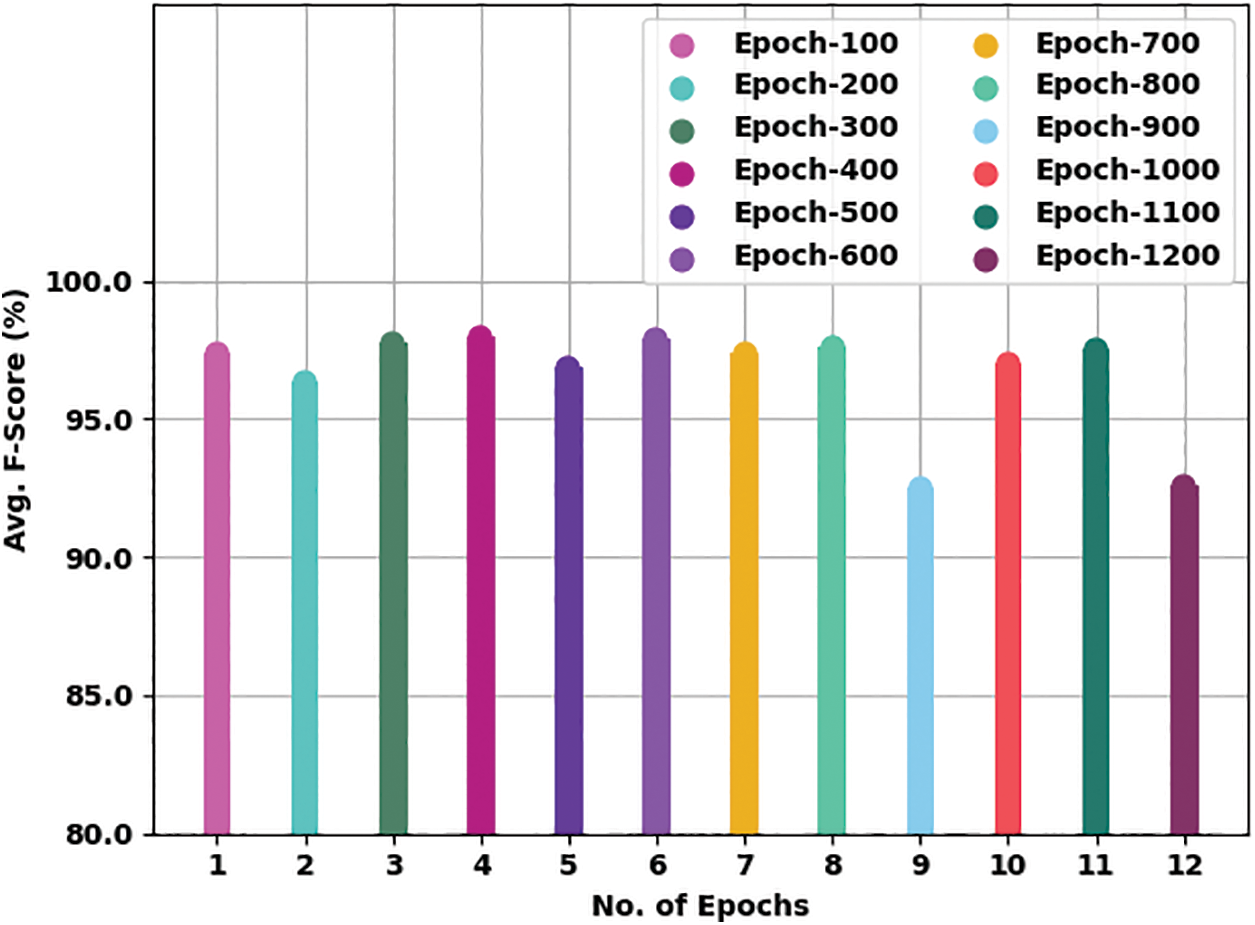
Figure 8: Average
The training accuracy (TA) and validation accuracy (VA) achieved by the WSODTL-TBC method on testing data is established in Fig. 9. The experimental result inferred that the WSODTL-TBC approach had accomplished maximal values of TA and VA. In particular, the VA appeared to be greater than TA.
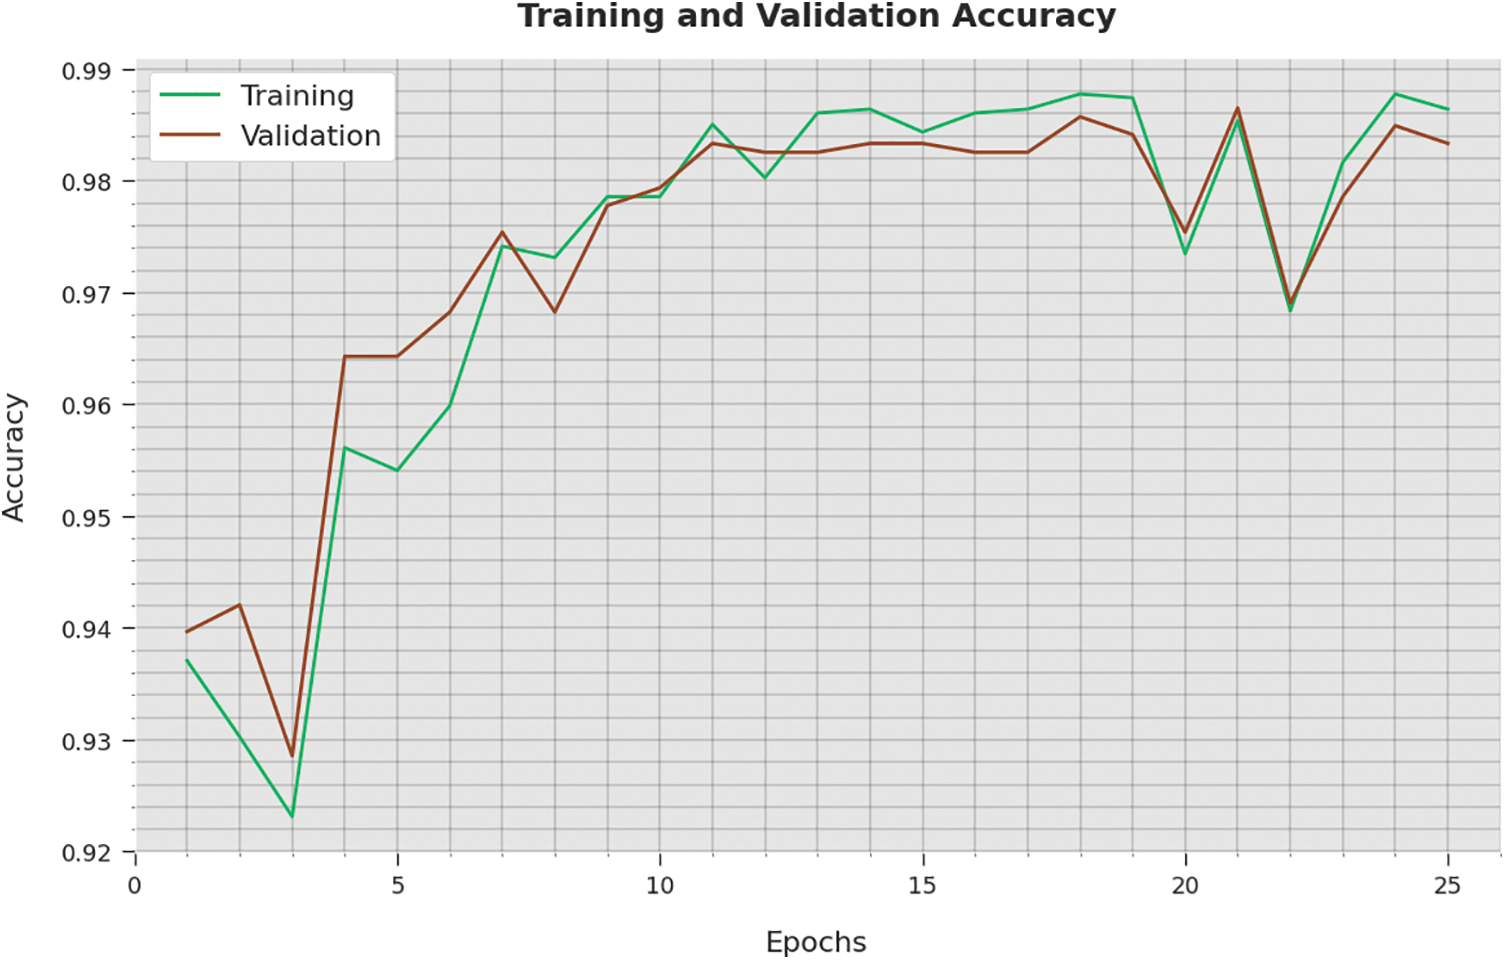
Figure 9: TA and VA analysis of the WSODTL-TBC technique
The training loss (TL) and validation loss (VL) attained by the WSODTL-TBC technique on testing data are demonstrated in Fig. 10. The experimental result implied that the WSODTL-TBC algorithm had gained minimum values of TL and VL. Specifically, the VL seems lesser than TL.
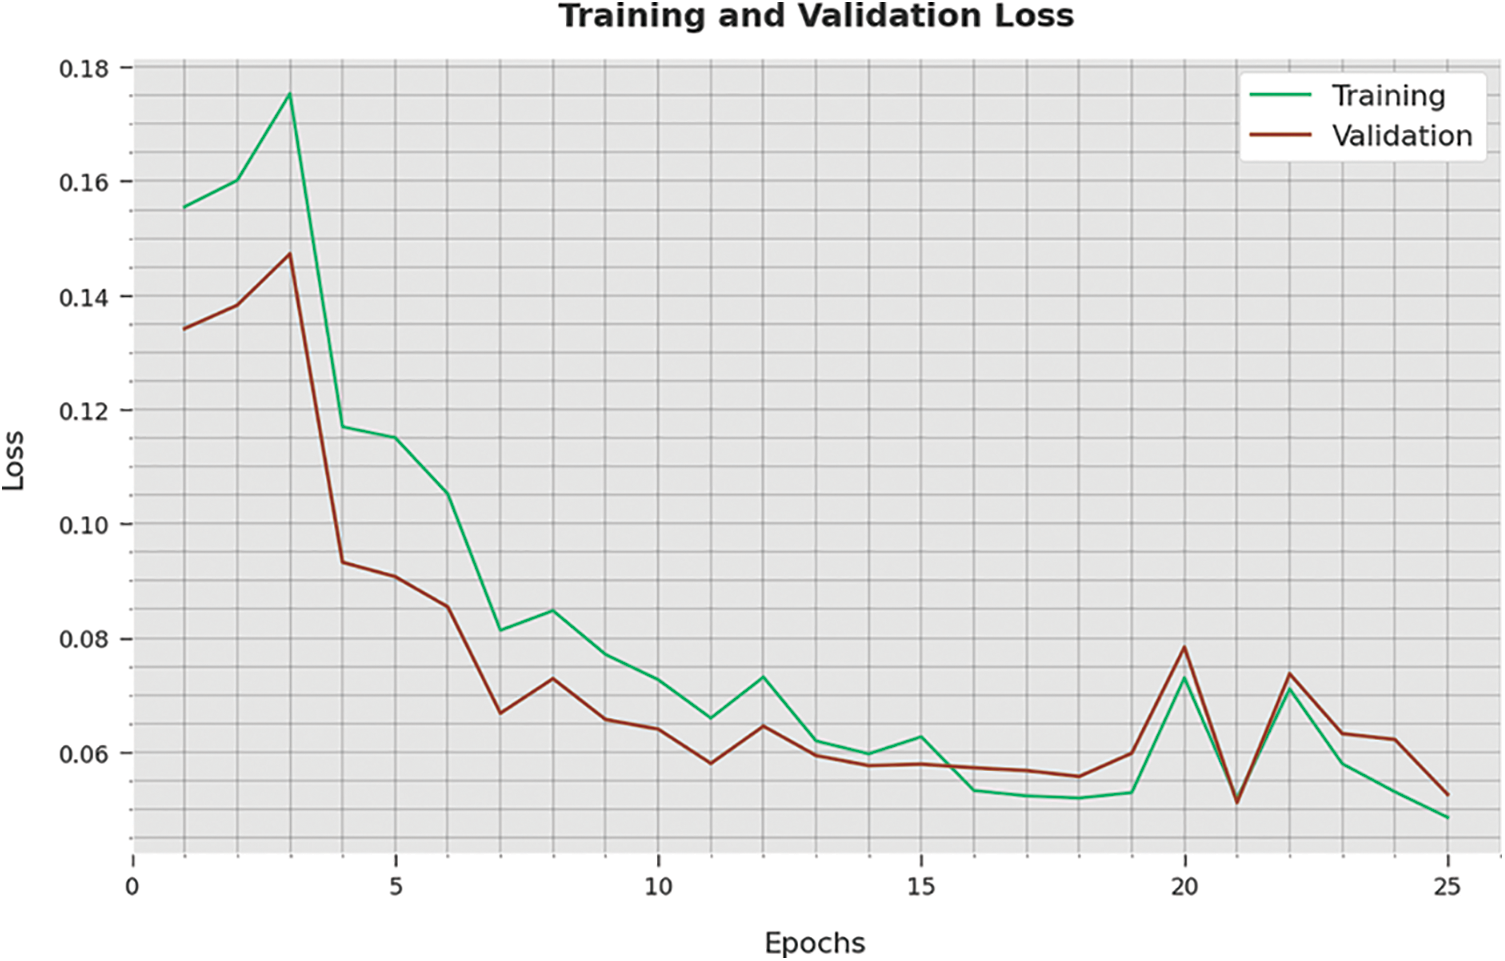
Figure 10: TA and VA analysis of the WSODTL-TBC technique
A detailed precision-recall inspection of the WSODTL-TBC approach to testing data is represented in Fig. 11. By noticing the figure, it is observed that the WSODTL-TBC algorithm has obtained maximal precision-recall performance under each class.
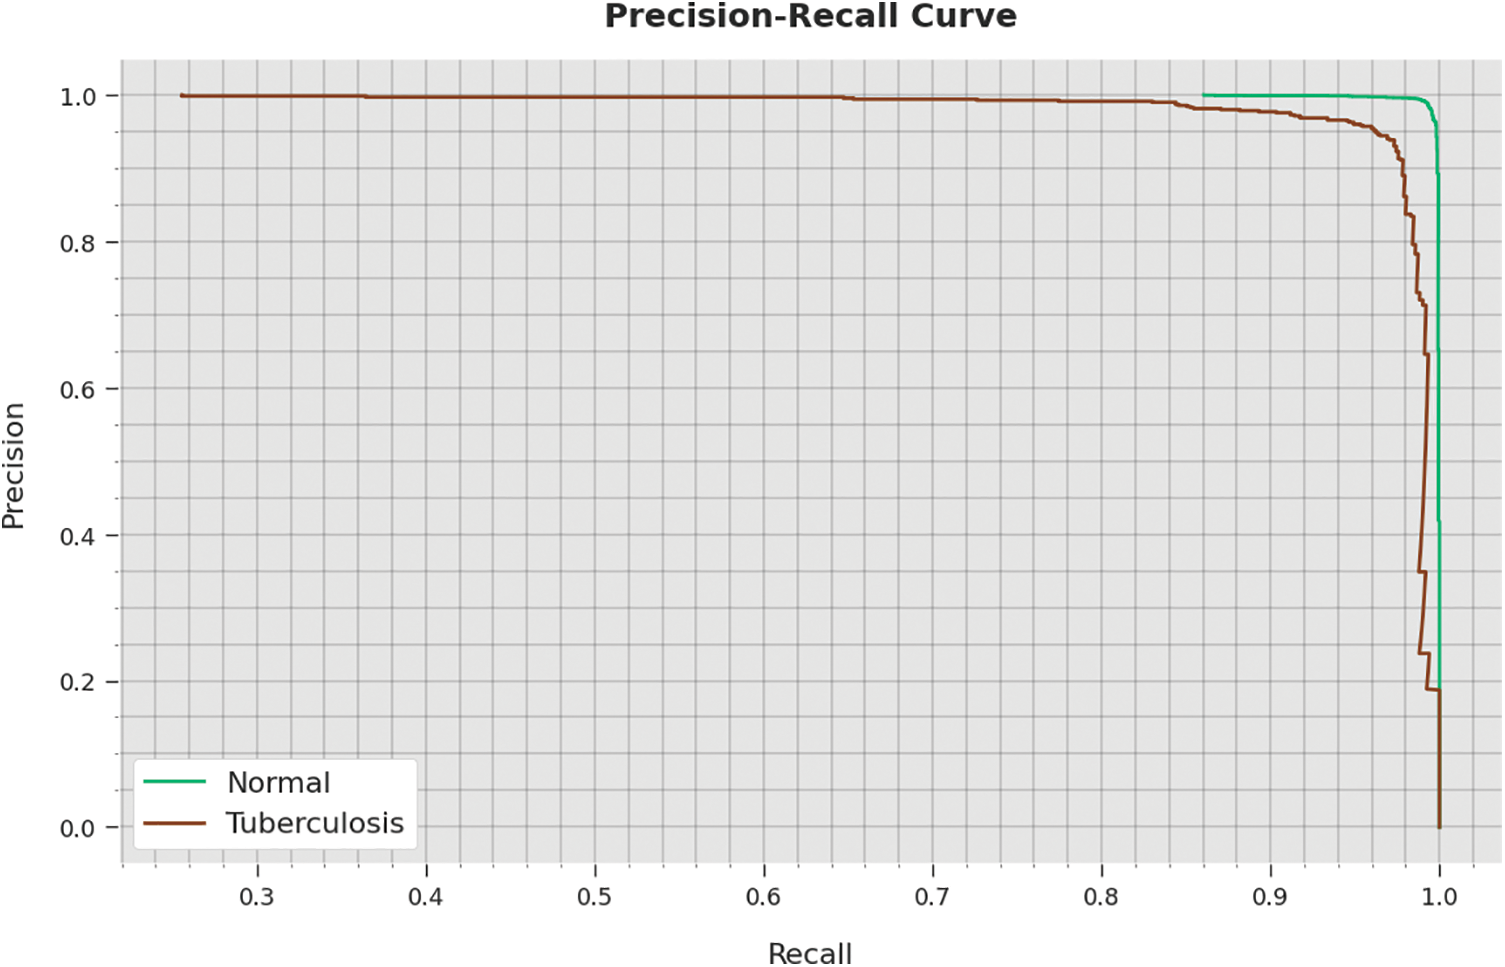
Figure 11: Precision-recall analysis of the WSODTL-TBC technique
Finally, a detailed comparative study of the WSODTL-TBC model with existing models is demonstrated in Table 3 [24]. The results implied that the WSODTL-TBC model showcased effectual outcomes over all the current models. Concerning
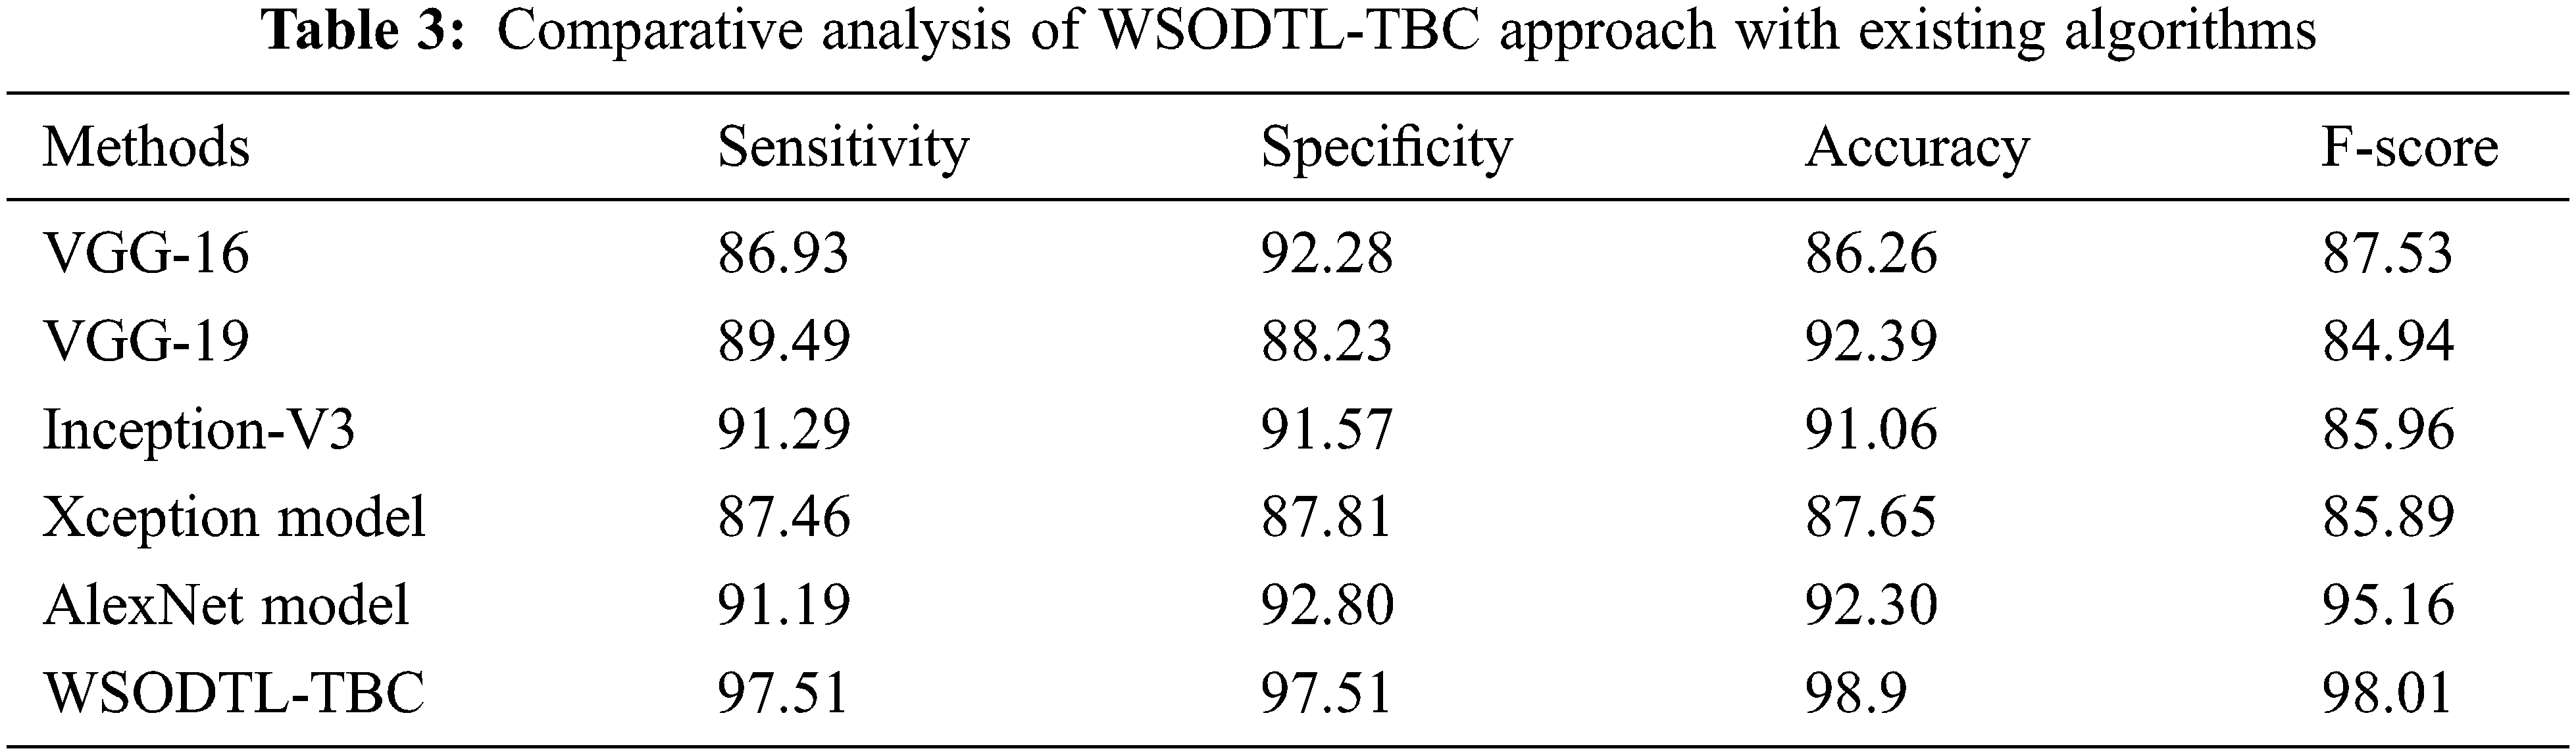
In this study, a novel WSODTL-TBC algorithm was proposed for the recognition of TB on CXR images. At the initial stage, the WSODTL-TBC model undergoes image filtering techniques for noise removal and U-Net-based image segmentation. The pre-trained ResNet with the 2D-CNN model is applied to extract feature vectors. Moreover, the WSO algorithm with the LSTM model is utilized for identifying and classifying TB, where the WSO algorithm is applied as a hyperparameter optimizer of the LSTM approach. The performance validation of the presented WSODTL-TBC algorithm is carried out on the benchmark dataset, and the outcomes are investigated in many prospects. The experimental results pointed out the betterment of the WSODTL-TBC model over existing algorithms with a maximum sensitivity of 97.51%, specificity of 97.51%, the accuracy of 98.9%, and F-score of 98.01%. Thus, the WSODTL-TBC model was applied as an effectual tool for TB categorization. In the future, the hybrid U-Net segmentation technique will enhance the WSODTL-TBC model’s overall performance. In addition, the proposed model can be implemented in a real-time healthcare environment.
Funding Statement: The authors received no specific funding for this study.
Conflicts of Interest: The authors declare that they have no conflicts of interest to report regarding the present study.
References
1. T. Rahman, A. Khandakar, M. A. Kadir, K. R. Islam, K. F. Islam et al., “Reliable tuberculosis detection using chest x-ray with deep learning, segmentation and visualization,” IEEE Access, vol. 8, pp. 191191–191586, 2020. [Google Scholar]
2. N. Baghdadi, A. S. Maklad, A. Malki and M. A. Deif, “Reliable sarcoidosis detection using chest x-rays with efficientnets and stain-normalization techniques,” Sensors, vol. 22, no. 10, pp. 3846, 2022. [Google Scholar]
3. L. An, K. Peng, X. Yang, P. Huang, Y. Luo et al., “E-TBNet: Light deep neural network for automatic detection of tuberculosis with x-ray dr imaging,” Sensors, vol. 22, no. 3, pp. 821, 2022. [Google Scholar]
4. E. Showkatian, M. Salehi, H. Ghaffari, R. Reiazi, N. Sadighi et al., “Deep learning-based automatic detection of tuberculosis disease in chest X-ray images,” Polish Journal of Radiology, vol. 87, no. 1, pp. 118, 2022. [Google Scholar]
5. T. Khatibi, A. Shahsavari and A. Farahani, “Proposing a novel multi-instance learning model for tuberculosis recognition from chest X-ray images based on CNNs, complex networks and stacked ensemble,” Physical and Engineering Sciences in Medicine, vol. 44, no. 1, pp. 291–311, 2021. [Google Scholar]
6. A. S. Becker, C. Blüthgen, C. S. Wiltshire, B. Castelnuovo, A. Kambugu et al., “Detection of tuberculosis patterns in digital photographs of chest X-ray images using deep learning: Feasibility study,” The International Journal of Tuberculosis and Lung Disease, vol. 22, no. 3, pp. 328–335, 2018. [Google Scholar]
7. S. Rajaraman and S. K. Antani, “Modality-specific deep learning model ensembles toward improving tb detection in chest radiographs,” IEEE Access, vol. 8, pp. 27318–27327, 2020. [Google Scholar]
8. R. O. Panicker, K. S. Kalmady, J. Rajan and M. K. Sabu, “Automatic detection of tuberculosis bacilli from microscopic sputum smear images using deep learning methods,” Biocybernetics and Biomedical Engineering, vol. 38, no. 3, pp. 691–699, 2018. [Google Scholar]
9. G. Tavaziva, M. Harris, S. K. Abidi, C. Geric, M. Breuninger et al., “Chest x-ray analysis with deep learning-based software as a triage test for pulmonary tuberculosis: An individual patient data meta-analysis of diagnostic accuracy,” Clinical Infectious Diseases, vol. 74, no. 8, pp. 1390–1400, 2021. [Google Scholar]
10. J. Escorcia-Gutierrez, K. Beleño, J. Jimenez-Cabas, M. Elhoseny, M. Dahman Alshehri et al., “An automated deep learning enabled brain signal classification for epileptic seizure detection on complex measurement systems,” Measurement, vol. 195, no. 10, pp. 111226, 2022. [Google Scholar]
11. S. P. Kale, J. Patil, A. Kshirsagar and V. Bendre, “Early lungs tuberculosis detection using deep learning,” in Intelligent Sustainable Systems. Lecture Notes in Networks and Systems book series, vol. 333. Singapore: Springer, pp. 287–294, 2022. [Google Scholar]
12. J. Escorcia-Gutierrez, J. Cuello, C. Barraza, M. Gamarra, P. Romero-Aroca et al., “Analysis of pre-trained convolutional neural network models in diabetic retinopathy detection through retinal fundus images,” in Int. Conf. on Computer Information Systems and Industrial Management, Barranquilla, Colombia, vol. 13293, pp. 202–213, 2022. [Google Scholar]
13. J. Escorcia-Gutierrez, R. F. Mansour, K. Beleño, J. Jiménez-Cabas, M. Pérez et al., “Automated deep learning empowered breast cancer diagnosis using biomedical mammogram images,” Computers, Materials and Continua, vol. 71, no. 3, pp. 4221–4235, 2022. [Google Scholar]
14. K. Muthumayil, S. Manikandan, S. Srinivasan, J. Escorcia-Gutierrez, M. Gamarra et al., “Diagnosis of leukemia disease based on enhanced virtual neural network,” Computers, Materials and Continua, vol. 69, no. 2, pp. 2031–2044, 2021. [Google Scholar]
15. S. Althubiti, J. Escorcia-Gutierrez, M. Gamarra, R. Soto-Diaz, R. F. Mansour et al., “Improved metaheuristics with machine learning enabled medical decision support system,” Computers, Materials and Continua, vol. 73, no. 2, pp. 2423–2439, 2022. [Google Scholar]
16. S. Manikandan, S. Srinivasan, J. Escorcia-Gutiérrez, M. Gamarra and R. F. Mansour, “Diagnosis of leukemia disease based on enhanced virtual neural network,” Computers, Materials and Continua, vol. 69, no. 2, pp. 2031–2044, 2021. [Google Scholar]
17. Q. H. Nguyen, B. P. Nguyen, S. D. Dao, B. Unnikrishnan, R. Dhingra et al., “Deep learning models for tuberculosis detection from chest x-ray images,” in 26th Int. Conf. on Telecommunications (ICT), Hanoi, Vietnam, pp. 381–385, 2019. [Google Scholar]
18. S. J. Heo, Y. Kim, S. Yun, S. S. Lim, J. Kim et al., “Deep learning algorithms with demographic information help to detect tuberculosis in chest radiographs in annual workers’ health examination data,” International Journal of Environmental Research and Public Health, vol. 16, no. 2, pp. 250, 2019. [Google Scholar]
19. M. H. A. Hijazi, S. K. T. Hwa, A. Bade, R. Yaakob and M. S. Jeffree, “Ensemble deep learning for tuberculosis detection using chest X-ray and canny edge detected images,” IAES International Journal of Artificial Intelligence, vol. 8, no. 4, pp. 429, 2019. [Google Scholar]
20. J. Escorcia-Gutierrez, J. Torrents-Barrena, M. Gamarra, P. Romero-Aroca, A. Valls et al., “Convexity shape constraints for retinal blood vessel segmentation and foveal avascular zone detection,” Computers in Biology and Medicine, vol. 127, pp. 104049, 2020. [Google Scholar]
21. S. Dey, R. Roychoudhury, S. Malakar and R. Sarkar, “An optimized fuzzy ensemble of convolutional neural networks for detecting tuberculosis from Chest X-ray images,” Applied Soft Computing, vol. 114, no. 2, pp. 108094, 2022. [Google Scholar]
22. E. Tasci, C. Uluturk and A. Ugur, “A voting-based ensemble deep learning method focusing on image augmentation and preprocessing variations for tuberculosis detection,” Neural Computing and Applications, vol. 33, no. 22, pp. 15541–15555, 2021. [Google Scholar]
23. S. K. T. Hwa, A. Bade, M. H. A. Hijazi and M. Saffree Jeffree, “Tuberculosis detection using deep learning and contrastenhanced canny edge detected X-Ray images,” IAES International Journal of Artificial Intelligence, vol. 9, no. 4, pp. 713, 2020. [Google Scholar]
24. A. T. Sahlol, M. A. Elaziz, A. T. Jamal, R. Damaševičius and O. Farouk Hassan, “A novel method for detection of tuberculosis in chest radiographs using artificial ecosystem-based optimisation of deep neural network features,” Symmetry, vol. 12, no. 7, pp. 1146, 2020. [Google Scholar]
25. C. Dasanayaka and M. B. Dissanayake, “Deep learning methods for screening pulmonary tuberculosis using chest x-rays,” Computer Methods in Biomechanics and Biomedical Engineering: Imaging & Visualization, vol. 9, no. 1, pp. 39–49, 2021. [Google Scholar]
26. A. Haq, J. Li, S. Ahmad, S. Khan, M. Alshara et al., “Diagnostic approach for accurate diagnosis of covid-19 employing deep learning and transfer learning techniques through chest x-ray images clinical data in e-healthcare,” Sensors, vol. 21, no. 24, pp. 8219, 2021. [Google Scholar]
27. R. F. Mansour, J. Escorcia-Gutierrez, M. Gamarra, D. Gupta, O. Castillo et al., “Unsupervised deep learning based variational autoencoder model for COVID-19 diagnosis and classification,” Pattern Recognition Letters, vol. 151, no. 6, pp. 267–274, 2021. [Google Scholar]
28. H. Okut, “Deep learning for subtyping and prediction of diseases: Long-short term memory,” in Deep Learning Applications. United Kingdom: IntechOpen, 2021. [Google Scholar]
29. R. Karthick, A. Senthilselvi, P. Meenalochini and S. S. Pandi, “Design and analysis of linear phase finite impulse response filter using water strider optimization algorithm in FPGA,” Circuits, Systems, and Signal Processing, vol. 41, no. 9, pp. 5254–5282, 2022. [Google Scholar]
Cite This Article
 Copyright © 2023 The Author(s). Published by Tech Science Press.
This work is licensed under a Creative Commons Attribution 4.0 International License , which permits unrestricted use, distribution, and reproduction in any medium, provided the original work is properly cited.
 Downloads
 Citation Tools