
 Submit a Paper
 Propose a Special lssue
 Open Access
ARTICLE

An Efficient Automated Technique for Classification of Breast Cancer Using Deep Ensemble Model
1 Department of Electrical Engineering, HITEC University, Taxila, 47080, Pakistan
2 School of Computing, Edinburgh Napier University, Edinburgh, EH10 5DT, UK
3 Department of Computer Science, Faculty of Computing and Information Technology, King Abdulaziz University, Jeddah, 21589, Saudi Arabia
4 Department of Information Technology, College of Computers and Information Technology, Taif University, Taif, 21944, Saudi Arabia
5 DAAI Research Group, Department of Computing and Data Science, School of Computing and Digital Technology, Birmingham City University, 15 Bartholomew Row, Birmingham, B5 5JU, UK
* Corresponding Author: Jawad Ahmad. Email:
Computer Systems Science and Engineering 2023, 46(1), 897-911. https://doi.org/10.32604/csse.2023.035382
Received 18 September 2022; Accepted 15 November 2022; Issue published 20 January 2023
 View Full Text
 Download PDF
Abstract
Breast cancer is one of the leading cancers among women. It has the second-highest mortality rate in women after lung cancer. Timely detection, especially in the early stages, can help increase survival rates. However, manual diagnosis of breast cancer is a tedious and time-consuming process, and the accuracy of detection is reliant on the quality of the images and the radiologist’s experience. However, computer-aided medical diagnosis has recently shown promising results, leading to the need to develop an efficient system that can aid radiologists in diagnosing breast cancer in its early stages. The research presented in this paper is focused on the multi-class classification of breast cancer. The deep transfer learning approach has been utilized to train the deep learning models, and a pre-processing technique has been used to improve the quality of the ultrasound dataset. The proposed technique utilizes two deep learning models, MobileNetV2 and DenseNet201, for the composition of the deep ensemble model. Deep learning models are fine-tuned along with hyperparameter tuning to achieve better results. Subsequently, entropy-based feature selection is used. Breast cancer identification using the proposed classification approach was found to attain an accuracy of 97.04%, while the sensitivity and F1 score were 96.87% and 96.76%, respectively. The performance of the proposed model is very effective and outperforms other state-of-the-art techniques presented in the literature.Keywords
Even with technological improvements over the years, breast cancer still counts as one of the deadliest cancers among women [1]. However, using technology in medical diagnosis and treatment significantly improves the survival rate. According to the reports of the World Health Organization (WHO) and the American Cancer Society, almost 30% of cancer deaths in women are due to breast cancer [2]. Data estimates show that over 8% of the female population may be diagnosed with breast cancer once in their life [3]. Cancer develops as a tumor in the breast, and glands may be affected by the tumor. Cancers may be either malignant or benign. Malignant cancer is considered to be more deadly, as it tends to spread to other parts of the body. Benign breast cancer, on the other hand, is a localized type of cancer. They are characterized as invasive and non-invasive (in situ) cancers, respectively.
The mortality rate can only be reduced by an accurate and timely breast cancer diagnosis. It is worth mentioning that improvements in diagnosis with the aid of technology have reduced the fatality rate in the United States by 1% since 2013 [4]. Breast cancer is a result of the abnormal growth of breast cells. As these cells grow abruptly, they start accumulating in certain regions. The ducts and breast lobules are composed of epithelial cells. Breast cancer develops around the lobules in epithelial cells. The accumulation of abnormal cells forms lumps, which lead to the formation of tumors. In the case of non-invasive (in situ) cancer, the basement membrane of epithelial cells remains intact; thus, it remains confined to the tumor, and does not let it spread to neighboring tissues, whereas invasive cancer tends to affect the epithelial membrane, hence, it starts spreading to other body parts [5]. Unfortunately, the invasive type of cancer is more commonly reported than the non-invasive one.
Several approaches are used for the screening of breast cancer. Mammograms are commonly used for the diagnosis of breast cancer around the world, as they are used for follow-up check-ups and are less costly compared to other techniques. Magnetic Resonance Imaging (MRI) is the other technique, often used for high-risk cases. However, it is not considered for screening and follow-up check-ups because of its high cost [6]. Ultrasound is another prominent method for screening and diagnosis and is not expensive compared to MRI. It is widely used for diagnosis since it is non-invasive, free of radiation, and endurable for patients. Moreover, ultrasound can detect tumors in dense tissues of the breast, which are mostly undetected using mammography [7]. However, it requires highly expert staff for diagnosis, as some images can easily be affected by noise spikes because of their low resolution, which might also result in ambiguous outcomes that will affect the treatment of patients. Numerous Computer-Aided Diagnosis (CAD) systems have been developed in the past and are continually evolving to aid radiologists in the diagnosis of breast cancer [8]. Developments in the recent past have made it possible to deploy Artificial Intelligence (Al)-based CAD systems in various fields, including medical image diagnosis [9], precision agriculture [10], natural language processing [11], and gesture recognition [12]. Deep learning (DL) has resolved the issues related to manual processing of visual information, the conventional method of feature extraction, that had been faced by researchers in the past. Also, it made the systems efficient in terms of speed and reduced their complexity.
In the medical field, DL has been used in various domains for the detection of diseases such as lung cancer [13], brain tumors [14], gastrointestinal disorders [15], breast cancer [16–18], in telemedicine [19], and diabetic retinopathy [20] and has shown considerable results in terms of precise detection. The DL-based algorithms are not only used for classification but also for lesion segmentation, with great accuracy. Automated disease detection systems aid medical staff in the early detection of tumors since it is crucial to diagnose breast cancer at the early stages to avoid its spread to nearby tissues and other parts of the body [21]. Previously, conventional approaches have been used for feature extraction to segment infected regions, namely, thresholding, clustering, region-growing, and edge detection-based segmentation. These techniques are not only complex but also inefficient in comparison to the latest deep learning-based techniques. Also, conventional techniques mostly require a few pre-processing techniques that are considered tedious. Therefore, it is the need of the hour to develop techniques that are efficient and easy to use.
The proposed work presents a novel technique that utilizes the Weiner filter as a pre-processing step to improve the visual quality of the breast ultrasound dataset. Two pre-trained deep learning models are fine-tuned, and later features are fused together and optimized using entropy-based feature selection. The results of the proposed technique are thoroughly compared with other deep learning models. Section 2 discusses the previous literature to provide the background of deep learning-based research for breast cancer detection. Section 3 explains the proposed methodology, while the results are presented and discussed in Section 4. The proposed research work is concluded, along with the future directions in Section 5.
Several deep learning-based techniques have been used recently in healthcare to aid medical staff in diagnosis, including in the detection and classification of breast cancer. In this section, several deep learning-based techniques are discussed to provide an overview of recent research.
Rakhlin et al. [22] performed the classification of breast tissues using several pre-trained deep learning models, including VGG16, ResNet50, and InceptionV3. The feature extraction was carried out using pre-trained deep models. The proposed classification technique attained an accuracy of 93.8% for the binary classification of breast cancer, whereas for multiclass classification it attained an accuracy of only 87.2%. In the technique proposed by Fang et al. [23], classification was carried out using the Simple Linear Iterative Clustering Algorithm (SLIC) to extract the Region Of Interest (ROI). Moreover, the region-growing algorithm used also aided in the process of extracting ROI. The classification was performed using a Support Vector Machine (SVM), and as a result, the proposed approach achieved an accuracy of 88% along with 92.05% sensitivity. Khamparia et al. [24] proposed a deep learning-based method for the classification of mammograms of patients affected by breast cancer. Five different deep learning-based models were used in this work: AlexNet, MobileNet, ResNet50, and VGG. For training the model, 75% of the total images were used, and data augmentation was employed to increase the number of images. When compared to other models, the hybrid transfer learning-based model had the highest accuracy, which was 94.3% for binary classification.
Lahoura et al. [25] proposed an approach that exploited the Extreme Learning Machine (ELM), a variant of the Artificial Neutral Network (ANN), for the classification of breast cancers. The technique had been previously tested on the Wisconsin Diagnostic Breast Cancer dataset. The ELM is a simple classification technique used along with feature selection to improve the performance of their work. In addition, hidden layers of ELM were also tuned. This breast cancer diagnostic technique was proposed for remote diagnosis, and the technique achieved state-of-the-art performance. Moon et al. [26] presented a computer-aided diagnostic system for the classification of breast cancer; mammograms were used in this work to evaluate the performance of the technique. Their technique employed a feature fusion strategy to improve accuracy, and several CNN models were tested. Two different datasets were used, but the technique achieved better performance on the BUSI dataset compared to the private dataset. In the method proposed by Mishra et al. [27], a classification approach based on machine learning was used to classify breast cancer. Handcrafted features were extracted using the Histogram of Oriented Gradients (HOG) and Hu moments, and the textural feature was extracted using the Gray-Level Co-Occurrence Matrix (GLCM). The features were subjected to recursive elimination for the removal of redundant features. The classification was performed using several machine learning-based classifiers. The technique was evaluated using the BUSI dataset, and it achieved a good level of classification accuracy.
Saber et al. [28] introduced a technique for the classification of breast cancer using deep learning models by employing a transfer-learning strategy. The Mammography Image Analysis Society (MIAS) dataset was used for model training, which consisted of two different training approaches: cross-validation and 80–20. Several deep learning models were used in this work, and different evaluation metrics were used to assess each model’s performance. The proposed classification technique for breast cancer showed improved results using the VGG-16 model when compared with other models. In [29], the breast cancer classification technique was implemented using a 30-layered Convolutional Neural Network (CNN), where 28 layers were hidden while the other 2 layers acted as input and output layers, achieving a classification accuracy of 90.50%. Charan et al. [30] proposed a light CNN framework to classify breast cancer. The network was composed of 6 convolutional layers, several pooling layers, and 3 fully connected layers. The Softmax classifier was used in the last fully connected layer to perform classification. This technique obtained an accuracy of 65% on the MIAS dataset. Khan et al. [31] utilized CNN architectures to extract features from breast images. The architectures used in this work were VGG, GoogleNet, and ResNet, where all these networks were pre-trained on the ImageNet dataset. The proposed technique achieved good classification accuracy on the standard benchmark dataset.
In this study, a new multiclass breast cancer classification technique is proposed that aims to accurately classify different types of breast cancer cases and normal cases. The research methodology comprises several steps, which include dataset augmentation, pre-processing of the dataset, feature extraction using deep learning models, hyperparameter fine-tuning, and evaluation of the results on several evaluation parameters to gauge the quality and precision of the technique. One of the major issues for training deep learning models is the unavailability of data. Moreover, the available datasets are class imbalanced, which badly influences the model’s performance. This problem has been solved using different augmentation techniques. The proposed work used ultrasound images for the training and testing of models. These images often contain speckle noise. Two different pre-processing techniques are used for dealing with this issue. Feature extraction has been performed using two pre-trained deep learning models. The detailed workflow of the proposed technique is presented in Fig. 1. The subsequent subsections explain all the main steps of the proposed technique.
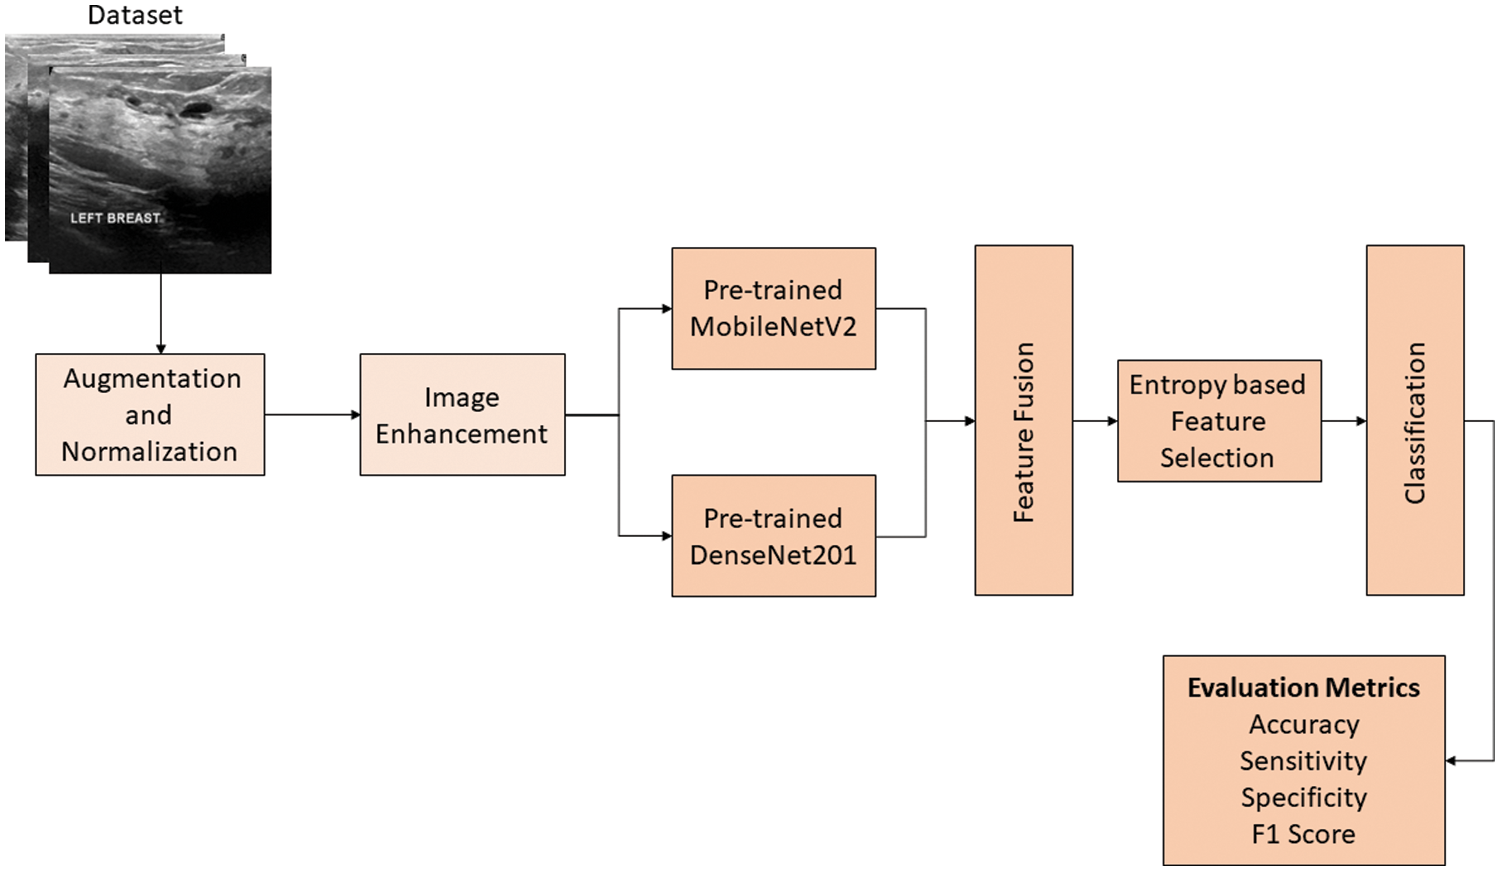
Figure 1: The proposed technique for the classification of breast cancer
Data pre-processing is one of the essential steps in the field of image processing. In this work, two pre-processing techniques were used. One of them was data augmentation, and the other was used to enhance the visual quality of images present in the dataset.
3.1.1 Data Augmentation and Normalization
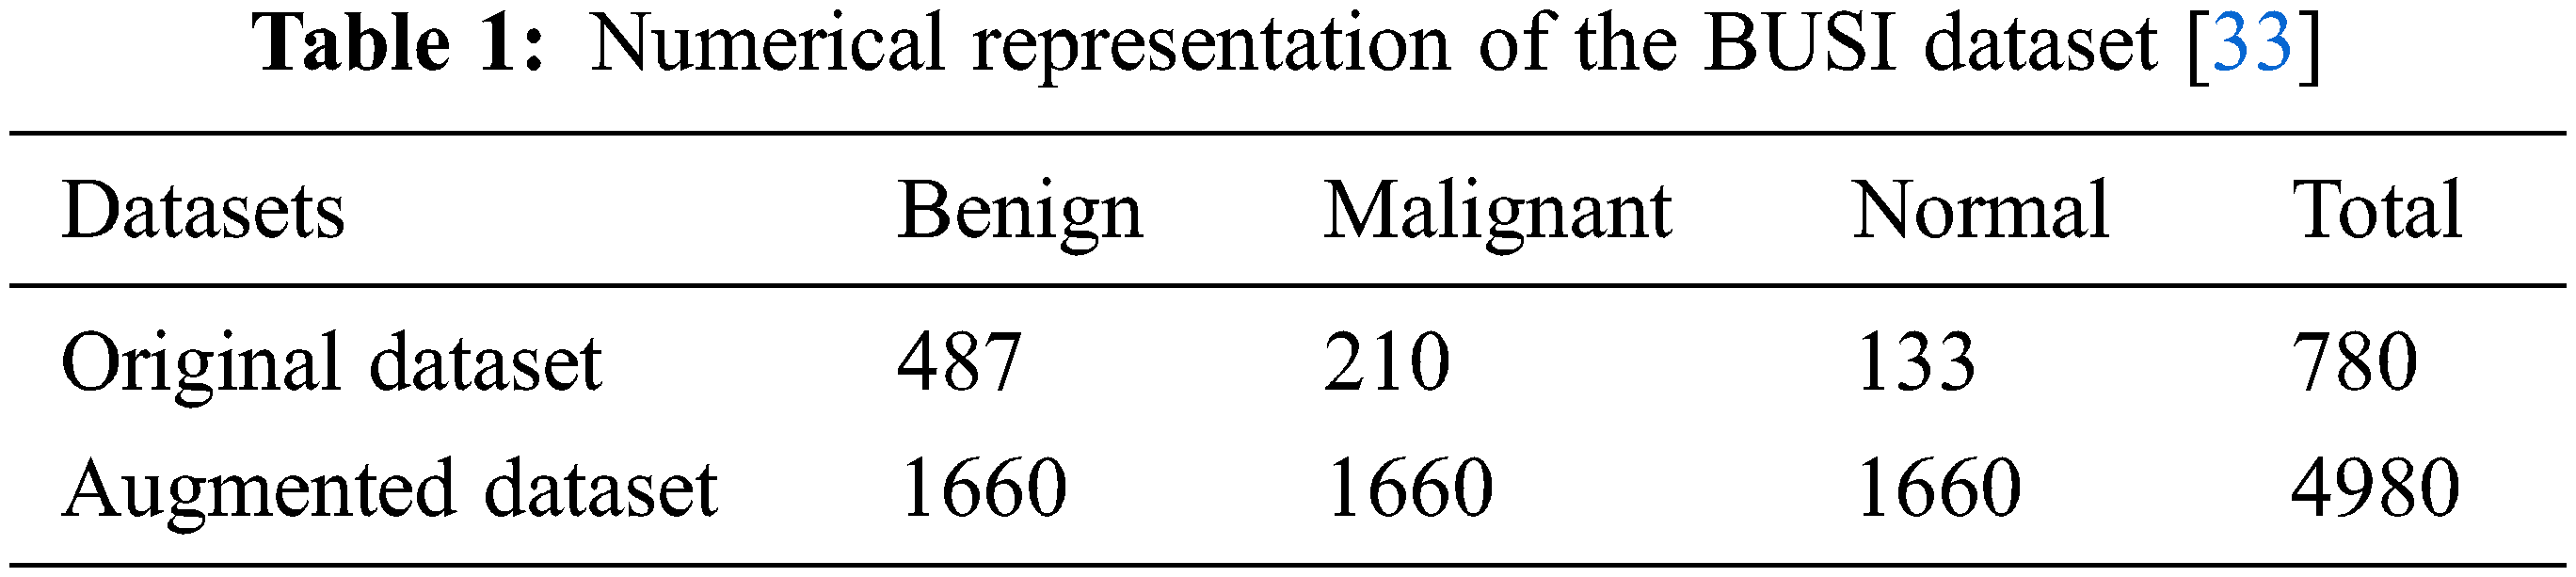
The availability of datasets for training deep learning models is one of the biggest problems researchers face. Only high-quality datasets with a large number of sample images can effectively train models [32]. Even large datasets affected by noise have an adverse impact on training. In this work, an ultrasound-based breast cancer dataset was used for the classification and is publicly available under the name “Breast Ultrasound Images Dataset.” It is composed of 3 classes: benign, malignant, and normal. The “normal” class represents the non-affected breasts [33]. Firstly, the dataset was normalized, which required pixel-based normalization in the range of 0 to 1. The used dataset is biased, as it contains a different number of images in each class. Moreover, it is a small dataset, while deep learning models need a large dataset to avoid training problems like overfitting and underfitting.
The data augmentation technique was adopted in this work to address the issues mentioned above. Data augmentation is the simplest and easiest method to increase the amount of data needed to train deep learning models. The addition of images to classes that had a smaller number of images in comparison with other classes resolves the class imbalance problem. In addition, it increases the overall size of the dataset, which enables the model to train better, thus improving the performance of the system. Several augmentation techniques are available, but these are used according to requirements and the nature of the dataset. A wrong choice of augmentation technique can adversely affect the training of the model, which distorts the overall performance of the system [34]. An augmentation technique that preserves all the information of the original dataset is considered a good and efficient technique. In this work, the challenge of the class-imbalanced dataset has been resolved by applying augmentation to all three classes, benign, malignant, and normal; the augmentation ratio for each class is different. There are various types of augmentation techniques, but in this work, geometric augmentation was used, as it is suitable for the acquired dataset. Other types include random erasing, positional augmentation, color space transformation, and kernel-based augmentation [35]. There are subcategories of geometric augmentation, such as flipping, rotation, scaling, cropping, and translation. Table 1 shows the sample of images represented in each class of the original dataset. In addition, it shows the dataset for each class obtained after data augmentation.
3.1.2 Image Enhancement Technique
Image processing is an essential step in the field of computer vision. It is used to enhance the visual quality of the image by removing unwanted information, known as “noise.” Speckle noise affects the quality of images in low-level luminance images such as ultrasound and MRI images. It is a granular distortion that significantly reduces the quality of low-contrast images and might lead to a false diagnosis [36]. Therefore, an image enhancement technique is required to enhance the quality of the image. Ultrasound images are often affected by speckle noise, which significantly degrades the quality of the images. It affects the fine details of the dataset, particularly edges, which play a vital role in feature extraction and feature learning [37]. In this work, the Weiner filter [38] was used to deal with the problem of speckle noise as the ultrasound sound dataset was used. This filter has been used because of its simplicity, robustness, and speed, as it only uses linear equations to calculate optimal solutions. The ultrasound dataset is passed to the Weiner filter to obtain a noise-free dataset. The equations show the application of the Weiner filter over a noisy image. As a result, a denoised image is obtained.
Eq. (1) shows the degraded image
where Eq. (3) represents the mean (
where
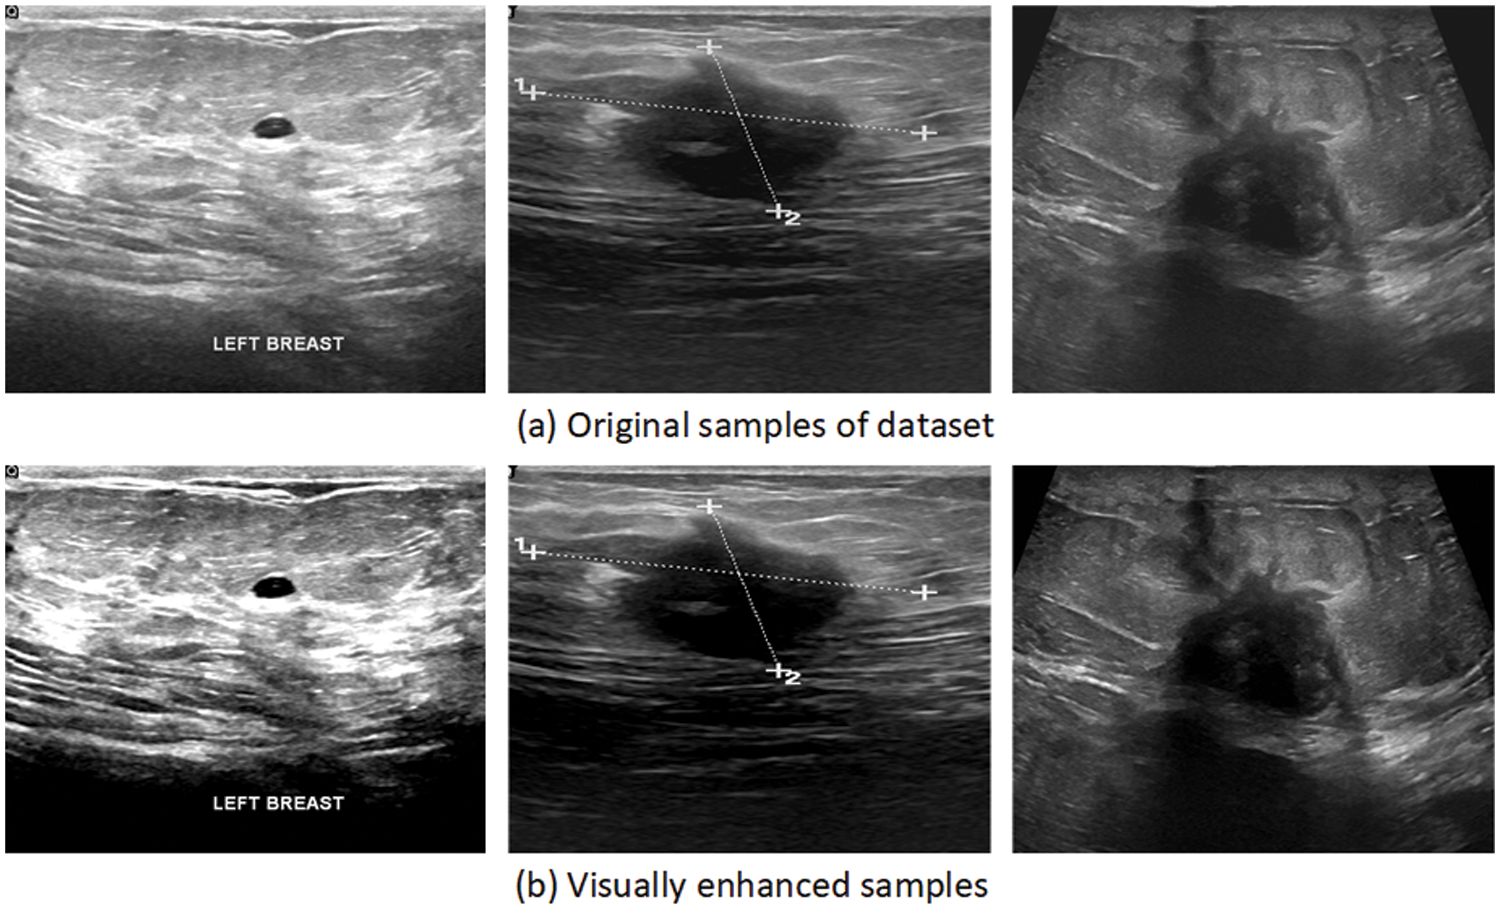
Figure 2: Samples of the visually enhanced image dataset
3.2 Feature Extraction Using Transfer Learning
This section discusses the process of feature extraction using different deep learning models. In this work, two deep learning models were used to extract features from the dataset. The transfer learning approach was used to extract features. It uses the knowledge gained from the pre-trained networks, which improves the performance of models trained on small datasets. Generally, the pre-trained networks are trained on large, publicly available datasets. The pre-trained models used in this study had been previously trained on the famous ImageNet dataset [39]. Fig. 3 depicts the process of transfer learning.
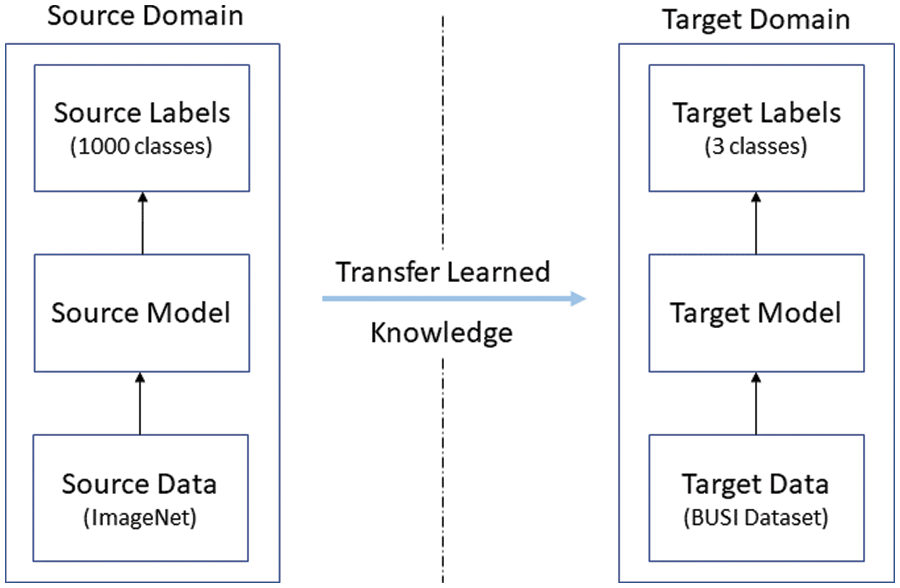
Figure 3: Depiction of the transfer learning concept
In transfer learning, the model learns from the knowledge of the source domain, and the acquired knowledge is subsequently used for training the new model, known as the target model. The following subsections explain the architecture of the used models and discuss the process of transfer learning, which has been adopted in this work.
The MobileNetV2 [40] is a lightweight model because of its architecture and fewer training parameters [41]. Along with depth-wise and point-wise convolutional filters, it uses residual connections, expansion layers, and projection layers. The depth-wise convolutions are used to filter the input, while the point-wise convolutions create new features by combining filtered inputs, resulting in lower computational costs. The flow of gradients is maintained using residual connections throughout the network. The expansion layer is used for the expansion of channels in accordance with the expansion factor. Moreover, projection layers are utilized for the formation of lower channel tensors by reducing the number of channels. The combination of these is known as bottleneck residual block, which is followed by batch normalization and the Relu6 activation function. Overall, MobileNetV2 consists of 17 residual bottlenecks, followed by a convolutional layer, an average pooling layer, and a classification layer [40]. In this work, features were extracted using pre-trained MobileNetV2.
The MobileNetV2 model is modified according to the dataset by replacing its classification head with a new one. The new classification head can classify 3 different classes present in the dataset. In this research, the model was trained on the BUSI dataset using the concept of transfer learning.
The DenseNet201 [42] is the other deep learning model used for feature extraction in this work. It is composed of 201 layers, hence the name “DenseNet201.” The dense blocks are the core of the model, which is made up of several convolutional layers. The model is comprised of 4 dense blocks, where the first 3 dense blocks are followed by a convolutional layer (1 × 1) and a pooling layer; these layers connect the successive dense blocks and are called transition layers. It is considered a complex deep learning model, as the convolutional layers inside dense blocks have access to feature maps of all preceding layers, which results in the extraction of high-level features. The stacking of features is shown mathematically as follows:
where
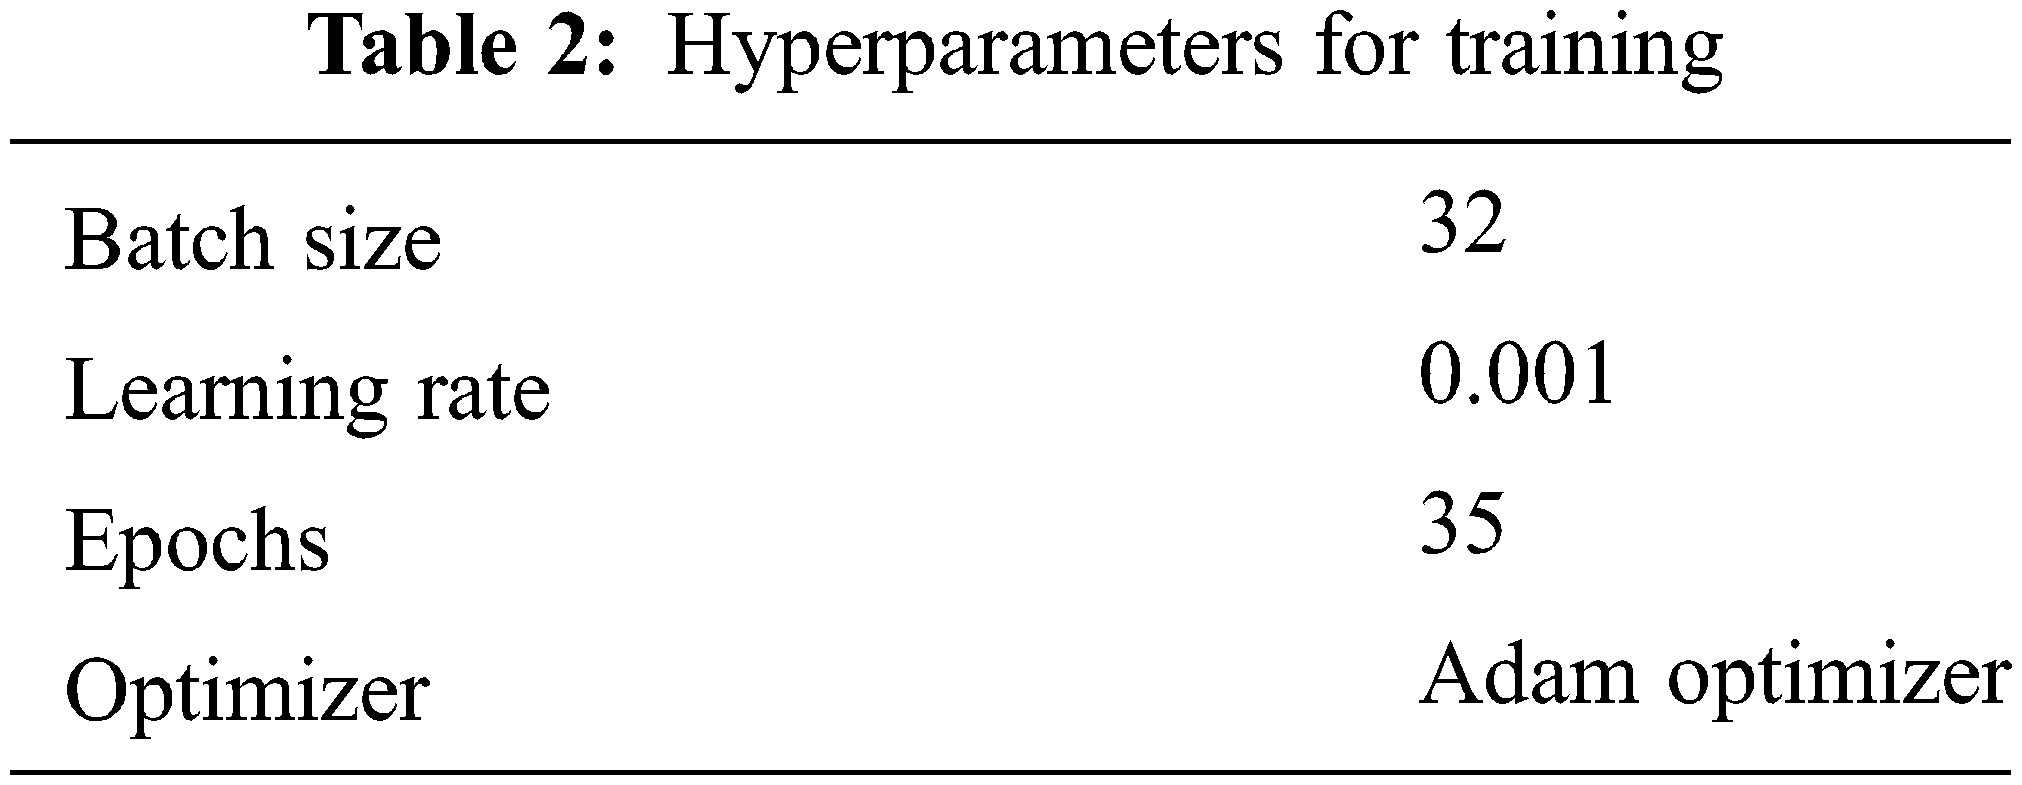
The DenseNet201 model is modified for the breast cancer dataset. The classification head is removed from DenseNet201. Formerly, the original fully connected layer consisted of 1000 classes, as it was previously trained on the ImageNet dataset. The model was later trained using the transfer learning approach. Features are extracted from global average pooling layers. The hyperparameters have also been fine-tuned and are shown in Table 2.
3.2.3 Feature Fusion and Selection
Classification can only be effective when features represent all the information present in images. Feature fusion allows comprehensive learning of the visual characteristics present in the images [43]. Feature fusion was used in this work by serially fusing features extracted from the used deep learning models. The feature vector obtained from MobileNetV2 is of size 1 × 1280, while the feature vector obtained from the global average pooling layer of DenseNet201 is of size 1 × 2048. The serially fused vector creates a larger feature set that represents the rich details of the dataset. Mathematically, feature fusion is represented as follows:
To reduce the computation cost and remove redundant features, an entropy-based feature selection technique was used. The technique selects the best features based on the entropy score, which, in this case, significantly reduced the size of the original fused vector; however, it kept the descriptive features. The process of feature selection is mathematically represented in the following equations:
Eq. (10) illustrates the entropy function, where
In this section, the results of the proposed technique are divided into two sections. In Subsection 4.1, the results of MobileNetV2 and DenseNet201 are presented, while the results of the ensemble model are presented in Subsection 4.2. Analysis and comparisons of these results are presented in Subsection 4.3.
4.1 Classification Results Using MobileNetV2 and DenseNet201
The results of both models were evaluated based on two different strategies. In the first approach, MobileNetV2 and DenseNet201 were trained on the original BUSI dataset without employing image processing techniques. Table 3 shows the results of both models’ classification performance. The MobileNetV2 model achieved an accuracy of 85.97%. The sensitivity obtained using this approach was 80.33%, and the specificity and precision were 89.10% and 80.33%, respectively. However, the performance of DenseNet201 was superior, achieving an accuracy of 89.92% while its sensitivity and specificity were 86.33% and 92.71%, respectively. The recorded precision for DenseNet201 was 86.5%. The false-positive rate (FPR) was 0.0728. The results of the DenseNet201 model were further validated using the confusion matrix presented in Fig. 4.
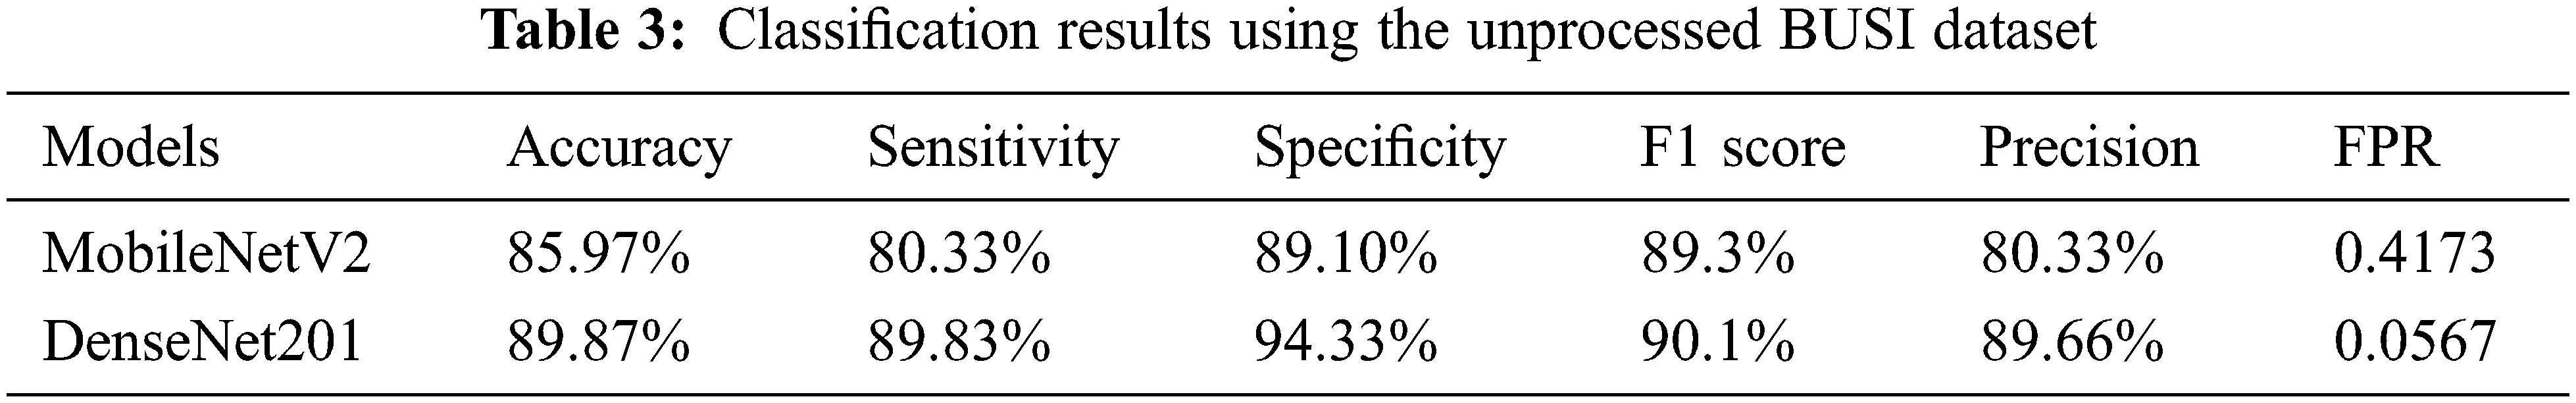
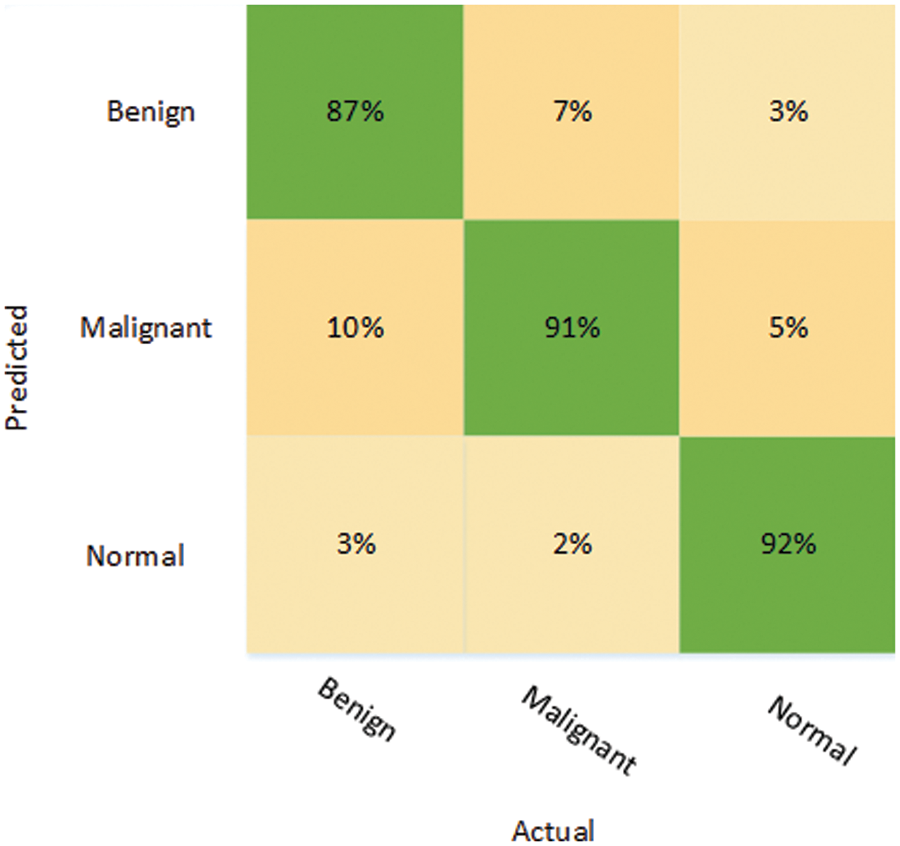
Figure 4: Confusion matrix depicting the results of DenseNet201 on the unprocessed dataset
The confusion matrix for DenseNet201 shows that for the benign class, it attains 87% accuracy, whereas 10% of the benign class are misclassified as malignant and 3% are falsely classified as normal. On the other hand, the malignant class is correctly classified with an accuracy of 91%, while 7% of the malignant class is misclassified as benign. However, the best classification accuracy, 92%, was achieved in the normal class, while 8% of the normal class samples were misclassified as benign or malignant.
In the other approach, MobileNetV2 and DenseNet201 models were trained on the augmented BUSI dataset. In addition, the proposed image enhancement technique was applied to the augmented BUSI dataset. The results of the second approach used for the classification of breast cancer are presented in Table 4, which shows the DenseNet201 model performed better for all the evaluation parameters, with an accuracy of 94.80%, while sensitivity, specificity, and precision were 92.40%, 96.04%, and 92.40%, respectively. In contrast, MobileNetV2 attained an accuracy of only 91.51%, while it also obtained lower values for sensitivity (87.86%), specificity (93.55%), and precision (87.95%). Moreover, the FPR was only 0.0395 for DenseNet201 using the second approach, compared with a higher FPR of 0.0644 for MobileNetV2. The results are also validated using the confusion matrix presented in Fig. 5.
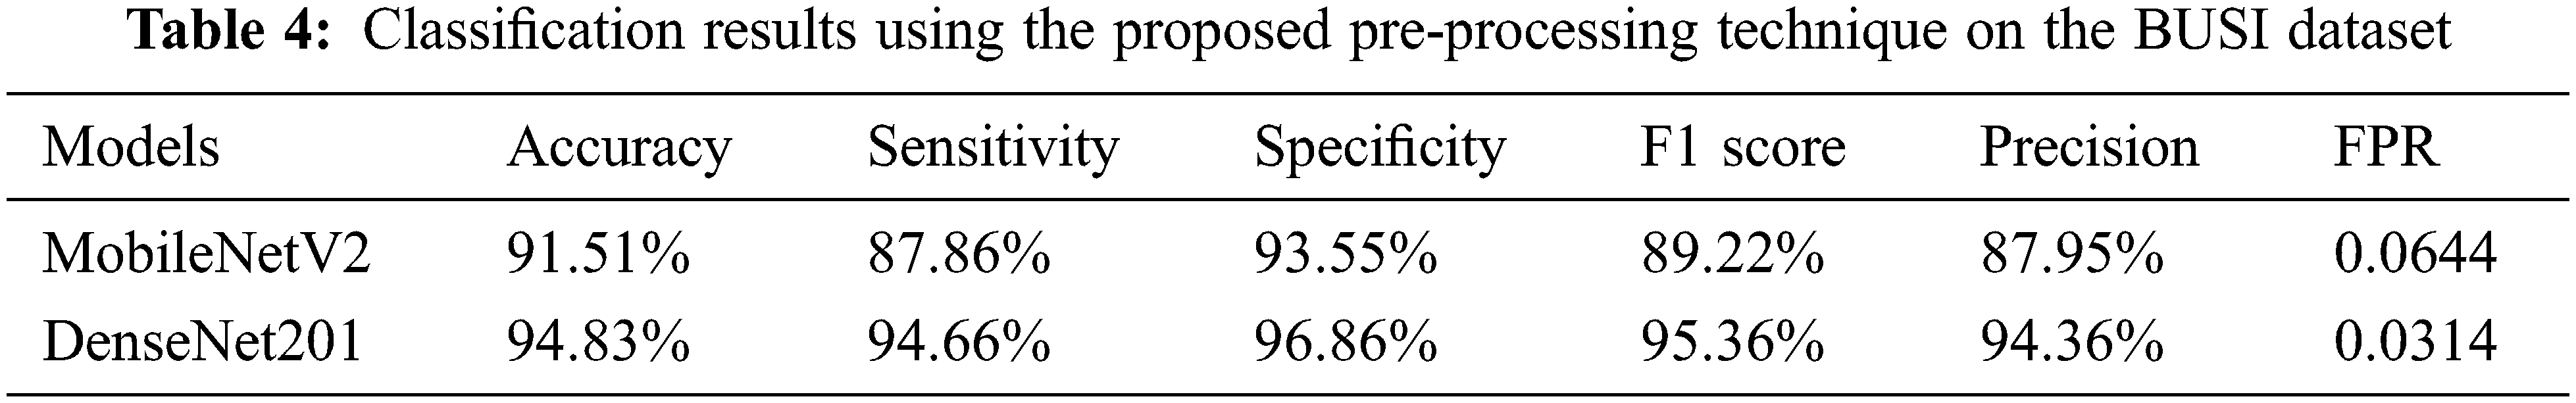
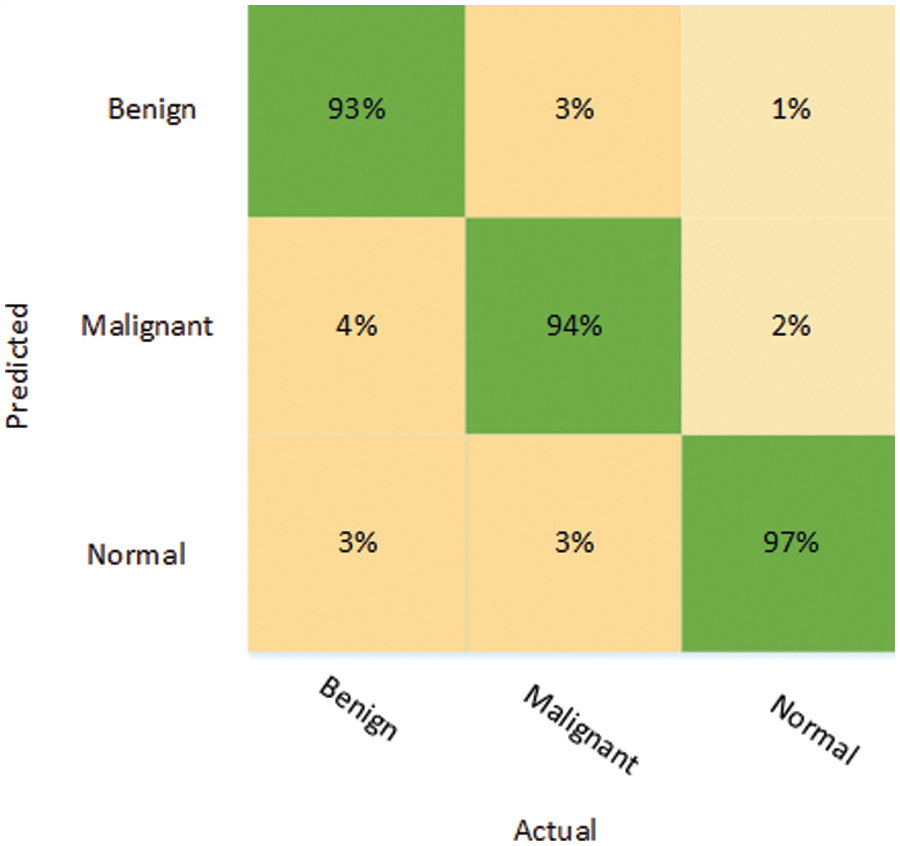
Figure 5: Confusion matrix depicting the results of DenseNet201 on the processed dataset
The confusion matrix shows that benign tumors were correctly identified with an accuracy of 93%, although 7% of that class were misclassified as malignant (4%) or normal (3%). Malignant tumors were classified with more or less the same accuracy as benign tumors, and only 6% of them were misclassified, with 3% in each case falsely identified as either benign or normal. The “normal” class was accurately recognized in 97% of cases, which is the highest accuracy of all 3 classes under consideration. Only 1% of the normal class were wrongly labeled as benign, while 2% of the normal class were wrongly labeled as malignant.
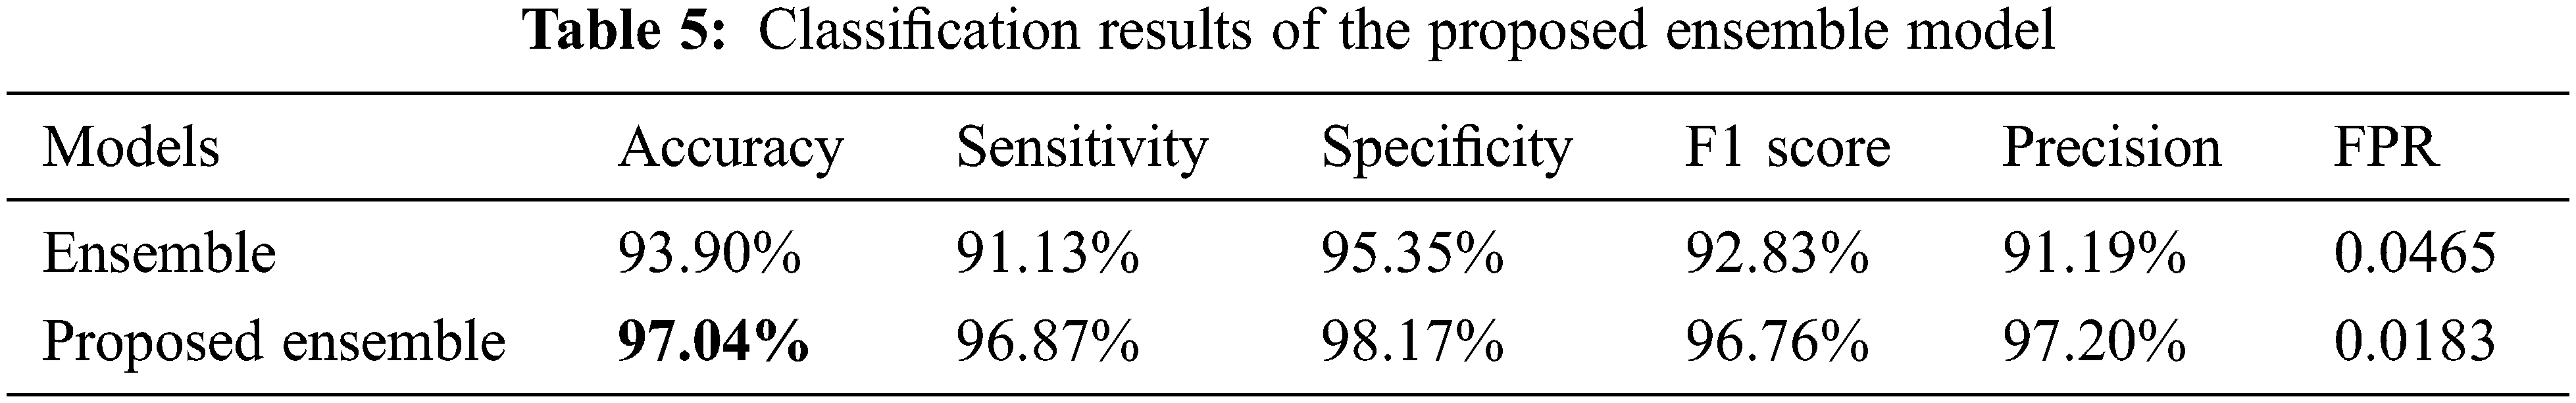
4.2 Proposed Ensemble Model for the Breast Cancer Classification
The ensemble model was also trained using two different approaches. The results reported in Table 5 illustrate that the ensemble model with the feature selection technique performed well when trained on the pre-processed BUSI dataset. Moreover, the results of the ensemble model on the original dataset are better compared to both MobileNetV2 and DenseNet201. Using the first strategy, the ensemble model achieved an accuracy of 93.90%, with a sensitivity of 91.13%, specificity of 95.35%, F1 score of 92.33%, and a precision of 91.19%. In the second approach, the ensemble model was trained on the pre-processed BUSI dataset, and an entropy-based feature selection technique was also employed, which significantly reduced the training time and resulted in improved performance. Table 5 shows that the proposed ensemble model attained an accuracy of 97.04%, which is the highest accuracy attained on the used dataset. The sensitivity (96.87%), specificity (98.17%), F1 score (96.76%), and precision (97.20%) were also all higher than for the first approach. The proposed technique also attained the lowest FPR score, of 0.0183, which shows that the technique correctly identified most of the classes in comparison with other strategies used in this work.
It can be seen in Fig. 6 that only 3% of the benign class was misclassified, while 97% of the benign tumors were correctly classified. Likewise, while malignant tumors were classified with an accuracy of 96%, only 3% of malignant tumors were falsely classified as benign, while only 1% of normal images were falsely identified as normal. Once again, the normal class attained better classification accuracy compared to the other classes: the accuracy of the identification for the normal class was 98%, while only 2% of the normal images were wrongly identified as benign tumors. The training plots of the proposed ensemble model are shown in Fig. 7.
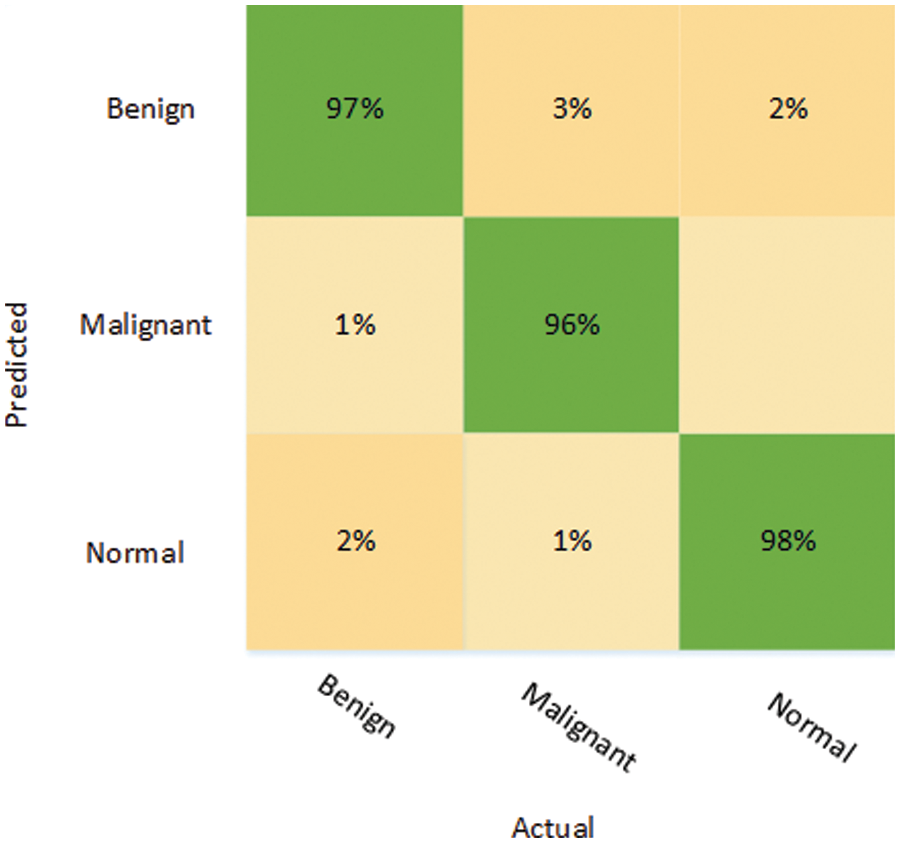
Figure 6: Confusion matrix depicting the results of the proposed ensemble model
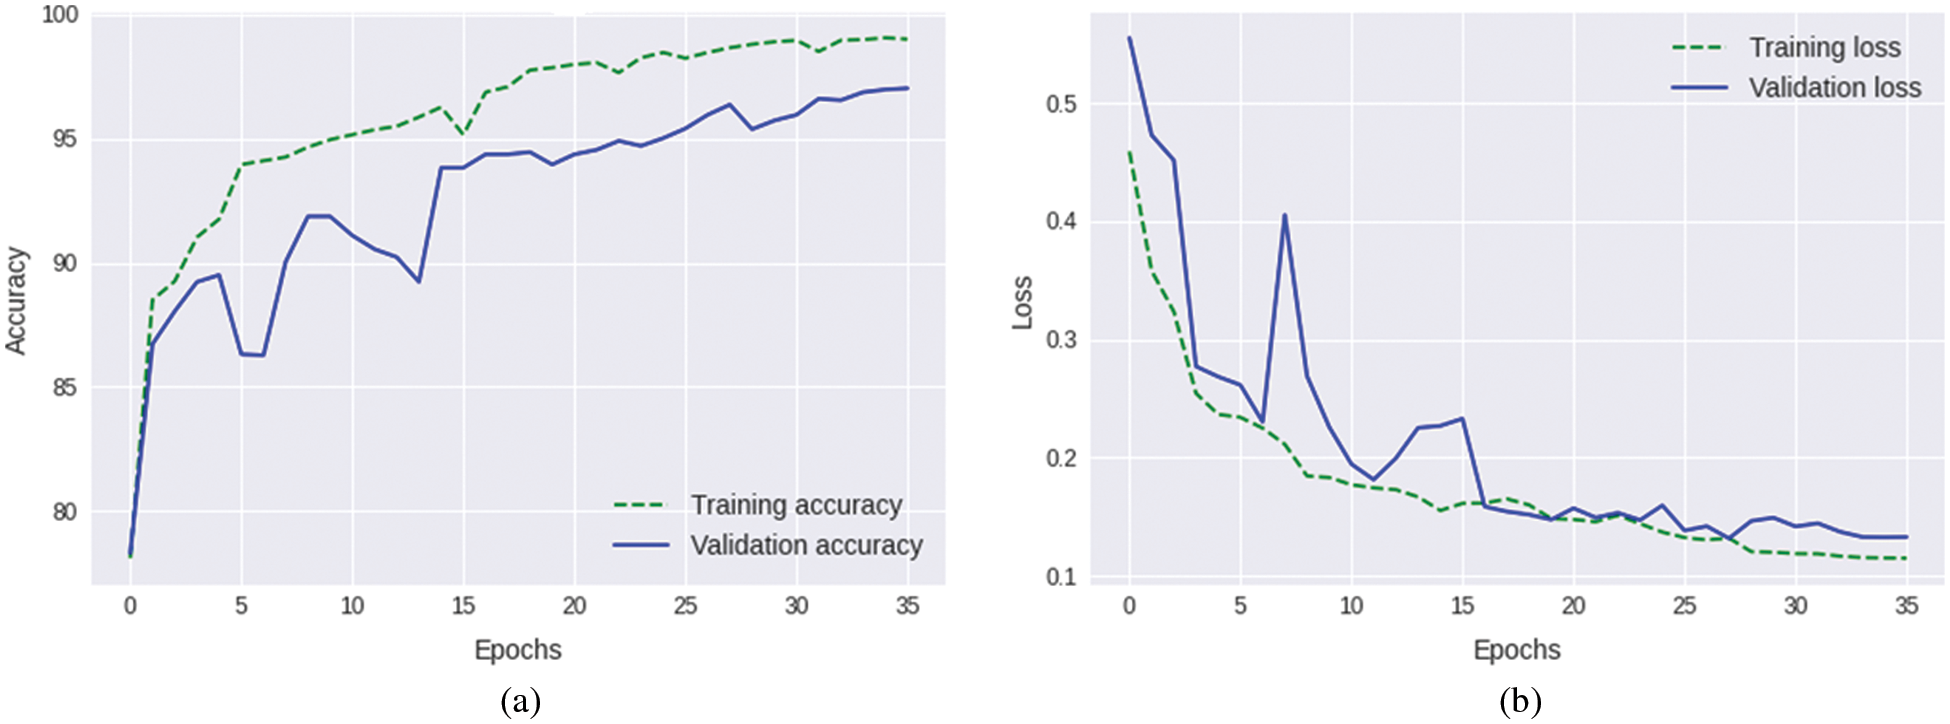
Figure 7: Training plots of the proposed ensemble model (a) Accuracy plot (b) Loss plot
In this subsection, the results of the different strategies used in this research are analyzed and compared with each other and with those of other techniques reported in the literature. The results clearly indicate that DenseNet201 performs better than MobileNetV2 in all respects. The same trend prevails when both models are trained on the pre-processed dataset. Moreover, the proposed ensemble model showed better performance when compared with the MobileNetV2 and DenseNet201 models. A significant improvement in performance was also noticed when using the feature selection technique. A visual illustration of the results, representing the accuracy of all six strategies adopted in this study, is presented in Fig. 8.
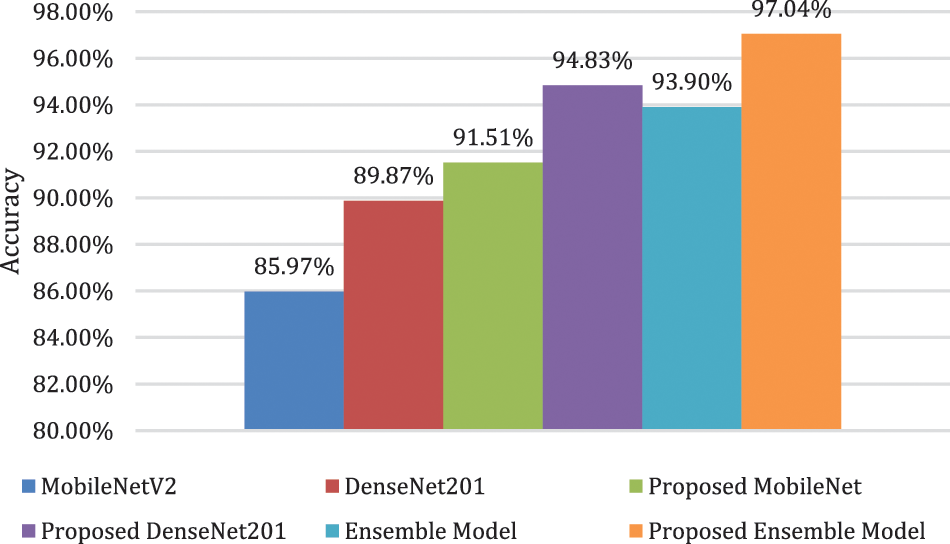
Figure 8: Comparison of different adopted strategies
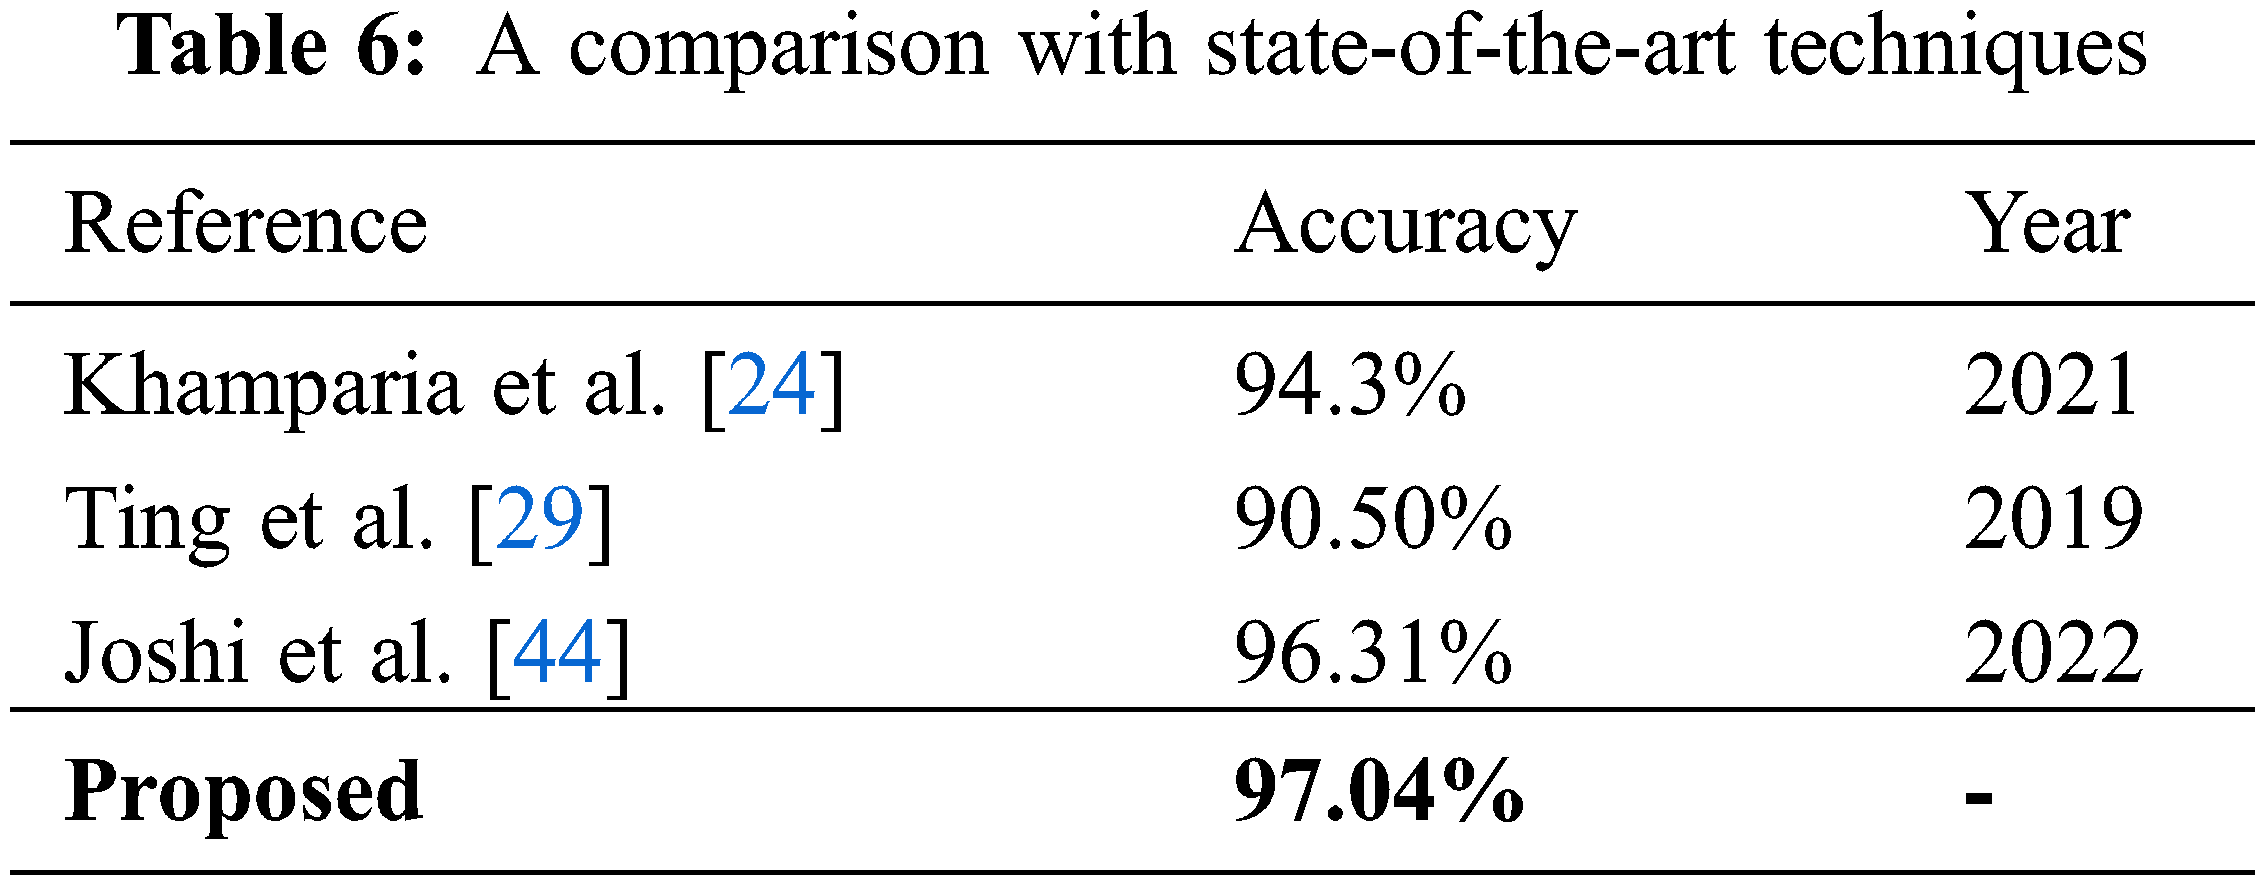
Fig. 8 clearly shows the superiority of the ensemble model over all the other techniques used in this study. Moreover, when the proposed technique is compared with other state-of-the-art techniques present in the literature, as shown in Table 6, it is evident that the model presented in this research surpasses other techniques in terms of performance.
In this paper, an automated, deep learning-based classification technique has been proposed that can perform multi-class breast cancer classification. The research utilized different augmentation techniques and an image enhancement technique to improve the quality of the dataset. Two different pre-trained deep learning models and an ensemble model were employed and thoroughly evaluated using several performance parameters. The results show that DenseNet201 was better at feature extraction than the lightweight MobileNetV2 model. Moreover, the results also show that the ensemble model formulated by combining the feature vectors of MobileNetV2 and DenseNet201 showed better results when pre-processing and optimization techniques were used to train the model. An entropy-based feature selection technique has been used in this work to refine the fused feature set obtained from the ensemble model. Based on the results, it can be said that pre-processing steps and enriched feature sets are important for improving the performance of the system, as the ensemble model with pre-processing steps outperformed all other methods in terms of the evaluation parameters used in the proposed work.
This technique can be extended to other classification problems related to medical imaging, such as chest infections and gastrointestinal abnormalities. Moreover, the pre-processing steps can also be improved to aid in the extraction of an enriched feature set. Different feature selection techniques can also be adopted, which may result in improved performance of the technique presented in this work.
Acknowledgement: This research work was funded by Institutional Fund Projects under Grant No. (IFPIP: 1614-611-1442). Therefore, the authors gratefully acknowledge technical and financial support from the Ministry of Education and King Abdulaziz University, DSR, Jeddah, Saudi Arabia.
Funding Statement: This research work was funded by Institutional Fund Projects under Grant No. (IFPIP: 1614-611-1442) from the Ministry of Education and King Abdulaziz University, DSR, Jeddah, Saudi Arabia.
Conflicts of Interest:The authors declare that they have no conflicts of interest to report regarding the present study.
References
1. R. L. Siegel, K. D. Miller and A. Jemal, “Cancer statistics, 2019,” CA: A Cancer Journal for Clinicians, vol. 69, no. 1, pp. 7–34, 2019. [Google Scholar]
2. S. C. Zhang, Z. Q. Hu, J. H. Long, G. M. Zhu, Y. Wang et al., “Clinical implications of tumor-infiltrating immune cells in breast cancer,” Journal of Cancer, vol. 10, no. 24, pp. 6175–6184, 2019. [Google Scholar]
3. H. D. Cheng, J. Shan, W. Ju, Y. Guo and L. Zhang, “Automated breast cancer detection and classification using ultrasound images: A survey,” Pattern Recognition, vol. 43, no. 1, pp. 299–317, 2010. [Google Scholar]
4. K. Yu, S. Chen and Y. Chen, “Tumor segmentation in breast ultrasound image by means of res path combined with dense connection neural network,” Diagnostics, vol. 11, no. 9, pp. 1565–1579, 2021. [Google Scholar]
5. Q. Sun, X. Lin, Y. Zhao, L. Li, K. Yan et al., “Deep learning vs. radiomics for predicting axillary lymph node metastasis of breast cancer using ultrasound images: Don’t forget the peritumoral region,” Frontiers in Oncology, vol. 10, pp. 53, 2020. [Google Scholar]
6. K. Jabeen, M. A. Khan, M. Alhaisoni, U. Tariq, Y. D. Zhang et al., “Breast cancer classification from ultrasound images using probability-based optimal deep learning feature fusion,” Sensors, vol. 22, no. 3, pp. 807, 2022. [Google Scholar]
7. R. Almajalid, J. Shan, Y. Du and M. Zhang, “Development of a deep-learning-based method for breast ultrasound image segmentation,” in Proc. ICMLA, Orlando, FL, USA, IEEE, pp. 1103–1108, 2018. [Google Scholar]
8. M. F. Mridha, M. A. Hamid, M. M. Monowar, A. J. Keya, A. Q. Ohi et al., “A comprehensive survey on deep-learning-based breast cancer diagnosis,” Cancers, vol. 13, no. 23, pp. 6116, 2021. [Google Scholar]
9. M. Ragab, A. Albukhari, J. Alyami and R. F. Mansour, “Ensemble deep-learning-enabled clinical decision support system for breast cancer diagnosis and classification on ultrasound images,” Biology, vol. 11, no. 3, pp. 439, 2022. [Google Scholar]
10. N. Mamat, M. F. Othman, R. Abdoulghafor, S. B. Belhaouari, N. Mamat et al., “Advanced technology in agriculture industry by implementing image annotation technique and deep learning approach: A review,” Agriculture, vol. 12, no. 7, pp. 1033, 2022. [Google Scholar]
11. N. R. de Oliveira, P. S. Pisa, M. A. Lopez, D. S. V. de Medeiros and D. M. Mattos, “Identifying fake news on social networks based on natural language processing: Trends and challenges,” Information, vol. 12, no. 1, pp. 38, 2021. [Google Scholar]
12. J. Schulte, M. Kocherovsky, N. Paul, M. Pleune and C. J. Chung, “Autonomous human-vehicle leader-follower control using deep-learning-driven gesture recognition,” Vehicles, vol. 4, no. 1, pp. 243–258, 2022. [Google Scholar]
13. J. G. Nam, S. Park, C. M. Park, Y. K. Jeon, D. H. Chung et al., “Histopathologic basis for a chest CT deep learning survival prediction model in patients with lung adenocarcinoma,” Radiology, vol. 305, no. 2, pp. 213–262, 2022. [Google Scholar]
14. M. Arabahmadi, R. Farahbakhsh and J. Rezazadeh, “Deep learning for smart healthcare—A survey on brain tumor detection from medical imaging,” Sensors, vol. 22, no. 5, pp. 1960–1987, 2022. [Google Scholar]
15. L. D. van Harten, C. S. de Jonge, K. J. Beek, J. Stoker and I. Išgum, “Untangling and segmenting the small intestine in 3D cine-MRI using deep learning,” Medical Image Analysis, vol. 78, pp. 102386–102398, 2022. [Google Scholar]
16. X. Yu, Q. Zhou, S. Wang and Y. D. Zhang, “A systematic survey of deep learning in breast cancer,” International Journal of Intelligent Systems, vol. 37, no. 1, pp. 152–216, 2022. [Google Scholar]
17. G. Chellamuthu, S. Kannimuthu and K. Premalatha, “Data mining and machine learning approaches in breast cancer biomedical research,” Sentiment Analysis and Knowledge Discovery in Contemporary Business, pp. 175–204, 2019. [Google Scholar]
18. H. A. Gaviria and M. S. Paja, “Breast cancer detection using digital histopathology images and pre-trained deep learning models,” Journal of Computer and Electronic Sciences: Theory and Applications, vol. 2, no. 2, pp. 27, 2021. [Google Scholar]
19. P. M. Arunkumar, S. Chandramathi and S. Kannimuthu, “Sentiment analysis-based framework for assessing internet telemedicine videos,” International Journal of Data Analysis Techniques and Strategies, vol. 11, no. 4, pp. 328–336, 2019. [Google Scholar]
20. J. E. Gutierrez, J. Cuello, C. Barraza, M. Gamarra, P. R. Aroca et al., “Analysis of pre-trained convolutional neural network models in diabetic retinopathy detection through retinal fundus images,” in Proc. CISIM, Barranquilla, Colombia, Cham, Springer, pp. 202–213, 2022. [Google Scholar]
21. M. Yousefi, R. Nosrati, A. Salmaninejad, S. Dehghani, A. Shahryari et al., “Organ-specific metastasis of breast cancer: Molecular and cellular mechanisms underlying lung metastasis,” Cellular Oncology, vol. 41, no. 2, pp. 123–140, 2018. [Google Scholar]
22. A. Rakhlin, A. Shvets, V. Iglovikov and A. A. Kalinin, “Deep convolutional neural networks for breast cancer histology image analysis,” in Proc. ICIAR, Póvoa de Varzim, Portugal, Cham, Springer, pp. 737–744, 2018. [Google Scholar]
23. Z. Fang, W. Zhang and H. Ma, “Breast cancer classification with ultrasound images based on SLIC,” in Proc. ICFC, Singapore, Springer, pp. 235–248, 2019. [Google Scholar]
24. A. Khamparia, S. Bharati, P. Podder, D. Gupta, A. Khanna et al., “Diagnosis of breast cancer based on modern mammography using hybrid transfer learning,” Multidimensional Systems and Signal Processing, vol. 32, no. 2, pp. 747–765, 2021. [Google Scholar]
25. V. Lahoura, H. Singh, A. Aggarwal, B. Sharma, M. A. Mohammed et al., “Cloud computing-based framework for breast cancer diagnosis using extreme learning machine,” Diagnostics, vol. 11, no. 2, pp. 241, 2021. [Google Scholar]
26. W. K. Moon, Y. W. Lee, H. H. Ke, S. H. Lee, C. S. Huang et al., “Computer-aided diagnosis of breast ultrasound images using ensemble learning from convolutional neural networks,” Computer Methods and Programs in Biomedicine, vol. 190, pp. 105361, 2020. [Google Scholar]
27. A. K. Mishra, P. Roy, S. Bandyopadhyay and S. K. Das, “Breast ultrasound tumour classification: A machine learning—Radiomics based approach,” Expert Systems, vol. 38, no. 7, pp. 12713, 2021. [Google Scholar]
28. A. Saber, M. Sakr, O. M. Abo-Seida, A. Keshk and H. Chen, “A novel deep-learning model for automatic detection and classification of breast cancer using the transfer-learning technique,” IEEE Access, vol. 9, pp. 71194–71209, 2021. [Google Scholar]
29. F. F. Ting, Y. J. Tan and K. S. Sim, “Convolutional neural network improvement for breast cancer classification,” Expert Systems with Applications, vol. 120, pp. 103–115, 2019. [Google Scholar]
30. S. Charan, M. J. Khan and K. Khurshid, “Breast cancer detection in mammograms using convolutional neural network,” in Proc. ICMET, Sukkur, Pakistan, IEEE, pp. 1–5, 2018. [Google Scholar]
31. S. Khan, N. Islam, Z. Jan, I. U. Din and J. J. P. C. Rodrigues, “A novel deep learning based framework for the detection and classification of breast cancer using transfer learning,” Pattern Recognition Letters, vol. 125, pp. 1–6, 2019. [Google Scholar]
32. C. Shorten and T. M. Khoshgoftaar, “A survey on image data augmentation for deep learning,” Journal of Big Data, vol. 6, no. 1, pp. 1–48, 2019. [Google Scholar]
33. W. Al-Dhabyani, M. Gomaa, H. Khaled and A. Fahmy, “Dataset of breast ultrasound image,” Data in Brief, vol. 28, pp. 104863, 2020. [Google Scholar]
34. E. Khan, M. Z. U. Rehman, F. Ahmed and M. A. Khan, “Classification of diseases in citrus fruits using squeezenet,” in Proc. ICAEM, Taxila, Pakistan, IEEE, pp. 67–72, 2021. [Google Scholar]
35. M. A. Khan, A. Alqahtani, A. Khan, S. Alsubai, A. Binbusayyis et al., “Cucumber leaf diseases recognition using multi-level deep entropy-ELM feature selection,” Applied Sciences, vol. 12, no. 2, pp. 593, 2022. [Google Scholar]
36. H. Salehi and J. Vahidi, “A novel hybrid filter for image despeckling based on improved adaptive wiener filter, bilateral filter and wavelet filter,” International Journal of Image and Graphics, vol. 21, no. 3, pp. 2150036, 2021. [Google Scholar]
37. B. Shruthi, S. Renukalatha and M. Siddappa, “Speckle noise reduction in ultrasound images-a review,” International Journal of Engineering Research & Technology, vol. 4, no. 2, pp. 1042–1046, 2015. [Google Scholar]
38. X. Zhang, “Image denoising using local wiener filter and its method noise,” Optik, vol. 127, no. 17, pp. 6821–6828, 2016. [Google Scholar]
39. J. Deng, W. Dong, R. Socher, L. J. Li, K. Li et al., “Imagenet: A large-scale hierarchical image database,” in Proc. CVPR, Miami, FL, IEEE, pp. 248–255, 2009. [Google Scholar]
40. E. Khan, M. Z. U. Rehman, F. Ahmed, F. A. Alfouzan, N. M. Alzahrani et al., “Chest X-ray classification for the detection of COVID-19 using deep learning techniques,” Sensors, vol. 22, no. 3, pp. 1211, 2022. [Google Scholar]
41. M. Sandler, A. Howard, M. Zhu, A. Zhmoginov and L. C. Chen, “Mobilenetv2: Inverted residuals and linear bottlenecks,” in Proc. CVPR, Salt Lake City, USA, IEEE, pp. 4510–4520, 2018. [Google Scholar]
42. G. Huang, Z. Liu, L. V. D. Maaten and K. Q. Weinberger, “Densely connected convolutional networks,” in Proc. CVPR, Las Vegas, USA, pp. 4700–4708, 2017. [Google Scholar]
43. M. Ahsan, M. A. Based, J. Haider and M. Kowalski, “COVID-19 detection from chest X-ray images using feature fusion and deep learning,” Sensors, vol. 21, no. 4, pp. 1480, 2021. [Google Scholar]
44. R. C. Joshi, D. Singh, V. Tiwari and M. K. Dutta, “An efficient deep neural network based abnormality detection and multi-class breast tumor classification,” Multimedia Tools and Applications, vol. 81, no. 10, pp. 13691–13711, 2022. [Google Scholar]
Cite This Article
 Copyright © 2023 The Author(s). Published by Tech Science Press.
This work is licensed under a Creative Commons Attribution 4.0 International License , which permits unrestricted use, distribution, and reproduction in any medium, provided the original work is properly cited.
 Downloads
 Citation Tools