
 Submit a Paper
 Propose a Special lssue
 Open Access
ARTICLE

An Intelligent Decision Support System for Lung Cancer Diagnosis
1 Electrical Engineering Department, College of Engineering, Northern Border University, Arar, Saudi Arabia
2 Electrical Engineering Department, Faculty of Engineering at Rabigh, King Abdulaziz University, Jeddah, Saudi Arabia
* Corresponding Author: Ahmed A. Alsheikhy. Email:
Computer Systems Science and Engineering 2023, 46(1), 799-817. https://doi.org/10.32604/csse.2023.035269
Received 15 August 2022; Accepted 28 October 2022; Issue published 20 January 2023
 View Full Text
 Download PDF
Abstract
Lung cancer is the leading cause of cancer-related death around the globe. The treatment and survival rates among lung cancer patients are significantly impacted by early diagnosis. Most diagnostic techniques can identify and classify only one type of lung cancer. It is crucial to close this gap with a system that detects all lung cancer types. This paper proposes an intelligent decision support system for this purpose. This system aims to support the quick and early detection and classification of all lung cancer types and subtypes to improve treatment and save lives. Its algorithm uses a Convolutional Neural Network (CNN) tool to perform deep learning and a Random Forest Algorithm (RFA) to help classify the type of cancer present using several extracted features, including histograms and energy. Numerous simulation experiments were conducted on MATLAB, evidencing that this system achieves 98.7% accuracy and over 98% precision and recall. A comparative assessment assessing accuracy, recall, precision, specificity, and F-score between the proposed algorithm and works from the literature shows that the proposed system in this study outperforms existing methods in all considered metrics. This study found that using CNNs and RFAs is highly effective in detecting lung cancer, given the high accuracy, precision, and recall results. These results lead us to believe that bringing this kind of technology to doctors diagnosing lung cancer is critical.Keywords
Lung cancer is a prevalent worldwide disease, and it occurs due to the uncontrolled growth of tissues inside the lungs or from the lymph nodes [1–3]. There has been a significant increase in the death rate from lung cancer in the last few years [1,4,5]. Healthcare providers and physicians count on different methods to diagnose lung cancers, including X-rays of the chest, CT scans, MRIs, and biopsies [6–13]. Initially, physicians determine the stage of cancer and its exact locations to prepare recovery treatment plans and tell patients what to expect in their path against the disease [14–16]. In general, two types of lung cancer exist [1,8,9,17]:
1. Small Cell Lung Cancer (SCLC) is caused by smoking and spreads faster than the other type.
2. Non-Small Cell Lung Cancer (NSCLC) is the most common type and grows slowly.
Among those two types, there are various subtypes: Adenocarcinoma, Large Cell Carcinomas, and Squamous Cell Carcinoma are recognized and determined to belong to NSCLC, while Small Cell Carcinoma and Combined Small Cell Carcinoma belong to SCLC as depicted in Fig. 1, where every type and its subtypes are distinguished and differentiated with a unique color.
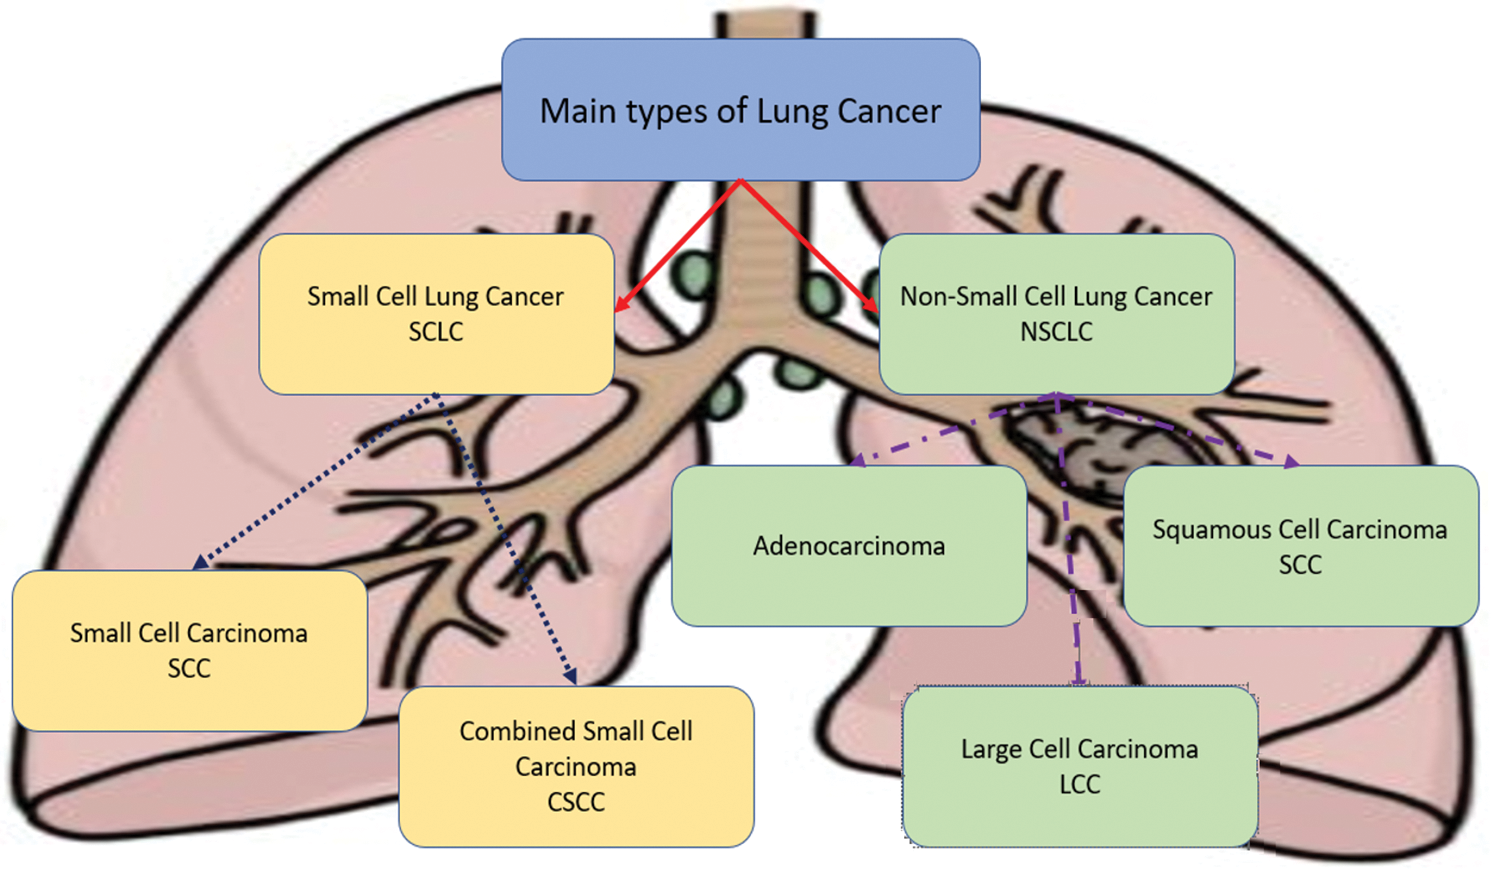
Figure 1: Types of lung cancers
Small Cell Carcinoma (SCC) and Combined Small Cell (CSC) are likely to occur in smokers. These two types are about 10% to 15% of all diagnosed lung cancers [9–12]. Adenocarcinoma is a type that occurs and forms in the glandular cells, which are located on the outer part of the lungs, and it spreads slower than other types of lung cancers [8,9]. Squamous Cell Carcinoma (SCC) cancer starts in the lung’s flat cells inside the airways. Large Cell Carcinoma (LCC) cancer can start and occur anywhere in the lungs. Furthermore, it grows and spreads more quickly than other types.
This study aims to create a system that detects both small and non-small cell lung cancers and their subtypes. Existing methods detect only one type of cancer, as mentioned in the literature section. Thus, the presented system should close this gap with a reliable Computer-Aided Diagnosis (CAD) system that detects and classifies both types of lung cancer and their subtypes to deliver accurate diagnoses that will save lives. The CAD system should offer healthcare providers an avenue for the comprehensive, integrated, and effective detection and classification of lung cancers and the appropriate treatment administration to patients.
The research is aligned with the Saudi 2030 vision, a twelve-part government initiative undertaken in Saudi Arabia in 2016 to provide a better life for its citizens and residents. One of its initiatives is to provide a better quality of life by enlarging its current health systems and networks, with an emphasis on discovering digital health solutions. The digital and electronic systems presented here should enhance the efficacy of lung cancer diagnosis in the kingdom.
In this article, the contribution is achieved by proposing the intelligent decision support system to detect and classify all types of lung cancers along with their subtypes since there are no current methods that detect and classify both types. According to our knowledge, the current approaches detect one type only. Thus, the proposed system closes this gap and provides a bridge to overcome this issue by implementing and developing a CAD solution to detect all types of lung cancer with high accuracy, which is found to be over 98% for both types. The obtained results uncover the presented system’s functionality, adequacy, and value. This system is easy to use and maintain and can detect both types of lung cancer. In addition, all subtypes are detected and classified as well.
The remaining of this article is organized as follows: Section 2 presents the related work, and Section 3 provides details about the developed system. Section 4 illustrates the proposed approach’s evaluation and results compared to other related works. Section 5 discusses the proposed system, while Section 6 provides the conclusion and future work.
As stated earlier, most existing methods identify and classify one type of lung cancer. At the same time, the presented system herein is developed and implemented to detect and classify both SCLC and NSCLC with high accuracy. In addition, CNN and numerous algorithms are used to provide a deep learning stage. The presented CAD system utilizes CNN and RFA together to provide better results.
Kadir in [1] Proposed detecting and classifying lung cancers using Machine Learning (ML) approaches. Two classifiers were utilized, which were Random Forest Classifier and XGBoost Classifier. Both classifiers are from supervised algorithms and are robust in classification objectives. The authors measured the performance of their approach by calculating the accuracy through the confusion matrix. Unfortunately, no performance metric was mentioned, and no results were reported, whereas the presented CAD system evaluates four performance metrics, and its accuracy is 98.7%. Moreover, the confusion matrix is involved in our research to measure the skill of the presented system.
Shimazaki et al. in [2] presented a deep learning approach to detect lung cancer on chest radiographs using a segmentation method. Their utilized dataset was collected from 2006 to 2018 from a hospital where the authors worked. The training dataset included nearly 630 radiograph images of lung tumors, and the testing dataset contained 150 images. The developed approach reached 73% precision. Our proposed system joints and integrates CNNs and RFAs to detect lung cancer. However, in comparison, the proposed system reaches over 98% accuracy, an F-score of more than 97%, and 99.072% precision which is better than what was achieved in [2].
In [3], Taher et al. provided an overview of lung cancer classification approaches and their performances. The authors performed analysis on numerous methods such as CNN, Support Vector Machine (SVM), ANN, Multi-Layer Perceptron (MLP), and additional algorithms were analyzed as well. The authors computed accuracy, sensitivity, and specificity as performance metrics. Furthermore, CNN got the highest accuracy which was 96%, while the implemented system reached over 98% of accuracy. Moreover, the proposed system achieves more than 98% precision while the obtained sensitivity was 75.862%. Interested readers can refer to [3] for additional information.
In [4], Kaur et al. implemented a method to detect and classify lung cancer using image processing and machine learning approaches, unlike the proposed CAD system herein. The authors aimed to help and support radiologists in collecting and analyzing all obtained data to detect lung cancer precisely. Precision and recall were computed as measurements of their approach’s performance. The developed approach in [4] obtained 97% and 98% for precision and recall, respectively, while our system achieves more than 98% for both metrics. Thus, the proposed system outperforms the method in [4] in precision and recall metrics. Interested readers can refer to [4] for additional information.
Devi in [5] developed a new architecture to detect lung cancers from CT images. It involved a three-stream network that extracted features manually and automatically from CT images. A custom deep learning approach and a residual deep neural network were utilized to perform an automated feature extraction process. The authors achieved 98.2% accuracy and 94.5% precision, while the proposed system herein, which also deploys a deep learning approach, improves accuracy, precision, recall, and f-score. Accuracy and precision are over 98.5% [5].
Ismail in [6] also detected and classified lung cancer using a machine learning algorithm. The author aimed to detect the diseases in their early stage and determine the accuracy of the implemented method. A deep learning method and CT scan images were utilized, not dissimilar to the presented system here. In addition, a K-means approach was used to perform segmentation and extract required features using various machine learning algorithms. The utilized dataset was split into two groups; one for training and one for validation and testing. The training group represented 80%, while the validation and testing group was 20%. The method presented in [6] was able to classify a tumor as benign or malignant, but the presented system in this research goes further and detects and classifies every subtype of both types, which are SCLCs and NSCLCs. Readers are advised to [6] for additional information.
Rahouma et al. in [7] developed a CAD system to detect and classify lung cancers based on four stages. A Gabor filter and a Kuwahara filter were utilized in the image preprocessing stage, and a Chan-Vese active contour approach was used to segment images. The required features were extracted using the Discrete Wavelet Transformation (DWT) technique. Thirteen features were extracted and fed into a Polynomial Neural Network (PNN) to train the implemented system. The authors achieved 96.66% accuracy, whereas the presented system herein achieves more than 98.5% accuracy. In addition, the presented system in this article outstands the implemented system in [7] for all measured performance metrics: accuracy, precision, recall, and specificity.
Agarwal et al. in [8] implemented an approach to detect and classify lung cancers based on a CNN tool, AlexNet. The developed system classified lung cancers as benign or malignant. It reached 96% accuracy that was obtained from CT images. The proposed system in this article uses CNN and RFA to detect and classify both types and their subtypes. Moreover, it achieves more than 98.5% accuracy, which is better than the developed approach in [8].
Heinzerling in [10], developed a deep learning approach to predict lung cancer. It utilized a CNN tool to extract features from CT images. It reached 94% accuracy, while our proposed system reached more than that, as mentioned earlier. Readers can refer to [10] for additional information.
The developed approach in this paper builds on the technologies deployed in the aforementioned literature, combining and enhancing their particular technologies. However, this approach shows itself to outperform the other approaches in that it can classify cancer down to the subtype.
Recent research and studies focused only on detecting and classifying one type of lung cancer. Since lung cancers can be one of two main types illustrated in Fig. 2, this severely limits a physician’s ability to diagnose lung cancer patients quickly. Thus, the authors of this paper aim to create a CAD system that can detect and classify all types of lung cancer along with their subtypes for improved diagnosis and treatment. For this system to be functional, it should also be able to execute detection and classification procedures quickly.
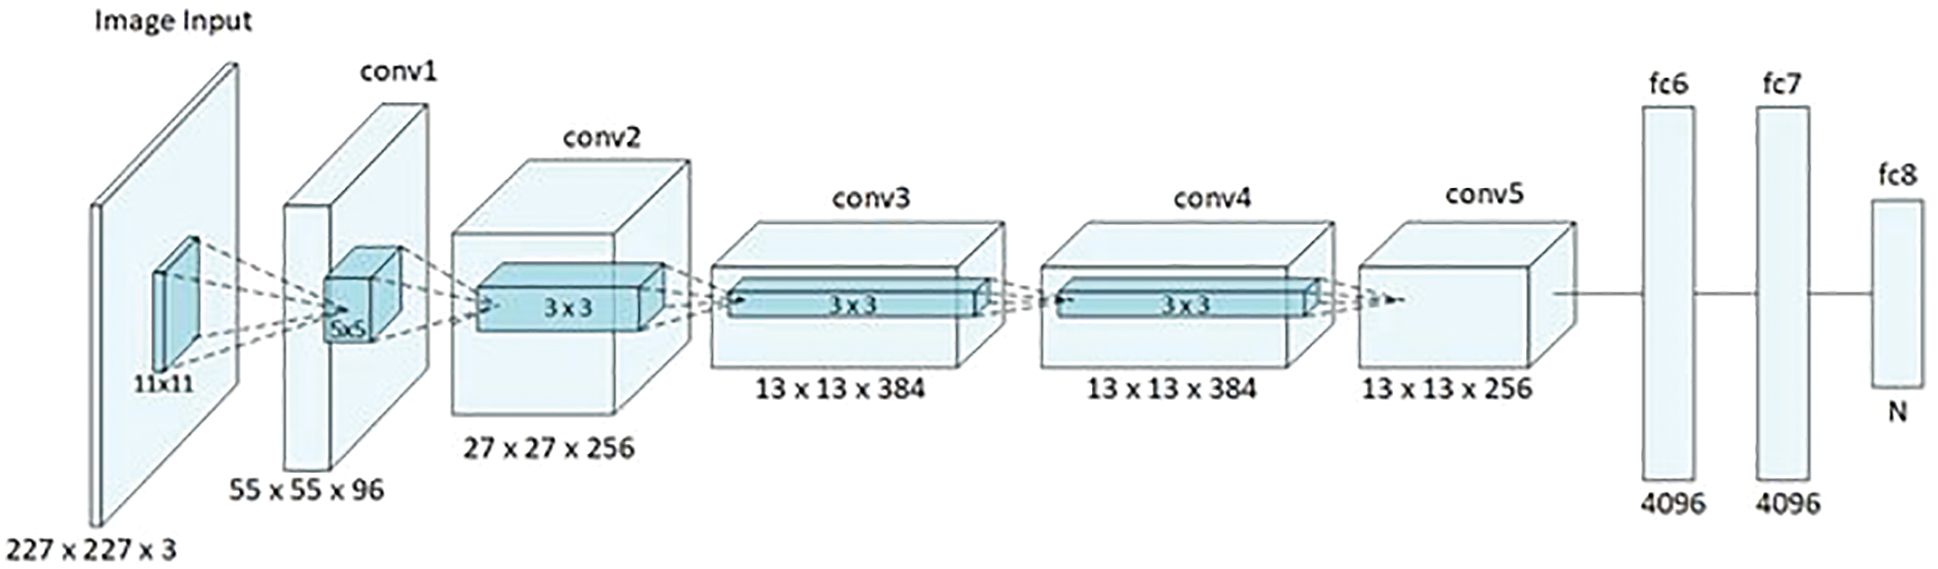
Figure 2: AlexNet architecture [18]
This research aims to solve the problems mentioned above by:
• Investigating and examining current algorithms to determine their weaknesses and gaps.
• Finding and downloading two available lung cancer datasets and performing analyses to test them.
• Presenting an efficient CAD system to detect and classify all types of lung cancer by integrating a Convolutional Neural Network and a Random Forest Algorithm.
• Calculating the number of detected cancerous spots in a selected dataset of images.
• Calculating several performance metrics to compare the proposed system with other methods.
• Finding and applying a confusion matrix that can test whether or not the presented CAD system classifies inputs properly.
The presented CAD system in this article detects and classifies lung cancers as SCLC or NSCLC rapidly and precisely. This system contains a combination of various phases through which it accomplishes the main objective of every physician, to preserve lives. The proposed approach uses the Random Forest Algorithm (RFA) and a CNN, AlexNet [18], to detect and classify lung cancers. As illustrated in Fig. 2, AlexNet has eight layers, five of which are convolutional layers and the remaining three of which are fully connected. In the summary of the system we have developed, we provide detailed descriptions and graphs to show the system generates outputs.
AlexNet takes a 227 × 227 × 3 size input image and applies an 11 × 11 filter to it, as depicted in Fig. 2. A final layer softens the outputs. AlexNet uses a Rectified Linear Unit (ReLU) for nonlinearity [18]. ReLU uses Principal Component Analysis (PCA) to minimize the resulting error [18].
A Random Forest Algorithm (RFA) is a supervised machine learning algorithm used to classify a sequence of inputs which is particularly beneficial for regression tasks [19]. Any decision it makes is achieved by noting the majority decision among a series of constructed decision trees built on various patterns. Fig. 3 illustrates how an RFA reaches an output. In this research, the number of training samples in the RFA (n) is set to be an odd number = 7, so a majority can be achieved. Typically, RFAs have four stages, summarized as follows:
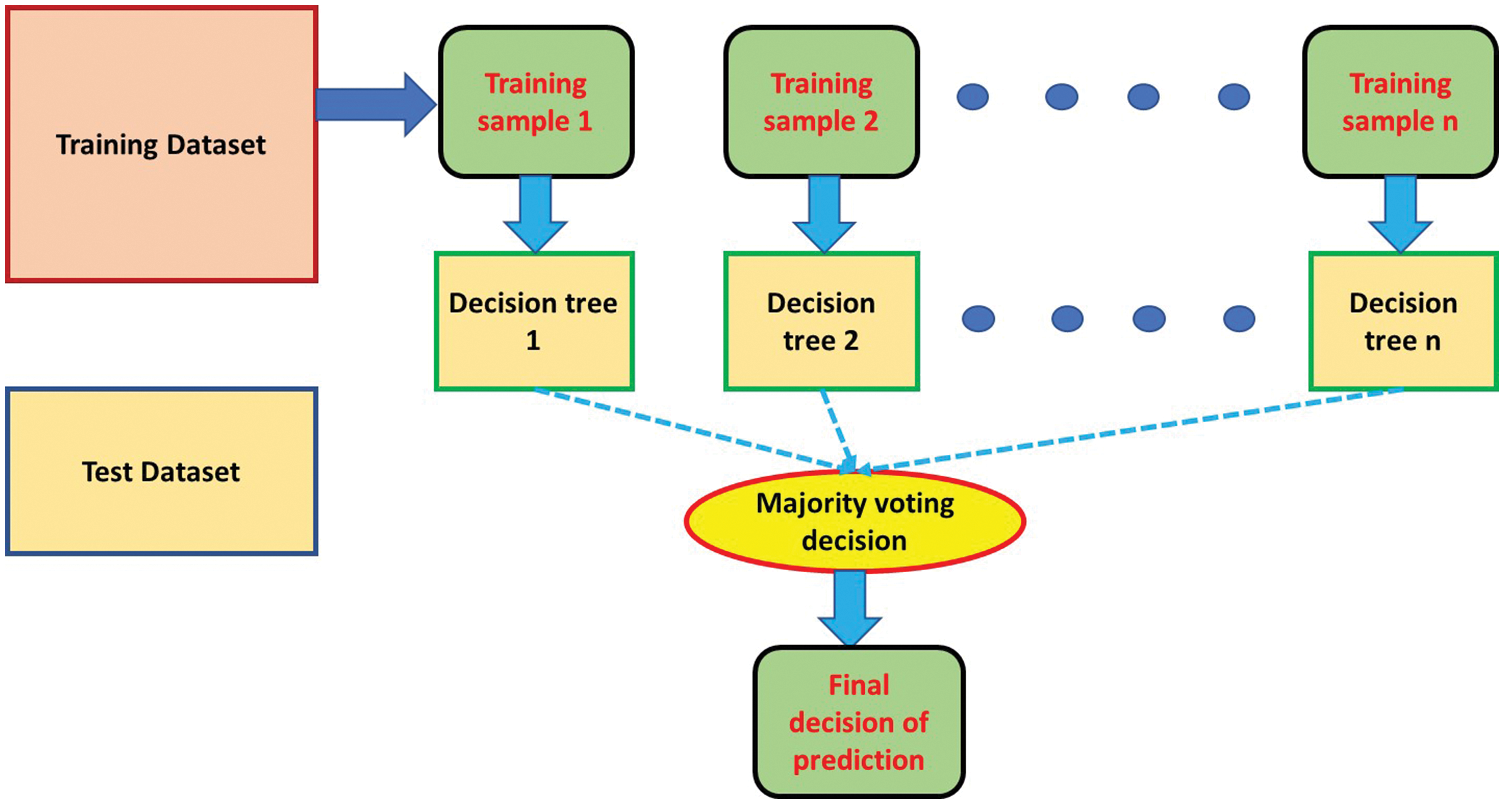
Figure 3: Illustration of RFA algorithm
Ultimately, RFA is used in this study due to its ease of handling and consistent and accurate result:
A. A random number of records (n = 7) is taken from the utilized dataset from Kaggle.
B. The algorithm builds a unique decision tree for every record (n = 7).
C. Output is determined from every decision tree (n).
D. The classification’s final output is decided by taking a majority vote from the (n) decision trees.
Ultimately, RFA is used in this study due to its ease of handling and its consistent and accurate results.
In this research, histogram and energy features, among others, are used to train the proposed system to detect and classify the disease. Figs. 4 and 5 depict samples of the generated charts for the two mentioned features, respectively. Fig. 4 shows histogram charts for cancerous lungs and healthy lungs, and Fig. 5 presents the plot of the obtained energy from the presented CAD system for healthy and cancerous lungs. The other extracted features besides the previously mentioned features are the size of the detected tumor, diameter, area, variance, median, mean, standard deviation, Root Mean Square (RMS), contrast, correlation, and homogeneity. In total, thirteen features are utilized in this study.
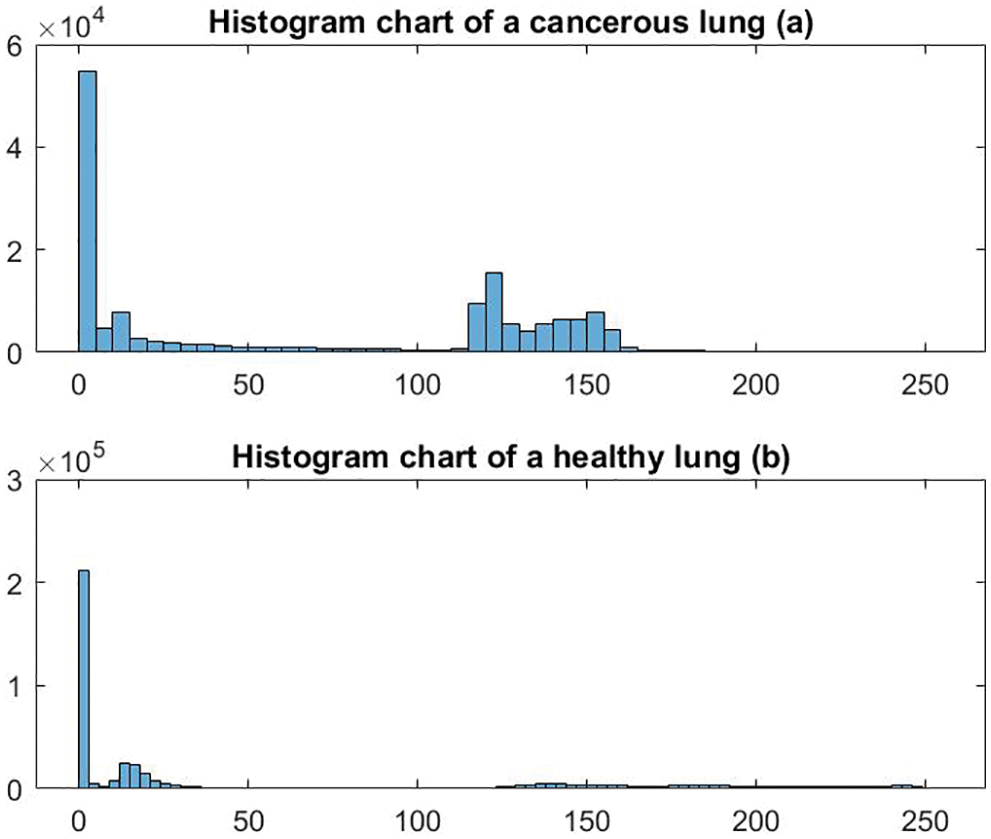
Figure 4: Sample of generated histogram charts
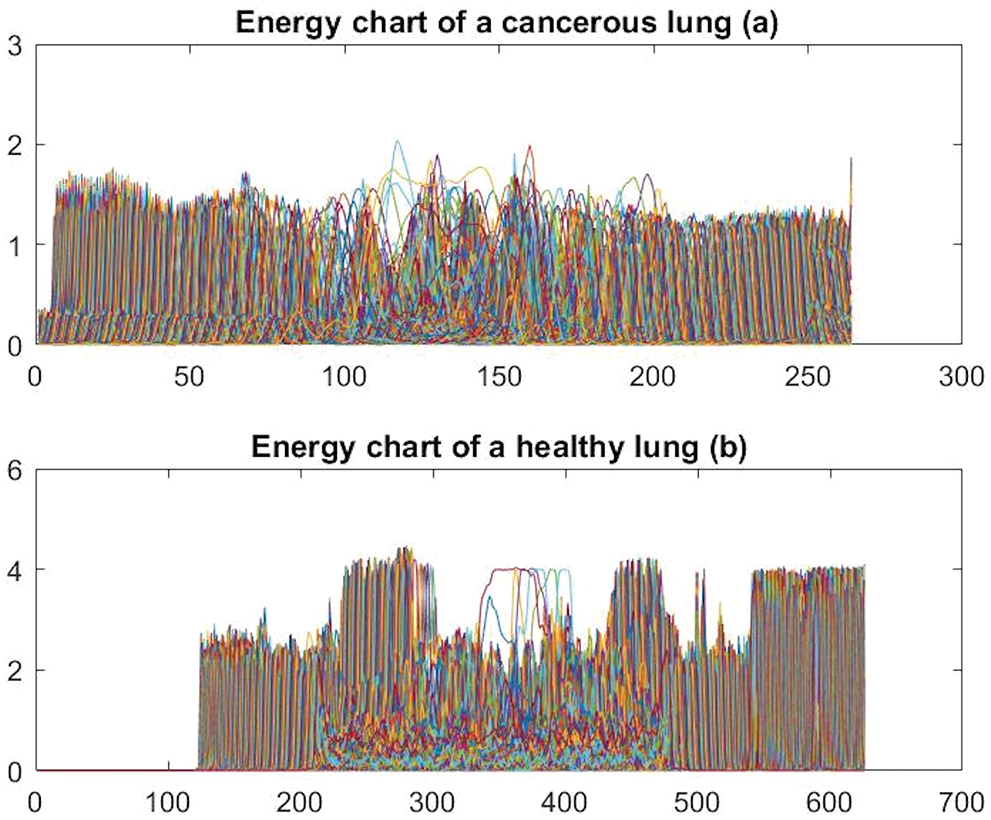
Figure 5: Sample of generated energy charts
The proposed algorithm to detect and classify lung cancer is illustrated as follows:
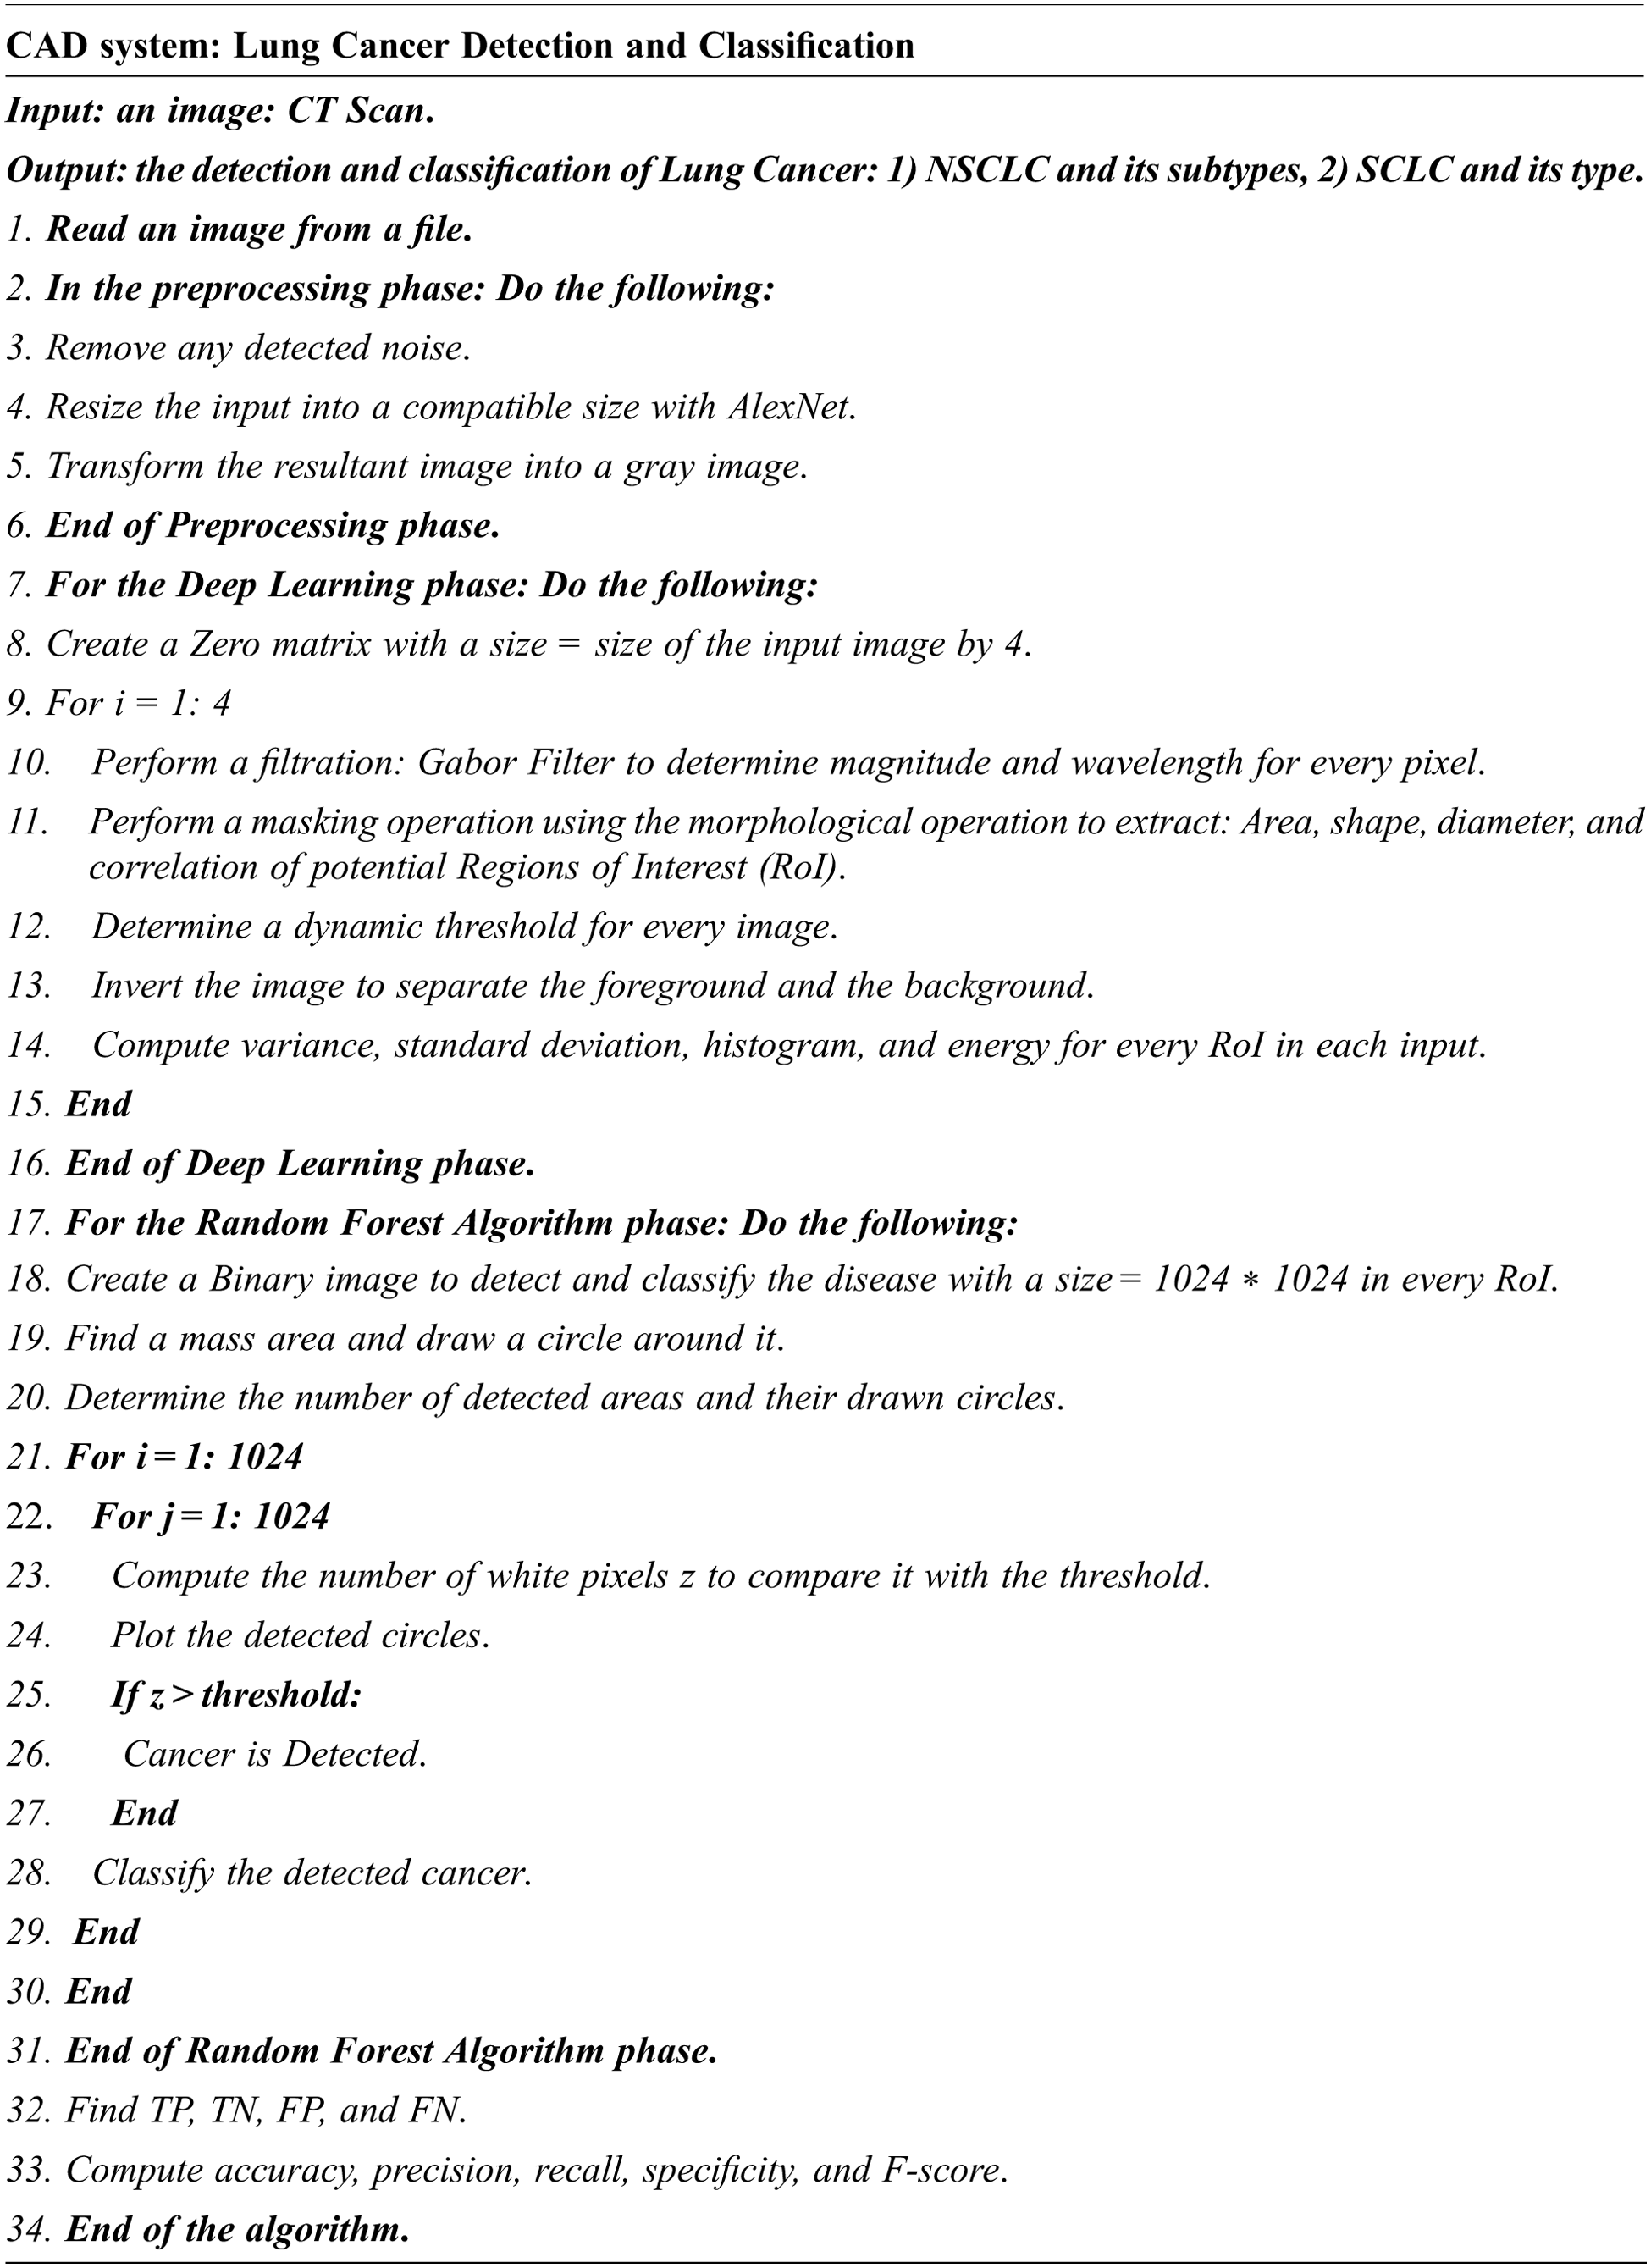
Fig. 6 illustrates the flowchart of the presented and implemented decision support system.
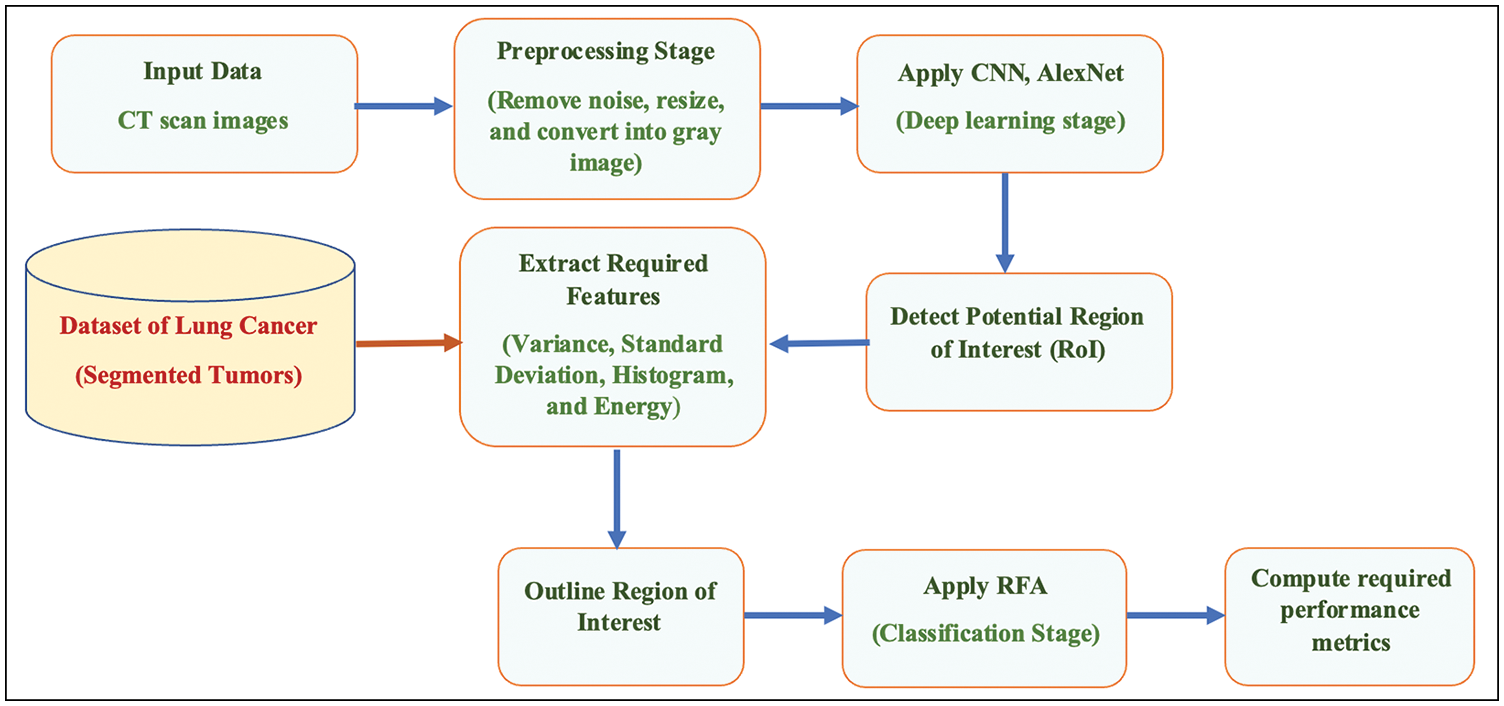
Figure 6: Flowchart of the proposed system
The presented CAD system in this research has several advantages, which are summarized as follows:
A. It is easy to use and maintain.
B. It is a reliable and feasible system.
C. No particular components and hardware are required.
D. It detects and classifies all types of lung cancer depicted in Fig. 1.
E. It measures several performance parameters/metrics, including accuracy, precision, recall, specificity, and F-score.
F. It produces promising results with more than 98% accuracy and an F-score of nearly 99%.
In this paper on lung cancer detection, the authors outline the detected cancer area(s) in blue. The blue is an indicator of spots with cancer. Numerous performance metrics are computed in the developed CAD system as follows:
1. True Positive (TP): the number of appropriately detected and classified types of lung cancer in the utilized dataset.
2. False Positive (FP): the number of detected and classified types that are predicted improperly.
3. True Negative (TN): the number of healthy lungs classified accurately and properly.
4. False Negative (FN): the number of negative outcomes detected and classified incorrectly by the presented system.
5. Precision (Prec): the ratio of the correctly identified types over the summation of the classes that are identified incorrectly plus the correctly identified types as demonstrated in the equation:
6. Recall (Reca): the ratio of the truly identified classes over the summation of the true images plus the number of negative classes that are incorrectly classified as depicted in (2). In addition, it is called sensitivity as well.
7. Accuracy (Accur): this parameter indicates how well the proposed method performs, and it is calculated as follows:
where X is the total number of images being tested and computed as follows:
8. Specificity (Spec): the ability of the proposed system to classify any sample that is not associated with any type of labeling data. It is calculated as follows:
9. F-Score: the harmonic mean of the recall and precision of the implemented system. Thus, the higher the value of F-score is, the better model is implemented, and it is evaluated as follows:
Several evaluation trials were conducted on MATLAB to validate the developed algorithm and test its procedures and outcomes. The presented CAD system was tested over 1000 times, and it took nearly 11 h for the training phase to achieve its highest results. During the training stage, the for-loop instruction is set to run around 10,000 times to allow the system to learn deeply by itself in order to achieve accurate results. Various scenarios were tested to illustrate how the system works to detect the already presented lung cancer type. The calculation of required performance metrics and a confusion matrix are presented in this section. Further provisioned in this section is a comparative assessment between some approaches in the related work and the proposed algorithm.
MATLAB was vital in all simulation scenarios as it provides built-in tools for image processing. These tools are utilized and employed in the developed method. The proposed system generates six subgraphs for each input image. When a patient’s lungs are healthy, three subgraphs, b, c, and d, show no blue circles or dots, implying no cancer cells. When cancer is detected, the number of detected lung cancer areas is provided. In this article, six scenarios were conducted to detect and classify every subtype and identify healthy lungs. These six scenarios are as follows:
4.1 Scenario 1: Adenocarcinoma
Adenocarcinoma is a subtype of NSCLC. The proposed system detected and classified it correctly, as illustrated in Fig. 7. This figure contains six subgraphs which are: an input image in (a), (b) shows its segmented output with blue circles around potential areas of possible cancer. (c) displays only the outlined regions or spots that contain the disease, (d) shows the detected cancer areas in the lungs, (e) shows the obtained histogram chart, and (f) displays the obtained energy plot. Beneath the subgraphs in Fig. 7, there is displayed the calculated number of cancer spots that were detected along with their classification type.
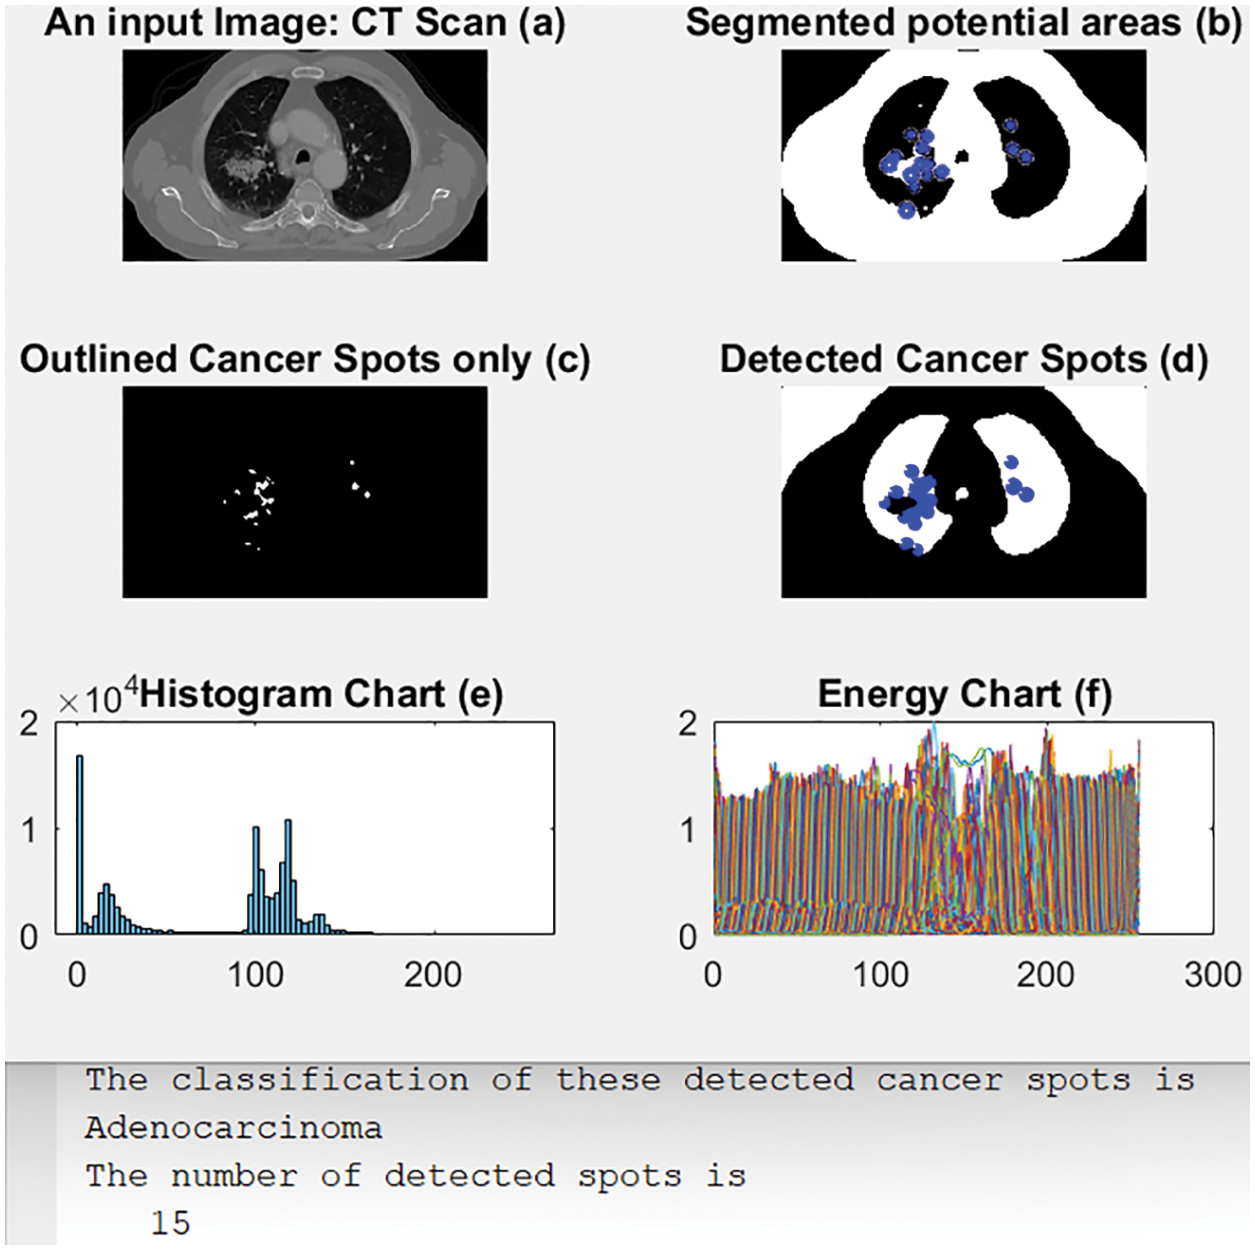
Figure 7: The obtained outcomes of scenario 1
As shown in Fig. 7, the presented decision support system segmented potential areas or Regions of Interest (RoI). These potential areas are encircled in blue. Then, these regions of interest are separated from the original input image. After that, these blue dots are placed into their correct positions in the original image, as in (d). Lastly, the histogram chart and energy plot are computed as in (e) and (f), respectively. The same procedures are repeated in the following scenarios.
4.2 Scenario 2: Large Cell Carcinoma
As in Figs. 7 and 8 illustrates an original input image in (a). (b) shows the segmented output with blue circles around regions of interest of possible cancer. (c) outlines only the detected regions or spots containing the disease, and (d) shows the detected cancerous lungs and areas. (e) and (f) display the obtained histogram and energy charts, respectively, of the input data. Fig. 8 also shows the calculated number of cancer spots detected and their classification type beneath the subgraphs.
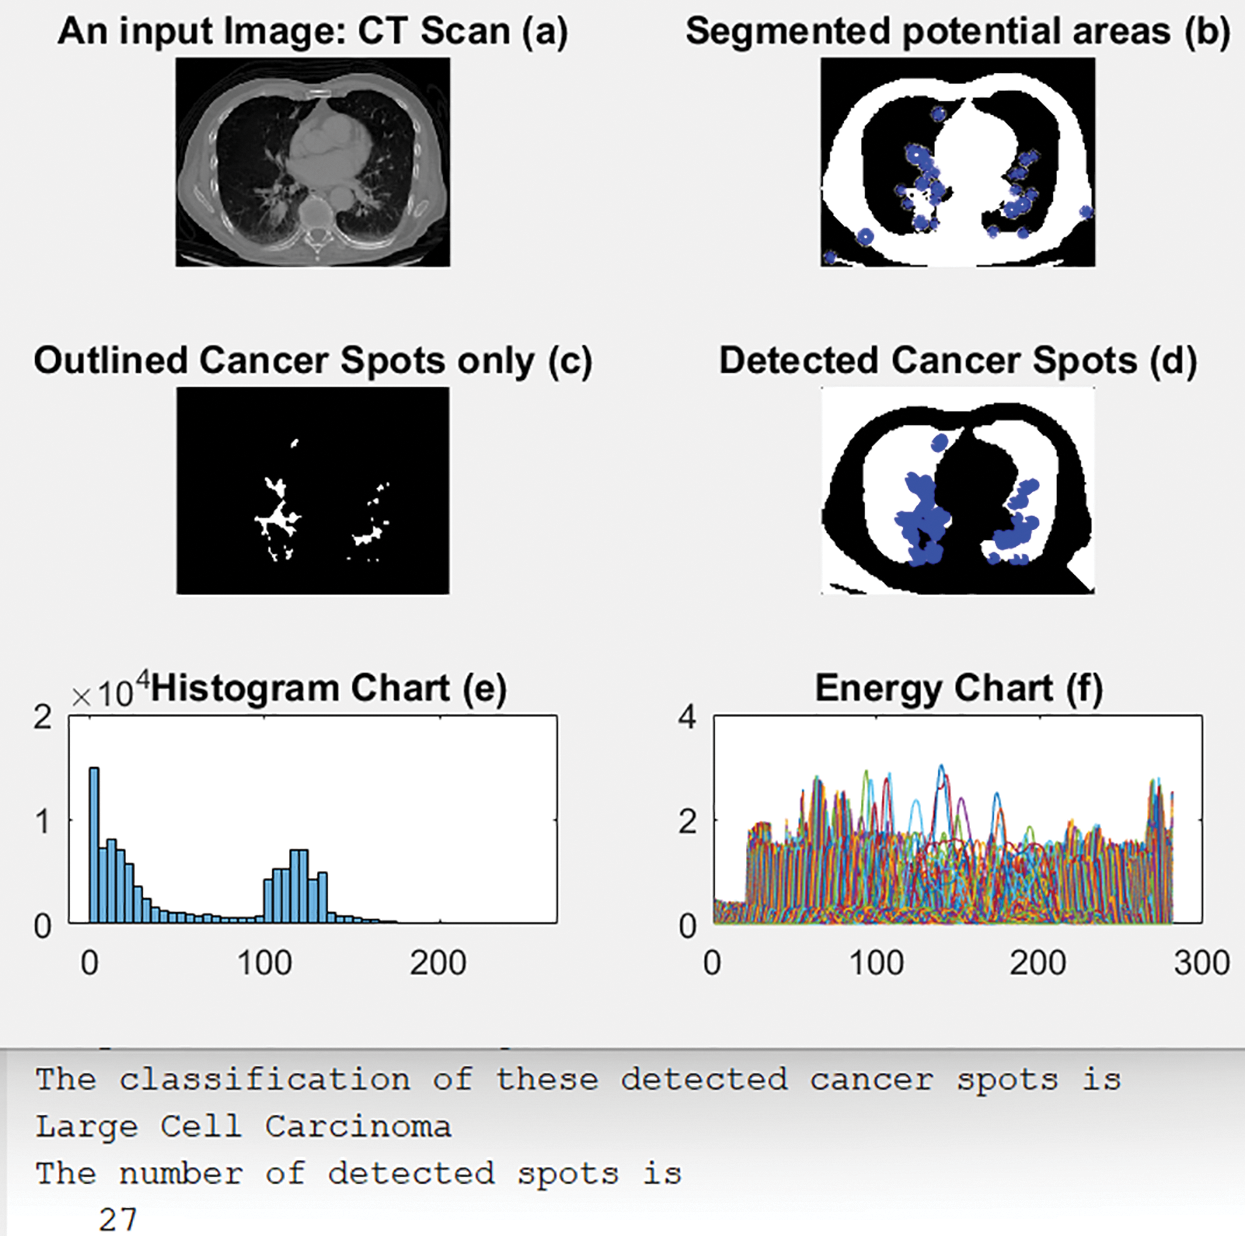
Figure 8: Outcomes of scenario 2
The proposed CAD system generated the outputs shown in Fig. 8. The system learns by itself through the deep learning algorithm which type of detected cancer has been detected from the outputs. Every RoI is surrounded by a blue circle, as depicted in Fig. 8b, and all cancer spots are outlined and shown alone, as in Fig. 8c. Moreover, the system determines the number of all detected cancer cells.
4.3 Scenario 3: Squamous Cell Carcinoma
Fig. 9 illustrates an original CT-Scan image in (a); (b) shows the segmented output with blue circles around regions of interest of possible cancer. (c) displays only the detected regions or spots that contain the disease, and (d) shows the detected cancerous lungs and their cancer dots. The histogram and energy plots are shown in (e) and (f). Moreover, Fig. 9 shows the calculated number of cancer spots detected and their classification type, in this case, Squamous Cell Carcinoma.
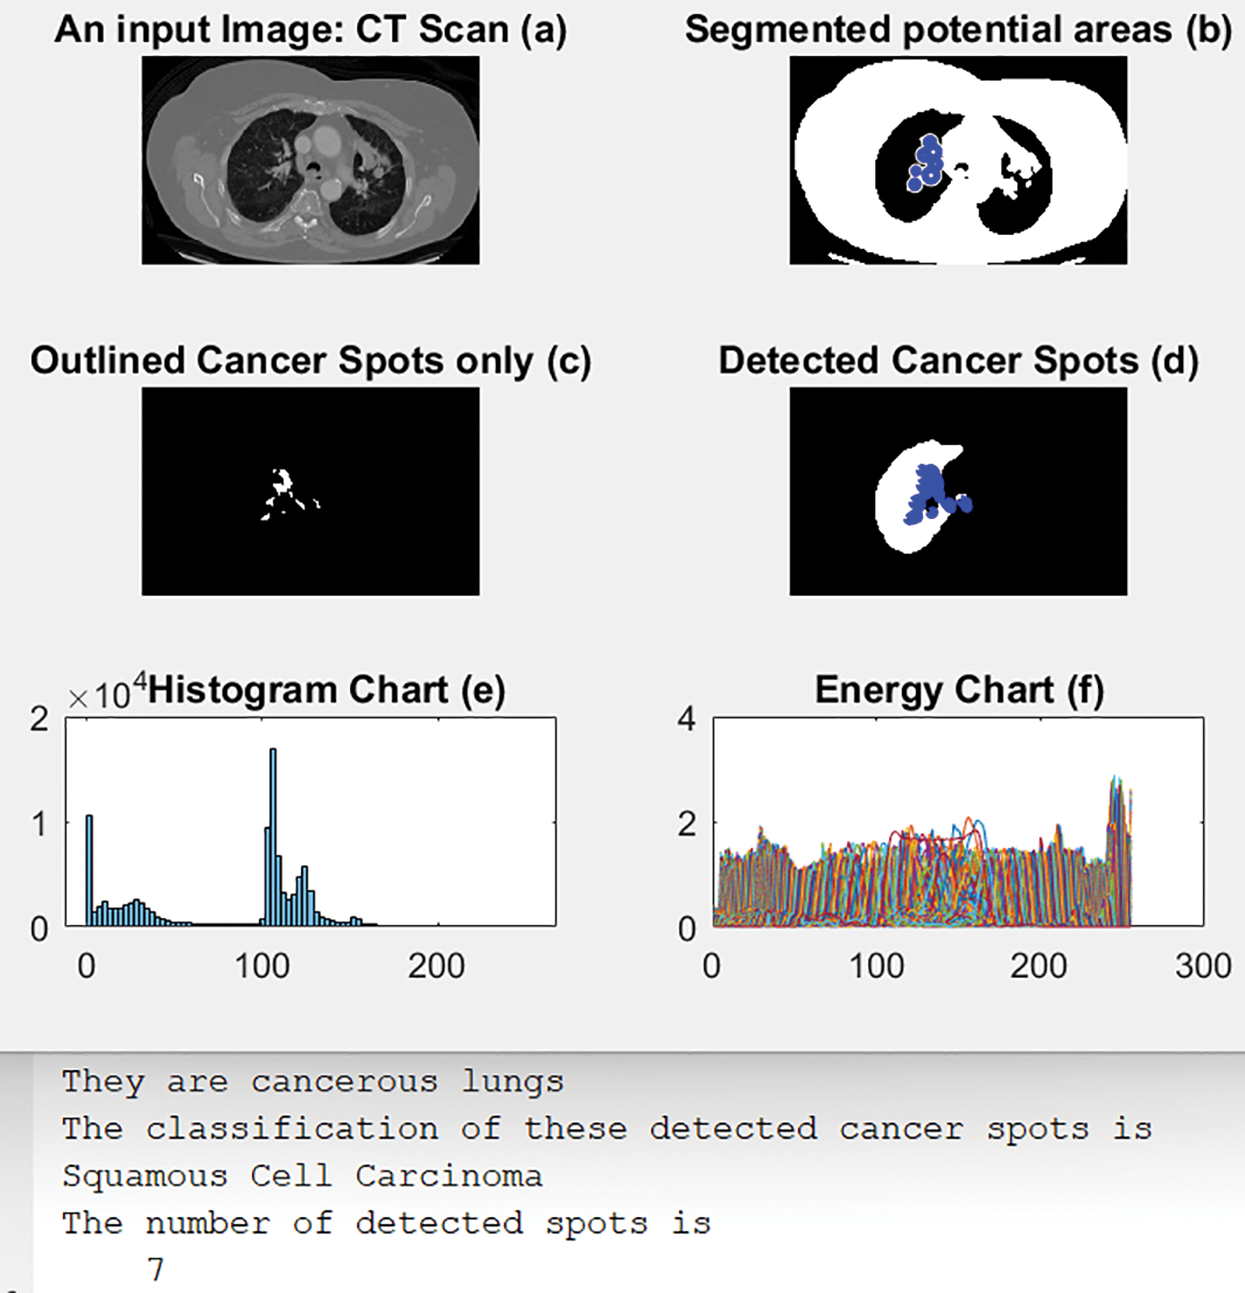
Figure 9: The outputs of scenario 3
4.4 Scenario 4: Small Cell Carcinoma
Fig. 10 illustrates an original input image in (a); (b) shows its segmented output with blue circles around regions of interest of possible cancer. (c) displays only the detected regions or spots that contain the disease, and (d) shows the detected cancerous lungs and their cancer dots. The histogram and energy plots are displayed in (e) and (f). The computed number of detected cancer spots and classification type, here, Small Cell Carcinoma, are shown in the figure as well.
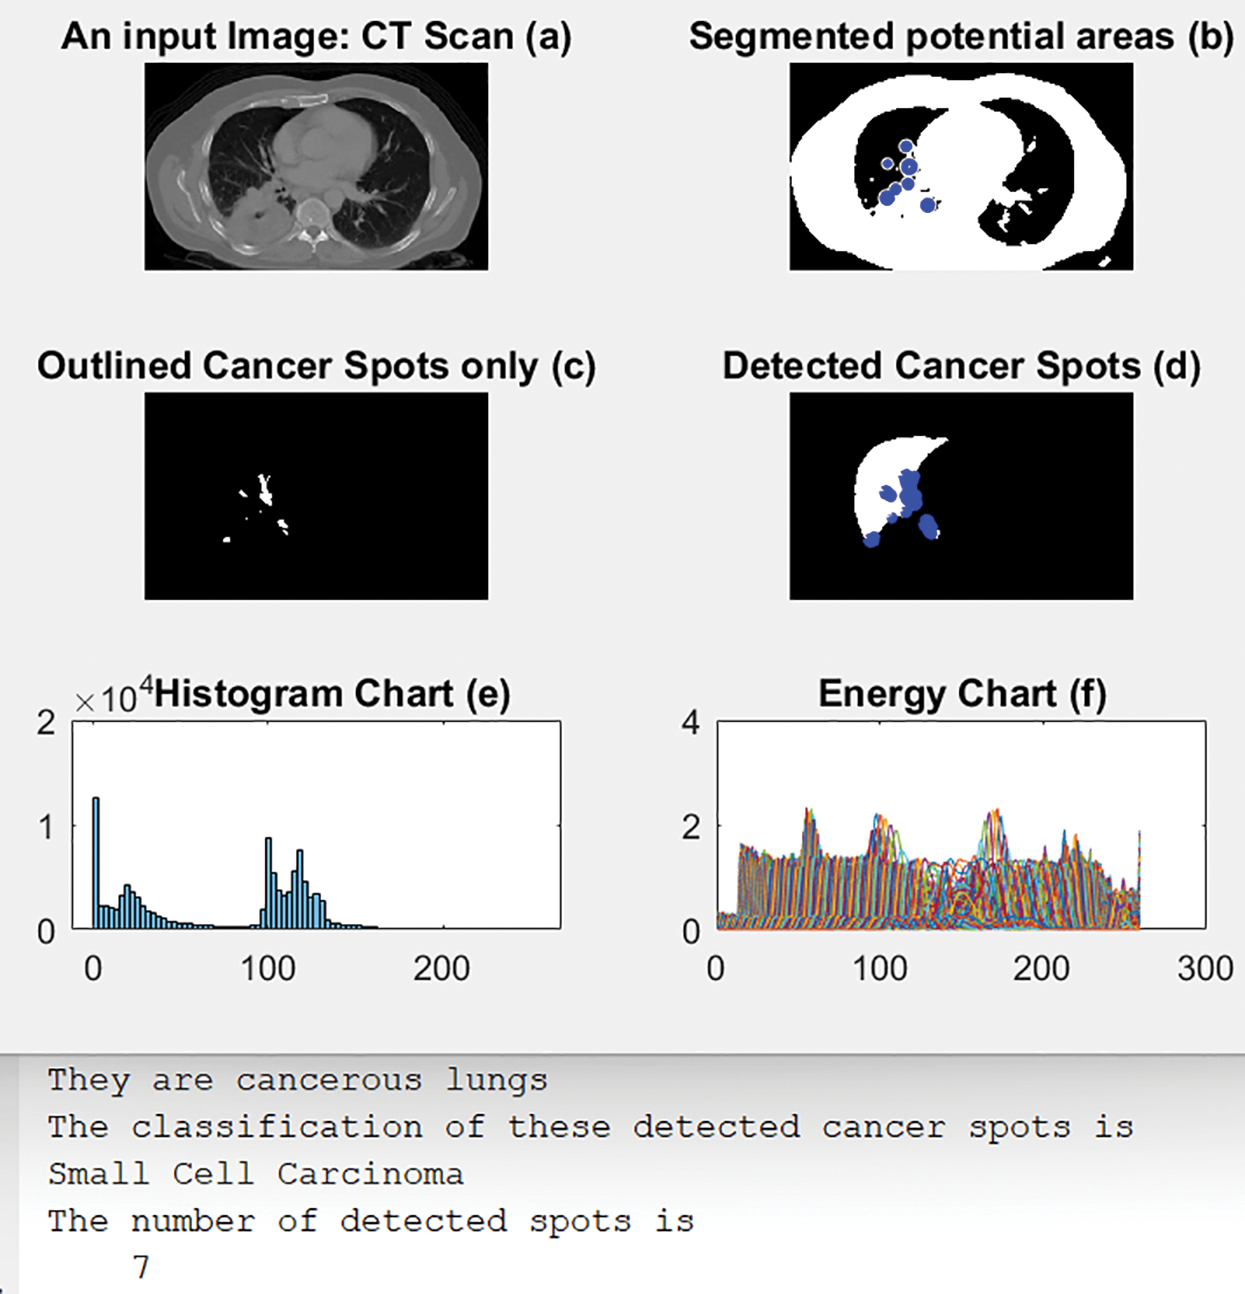
Figure 10: Obtained outcomes of scenario 4
4.5 Scenario 5: Combined Small Cell Carcinoma
Fig. 11 illustrates an original CT-Scan image in (a); (b) shows its segmented output with blue circles around regions of interest of possible cancer. (c) displays only the detected regions or spots that contain the disease, and (d) shows the detected cancerous lungs and their cancer dots. The histogram and energy plots are shown in (e) and (f). Fig. 11 also shows the calculated number of cancer spots that were detected in addition to their classification type, namely Combined Small Cell Carcinoma.
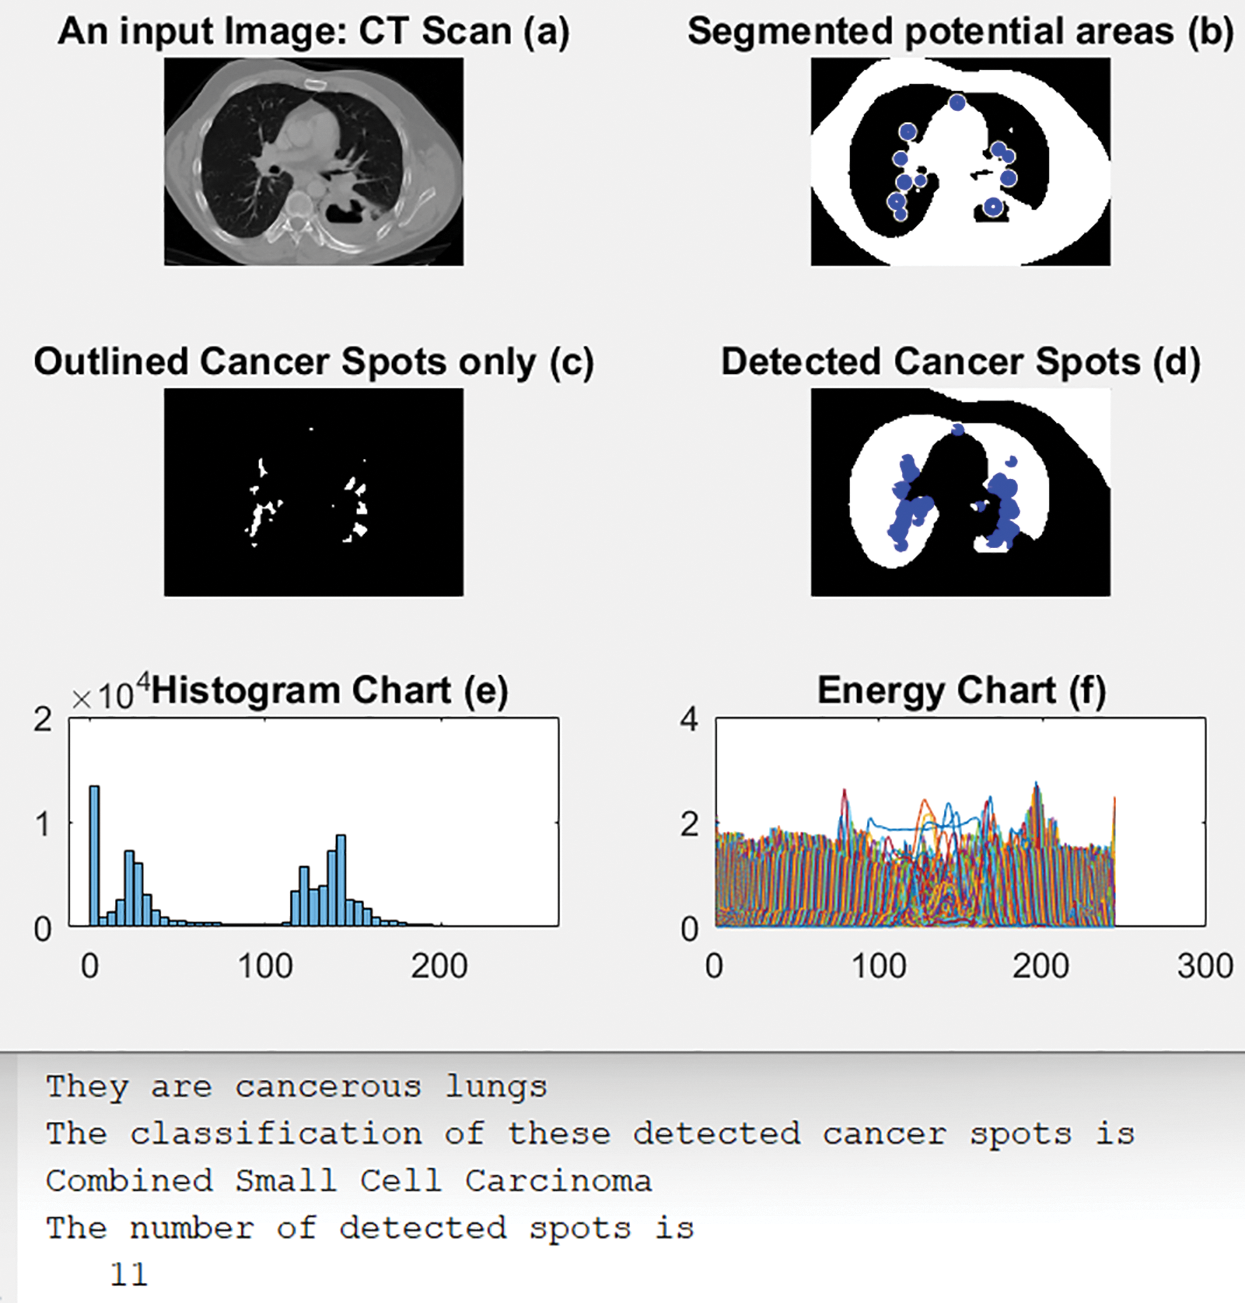
Figure 11: Results of scenario 5
Fig. 12 illustrates an original CT-Scan image in (a); (b) shows its segmented output with blue circles around regions of interest of possible cancer. (c) displays only the detected regions or spots that contain the disease, and (d) shows the detected cancerous lungs and their cancer dots. The histogram and energy plots are shown in (e) and (f).
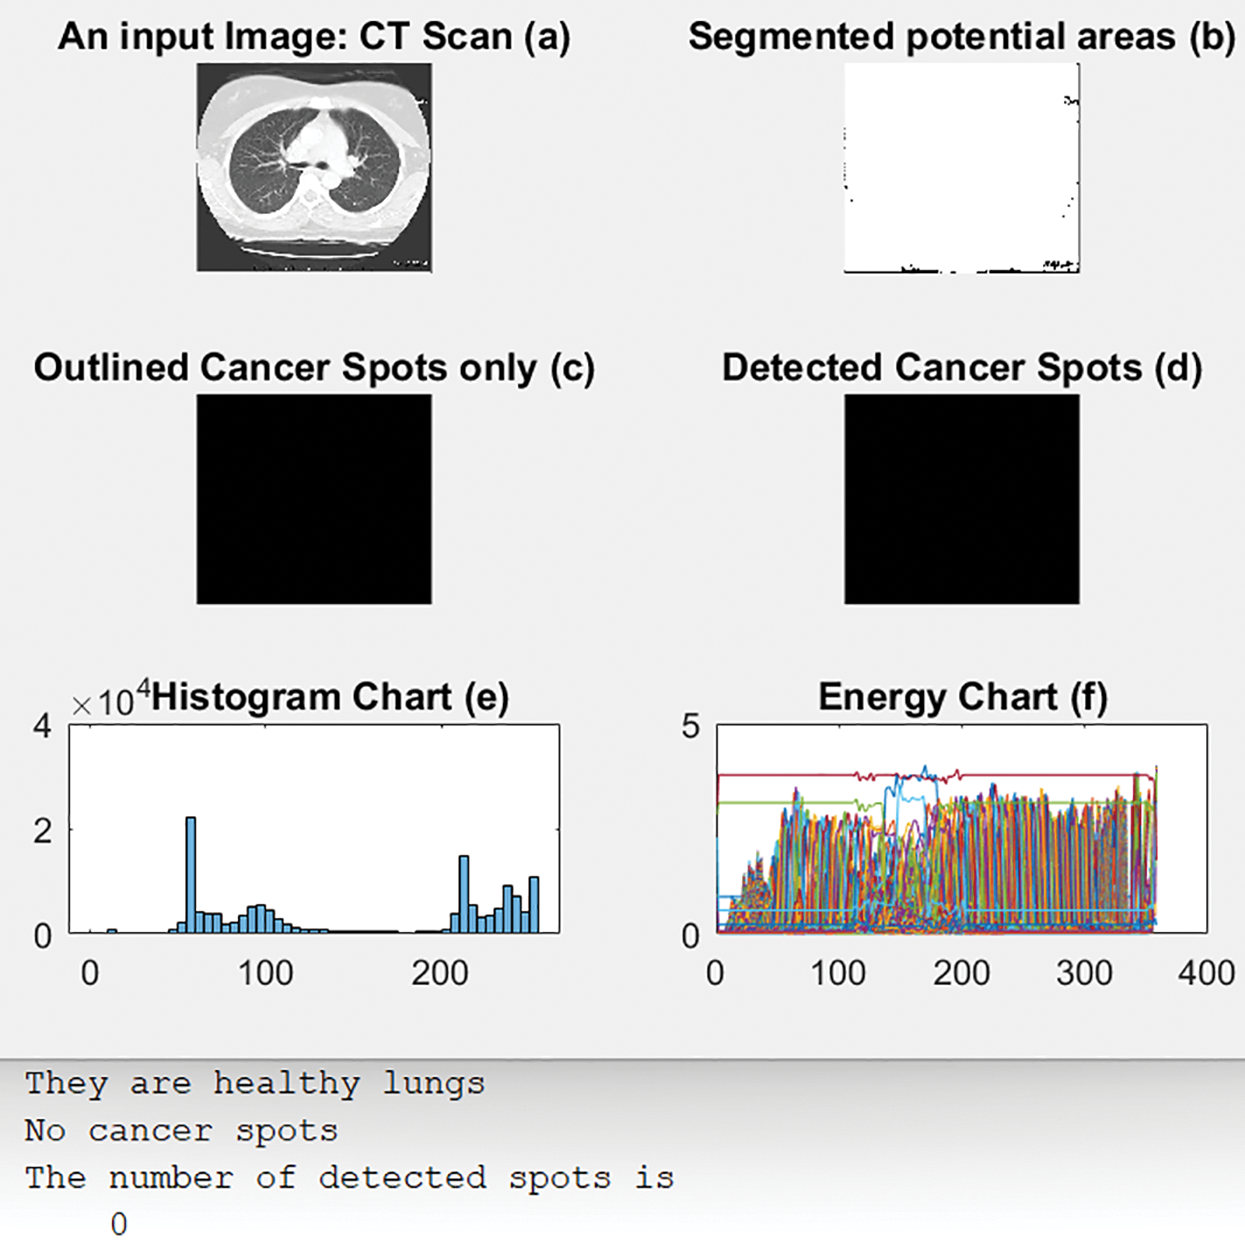
Figure 12: Outputs of scenario 6
As shown in the previous graphs from 7 to 12, the energy values of cancerous lungs are less than 300, whereas the maximum energy values for healthy lungs are near 500, as illustrated in Fig. 7a. There are apparent differences between cancerous and healthy lungs for the histogram charts, as depicted in Figs. 4a and 4b.
Table 1 lists all values for the proposed model’s performance metrics. Accuracy, precision, recall, specificity, and F-score are measured in percentages. Exactly 780 CT-Scan images were inspected and assessed. The developed algorithm reaches an acceptable range for all metrics, as shown in Table 1.
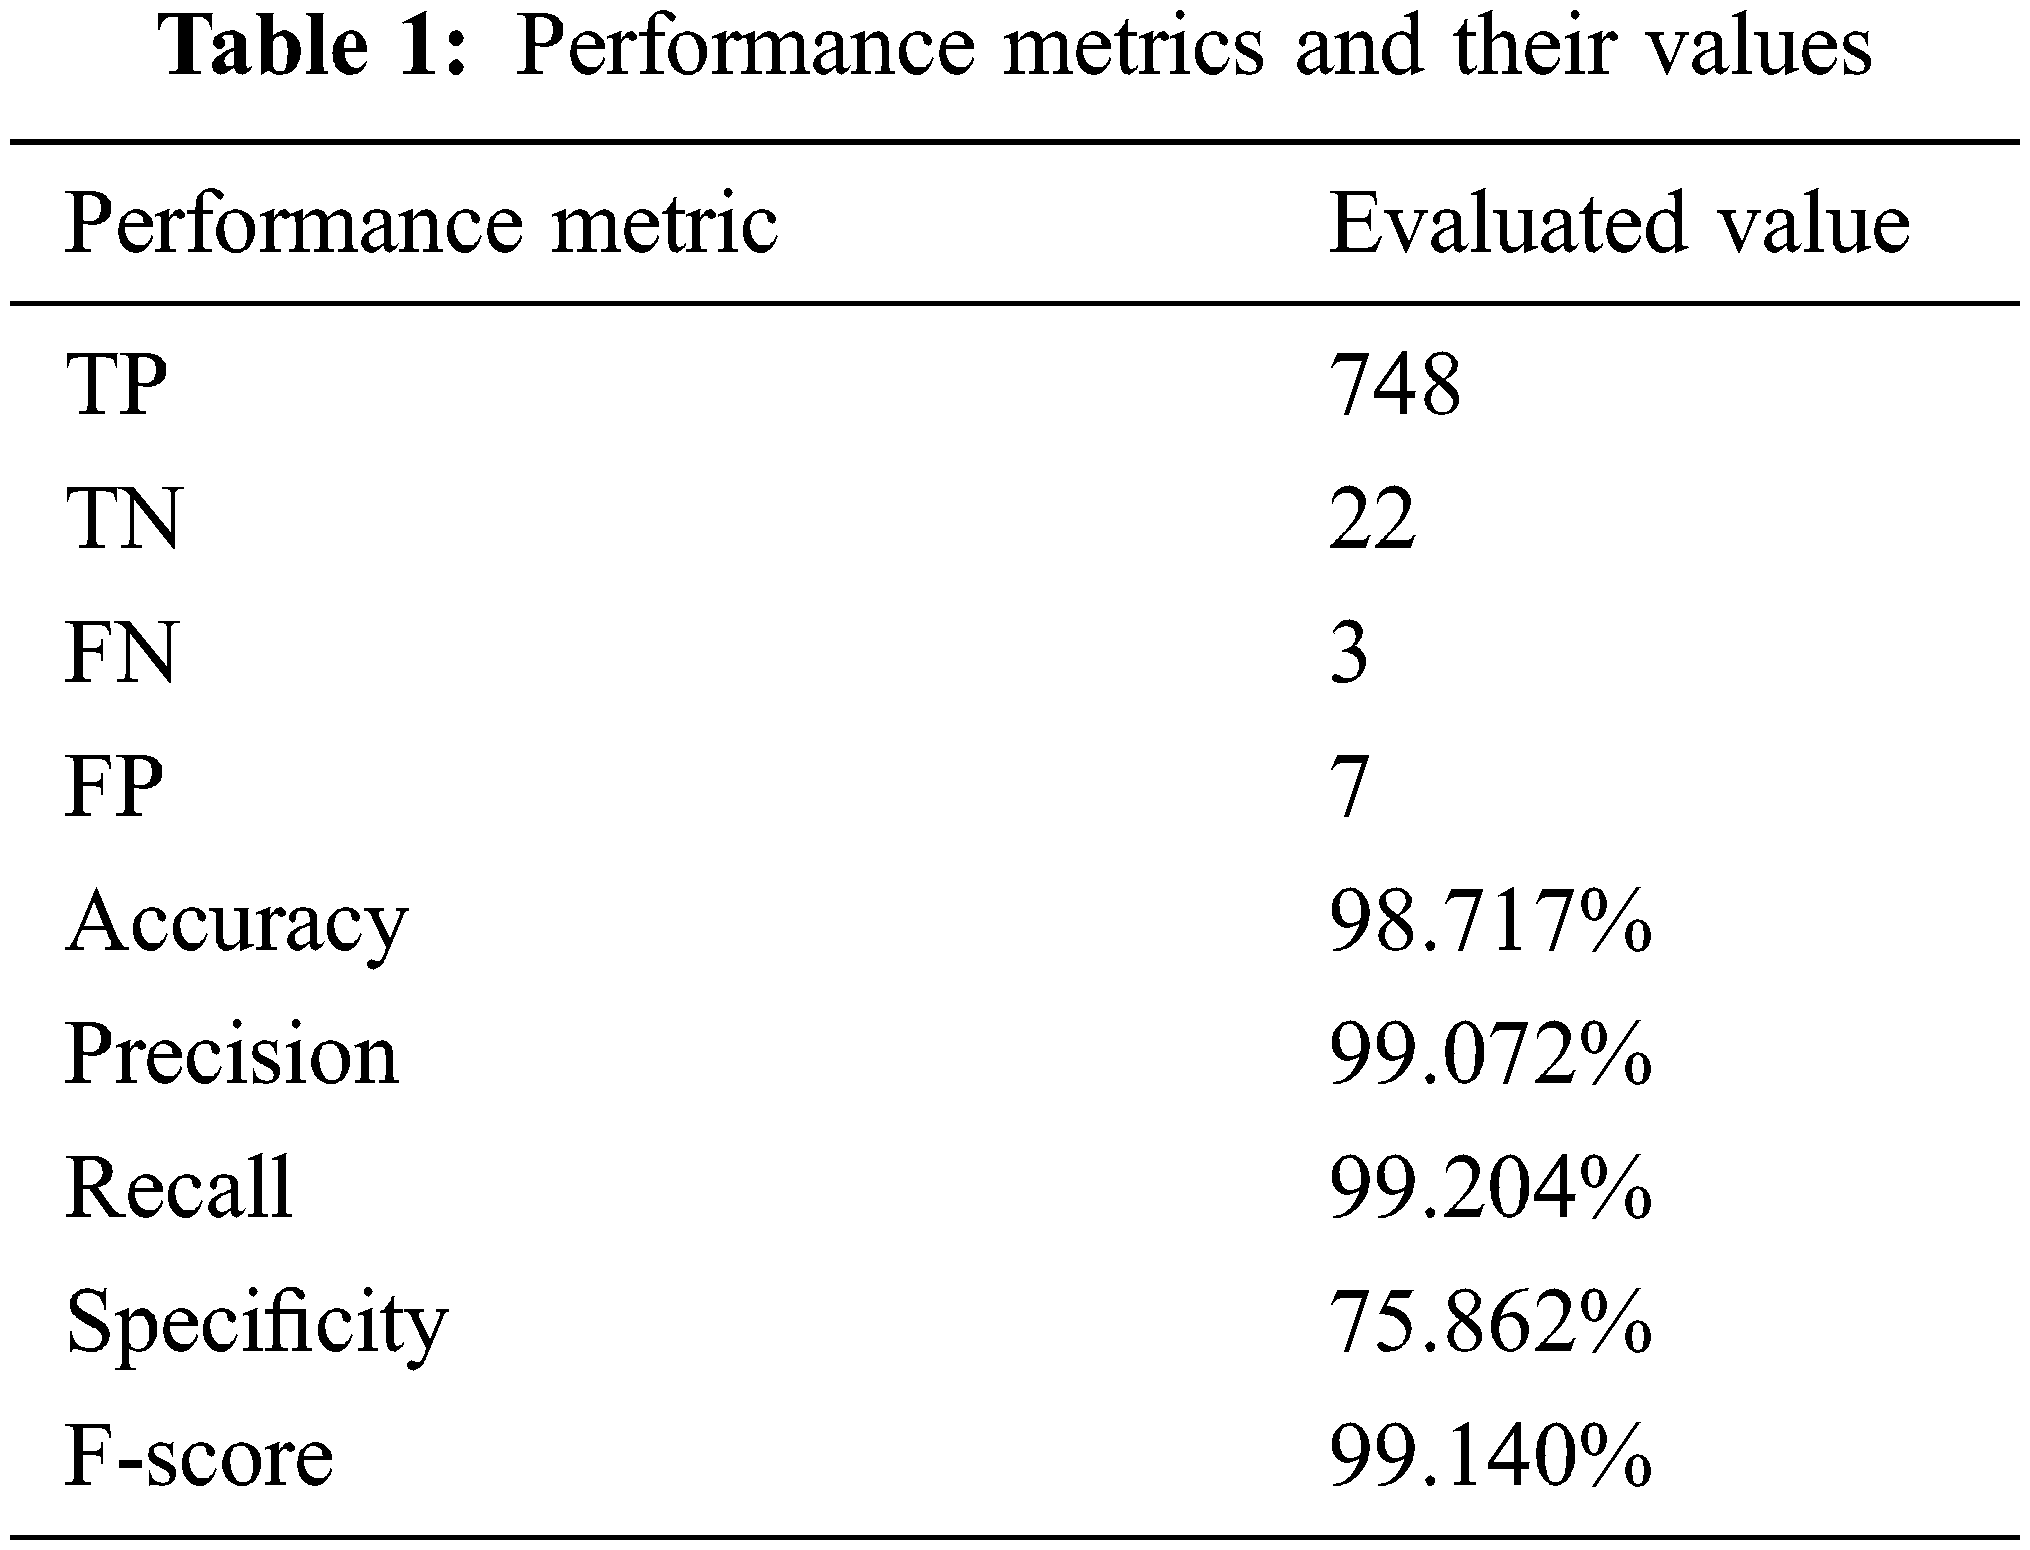
Table 2 illustrates the confusion matrix of the proposed system. The correctly identified classes are marked in green, while the incorrectly identified classes are marked in red. In addition, all subtypes of NSCLC are identified by the light blue color, while the light orange color distinguishes all subtypes of SCLC. The confusion matrix was used to test the performance of the proposed system and verify its generated outcomes.
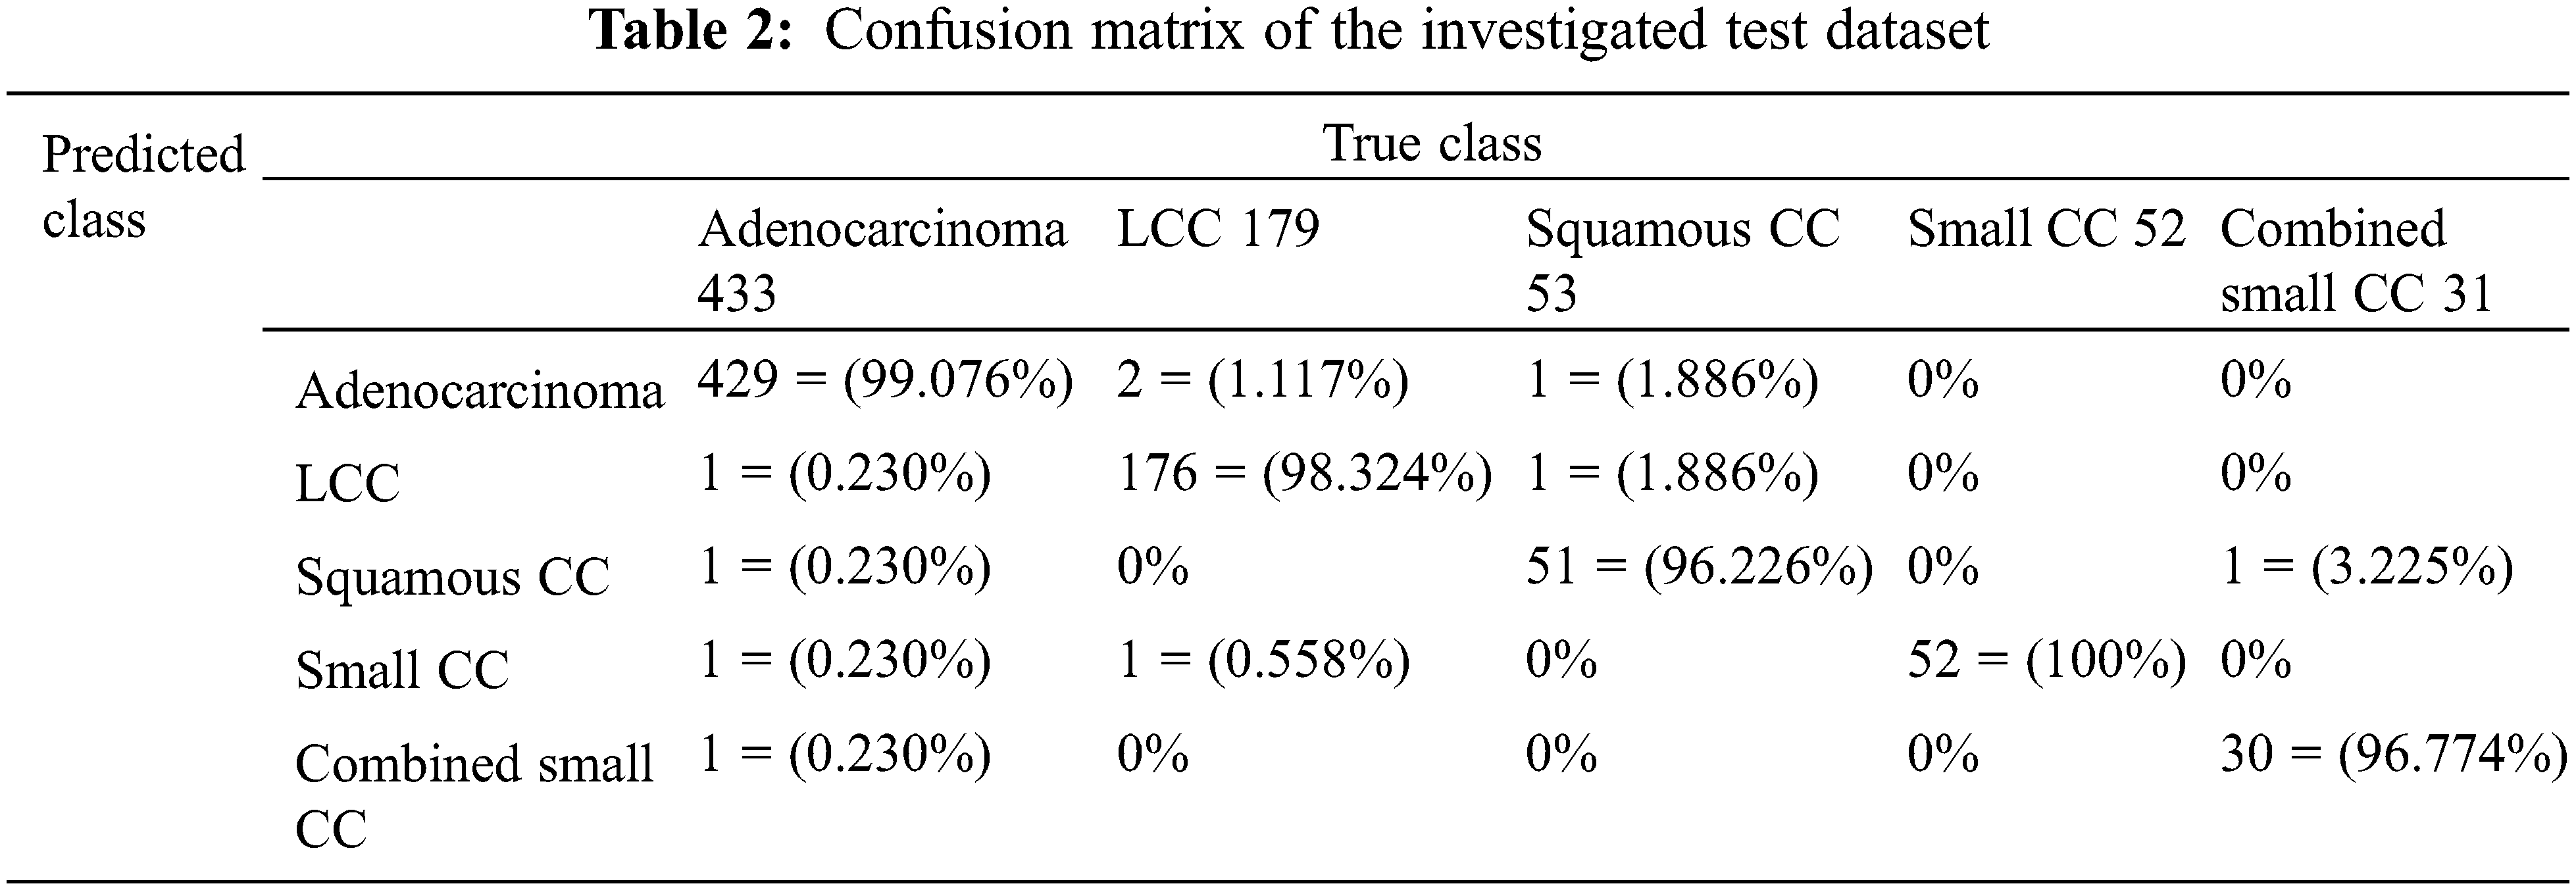
Table 3 lists the assessment results for the accuracy, precision, recall, specificity, and F-score between the proposed system and some of the aforementioned literature works in Section 2.
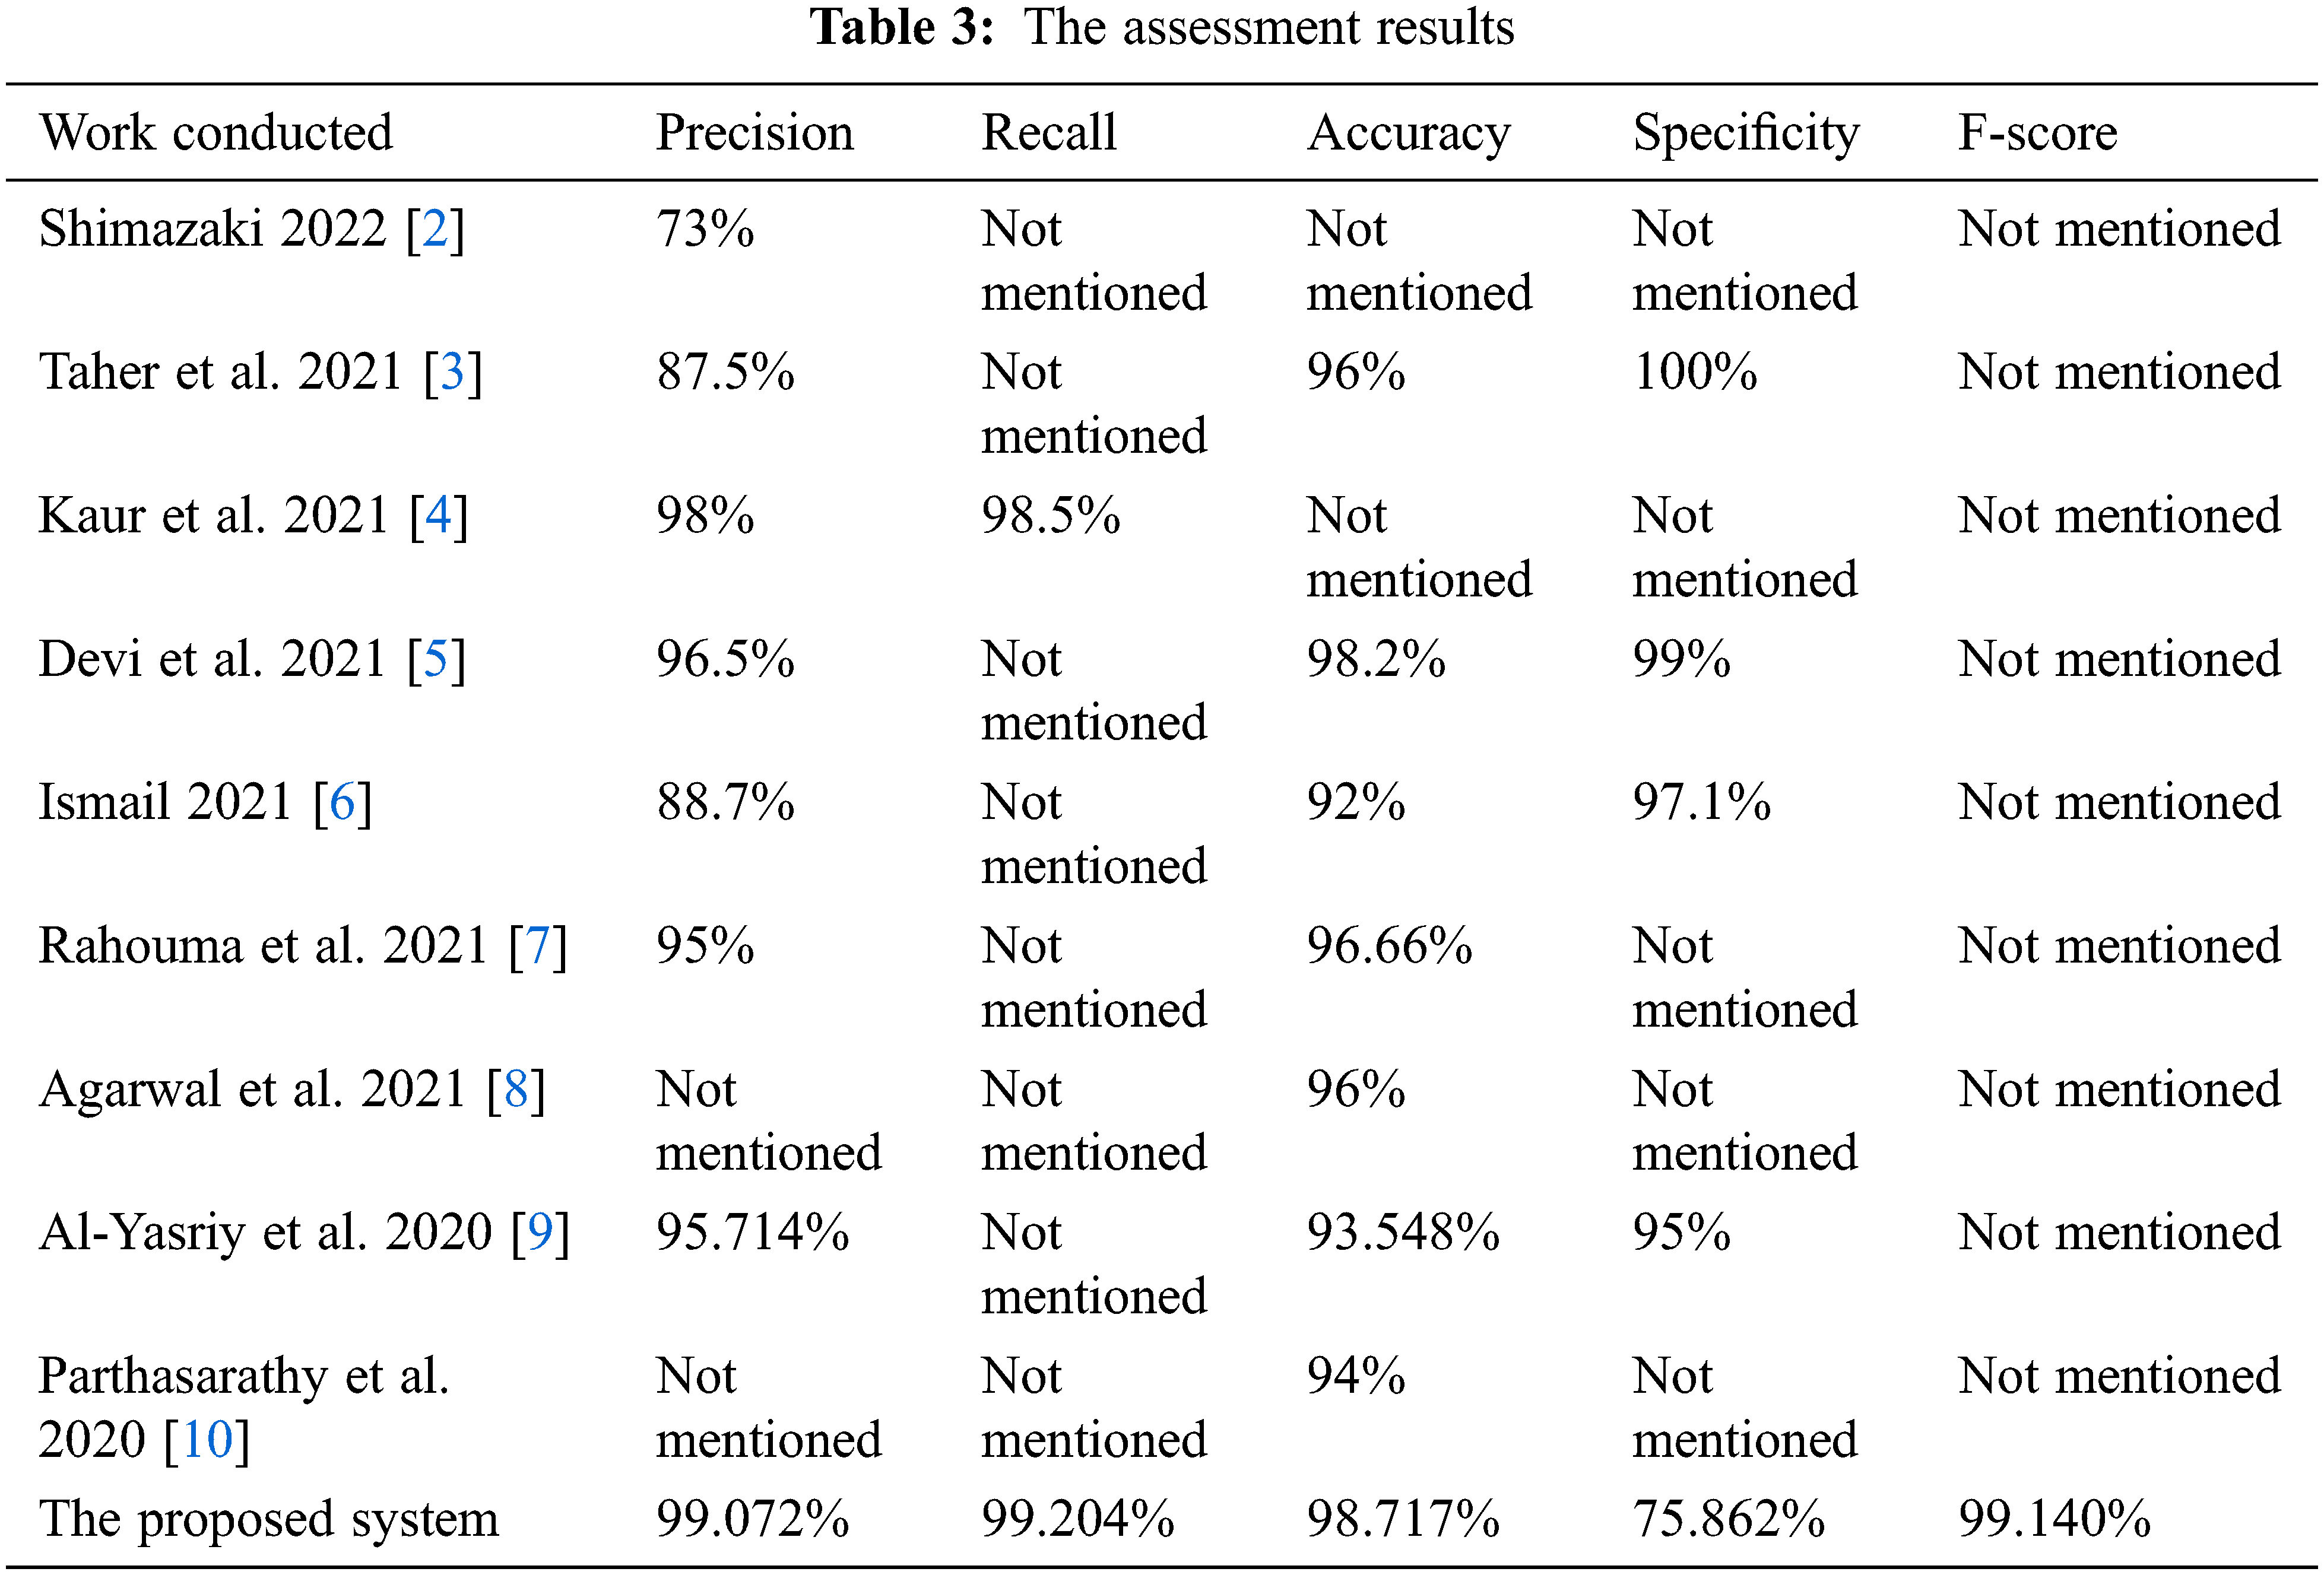
Table 3 reveals that the proposed CAD system in this article outperforms the developed and implemented methods in the literature, which implies that the proposed system in this research produces promising outcomes.
Fig. 13 illustrates a sample of the obtained charts of accuracy and loss values when applying the proposed system for 13 epochs and 754 iterations, where every epoch contains 58 iterations. The accuracy tends to reach 99%, as illustrated in Fig. 13. The horizontal axis refers to the number of iterations and epochs. In contrast, the vertical axis represents the percentage of the obtained accuracy. As the number of iterations increases, the loss value becomes almost 0. Fig. 14 depicts the obtained error chart of the histogram for the training, validation, and testing datasets when running the presented system for 13 epochs when evaluating 45 instances of the utilized datasets.
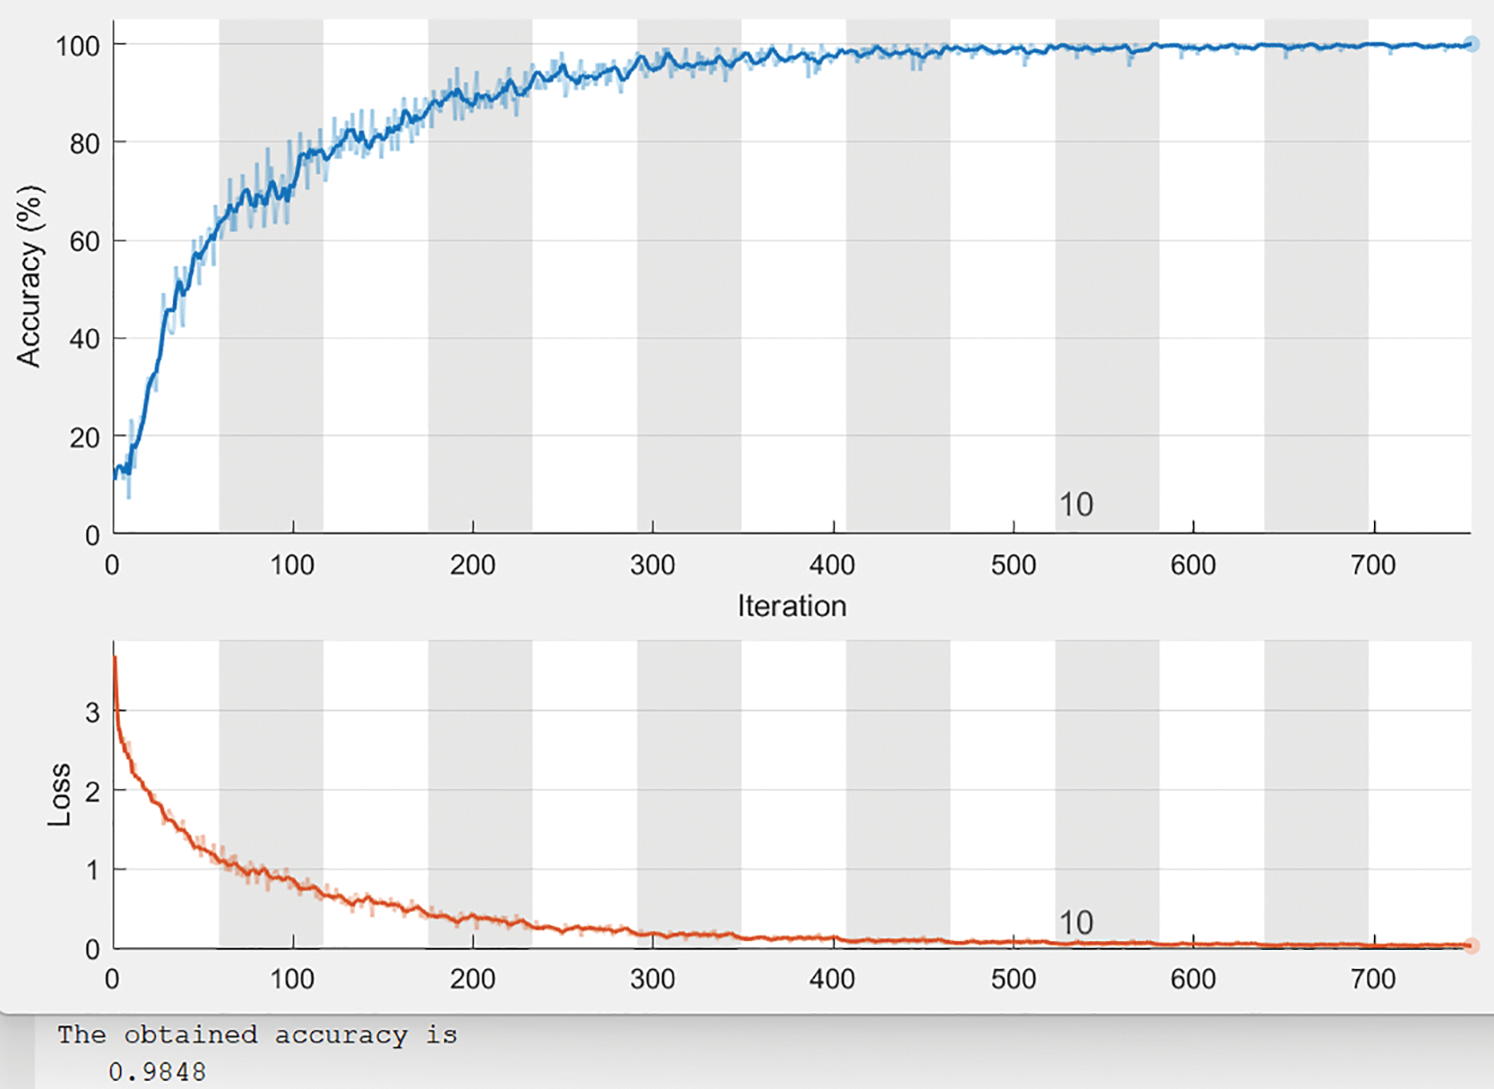
Figure 13: Charts of accuracy and loss values of 13 epochs
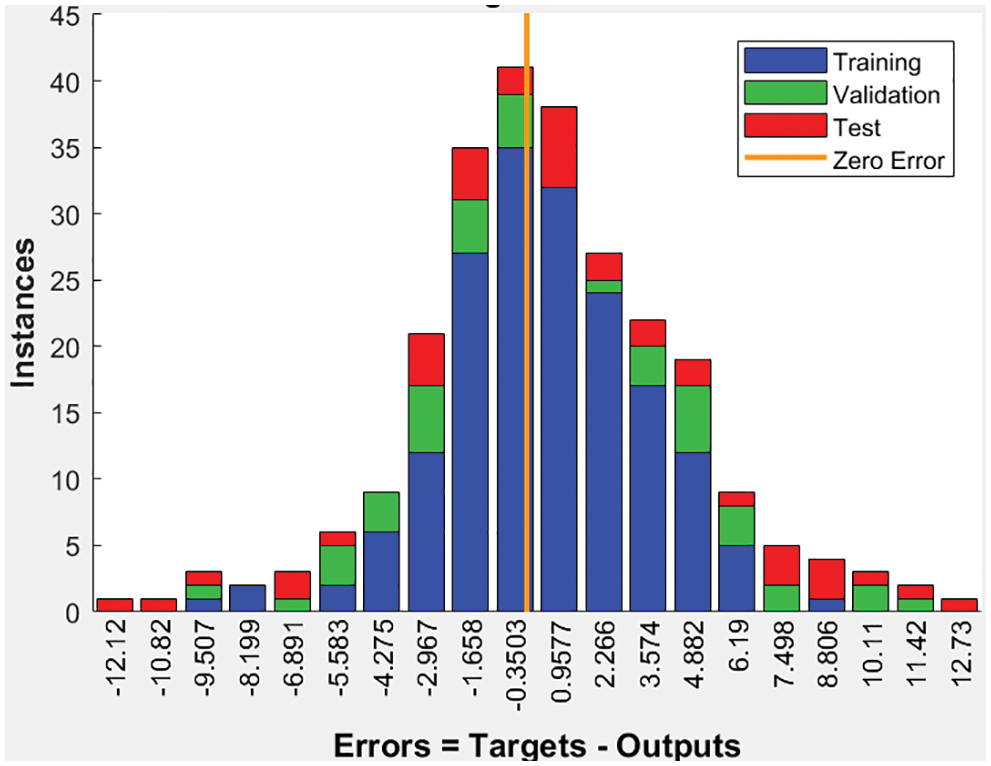
Figure 14: The error chart of histogram values
As mentioned in the previous two sections, AlexNet and RFA integrated to produce promising results, as listed in Tables 1 and 3.
The utilized image segmentation method plays a significant role, and the loss function, as illustrated in Fig. 13, is essential to balance the obtained class since it implies that there is no loss as it goes to zero as the number of iterations increases. The performance is divided into two categories which are a quantitative and qualitative measure of accuracy, recall, precision, specificity, and F-score. The quantitative is represented in Figs. 13 and 14. The implemented system was tested on more than 5000 images and yielded more than 98% accuracy, and F-score was 99.1%. The obtained confusion matrix in Table 2 shows that the presented CAD system effectually identified and classified 748 images into their classes. 429 images out of 433 were correctly classified with 99.076% accuracy for the Adenocarcinoma type, while 176 out of 179 of LCC were classified correctly with 98.324% accuracy. These results prove that this system generates acceptable results and can be utilized by healthcare providers efficiently. Figs. 7–12 illustrate the system’s generated outputs under eight distinct runs. The accuracy increases as the number of distinct runs increases, as illustrated in Fig. 13. The proposed CAD system integrates the AlexNet tool with the Random Forest algorithm (RF) to perform deep learning and classification operations. Multiple stages exist in this system, and the integration is employed appropriately to avoid confusion between components. It detects and classifies both types of lung cancer and their subtypes precisely, as shown in the previous graphs. The execution time of the developed CAD system was nearly 154 s when it ran for 754 iterations. In addition, this system reaches over 98% accuracy, while other methods reach less than that. Fig. 6 depicts how the system works and flows every output from the beginning to the end.
From the efficacy point of view, the performed analysis on the obtained results of the presented CAD system shows that it can detect and classify any lung cancer correctly. Table 1 lists all system values when applied to the test dataset. At the same time, Table 2 reveals how many images were detected and classified correctly and how many images were classified incorrectly. In a comparative assessment between the implemented CAD system and other works from the literature shown in Table 3, the proposed CAD system outperforms others in all performance metrics except specificity. Fig. 13 shows that the proposed system achieves nearly 98.5% accuracy, which increases when the number of iterations and epochs increases. The maximum obtained accuracy value was 99.03%. No other method could reach this accuracy level.
The implemented and presented CAD system exhibits its utility, efficiency, and accuracy in detecting and classifying both primary lung cancer types and their subtypes. Effectiveness and validation experiments through MATLAB show efficient and good performance, producing accepted results. The developed CAD system achieves high accuracy, and it outstands other related works, as illustrated in Table 3. The proposed system was tested and applied on around 750 CT images and showed that it generated promising results. Moreover, the presented system can be applied to any dataset that contains CT scan images.
Future work is planned to enhance the presented system, producing accurate results from classification operations with a minimal execution time and correct classification of all subtypes.
Acknowledgement: This research work was funded by Institutional Fund Projects under Grant No. (IFPIP: 646-829-1443). The authors gratefully acknowledge technical and financial support from the Ministry of Education and King Abdulaziz University, DSR, Jeddah, Saudi Arabia.
Funding Statement: The authors would like to confirm that this research work was funded by Institutional Fund Projects under Grant No. (IFPIP: 646-829-1443). The authors gratefully acknowledge technical and financial support from the Ministry of Education and King Abdulaziz University, DSR, Jeddah, Saudi Arabia.
Conflicts of Interest: The authors declare that they have no conflicts of interest to report regarding the present study.
References
1. T. Kadir and F. Gleeson, “Lung cancer prediction using machine learning and advanced imaging techniques,” Translational Lung Cancer Research, vol. 7, no. 3, pp. 304–312, 2018. [Google Scholar]
2. A. Shimazaki, D. Ueda, A. Choppin, A. Yamamoto, T. Honjo et al., “Deep learning-based algorithm for lung cancer detection on chest radiographs using the segmentation method,” Scientific Reports, vol. 12, no. 727, pp. 1–10, 2022. [Google Scholar]
3. F. Taher, N. Prakash, A. Shaffie, A. Soliman and A. El-Baz, “An overview of lung cancer classification algorithms and their performances,” International Journal of Computer Science, vol. 48, no. 4, pp. 1021–1027, 2021. [Google Scholar]
4. L. Kaur, K. Sharma, G. N. Verma and K. Kumar, “Lung cancer detection extraction and classification using digital image processing and machine learning,” International Research Journal of Engineering and Technology, vol. 8, no. 6, pp. 317–322, 2021. [Google Scholar]
5. T. A. M. Devi and V. I. M. Jose, “Three stream network model for lung cancer classification in the CT images,” Open Computer Science, vol. 11, pp. 251–261, 2021. [Google Scholar]
6. M. B. S. Ismail, “Lung cancer detection and classification using machine learning algorithm,” Turkish Journal of Computer and Mathematics Education, vol. 12, no. 13, pp. 7048–7054, 2021. [Google Scholar]
7. K. H. Rahouma, S. M. Mabrouk and M. Aouf, “Lung cancer diagnosis based on chan-vese active contour and polynomial neural network,” in Proc. of 18th Int. Learning and Technology Conf., Jeddah, Mecca, KSA, pp. 22–31, 2021. [Google Scholar]
8. A. Agarwal, K. Patni and D. Rajeswari, “Lung cancer detection and classification based on AlexNet CNN,” in Proc. of the 6th Int. Conf. on Communication and Electronics Systems, Tamil Nadu, India, pp. 1390–1397, 2021. [Google Scholar]
9. H. F. Al-Yasriy, M. S. Al-Husieny, F. Y. Mohsen, E. A. Khalil and Z. S. Hassan, “Diagnosis of lung cancer based on CT scans using CNN,” in Proc. of 2nd Int. Scientific Conf. of Al-Ayen University, Thi-Qar, Iraq, vol. 928, pp. 1–10, 2020. [Google Scholar]
10. J. H. Heinzerling, “What are the stages of lung cancer?” 2022. [Online]. Available: https://treatcancer.com/blog/stages-of-lung-cancer/. [Google Scholar]
11. G. Parthasarathy, S. Abirami, A. S. Monica, C. Nishali and V. Pavithrasrisai, “Prediction of lung cancer using deep learning algorithm,” International Journal of Creative Research Thoughts, vol. 8, no. 4, pp. 2003–2008, 2020. [Google Scholar]
12. A. Masood, B. Sheng, P. Yang, P. Li and D. Dagan, “Automated decision support system for lung cancer detection and classification via enhanced RFCN with multilayer fusion RPN,” IEEE Transaction on Industrial Informatics, vol. 16, no. 12, pp. 1–11, 2020. [Google Scholar]
13. R. Hasan and M. Al Kabir, “Lung cancer detection and classification based on image processing and statistical learning,” arXiv:1911.10654v1, pp. 1–6, 2019. [Google Scholar]
14. S. R. A. Ahmed, I. Al_Barazanchi, A. Mhana and H. R. Abdulshaheed, “Lung cancer classification using data mining and supervised learning algorithms on multi-dimensional data set,” Periodicals of Engineering and Natural Sciences, vol. 7, no. 2, pp. 438–447, 2019. [Google Scholar]
15. N. S. Reddy and V. Khanaa, “Detection and prediction of lung cancer using different algorithms,” International Journal of Engineering and Advanced Technology, vol. 8, no. 6S3, pp. 2088–2093, 2019. [Google Scholar]
16. C. Zhang, X. Sun, K. Dang, K. Li, X. Gou et al., “Toward an expert level of lung cancer detection and classification using a deep CNN,” The Oncologist, vol. 24, pp. 1159–1165, 2019. [Google Scholar]
17. S. Bhatia, Y. Sinha and L. Goel, “Lung cancer detection: A deep learning approach,” in Soft Computing for Problem Solving, Advances in Intelligent Systems and Computing, vol. 817. Singapore: Springer, pp. 699–705, 2019. [Google Scholar]
18. M. Asthana, “Analytics vidhya,” 2022. [Online]. Available: https://medium.com/analytics-vidhya/layers-of-a-convolutional-neural-network-168daddd2dd1. [Google Scholar]
19. “Random forest algorithm for machine learning,” 2019. [Online]. Available: https://www.tutorialandexample.com/random-forest-algorithm. [Google Scholar]
Cite This Article
 Copyright © 2023 The Author(s). Published by Tech Science Press.
This work is licensed under a Creative Commons Attribution 4.0 International License , which permits unrestricted use, distribution, and reproduction in any medium, provided the original work is properly cited.
 Downloads
 Citation Tools