
 Submit a Paper
 Propose a Special lssue
 Open Access
ARTICLE

An Intelligent Adaptive Dynamic Algorithm for a Smart Traffic System
1 Electrical Engineering Department, College of Engineering, Northern Border University, Arar, Saudi Arabia
2 Electrical Engineering Department, Faculty of Engineering at Rabigh, King Abdulaziz University, Jeddah, Saudi Arabia
* Corresponding Author: Ahmed Alsheikhy. Email:
Computer Systems Science and Engineering 2023, 46(1), 1109-1126. https://doi.org/10.32604/csse.2023.035135
Received 09 August 2022; Accepted 11 November 2022; Issue published 20 January 2023
 View Full Text
 Download PDF
Abstract
Due to excessive car usage, pollution and traffic have increased. In urban cities in Saudi Arabia, such as Riyadh and Jeddah, drivers and air quality suffer from traffic congestion. Although the government has implemented numerous solutions to resolve this issue or reduce its effect on the environment and residents, it still exists and is getting worse. This paper proposes an intelligent, adaptive, practical, and feasible deep learning method for intelligent traffic control. It uses an Internet of Things (IoT) sensor, a camera, and a Convolutional Neural Network (CNN) tool to control traffic in real time. An image segmentation algorithm analyzes inputs from the cameras installed in designated areas. This study considered whether CNNs and IoT technologies could ensure smooth traffic flow in high-speed, high-congestion situations. The presented algorithm calculates traffic density and cars’ speeds to determine which lane gets high priority first. A real case study has been conducted on MATLAB to verify and validate the results of this approach. This algorithm estimates the reduced average waiting time during the red light and the suggested time for the green and red lights. An assessment between some literature works and the presented algorithm is also provided. In contrast to traditional traffic management methods, this intelligent and adaptive algorithm reduces traffic congestion, automobile waiting times, and accidents.Keywords
When the number of vehicles on the road outnumbers the capacity of that road, there is traffic congestion [1]. In big cities in Saudi Arabia, such as Riyadh and Jeddah, traffic congestion accelerates the number of accidents, increases the number of injured people, and affects the economy’s growth. Traffic congestion is a severe and dangerous hazard to urban life [1,2]. In 2019, the world’s population was 7.7 billion [3]. The United States of America lost nearly 6 billion hours from 2000 to 2010 due to traffic congestion [3]. According to the current growth of the population, traffic jams will continue to be one of the most serious difficulties governments face. These jams result in high consumption of fuels which leads to air pollution [3–6]. Having a feasible, reliable transportation system infrastructure would also reduce traffic congestion and enhance public safety for drivers and pedestrians. In most countries, the time allocated for every traffic signal is equivalent for all roads [1,3]. This leads to traffic congestion and wastes resources, which forces the government to seek alternative solutions. Solutions can be very costly. The government of Saudi Arabia has tried several solutions in urban cities to reduce traffic jams. The government has spent more than 300 million dollars building bridges and digging tunnels. Even with this spending, traffic lights need features to detect when roads or streets are vacant.
In circumstances where the traffic jams are enormous, police officers are called in to perform manual traffic management in place of automated traffic lights. However, this procedure could be more inefficient since congestion increases in many situations due to these officers’ need for knowledge about road capacity. Still, assigning equal time for all signals in all situations keeps the issue unresolved. Hence, a new method is needed, and it can be made possible by implementing an intelligent traffic solution.
There are other options. Intelligent Traffic Systems (ITS) integrate different technologies to monitor, control, and automatically navigate traffic to avoid or reduce traffic congestion. These technologies can include wireless sensors, cams, clouds, IoTs, and internet services, all of which are used to help authorities to cope with different situations that may occur on roads. Internet of Things (IoT) technologies, for example, link physical components to the internet to create innovative, reliable network connectivity [1–3]. Data is collected by sensors and transported to dedicated centers for analysis. These sensors have been deployed in numerous fields to provide better services, including traffic management [7–9]. In a smart city, the strength of the transportation systems is a measure of success [1,2]. This is what cities in Saudi can aim to achieve. Intelligent traffic systems enhance traffic movement by detecting congestion, synchronizing timing between traffic signals, and minimizing waiting time as much as possible. Furthermore, an intelligent system can provide real-time data on road conditions to prioritize traffic.
Numerous factors are considered when designing and implementing a solution for traffic management to reduce traffic jams, including speed, volume, density, and headway [10–14]. The speed of a vehicle refers to the distance it travels per time unit. It is measured by km/hour in Saudi Arabia, though in other countries, it is measured in miles/hour. Volume refers to the number of vehicles that pass a certain point at a particular time. Density refers to the number of automobiles on a predefined length of lane or street or the number of vehicles per kilometer or mile. High density indicates traffic congestion, while low density implies that the distance between vehicles is big enough that the traffic flow is normal. Headway represents a temporal distance between automobiles. In this study, density and speed are utilized to measure the impact of the intelligent adaptive algorithm for the innovative traffic system. The proposed system adaptive is that its previously processed results are used as feedback in the training stage. This process continues as long as the system is up and running. This feature allows the system to keep learning and accommodate road changes under any circumstances for the proposed system to change its decisions accordingly.
The proposed algorithm uses a Convolutional Neural Network (CNN), a deep learning algorithm, to handle data. The algorithm takes an input or a sequence of inputs through different levels to produce outputs. Fig. 1 illustrates a typical CNN architecture downloaded from [15]. Convolutional layers, also known as Kernels, are depicted in red in Fig. 1. The layers filter the inputs through preset filters. They learn deeply by stacking filters to generate extra complex models. The pooling layers, depicted in blue in Fig. 1, are utilized for deep learning. These layers work on the inputs to reduce their size so they can be processed quickly without too much memory space. Pooling layers minimize the number of parameters obtained from the inputs, reducing the time needed to train the algorithm [15,16]. The fully connected layers, depicted in light green in Fig. 1, take the learned features from the previous layers and utilize them to classify data.
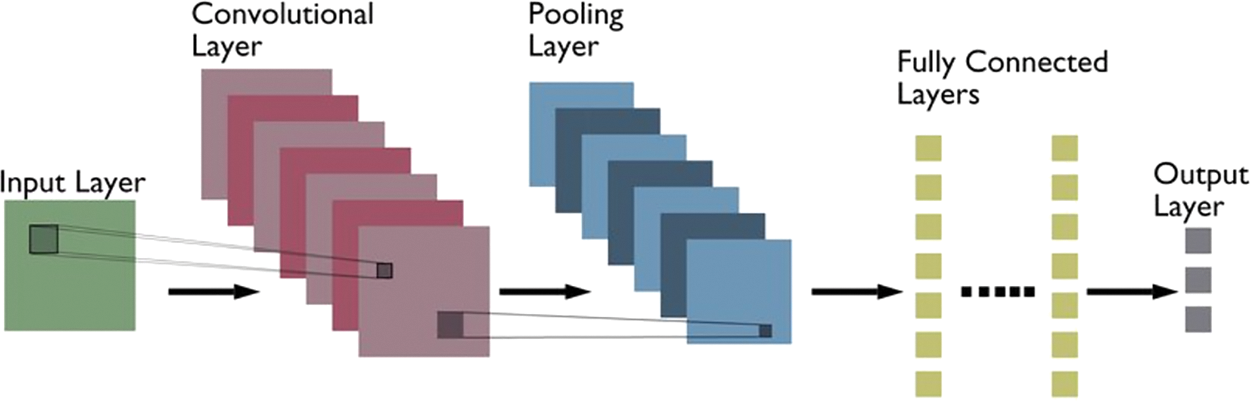
Figure 1: A typical CNN architecture
In this research, an Intelligent Adaptive Method (IAM) uses a deep learning tool. This tool is called AlexNet, a type of CNN, that is employed to apply the deep learning technique in the proposed algorithm. AlexNet is a CNN invented and applied by Alex Krizhevsky in partnership with two authors in 2012 [17]. AlexNet comprises eight layers, as illustrated in Fig. 2 from [17]. These eight layers are generally differentiated into two categories: five convolutional layers, denoted from C1 to C5, and three fully connected layers, denoted from FC6 to FC8.
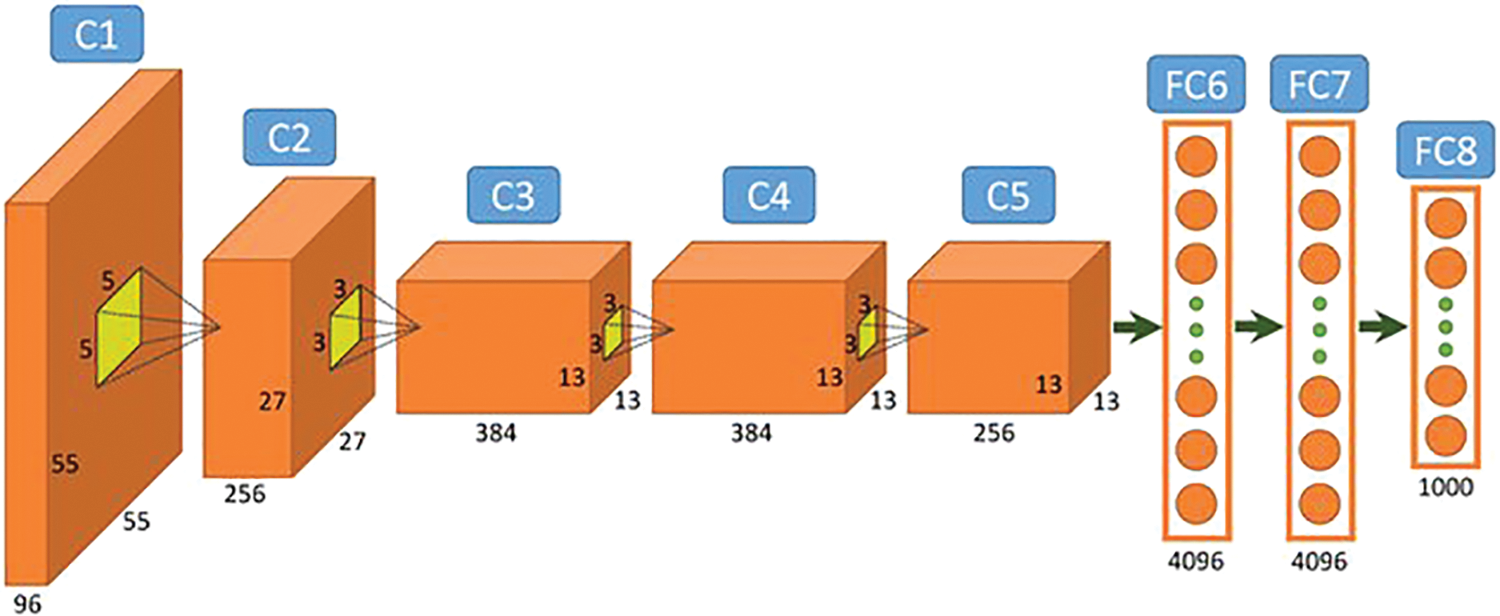
Figure 2: AlexNet architecture
AlexNet employs Rectified Linear Units (ReLU) in its processes to improve performance. It is helpful for this proposed method to lower the execution time as the presented system is assumed to run in real-time [17]. The algorithm presented in this research also uses image segmentation techniques. Numerous examples are illustrated to show how the presented algorithm works. In addition, to present a real scenario, a busy road in Jeddah, Saudi Arabia, is used as a case study.
The motivations of this study stem from Saudi Arabia’s 2030 Vision, a plan announced by the Saudi government to improve the economy, security, and quality of life inside the country. The government has launched an agency in Jeddah called the Authority of Jeddah Development, which aims to transform the city into an urban city and digitalize all public and government services. One of these services is to implement innovative solutions in many fields. The proposed intelligent and adaptive solution to traffic congestion will hopefully be used to improve the lives of Saudi citizens by mitigating congestion and improving the roads in growing cities.
Is it possible that the best traffic regulation happens with the IAM system? This study evaluates the use of the presented IAM system to control intersecting traffic lights. Its success is measured by the smoothness of traffic flow and the reduction in average waiting time. The experiments conducted to verify its effectiveness took place on one of the busiest roads in Jeddah to determine the usability of the algorithm in real-time. The results reveal the IAM system’s functionality, suitability, and value. The IAM system can change and modify itself under any circumstances since it utilizes its previous results as inputs for training purposes. These results are stored in a central DataBase (DB) in the cloud or a central processing station. Later, they feed back into the implemented system to continue the learning process; hence, the intelligent system changes its parameters or adjusts them to produce better decisions. This system is intelligent and dynamically adapts according to the road’s status. The proposed system is adaptive since its previously processed results are used as feedback in the training stage. This process continues as long as the system is up and running. Moreover, the proposed system dynamically changes allocated times for red and green signals to eliminate traffic congestion or reduce it as much as possible. The main contributions of this research are as follows:
• Minimizing traffic congestion.
• Minimizing the average waiting time.
• Allocating an efficient time for green lights.
• Reducing fuel consumption and providing a smooth travel experience.
The rest of the paper is organized as follows: a literature review is presented in the next section, and Section 3 provides details about the developing approach. Discussion and results are provided in Section 4, and the conclusion is presented in Section 5.
This study is one of many to attempt an adaptive and intelligent system for traffic management. In this section, numerous sources in the existing literature which used similar techniques have been cited.
Lilhore et al. [1] implemented an adaptive traffic management approach using machine learning and IoT to control traffic based on the number of vehicles, available infrastructure, and events that occur on roads. The authors performed various scenarios to include all potential issues that could occur. This method updated traffic light schedules according to the traffic volume and density on roads. The authors claimed that this model significantly reduced traveling time and congestion. However, the authors showed no information about the average waiting time for red lights and the associated cost. No information was given related to the allocated time for the green lights. The proposed algorithm in this paper also uses density and speed to determine when to reduce or prevent congestion, minimize waiting time, and lower the number of accidents.
One of the most similar methods proposed in this paper is [2]. Naveed et al. [2] presented a computer vision-based traffic management approach to control traffic to reduce congestion. Wireless Sensor Networks (WSNs) were integrated with a visual analytical framework to analyze average message delivery, average latency, average energy consumption, and network performance on roads. In addition, an enhanced phase timing optimization tool was used to optimize traffic data. The authors claimed that their approach was cost-effective, and no large-scale building or network installation was needed or required. Interested readers can refer to [2] for additional information. However, this algorithm focused only on traffic surveillance, where the authors considered average energy consumption, average latency between different vehicles, and the average number of messages being broadcasted to drivers. In addition, no information was provided regarding the average waiting time and the allocated times for the green lights. In a similar effort to create a cost-effective and reliable technology, this algorithm also uses WSNs to provide real-time data about the status and condition of each lane of traffic. In the proposed system, all intersections in the same area require only a camera to provide proper visualization. However, if needed, this algorithm can be adjusted further than [2] to include a feature that broadcasts alert messages to all registered drivers. This feature will be considered for future work.
Nam et al. [6] developed a tool to estimate traffic density. This tool detected vehicles through an image processing technique. The implemented tool utilized recorded videos from identified intersections and T-type junctions in a city in India. The recording videos were taken from an authority, and then the tool was used to categorize traffic conditions as low, medium, or heavy according to the computed traffic density parameter. This tool controlled the traffic light and provided a proportional time for all junctions based on traffic density in every lane. The maximum allocated time to green light was 51 s when the traffic density was over 66.66%. Their developed tool reached nearly 80% accuracy for automobile detection and the classification of traffic status. In contrast, the proposed algorithm, which also uses sensors and density as a feature, reaches over 90% accuracy for vehicle detection and still reduces traffic jams significantly. The authors utilized 1800 images for training their tool to detect vehicles. Readers can refer to [6] for additional information.
Damulo et al. [8] implemented an intelligent traffic signal controller for innovative city applications. It was designed to support numerous innovative city applications such as Emergency Vehicle Signal Preemption (EVSP) and Public Transport Signal Priority (PTSP). This system relied on the RoadSide Unit Controller (RSU) in its core unit to perform its functions. As illustrated in [8], this system consisted of five layers. The algorithm was run on an embedded computer using Raspberry Pi. A real test scenario was conducted in Pingshi Park. Ultimately, this system was very costly since several hardware devices were used. Comparatively, the proposed algorithm in this manuscript is very cost-effective since only wireless sensor networks (WSNs) and cameras are needed. At most, a cloud DB would be added if this method was integrated with other applications. This mainly depends on the needs of the authorities.
Honrao et al. [9] implemented a deep learning approach to calculate traffic density based on Connected and Autonomous Probes (CAPs) data. This method depended on a Long Short-Term Memory (LSTM) neural network. LSTM networks learn the relationship between input and output, according to Edie’s definition. A microscopic simulation platform was used to test and validate this approach in two scenarios: no jams and traffic congestion. The simulation took 70 days for training and 30 days for testing. The congestion criteria was set to 80 km/hour. The congestion criteria could lead to accurate results since traffic movement at 80 km/hr could imply regular traffic. Drivers often maintain this speed on roads.
In [18], Omina developed an intelligent traffic light control system using a fuzzy logic algorithm. It was validated using a simulation platform fed by data obtained over 12 h at three considered intersections in Nairobi, Kenya, in 2011. The considered road was monitored six consecutive days from 6 am to 6 pm, and observations were taken every fifteen minutes. These observations included dates, times, traffic volume, and the point of entry for every lane. The author used a descriptive statistical method to interpret and analyze the collected data. The obtained average waiting time varied between 19 and 21 s. The author claimed that their approach produced higher performance in terms of time spent during congestion. The considered road in this research was monitored for around 20 consecutive days in 2022 in one of the busiest times, including school days, a festival season, and the summer. The proposed IAM system feeds itself with its previous results to keep learning to adapt to any unconsidered situation. Moreover, this system suggests and allocates different values according to road conditions. It was found to be better than the developed algorithm in [18] as it is dynamic and takes different decisions. The algorithm in [18] achieved a 12.5% reduction in the average waiting time, while the IAM system reached a 32.35% minimum reduction, which implies that the IAM system is better than the developed model in [18].
Nowadays, the traffic flow is vast, and it becomes challenging to go from one point to another or even travel through the city due to traffic congestion. It can take more than 2 h to move from source to destination on a trip that generally takes 30–45 min. Hence, the authorities seek reliable solutions to overcome this issue and save the environment.
This research seeks and plans to propose a reliable, intelligent method to remove traffic congestion as much as possible, smooth the traffic flow, and let drivers and motorists have a good travel experience through a crowded city. The goals are summarized as follows:
• Investigate and examine current situations on the roads of Jeddah to determine how to resolve traffic congestion or minimize it as much as possible.
• Present the IAM system to assist and support authorities in providing smooth traffic flow as the current situation is frustrating, and people complain about it.
• Study a busy road and conduct numerous tests to verify the developed IAM algorithm and see how it behaves, reacts, and responds to different circumstances.
The presented algorithm is dynamically adaptive to provide a smooth traffic experience that avoids or reduces traffic congestion. It uses a Convolutional Neural Network (CNN) called AlexNet, which trains the approach based on extracted features related to traffic density, such as speed and distance between vehicles, road data, road length until the intersection, and traffic light data. This data comprises the CNN inputs. The speed of cars and the number of available vehicles in every lane are also included.
WSNs, types of IoT sensors, provide real-time data about vehicles, including speed, volume, and headway. A camera provides real-time visual images of the roads so decision-makers can monitor the status and take proper action when needed. However, the proposed algorithm works independently, controlling traffic lights according to density values. The result is minimized traffic with low labor costs and a better experience for drivers on the road.
Some figures have been drawn to illustrate the algorithm. The proposed algorithm generally consists of 3 layers: the sensing layer, the service layer, and the application layer. These layers are piled from the bottom up, as illustrated in Fig. 3. The sensing layer provides real-time data about the vehicles’ speed, the headway distance between cars, and the number of vehicles in every lane. This is all captured by the IoT sensors, while the cameras send real-time images or video streams of traffic conditions. The camera data is stored in a storage unit and sent to a central cloud database using WiFi or a cellular network service. All data is collected and preprocessed in a designated unit in the service layer. In the application layer, the traffic density, the speed of vehicles, and the headway distance are evaluated to take proper actions if required. All calculations are utilized to control traffic by assigning a time for every lane. The allocated time is proportional to the three calculated factors. In this research, only roads with intersections are considered.
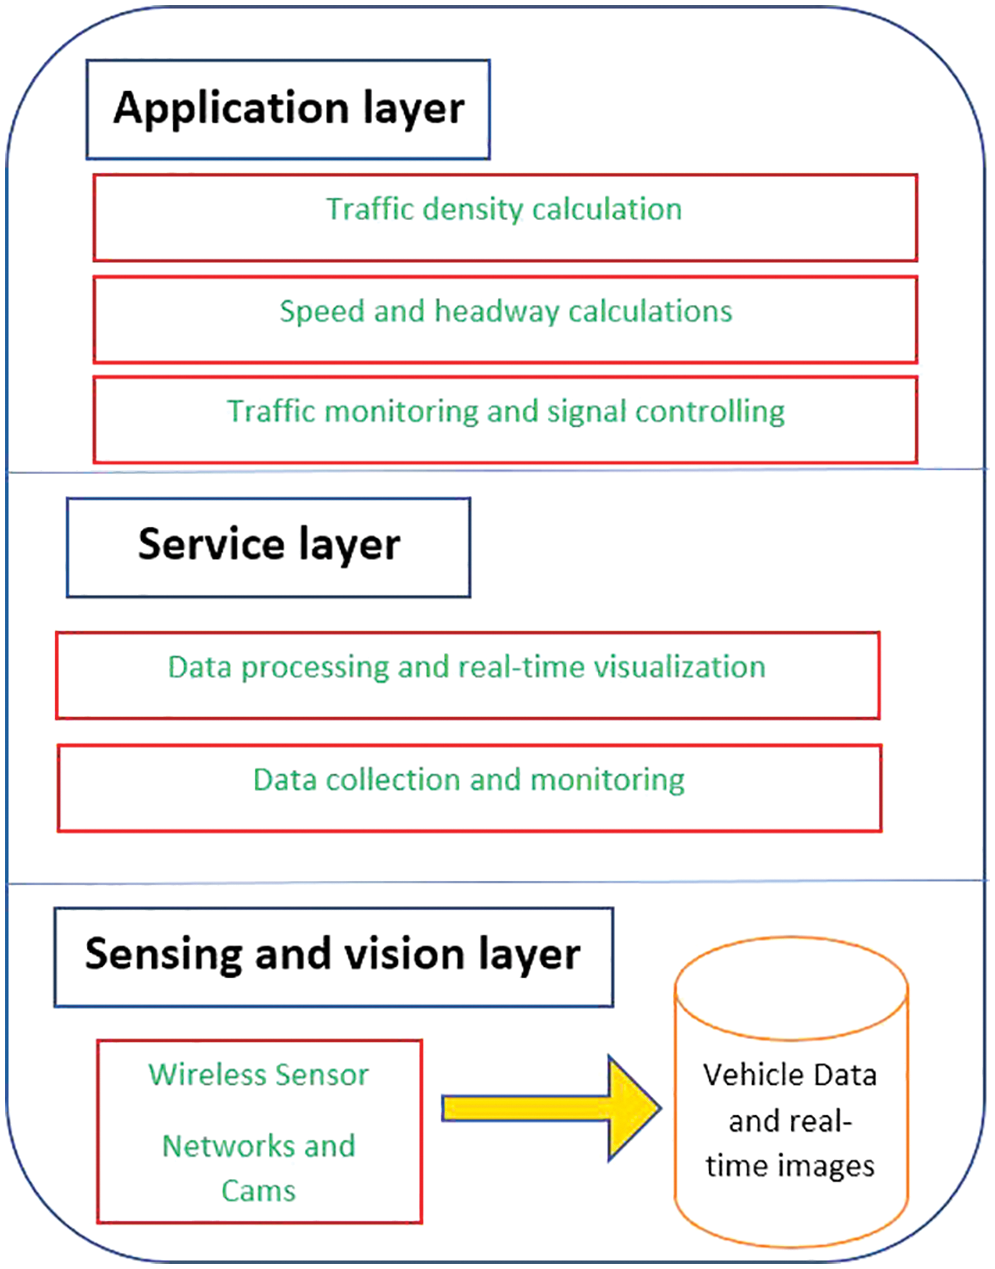
Figure 3: The architecture layers of the proposed algorithm
As depicted in Fig. 4, the presented IAM system starts by acquiring real-time data from the camera and the WSN installed for every lane. The camera provides either images or video streams. If the acquired data are images, those pictures are processed individually. Video streams are processed frame by frame. MATLAB extracts every frame through a built-in function. Once the data is acquired, it is sent into the preprocessing stage to remove noise, enhance the quality of the image, and rescale it to the acceptable input size of AlexNet. These operations are performed by an image segmentation method inside the platform. Numerous filters are deployed, including Gabor filters. The speed of every detected vehicle, the number of total vehicles, and the distance between every two consecutive vehicles are determined in this stage. These quantities are fed into the next phase, deep learning, to learn how to behave and adapt according to the traffic condition. The session, the training stage, lasted nearly six hours. The number of iterations was 3000, and was affecting the execution time performance; thus, the best number of iterations was between 1400 and 1600. So, in this article, the number of iterations is 1500 times. The utilized CNN tool takes the inputs from the cameras and the WSNs along with the road condition data, such as the previously estimated road status and the usual allocated time for every red and green light. These inputs are used to calculate the traffic density for every lane to assign a priority for every lane. This priority determines which lane gets the highest priority and additional time on a green light. Because these inputs are also various, the proposed system can adapt to any road condition. The pseudo-code of the proposed IAM system is also presented here. Traffic density (D) is computed as follows:
where
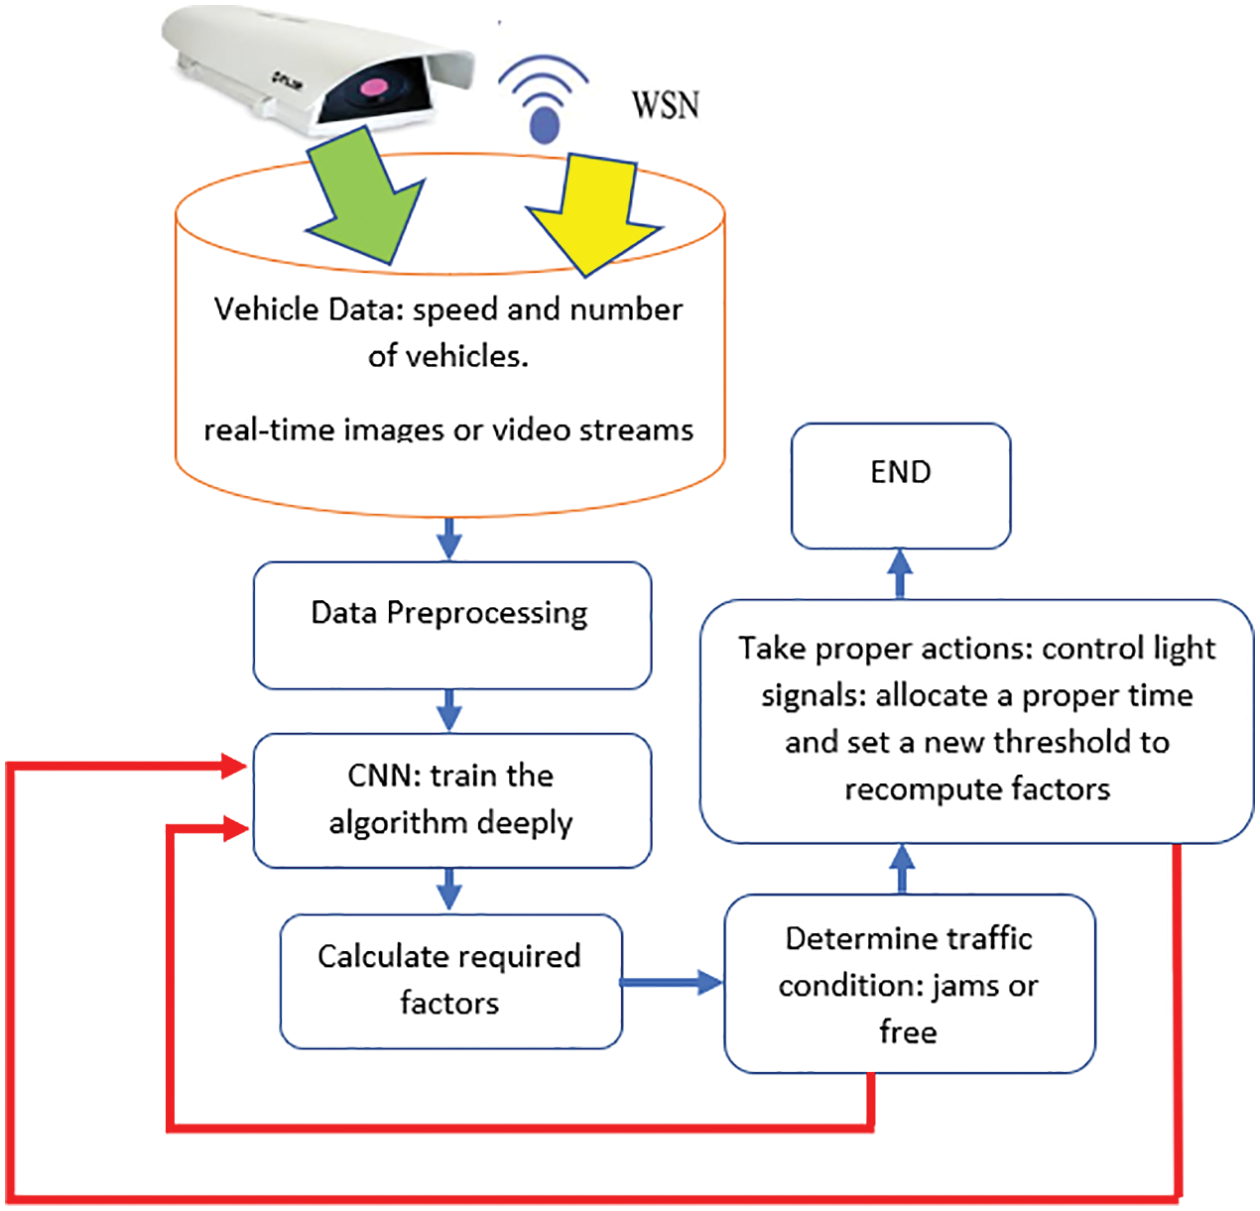
Figure 4: The flowchart of the proposed algorithm
The headway distance between two consecutive vehicles (H) is calculated as follows:
The previous equation is the reciprocal of the calculated value of density in Eq. (1).
Fig. 4 illustrates a flowchart of the proposed and implemented algorithm.
The new threshold value for the number of vehicles (NoVnew) and the new speed of vehicles (Snew) are computed as follows:
Authorities assign dedicated speed limits for roads. In Saudi Arabia, the speed limit is 80 km/hr, so this is the assigned initial value for the speed parameter, Sprevious. Initially, NoVprevious is set to be 15 vehicles for a road with two lanes. The maximum speed Smax.detected is detected by sensors while the number of vehicles occupied for every lane. NoVrecent is determined by the image processing technique utilized by the proposed IAM system. The results of the previous two equations are floored to take integer numbers.
The algorithm computes traffic density on every road and prioritizes the road with the highest density. If one road is processed, the system will wait until the other three roads are processed to change the light. It is unfair for any road to gain priority again while other roads still need to be done. Hence, it is prohibited to process any road more than once, while some roads have yet to be processed. The algorithm dynamically changes the value of the assigned time for every road based on the road conditions and status. It can adapt its parameters based on input, current calculated values, and road conditions.
Traditional light signals assign a fixed time for the green signal; in most cases, it is around 20 s, even on the busiest roads. This value is set to be the initial value of GTprevious. Thus, the newly assigned time for the green signal GTnew is calculated as follows:
where i in the dominator refers to the road number, starting from 1 to 4. For the red signal, the allocated time is nearly 45 s for the initial value of RTprevious; hence, the new time for the red signal RTnew is evaluated as follows:
The pseudo-code of the presented algorithm is demonstrated as follows:
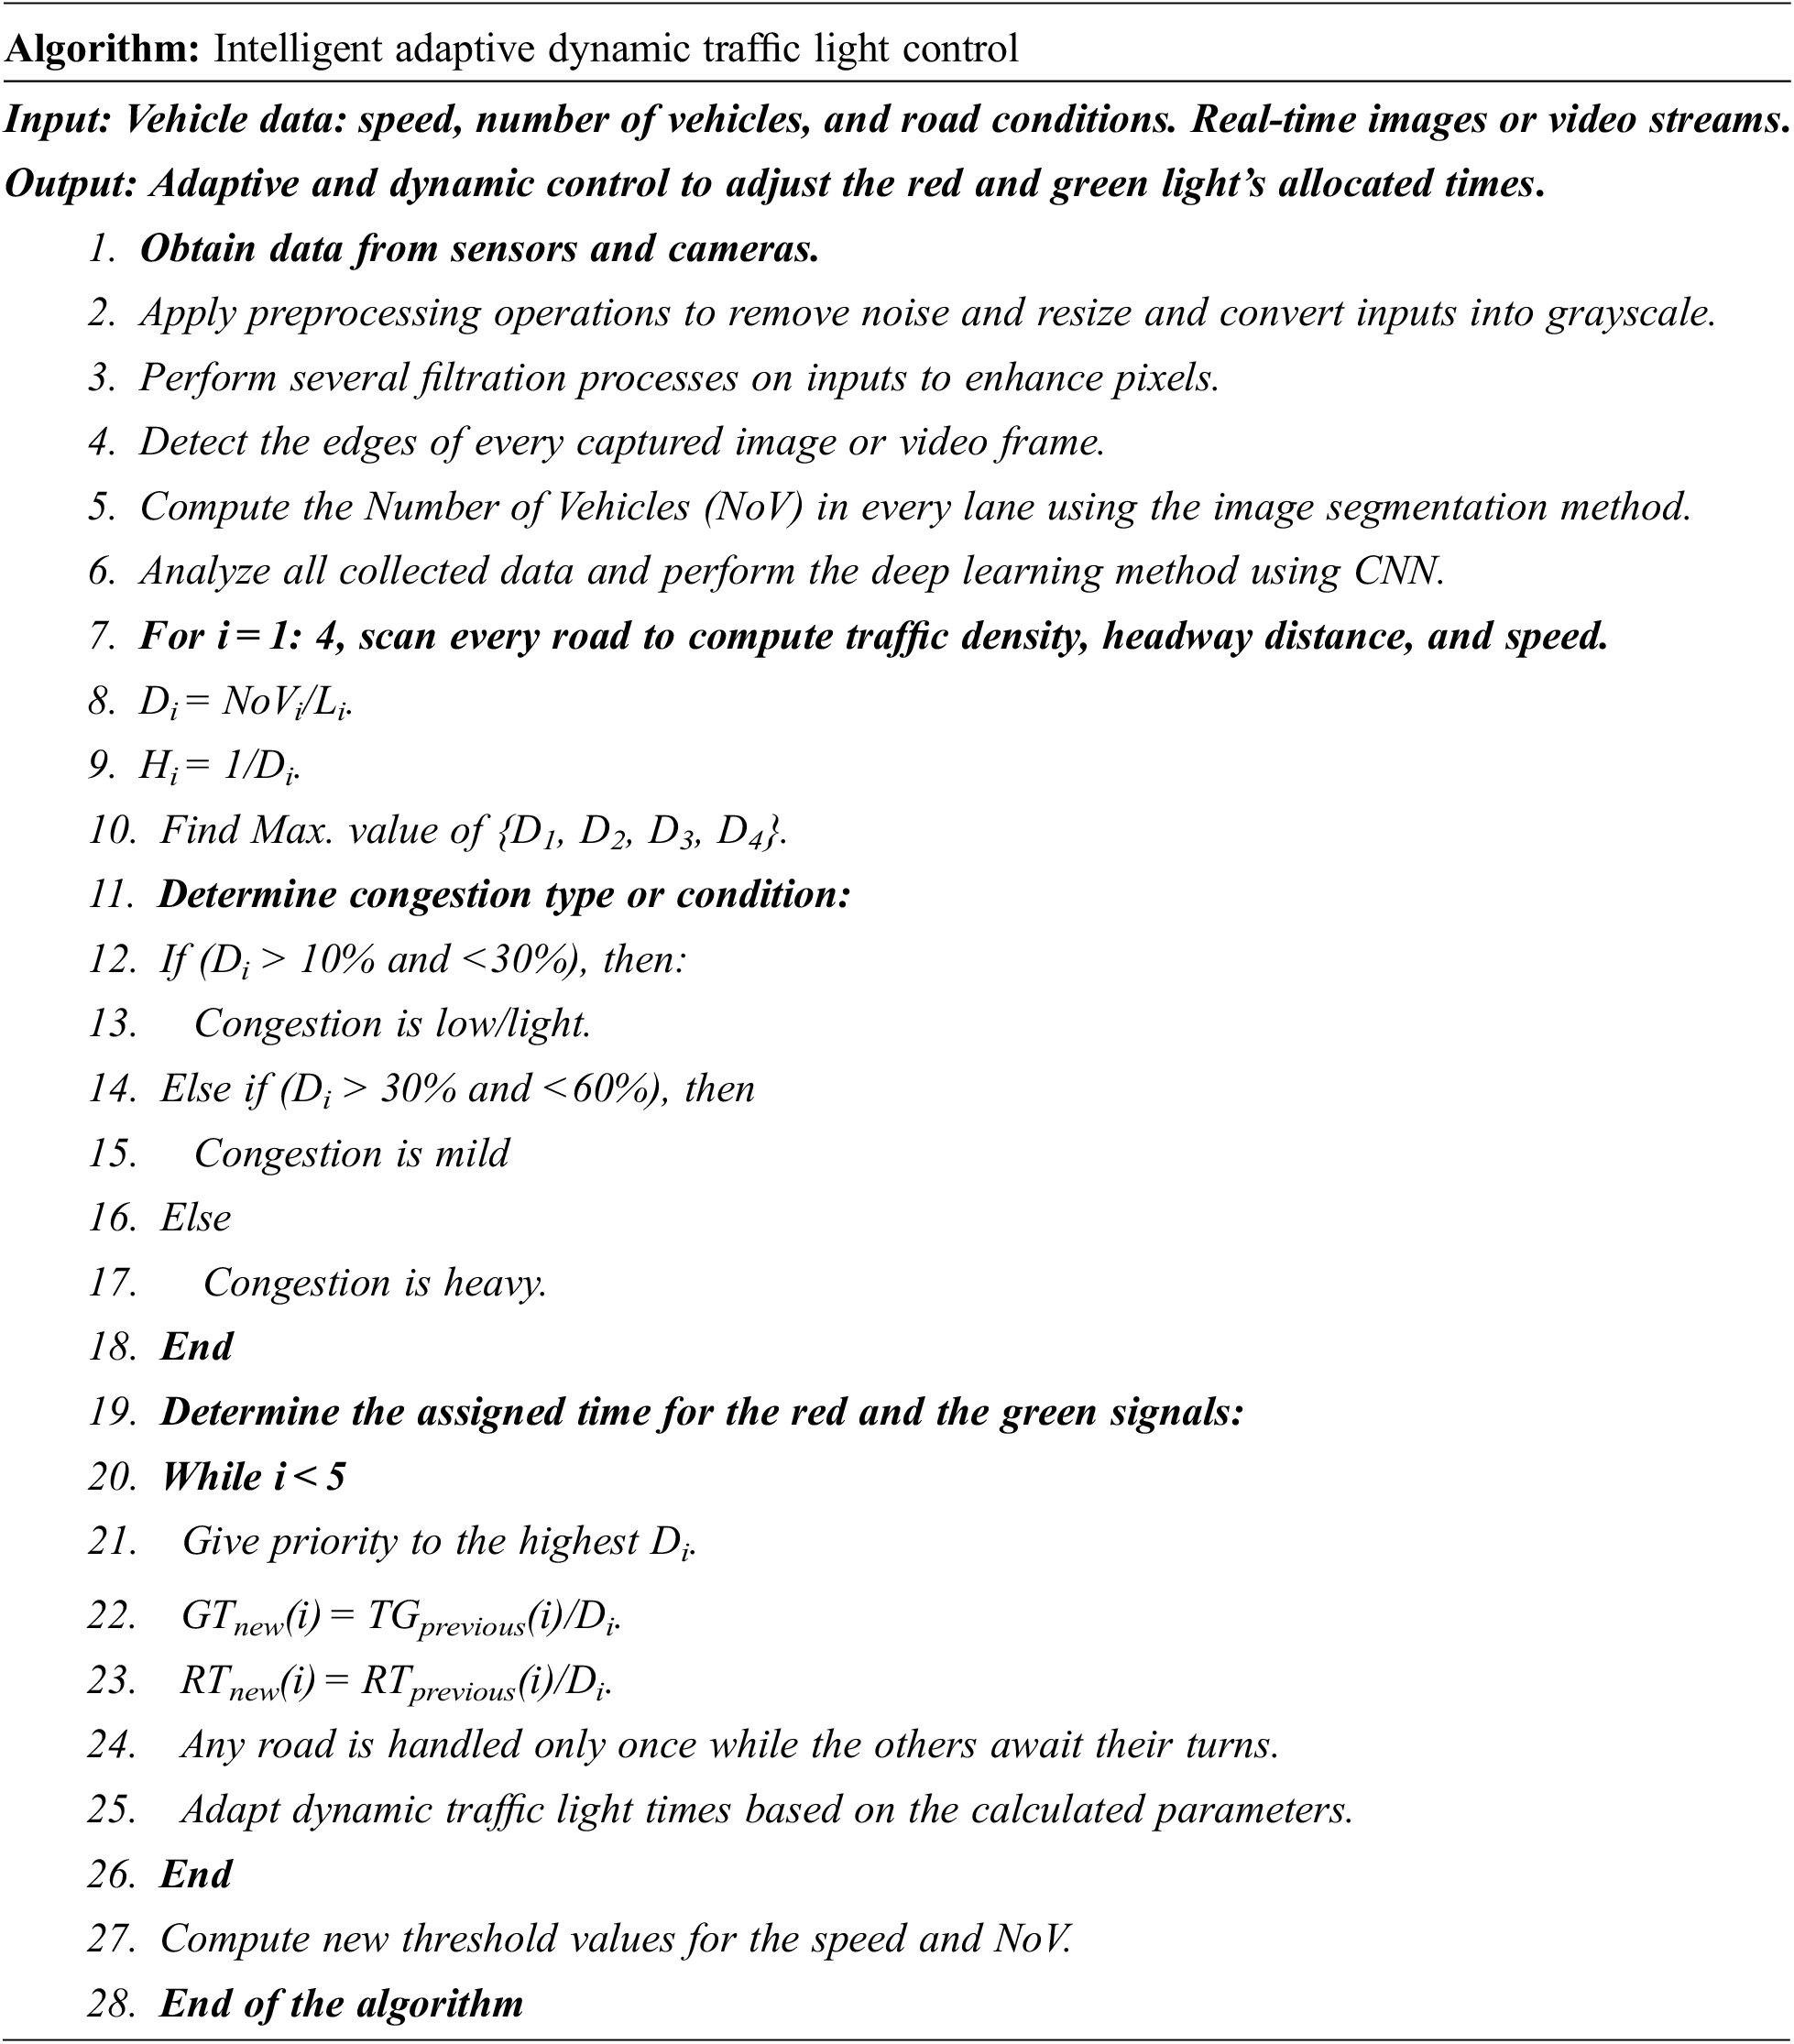
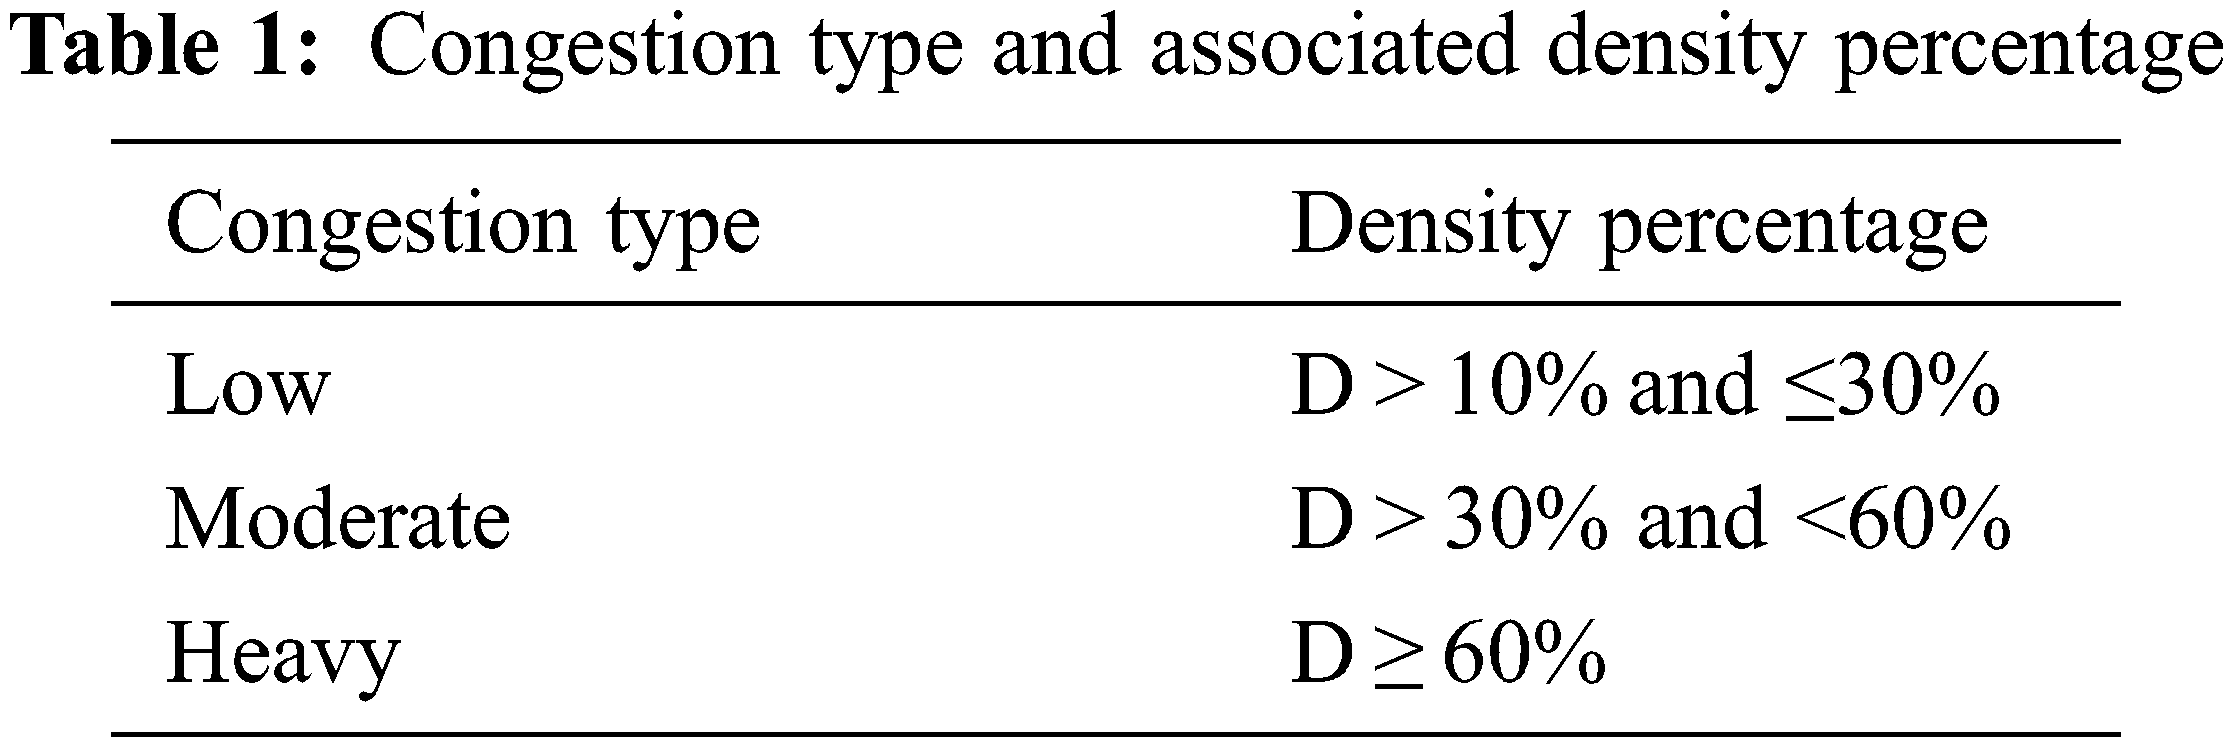
Table 1 summarizes the types of congestion and their associated density percentage.
The proposed algorithm minimizes the wait time for vehicles on every road since the green signal time is proportional to traffic density. It also reduces fuel consumption and carbon emissions. Fig. 5 illustrates the regular intersection of two roads where every road contains two lanes: one is for vehicles entering the road, while another is for vehicles leaving. Every lane is associated with one camera and one WSN, as depicted in Fig. 5. The WSN is used to acquire real-time data from its lane and the camera provides real-time visualization of the status of the road.
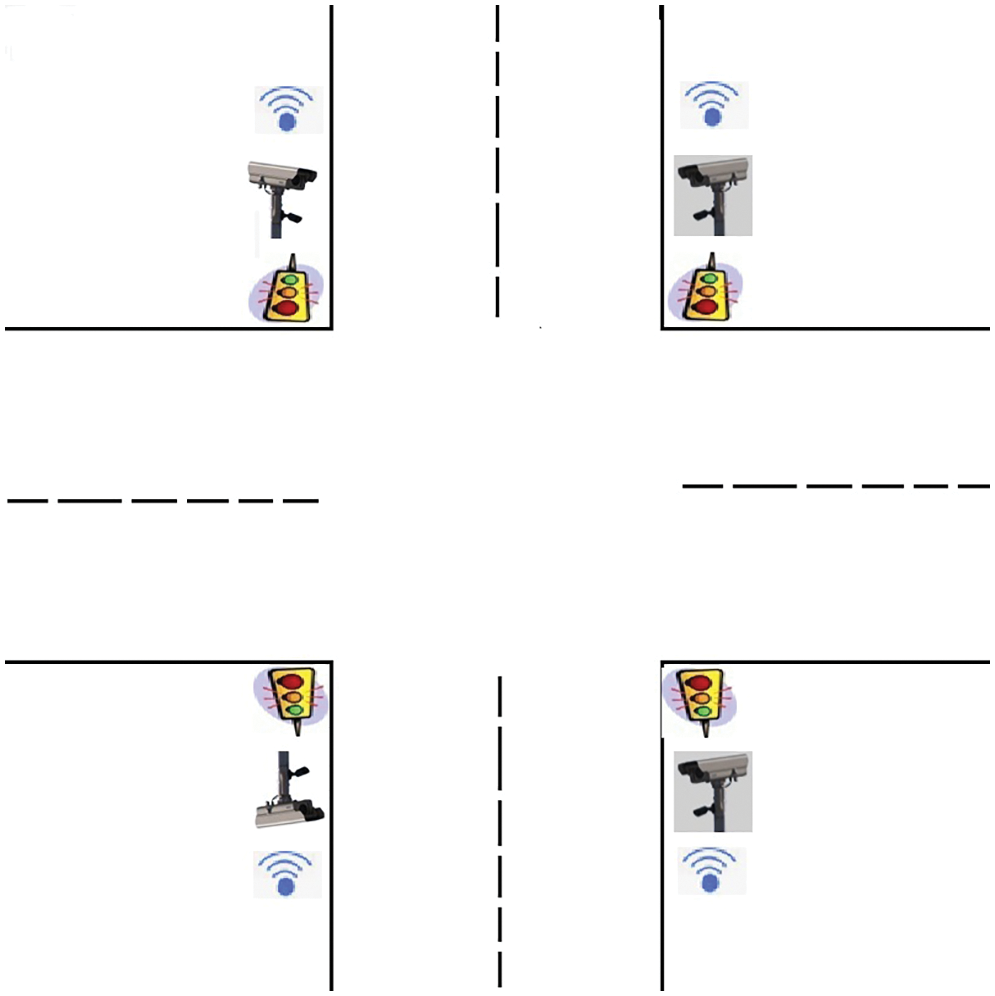
Figure 5: Regular intersection of two roads
The presented IAM system in this article has numerous benefits and advantages. It is:
A. Applicable at any intersection where traffic lights exit.
B. Dependable and practical.
C. Capable of measuring several performance parameters/metrics, including average waiting time during red lights and average suggested time in seconds for red and green lights.
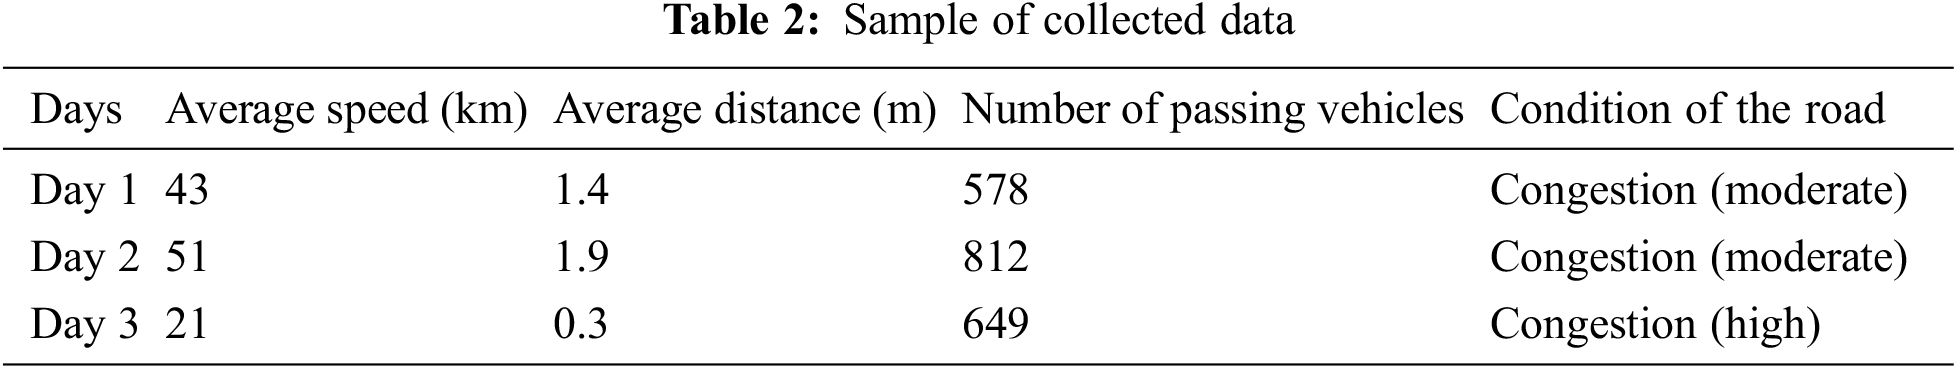
Initially, data was collected from one of the busiest roads in the city of Jeddah, Saudi Arabia, for 30 days, specifically at Sari Road and Prince Sultan Road. The collected data was fed to the CNN tool to train the approach. The road was monitored during school days, Jeddah Season, and June and July summer months. Table 2 lists the average collected data values for three days from 4:00 pm until 5:00 pm. Collecting data from earlier in the day was challenging due to the weather: the temperature was nearly over 35°C in the early morning.
The authorities in the Jeddah Municipality have built a bridge on Sari Road, moving West to East and vice versa to reduce congestion. The bridge was costly, with a nearly 100 million dollar budget. The bridge minimizes congestion moderately. However, drivers suffer from traffic jams at the intersection, where they still spend time waiting for lights to turn. In this area, the red signal is always set to 45 s while the green signal is 20 s.
One simulation experiment was conducted on an image illustrated using Paint software to validate and verify the algorithm. This experiment was carried out on a machine running a Windows platform. It had the 8th generation Intel chip with a 2 GHz speed and 16 GB of RAM. It is a 64-bit-based processor. Rectangular symbols denote vehicles during the simulation experiment. In addition, numerous images of vehicles on Sari Road are utilized in this model to verify its correctness and effectiveness. Fig. 6 shows the considered intersection in a photo taken from Google Maps. At the same time, Fig. 7 illustrates the number of vehicles in every lane of Fig. 5. The vehicles are depicted as black rectangles. The range of used sensors is assumed to be 20 meters. This value is involved in the calculation of traffic density.
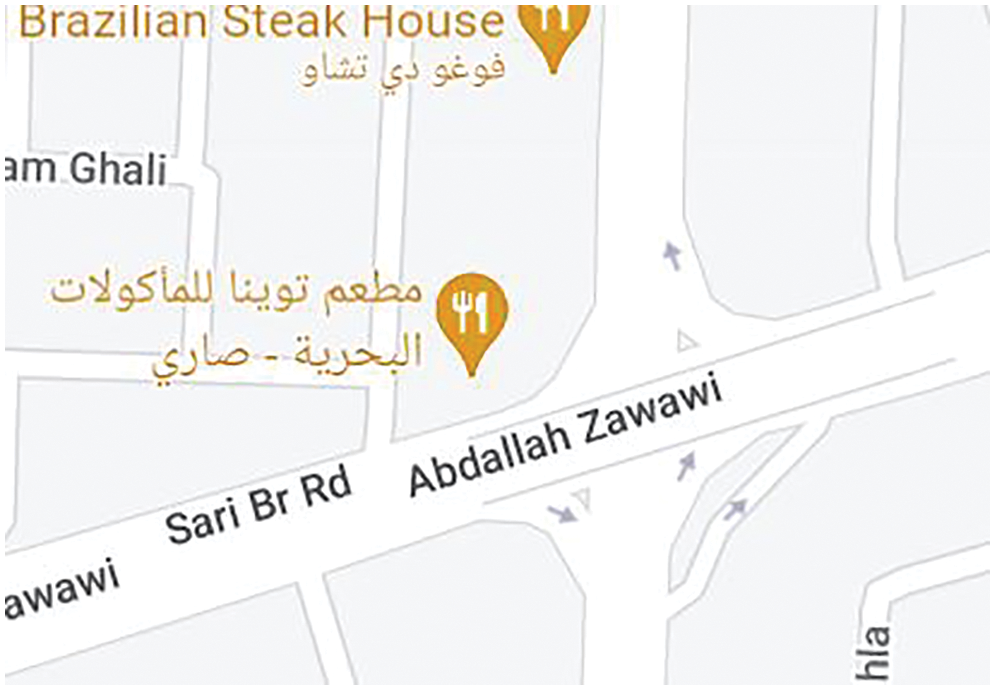
Figure 6: The considered actual intersection
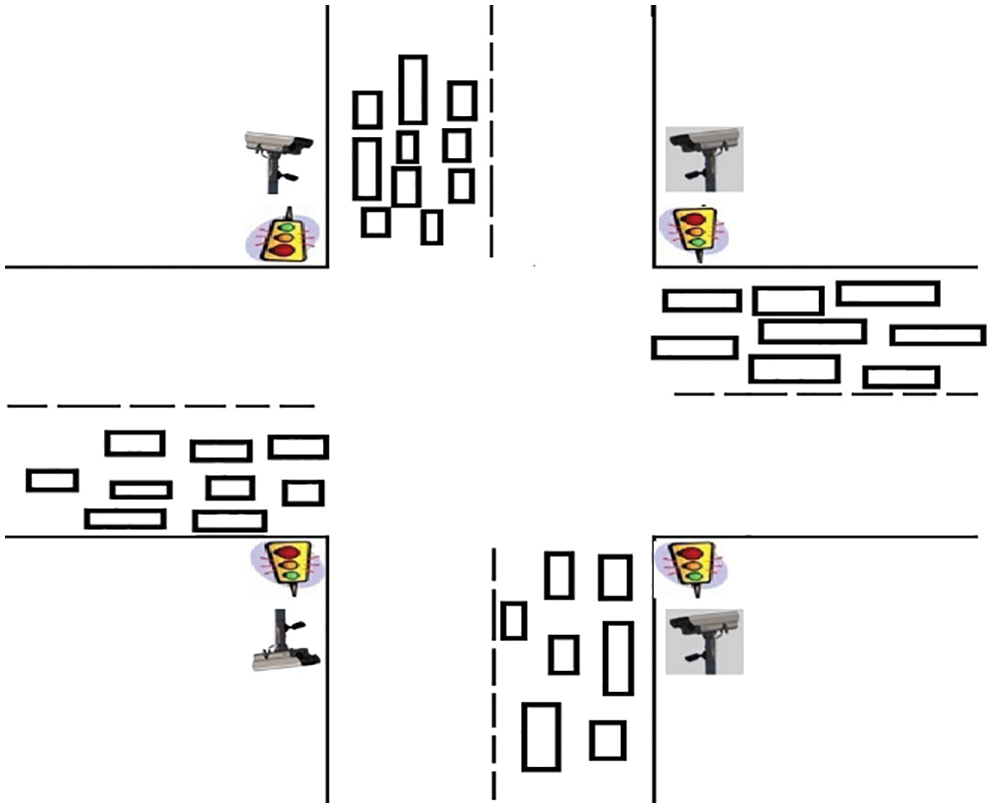
Figure 7: Simulated scenario with cars at the intersection
The proposed algorithm reads the input, as shown in Fig. 7, and produces its output, as illustrated in Fig. 8, where every road and vehicle are detected. Fig. 9 depicts the proposed algorithm’s outputs, including the number of vehicles on all roads and the traffic density.
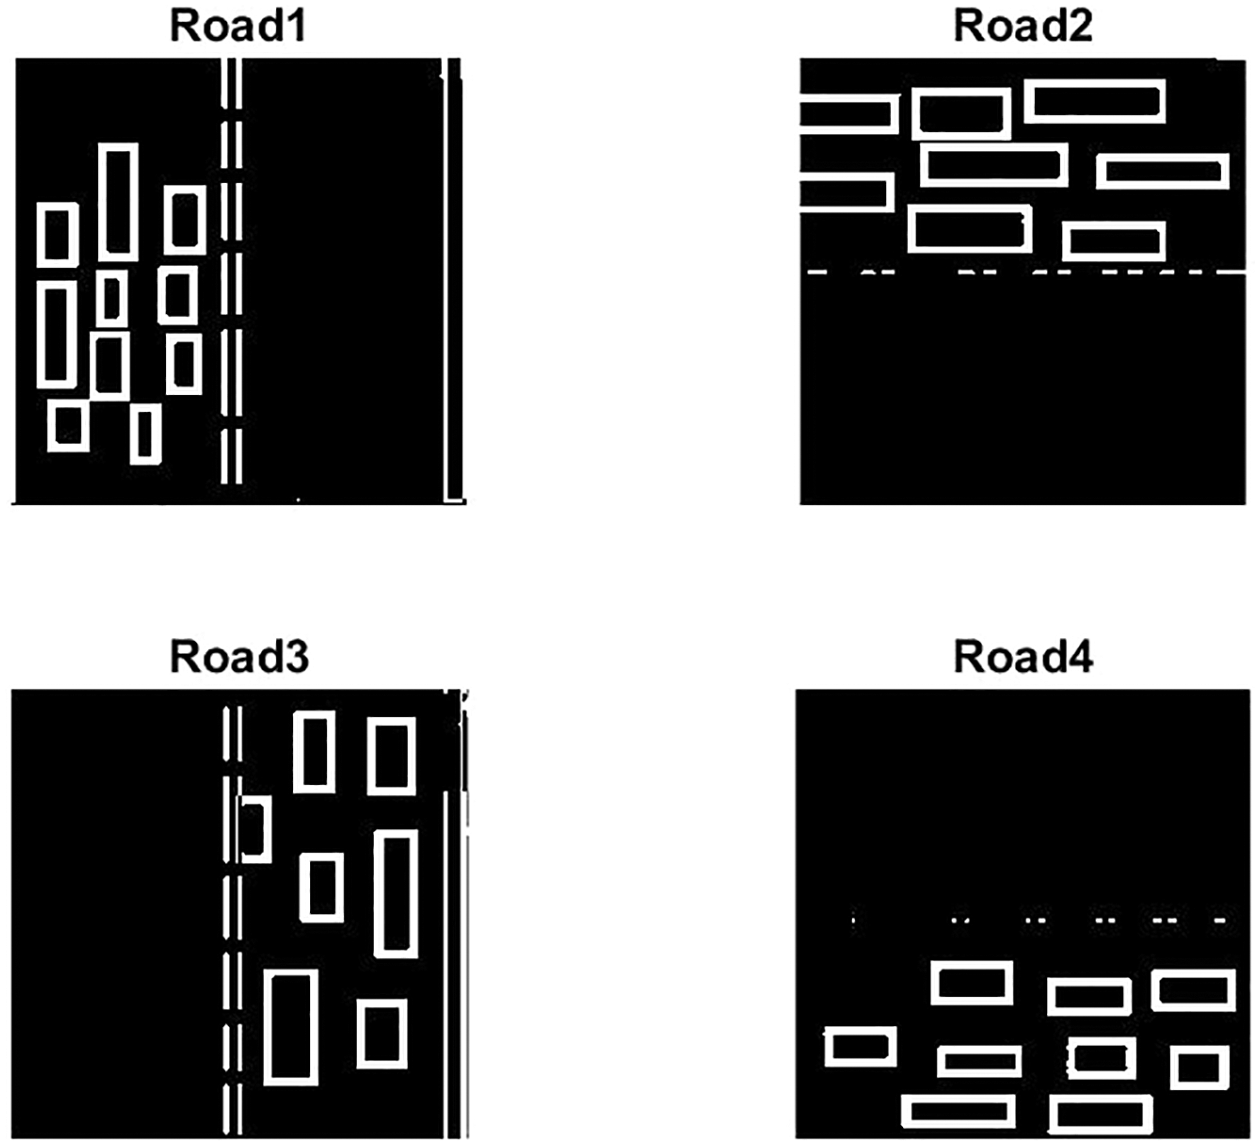
Figure 8: Detected roads and vehicles
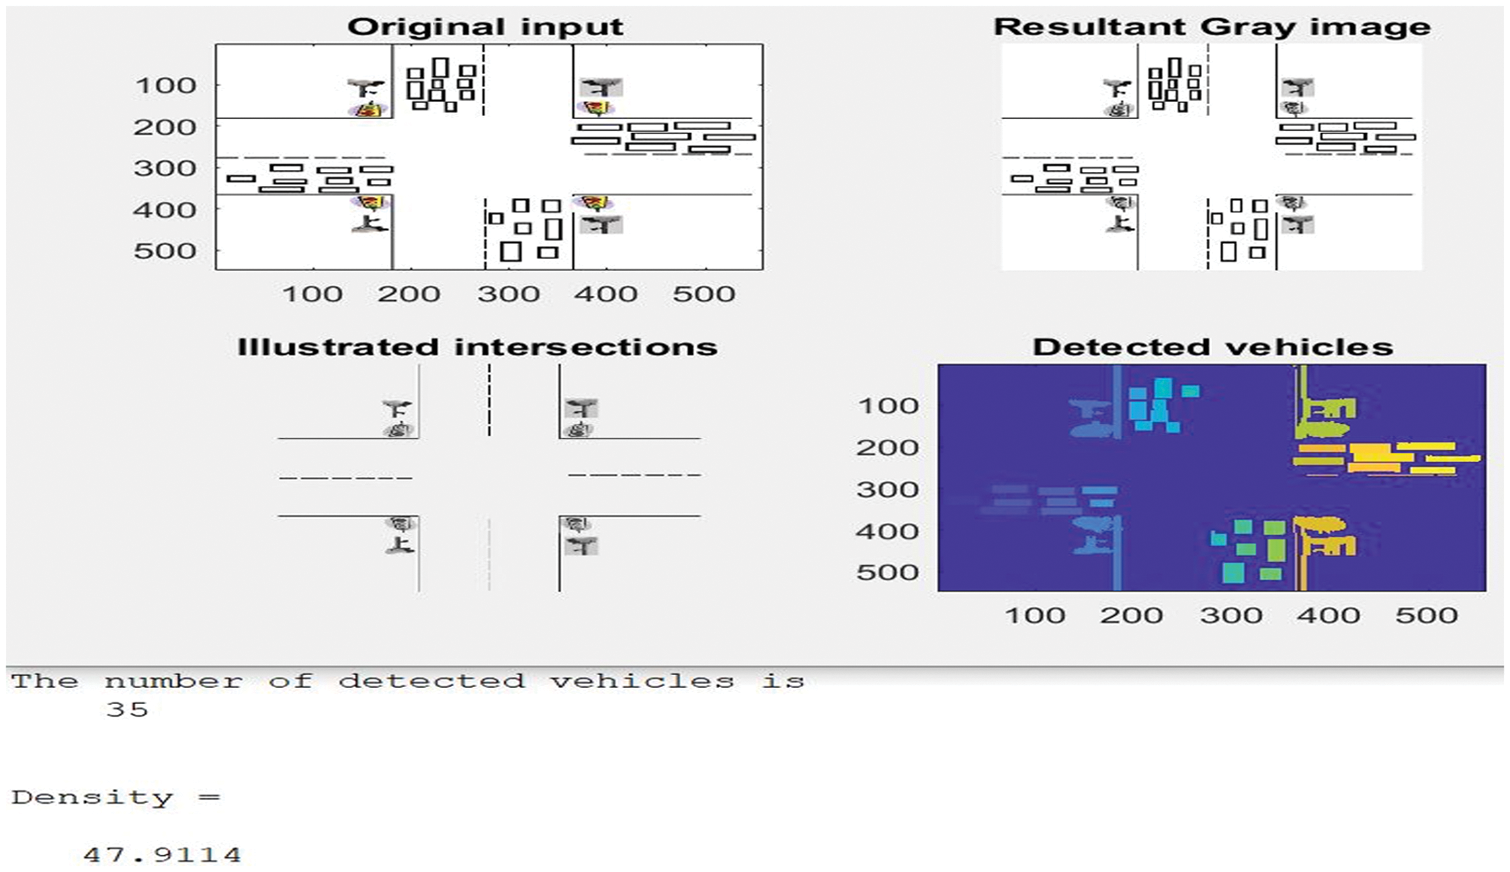
Figure 9: Sample of outputs
As shown in Figs. 7–9, the presented algorithm detects the number of vehicles and appropriately computes the traffic density parameter. A real test scenario is then conducted on Sari Road, also known as Abdallah Zawawi, shown in Fig. 6. The average waiting time for vehicles on every road is evaluated and compared with the average waiting time in the traditional traffic light system. A comparison evaluation was also conducted to evaluate the effects of a fixed light system compared to the dynamic, adaptable system proposed here. Remember that the number of detected vehicles is collected by the individual camera installed for every lane. In Fig. 9, the proposed IAM system determines the total number of vehicles in all lanes for demonstration purposes. Fig. 10 shows a sample of traffic congestion on the considered road.
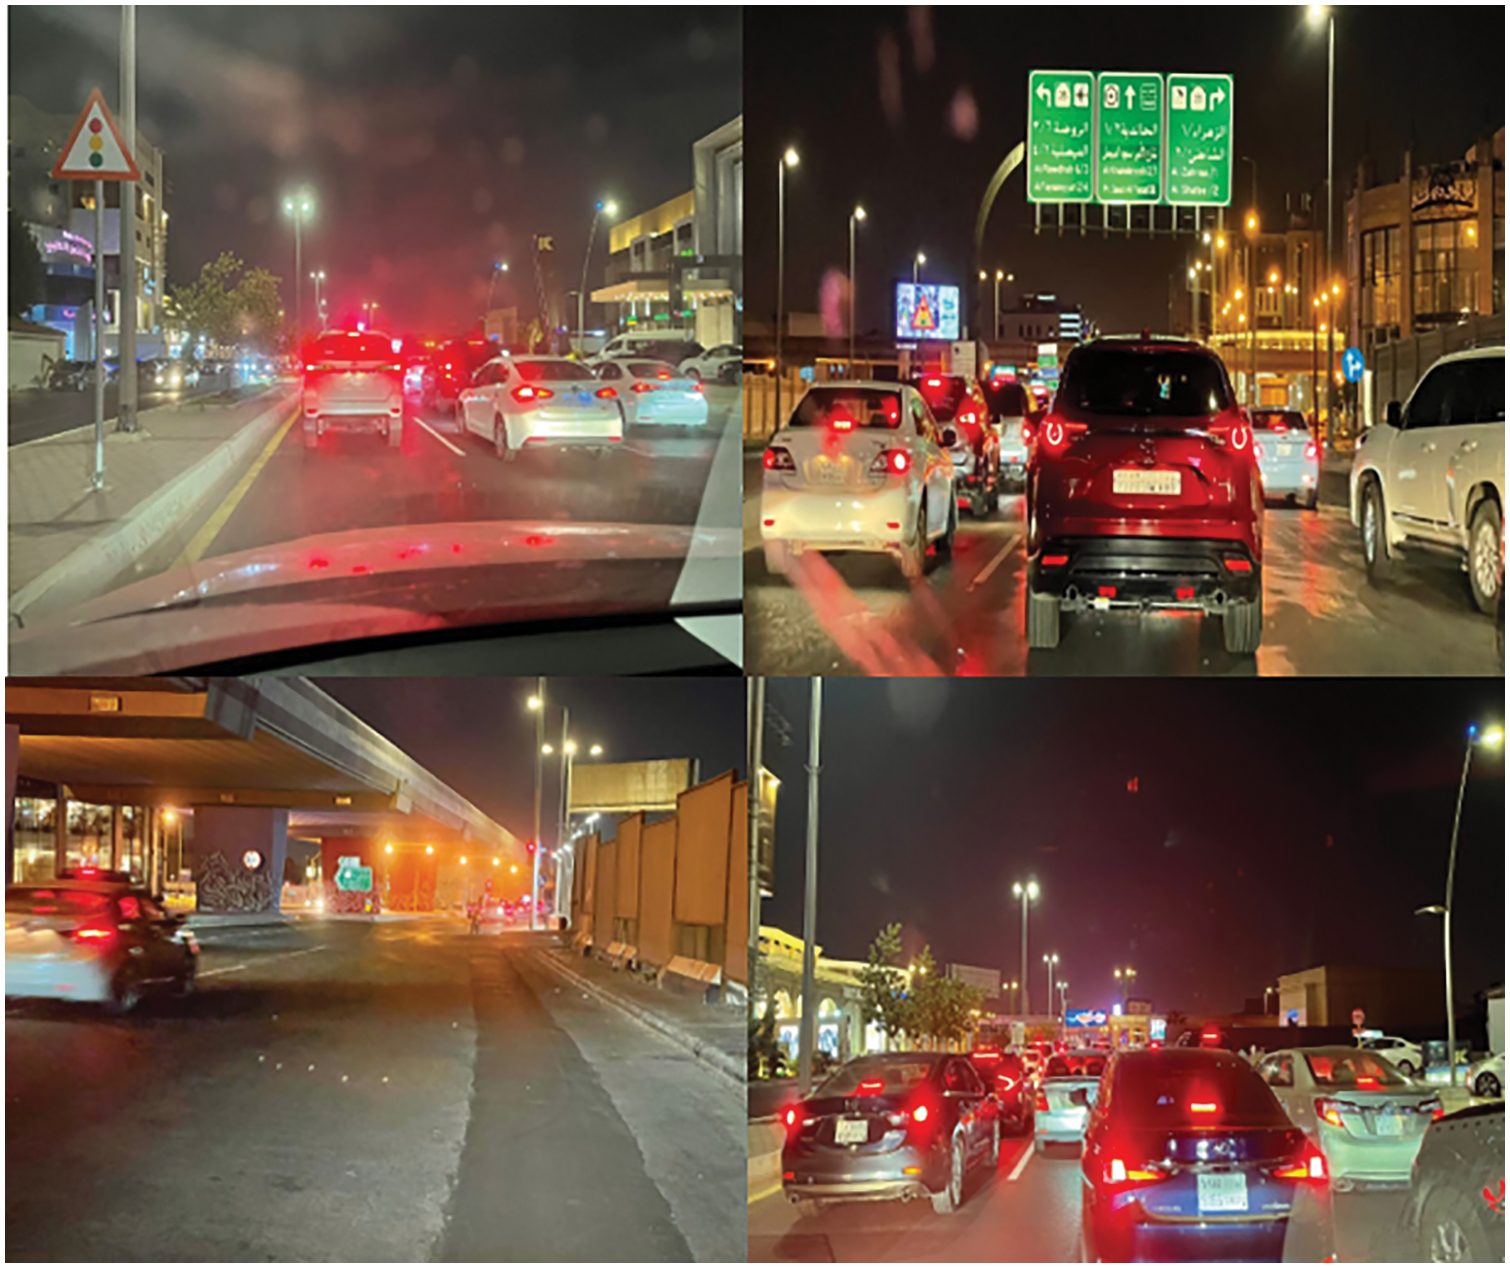
Figure 10: An actual image of the four-way intersection of Sari Road with Prince Sultan Road
Fig. 10 displays the traffic condition of Sari Road during rush hour. Four images were captured to show all four directions on the road. These four images were collaged to form one photo, as in Fig. 10. All images were taken at 8:14 pm local time in Saudi Arabia using a smartphone. Sari Road rush hours are considered between 12:00 pm and 9:00 pm. Fig. 10 shows an actual image of the four-way intersection of Sari Road with Prince Sultan Road. The bottom right photo shows the East-to-West direction (Road1), the bottom left photo depicts the West-to-East direction (Road2), the upper right picture depicts the North-to-South direction (Road3), and the upper left photo depicts the South-to-North direction (Road4). The proposed IAM system takes about 6.71 s to generate its outputs. This time seems enormous due to the involvement of numerous procedures. However, because the system learns to make decisions faster over time, the computational time can be reduced to 2.4 s. This time depends mainly on the length of the video streams since the model processes every frame in these streams. Therefore, the higher the number of video frames, the higher the computation time. A video stream with 20 s was tested and found to contain nearly 700 frames. These frames took around 7 s to be entirely processed by the proposed IAM system. Thus, every frame took 0.01 s which is reasonable and acceptable. Due to this parameter, the computational time, all cameras in the presented system are set to provide 20 s for every video stream.
Table 3 compares the average waiting time in seconds of the traditional traffic system and that which resulted from the proposed algorithm. The obtained results in Table 3 are the suggested values during rush hour. However, these figures will change according to the status and conditions of the roads. As shown in Table 3, the proposed algorithm reduced the average waiting time significantly: a nearly 50% reduction was achieved. With a 50% reduction in wait time, fuel consumption and air pollution are reduced alongside frustration for drivers. This reduction in wait time is considered a performance metric and is denoted in blue in Table 3.
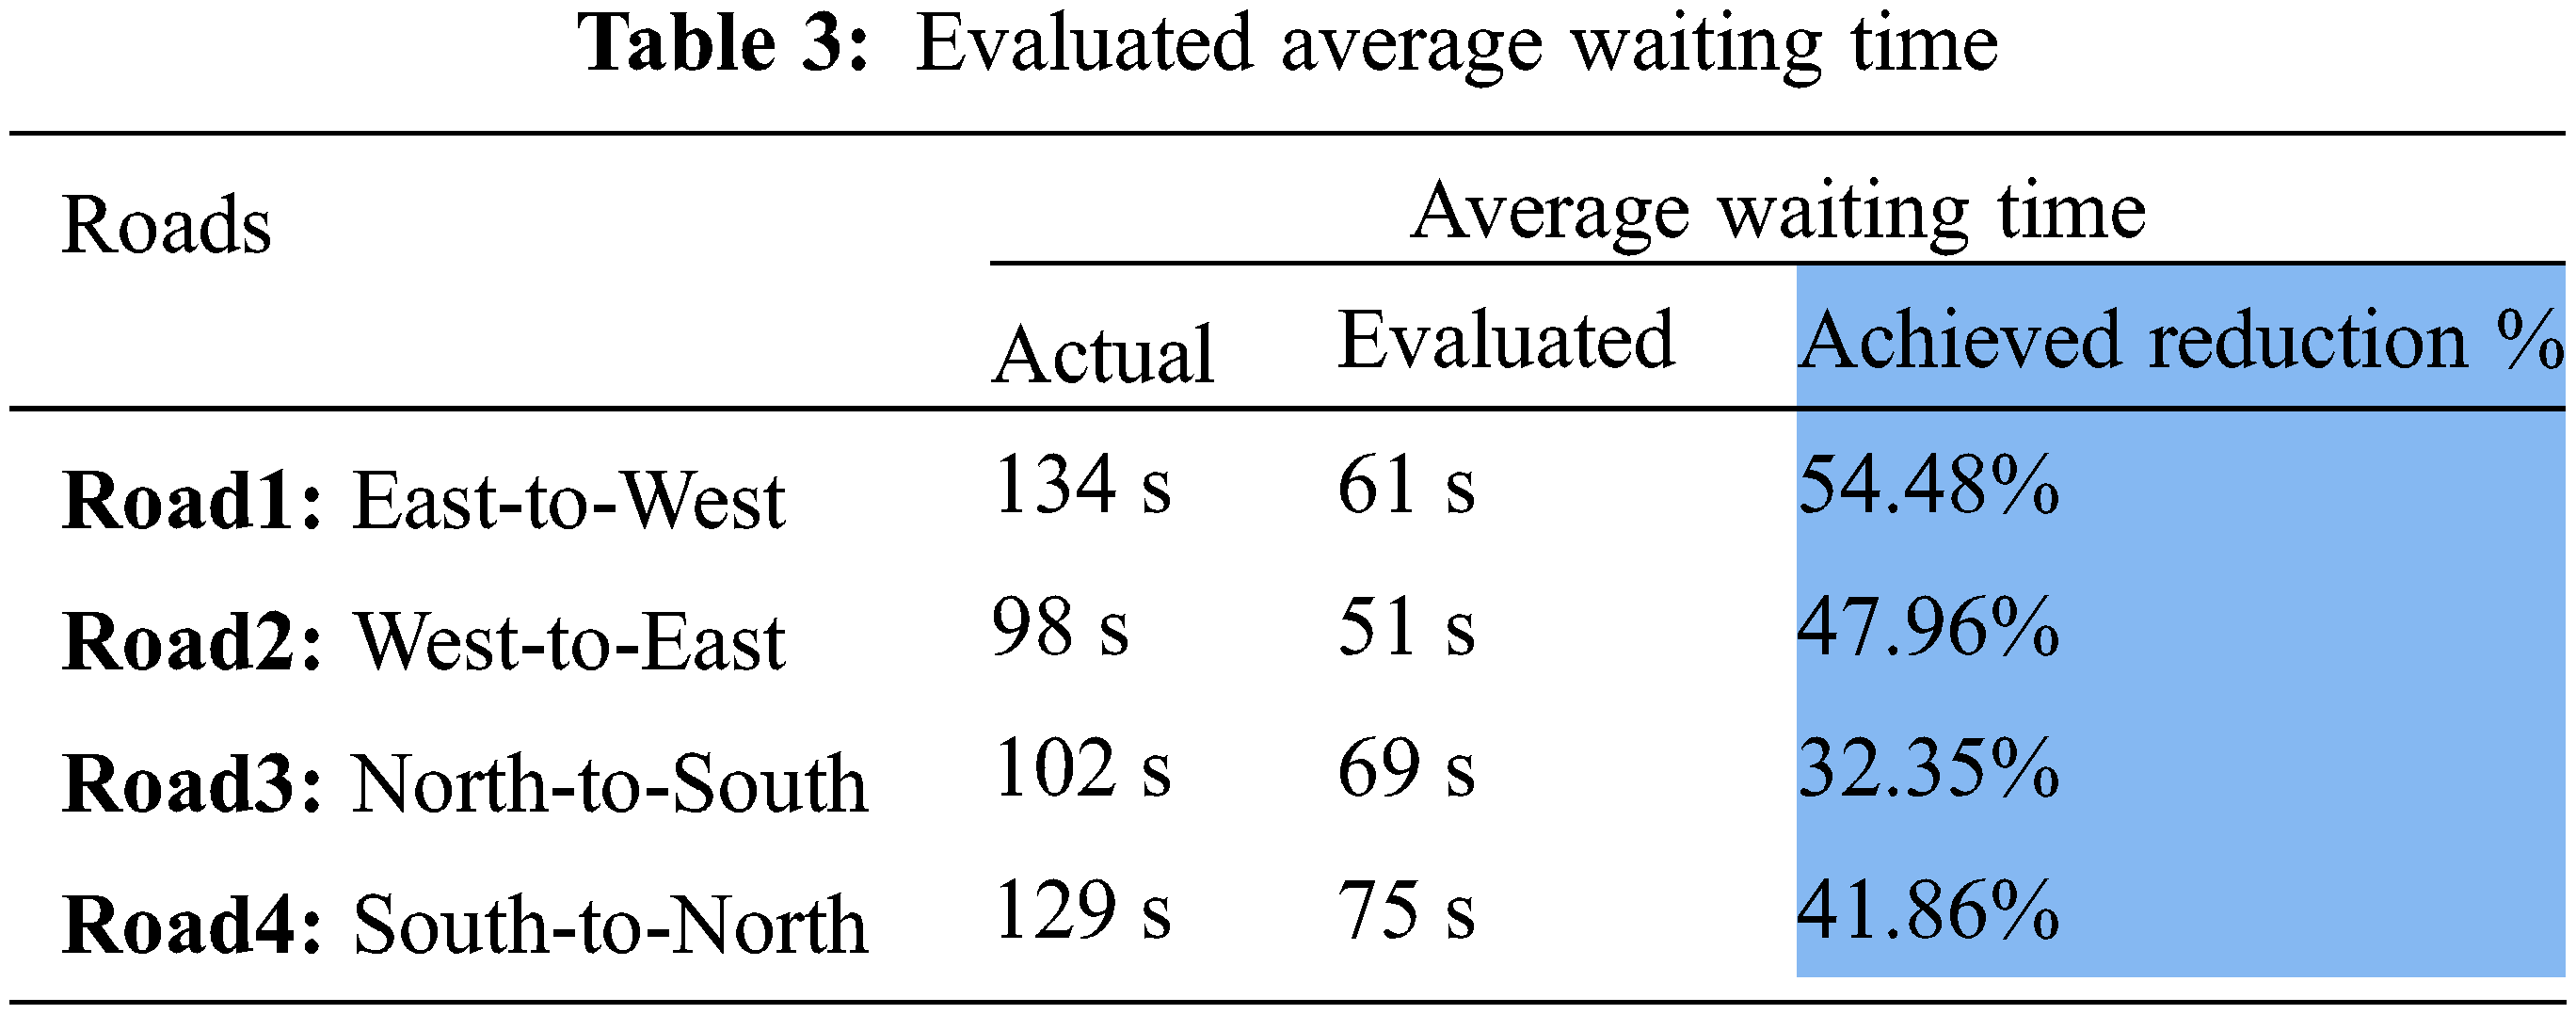
Table 4 displays the allocated times for the red and green signals in the fixed system vs. the suggested times offered by the algorithm in seconds.
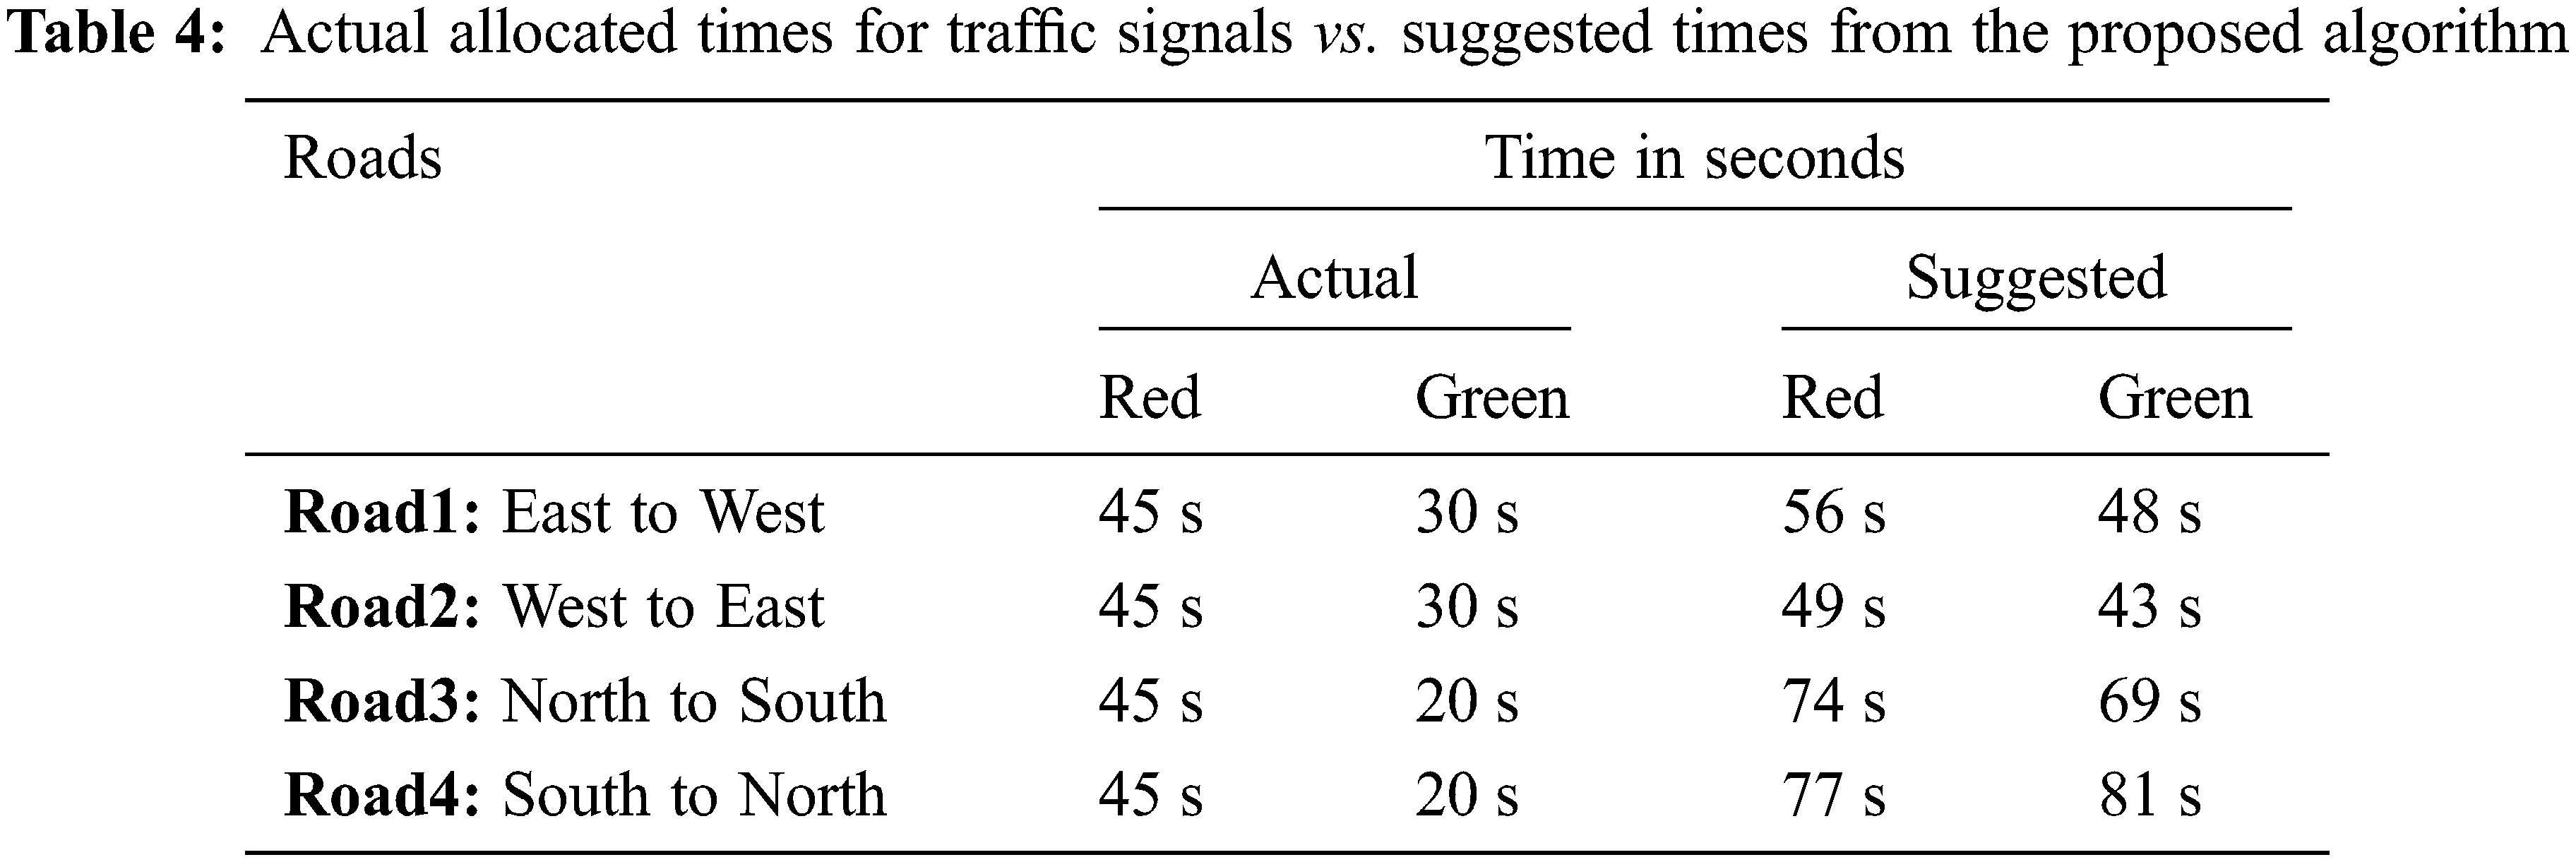
The presented algorithm dynamically adjusts the time for each traffic signal based on traffic conditions. Increasing the allocated times for the green signals reduces congestion considerably. It was found that congestion occurs more from North to South and vice versa since the built bridge navigates the traffic only from West to East and vice versa.
Table 5 illustrates the conducted assessment and evaluation of the IAM system with other implemented state-of-the-art works in the literature. This assessment focuses on the fundamental technique, methods being utilized and deployed, the outcomes of these solutions, the average waiting time during the red light, the proposed time for the green light, and the associated cost with every solution. Table 5 clearly shows that every method is associated with its key technology and other terminologies. However, the work developed in [4] is quite similar to the proposed IAM system, and its accuracy is nearly 80%, as claimed by the authors. The presented system achieves an accuracy of nearly 96.82%, which is much better.
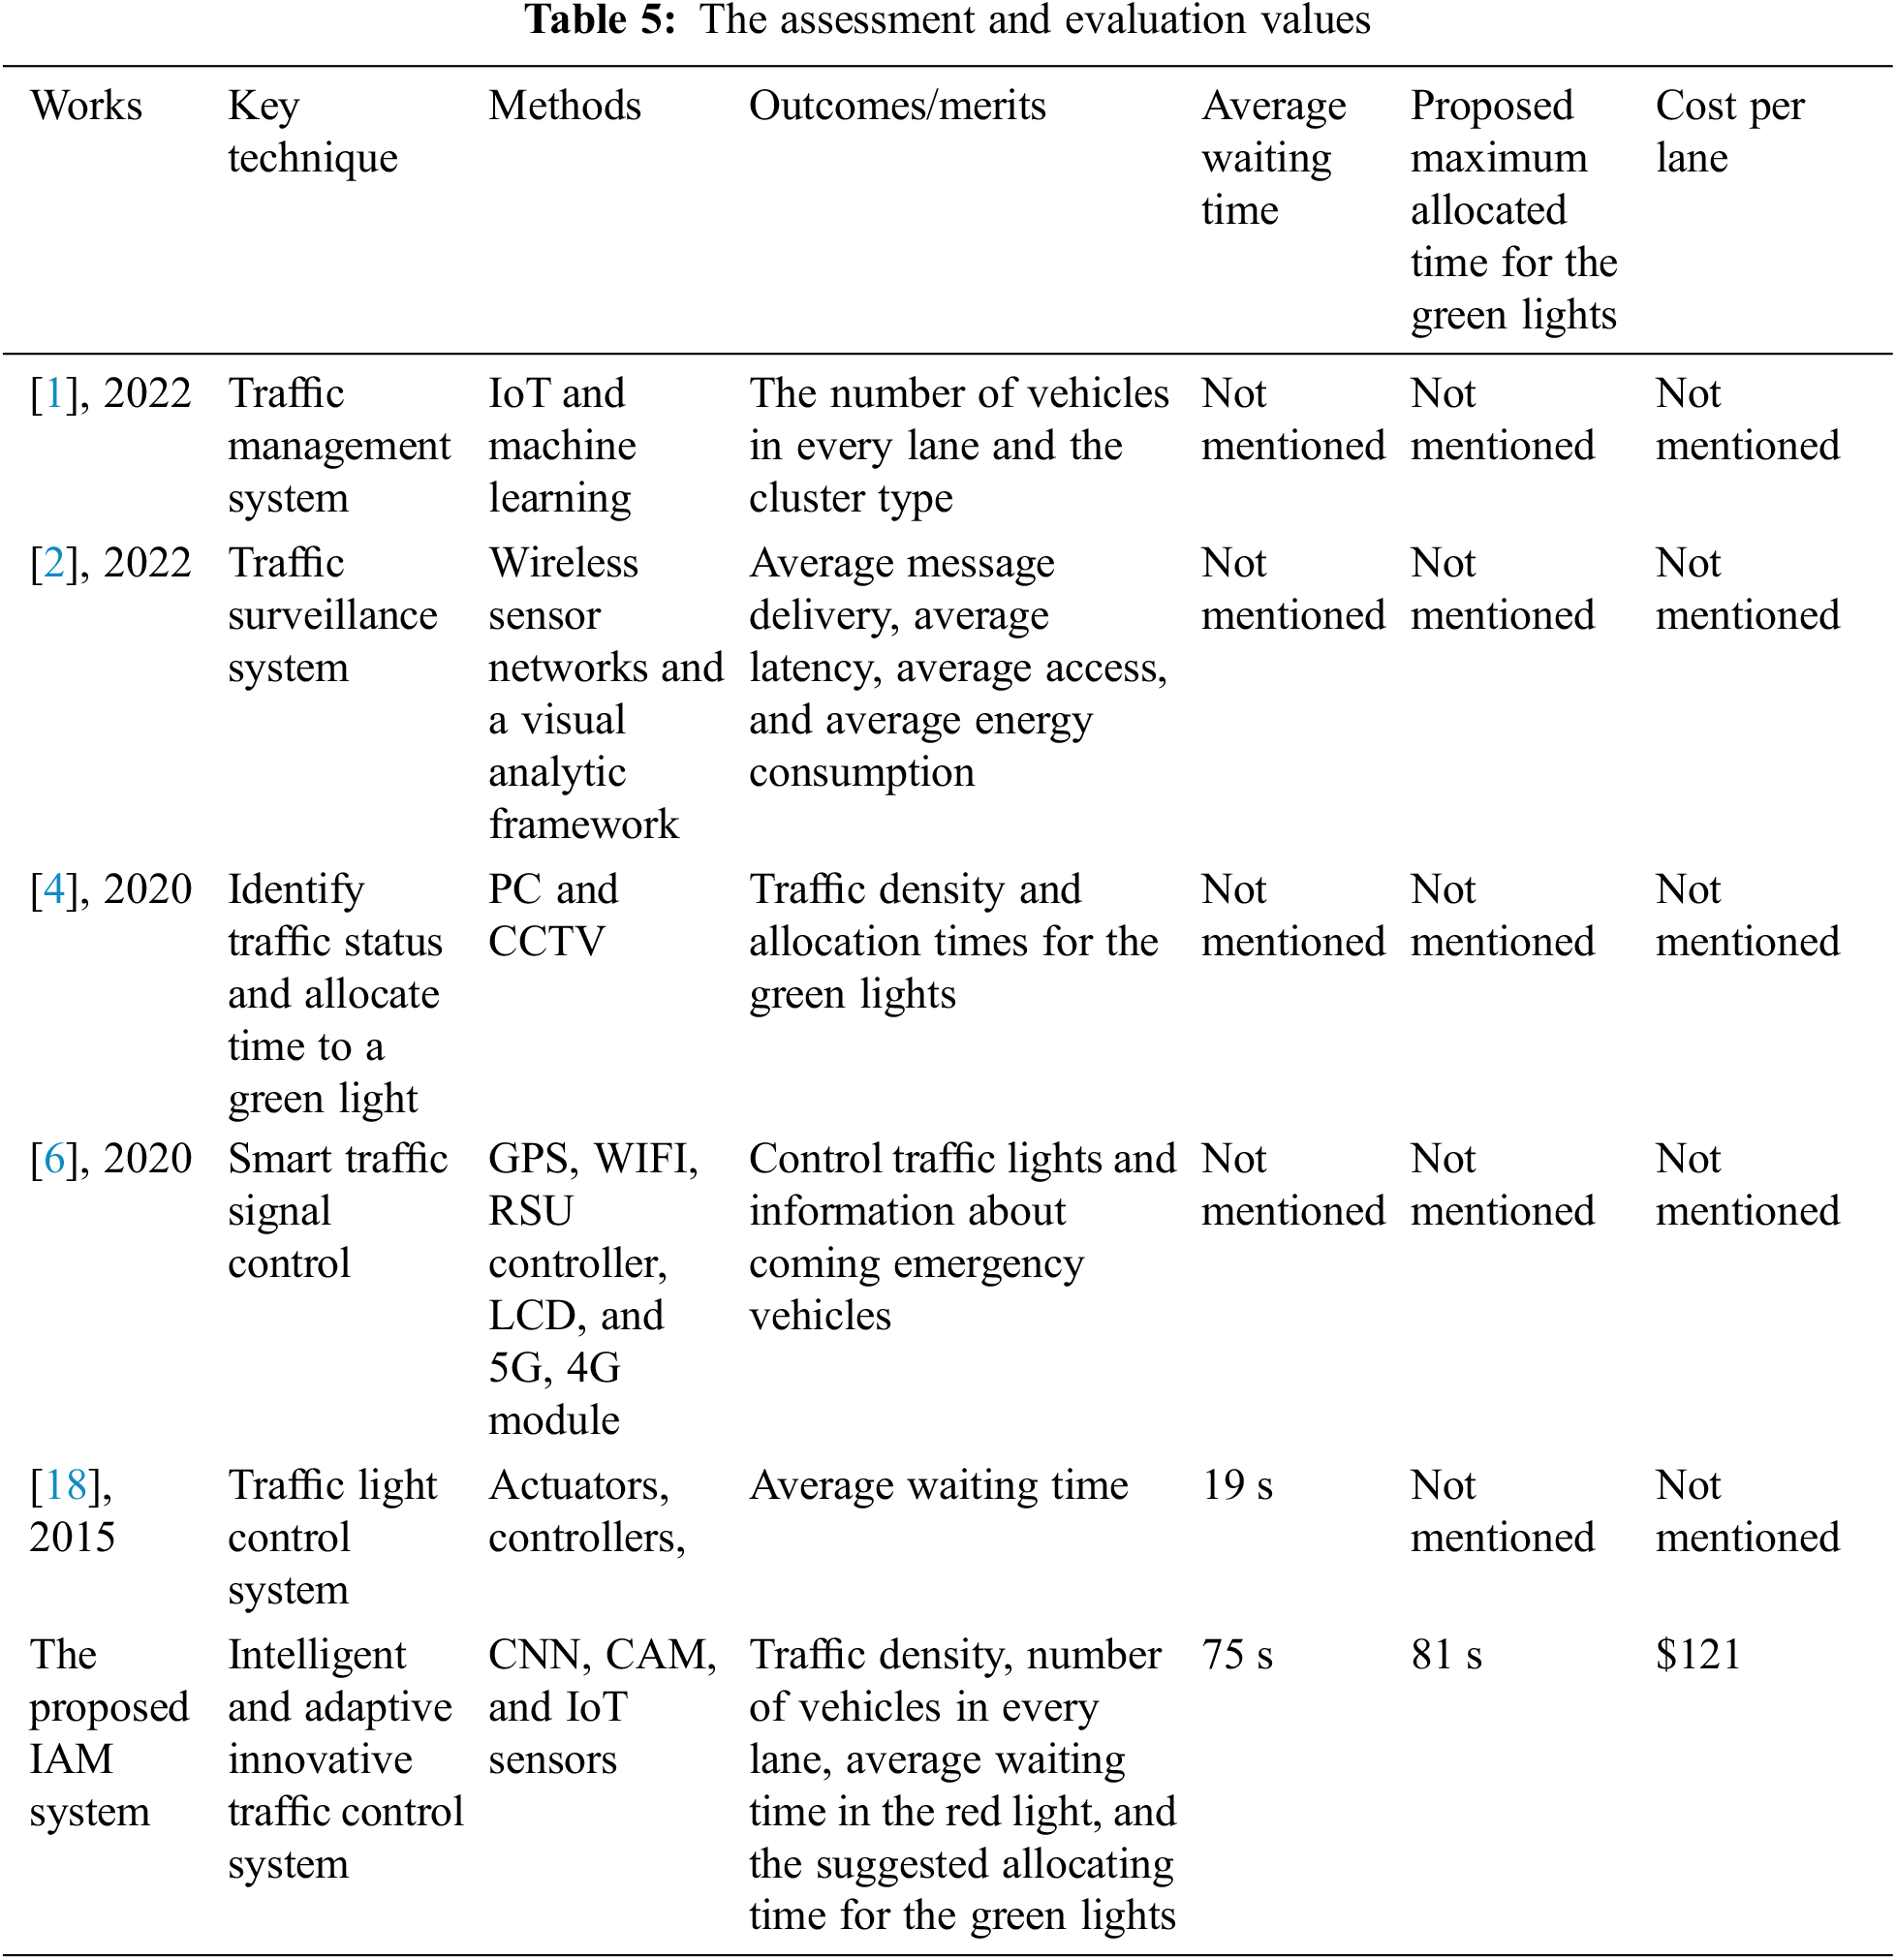
The proposed IAM system generates more outputs, as shown in Table 5. Moreover, the mentioned values of the average waiting time and the allocated time for the green light were the average computed time by the system. The cost is calculated based on the current market price of CAMS and WSNs in Jeddah, Saudi Arabia. WSNs are more expensive than CAMS at $74.
The proposed IAM system generates more outputs, as shown in the previous table. Moreover, the mentioned values of the average waiting time and the allocated time for the green light were the average computed time by the system. The cost is calculated based on the current market in Jeddah, Saudi Arabia, based on the price of CAMS and WSNs. WSNs are more expensive than CAMS as their prices are around $74, while the cost of a hosting machine and DB is excluded. Moreover, the hosting machine is also required to run the proposed system. The proposed IAM system reaches vehicle detection accuracy near 97%, and its improvement of the average waiting time during the red light is 54.48%. Its maximum suggested time was 81 s. The accuracy of vehicles detection is much better than other works, as shown in Table 5. Fig. 11 illustrates the evaluation of the average waiting time between the conventional allocated time (fixed time) of the red signals, developed methods in [18–20], and the proposed IAM system in terms of the maximum obtained average waiting time and the maximum achieved percentage of reduction of the same considered factor. This evaluation is conducted based on considering four intersections. The blue bar refers to the obtained average waiting time in seconds, while the orange bar represents the percentage of the maximum achieved reduction.
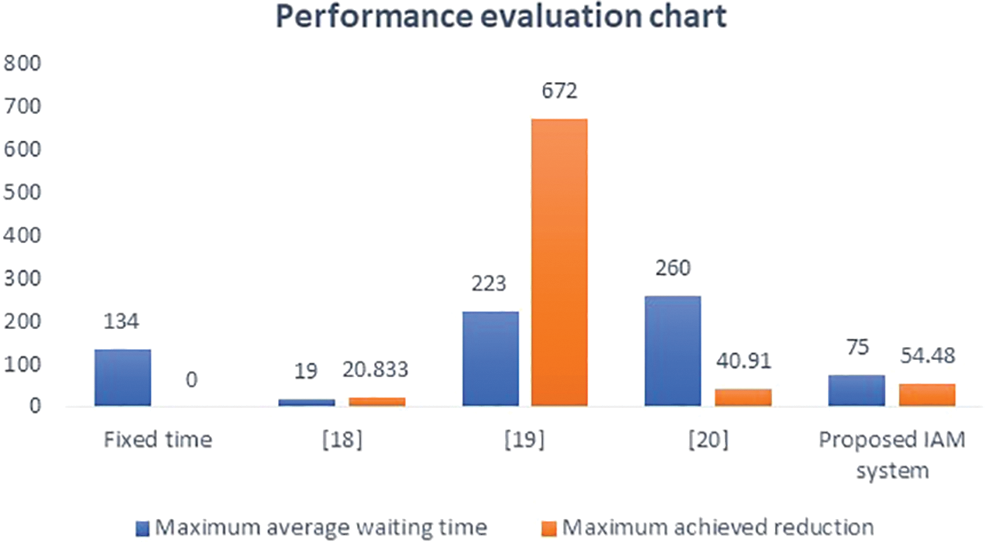
Figure 11: The comparison chart
Fig. 11 shows that there is no reduction achieved in the fixed time since the time is fixed; the developed system in [18] achieved a maximum reduction of 20.833%. The implemented system in [19] achieved the highest reduction value since the maximum fixed time used in that study was 680 s, while other systems used fewer values. In general, the proposed IAM system outperforms other systems, as shown in the same figure.
The proposed approach produces promising results in assigning different times for traffic signals according to road conditions. As per the assessment in Table 5, the proposed system has numerous merits, and no other works generate the same number of outputs. In other words, while some of the implemented models in the literature can do one or two of the things this method does, no model measures traffic density, the number of vehicles in every lane, the average waiting time at a red light, and the suggested time in seconds for green lights by lane. This method applies on roads where traffic jams occur and can significantly improve traffic congestion if deployed. Furthermore, it is very cost-effective due to the relatively low cost of its materials since its cost is not more than $121 per lane. This system is automated and adapts itself according to the road’s status and circumstances. The proposed system can be utilized in intersections where traffic congestion is vast, and drivers are frustrated and suffer from this issue. This problem is resolved by adjusting the allocated times for the red and green lights using the developed IAM system. The real test scenario proved that the IAM system minimized traffic congestion by dynamically changing the allocated times. This test illustrates that no human intervention is required since all operations are automated.
Acknowledgement: This research work was funded by Institutional Fund Projects under Grant No. (IFPIP: 707-829-1443). The authors gratefully acknowledge technical and financial support provided by the Ministry of Education and King Abdulaziz University, DSR, Jeddah, Saudi Arabia.
Funding Statement: This research work was funded by Institutional Fund Projects under Grant No. (IFPIP: 707-829-1443). The authors gratefully acknowledge technical and financial support provided by the Ministry of Education and King Abdulaziz University, DSR, Jeddah, Saudi Arabia.
Conflicts of Interest: The authors declare that they have no conflicts of interest to report regarding the present study.
References
1. U. K. Lilhore, A. L. Imoize, C. T. Li, S. Simaiya, S. K. Pani et al., “Design and implementation of an ML and IoT based adaptive traffic-management system for smart cities,” MDPI: Sensors, vol. 22, no. 2908, pp. 1–26, 2022. [Google Scholar]
2. Q. N. Naveed, H. Alqahtani, R. U. Khan, S. Almakdi, M. Alshehri et al., “An intelligent traffic surveillance system using integrated wireless sensor network and improved phase timing optimization,” MDPI: Sensors, vol. 22, no. 3333, pp. 1–19, 2022. [Google Scholar]
3. R. Prasad, H. Yadav, D. Kumar, S. Pandey and A. Yadav, “Smart traffic monitoring and controlling,” Journal of Emerging Technologies and Innovative Research (JETIR), vol. 8, no. 6, pp. 744–748, 2021. [Google Scholar]
4. F. Al Kalbani, N. Al Bulushi and S. Imran, “IoT based: Smart traffic light controller,” Fourth Middle East College Student Research Conference, Muscat, Sultanate of Oman, no. 2019, pp. 1–7, 2020. [Google Scholar]
5. W. H. Lee and C. Y. Chiu, “Design and implementation of a smart traffic signal control system for smart city applications,” MDPI: Sensors, vol. 20, no. 508, pp. 1–18, 2020. [Google Scholar]
6. D. Nam, R. Lavanya, R. Jayakrishnan, I. Yang and W. H. Jeon, “A deep learning approach for estimating traffic density using data obtained from connected and autonomous probes,” MDPI: Sensors, vol. 20, no. 4824, pp. 13, 2020. [Google Scholar]
7. R. Vidya and L. Amruth, “Intelligent traffic control system,” International Journal of Engineering Research and Technology (IJERT), vol. 8, no. 14, pp. 230–231, 2020. [Google Scholar]
8. J. L. A. Damulo, R. M. D. Dy, S. K. M. Pestano, D. C. Signe, E. E. Vasquez et al., “Video-based traffic density calculator with traffic light control simulation,” in AIP Conf. Proc., Jember, Indonesia, vol. 2278, no. 1, pp. 1–12, 2020. [Google Scholar]
9. S. B. Honrao and U. D. Shiurkar, “Benefits of smart traffic system (STS) and different techniques used for it,” International Journal of Recent Technology and Engineering (IJRTE), vol. 8, no. 6, pp. 1133–1137, 2020. [Google Scholar]
10. M. Sharma, A. Bansal, V. Kashyap, P. Goyal and T. Hussain, “Intelligent traffic light control system based on traffic environment using deep learning,” in Proc. of IOP Conf. Series: Material Science and Engineering, Rajpura, India, vol. 1022, no. 1, pp. 1–16, 2020. [Google Scholar]
11. W. A. Alothman, S. Suliman and H. N. Al-Madani, “Intelligent traffic control system for over-saturated signalized intersections in Kuwait,” Kafrelsheikh Journal of Information Sciences, vol. 1, no. 1, pp. 15–20, 2018. [Google Scholar]
12. F. Chowdhury, R. A. Biplob and J. Uddin, “Real-time traffic density measurement using computer vision and dynamic traffic control,” in Proc. of 2018 Joint 7th Int. Conf. on Informatics, Electronics and Vision (ICIEV) and 2018 2nd Int. Conf. on Imaging, Vision and Pattern Recognition (icIVPR), Kitakyushu, Japan, pp. 353–357, 2018. [Google Scholar]
13. S. Walsen and L. M. Saleh, “The effect analysis of traffic volume, velocity and density in Dr. Siwabessy salobar road,” International Journal of Advanced Engineering Research and Science (IJAERS), vol. 4, no. 11, pp. 111–119, 2017. [Google Scholar]
14. R. Linganagouda, P. Raju and A. Patil, “Automatic intelligent traffic control system,” International Journal of Advanced Research in Electrical, Electronics and Instrumentation Engineering (IJAREEIE), vol. 5, no. 7, pp. 5902–5906, 2016. [Google Scholar]
15. A. Kumar, “Different types of CNN architecture https explained: Examples,” April 22, 2022. [Online]. Available https://vitalflux.com/different-types-of-cnn-architectures-explained-examples/. [Google Scholar]
16. R. U. Yawli, K. K. Modak, P. S. Shivshette and S. S. Vhaval, “Smart traffic control system,” SSRG International Journal of Electronics and Communication Engineering (SSRG-IJECE), vol. 3, no. 3, pp. 20–23, 2016. [Google Scholar]
17. Wikipedia. [Online]. Available: https://en.wikipedia.org/wiki/AlexNet. [Google Scholar]
18. J. A. Omina, “An intelligent traffic light control system based on fuzzy logic algorithm,” International Academic Journal of Information Systems and Technology, vol. 1, no. 5, pp. 1–17, 2015. [Google Scholar]
19. S. A. E. Mohamed and K. A. Alshalfan, “Intelligent traffic management system based on the internet of vehicles (IoV),” Journal of Advanced Transportation, vol. 2021, Article ID 4037533, 23 pages, 2021. [Google Scholar]
20. H. Joo and Y. Lim, “Traffic signal time optimization based on deep Q-network,” Applied Sciences, vol. 11, no. 21, pp. 1–14, 2021. [Google Scholar]
Cite This Article
 Copyright © 2023 The Author(s). Published by Tech Science Press.
This work is licensed under a Creative Commons Attribution 4.0 International License , which permits unrestricted use, distribution, and reproduction in any medium, provided the original work is properly cited.
 Downloads
 Citation Tools