
 Submit a Paper
 Propose a Special lssue
 Open Access
ARTICLE

LuNet-LightGBM: An Effective Hybrid Approach for Lesion Segmentation and DR Grading
1 School of Computer Science and Engineering, VIT-AP University, Amaravati, Andhra Pradesh, 522237, India
2 School of Computer Science and Engineering, VIT-AP University, Amaravathi, 522237, India
* Corresponding Author: J. Harikiran. Email:
Computer Systems Science and Engineering 2023, 46(1), 597-617. https://doi.org/10.32604/csse.2023.034998
Received 03 August 2022; Accepted 19 October 2022; Issue published 20 January 2023
 View Full Text
 Download PDF
Abstract
Diabetes problems can lead to an eye disease called Diabetic Retinopathy (DR), which permanently damages the blood vessels in the retina. If not treated early, DR becomes a significant reason for blindness. To identify the DR and determine the stages, medical tests are very labor-intensive, expensive, and time-consuming. To address the issue, a hybrid deep and machine learning technique-based autonomous diagnostic system is provided in this paper. Our proposal is based on lesion segmentation of the fundus images based on the LuNet network. Then a Refined Attention Pyramid Network (RAPNet) is used for extracting global and local features. To increase the performance of the classifier, the unique features are selected from the extracted feature set using Aquila Optimizer (AO) algorithm. Finally, the LightGBM model is applied to classify the input image based on the severity. Several investigations have been done to analyze the performance of the proposed framework on three publically available datasets (MESSIDOR, APTOS, and IDRiD) using several performance metrics such as accuracy, precision, recall, and f1-score. The proposed classifier achieves 99.29%, 99.35%, and 99.31% accuracy for these three datasets respectively. The outcomes of the experiments demonstrate that the suggested technique is effective for disease identification and reliable DR grading.Keywords
Diabetes is a condition when the body produces less insulin than it needs to, which causes blood glucose levels to rise. Diabetes affects millions of people each year all around the world. Nearly 450 million people are estimated to have had either type 1 or type 2 diabetes in the past two decades. Type 1 and type 2 diabetes are the two chronic kinds among the four main types of diabetes, whereas hereditary deficiencies and gestational diabetes may usually be reversed. [1–3]. It results in a lot of health issues, like vision loss, Diabetic Retinopathy (DR), stroke, kidney failure, heart attacks, and other issues.
The blood vessels in the retina’s tissue become damaged as a result of long-term diabetes. Due to this, the macula becomes infected with lipids, fluids, and blood, which obscures vision. Patients with DR frequently experience color blindness, fuzzy vision, loss of central vision, floaters in the visual field, and poor night vision [4–6]. Moreover, patients who have advanced DR go completely blind, and the affliction typically lasts a lifetime.
Lesions, or spots, can be seen in the fundus retina image as a result of the leaky blood and fluids. Bright lesions or red lesions are the two ways to identify lesions. Hemorrhage (HM) and Microaneurysms (MA) are present in red lesions, whereas Exudates (EX) are bright lesions. The smaller spots are known as MA, and the larger ones are known as HM [7–9]. Hard EX displays vivid yellow spots, but soft EX appears as fluffy, white-yellowish spots because nerve fibers are damaged. It is often known as cotton wool. Depending on the kinds and quantities of lesions shown on the retinal picture, there are five DR phases.
It is challenging to treat DR when it is severe. As a result, it’s critical to identify DR at an early stage to develop and implement effective management methods [10–13]. As a result, numerous methods are created to identify the DR lesions and analyze their level. To correctly classify DR, the difficult stage is to reliably retrieve the key characteristics from retinal images. Previously, Naive Bayes, Support Vector Machine and K-Nearest Neighbors were among the machine learning classifier algorithms used to categorize the photos. These common machine-learning techniques extract distinct handcrafted elements from the image itself to discover discriminative patterns [14–16]. The intricate structure of the pattern cannot be learned using conventional methods, and they frequently fail to model the fundamental structure of the aberration. To address this issue, in this paper an effective deep learning-based technique is utilized to retrieve important features of the image.
In addition, as compared to neural network models, the majority of these conventional techniques display poor generalization [17,18]. This limits the scope of these engineering methods’ usefulness in a therapeutic setting. Deep learning techniques are introduced as a means of overcoming the limitations of machine learning and have significantly improved methods for analyzing medical images [19,20]. Therefore, in this study, a hybrid deep and machine learning-based architecture is presented as a pre-test to aid clinical professionals by enhancing the testing procedure in cases of DR which reduces money and effort.
For this, in this paper, an effective LuNet and Refined Attention Pyramid Network (RAPNet) based lesion segmentation and feature extraction are applied. From the extracted features, the important features are selected by the Aquila Optimizer algorithm which improves the performance of the LightGBM classifier and categorized the fundus image into normal, mild, moderate, severe, and Proliferative diabetic retinopathy (PDR) classes.
The key contribution of this study is listed as follows,
• To achieve effective lesion segmentation, LuNet based segmentation technique is implemented.
• The proposed technique for detecting and classifying diabetic retinopathy makes advantage of the deep features of a Refined Attention Pyramid Network (RAPNet). Next, the extracted features are reduced and the optimal features are chosen using Aquila Optimizer (AO) algorithm
• To perform the successful DR grading, a LightGBM-based effective machine learning technique is implemented
• For the segmentation and grading of diabetic retinopathy on the three datasets, the suggested strategy performs better than the existing techniques.
The remainder of the article is structured as follows. Section 2 provides an overview of current techniques for DR detection using eye fundus pictures. The resources and procedures utilized for this classification are presented in Sections 3 and 4. Section 5 obtains the findings of the proposed methodology using various performance criteria and compares them with more recent methods for DR classification. The conclusions and suggestions for further research are reported in Section 6.
Several research activities and various techniques have been suggested for the automatic detection and grading of the DR over the last 20 years. Some of the works have been briefly discussed in this area.
For the automated diagnosis of DR, Bodapati et al. [21] suggested a gated-attention mechanism-based composite deep neural network architecture. Color fundus retinal pictures were represented using feature descriptors that were derived from numerous pre-trained deep Convolutional Neural Networks (CNNs). To obtain the condensed versions of these representations with minimal information loss, spatial pooling techniques were implemented. Additionally, the technique incorporates gated attention blocks that enable it to focus less on the non-lesion regions and more on the lesion portions of the retinal pictures.
Elsharkawy et al. [22] employed a structural 3D retinal scans-based automatic technique to identify the DR. This technique employed an adaptive, appearance-based approach to accurately segment the retinal layers of the input image utilizing prior shape knowledge. Following segmentation, new texture characteristics were retrieved for DR diagnosis from the segmented layers. The 2nd-order reflectivity for each layer was extracted using the Markov-Gibbs random field model. They used cumulative distribution function descriptors to visualize the characteristics produced from the extracted images. To accomplish layer-by-layer classification, the extracted Gibbs energy feature for each layer was supplied into an artificial neural network. The categorization outputs for all twelve levels are then pooled using a majority vote approach for overall issue identification.
By utilizing the transfer learning approach, Jabbar et al. [23] provided a structure for the automatic detection and categorization of DR. To enhance an image’s visibility, several preprocessing techniques such as non-local mean denoising, interpolation image scaling, and weighted Gaussian blur were used. The classification of DR into PDR, severe, moderate, mild, and normal classifications was done after preprocessing using a transfer learning-based VGGNet architecture. The public dataset from Kaggle EyePACS was used for the experimental experiments. Various performance metrics such as the area under the curve, sensitivity, specificity, and accuracy were used to measure the method’s efficacy.
Yi et al. [24] performed an EfficientNet-based DR classification task with several pre-processing steps to overcome the problem of imbalanced data on APTOS the network called RA-EfficientNet was proposed to extract additional valid image features. This network adds a residual attention component to EfficientNet to retrieve more features and address the issue of subtle changes among lesions. To get around the small sample size issue of DR, EfficientNet was already trained by transfer learning technique on the ImageNet dataset. Finally, binary and multi-class classifications were conducted based on the retrieved characteristics and evaluated the efficiency of the technique in terms of several performance metrics.
A technique to identify DR was introduced by Nahiduzzaman et al. [25] for binary and multiclass classification. First, Ben Graham’s method has been used to pre-process DR pictures. After that, pre-processed images with less noise and more distinct features were obtained by contrast limited adaptive histogram equalization technique. To further streamline the input characteristics for classifiers, a hybrid singular value decomposition-the convolutional neural network was created. Then the Extreme Learning Machine-based method is used to perform classification which reduces the cost of training time. The f1-score, recall, precision, and accuracy-based metrics show the suggested scheme’s ability for DR diagnosis.
According to ResNet-18 and GoogleNet architectures, Butt et al. [26] provide a hybrid strategy based on transfer learning. The input images are scaled and normalized during preprocessing to meet input image specifications for the ResNet-18 and GoogleNet Models. The input fundus images are fed through these models to extract 1000 features from the images. Following this procedure, a composite feature set with 2000 features was created by combining the feature vectors generated by the ResNet-18 and GoogleNet models. When employing different methods for DR classification, this feature set is supplied to several classifiers, and the results are compared.
E-DenseNet-based hybrid deep learning method was presented by AbdelMaksoud et al. [27] for DR classification. They combined transfer learning-based DenseNet and EyeNet models for classification. The authors modified the conventional EyeNet by adding dense blocks and created the hybrid E-DensNet framework. In terms of computing time, quadratic kappa score, dice similarity coefficient, specificity, sensitivity, and accuracy the results of the suggested method were obtained and compared with existing techniques.
In this research work, three datasets are considered for the proposed method’s evaluation. They are discussed in this section.
Messidor dataset: This dataset contains 1200 RGB fundus images. The photographs were captured in 8 bits color planes with 2304 × 1536, 2240 × 1488, or 1440 × 960 pixels. Three ophthalmologic departments acquired the fundus images for this dataset. It consists of four classes: 0, 1, 2, and 3, where class 0 denotes no diabetic retinopathy or normal while classes 1, 2, and 3 denote mild, moderate, and severe levels.
APTOS 2019 dataset: The images available in this dataset are provided by Aravind Eye Hospital, India. The dataset contains 1928 test samples and 3662 training samples in total. The sizes of the photographs were made accessible in a range, including 3216 × 2136, 819 × 614, and 2416 × 1736. The images in this dataset are categorized into five classes. They are normal, mild, moderate, severe, and PDR.
IDRiD dataset: This dataset has 516 fundus photographs that were taken from the eye hospital located in Nanded, Maharashtra, India. They are JPEG files. The photos are divided into 103 test and 413 training images. They have a substantial resolution of (4288\times 2848\). A Kowa VX-10 alpha digital fundus camera with a (50°) FOV was used to take each image at a distance of 39 mm from the eye. Near the macula, the camera was centered.
The methodology used in the multi-stage classification of DR using the proposed approach is illustrated in Fig. 1. This work contains five stages. They are image pre-processing, segmentation, feature extraction, feature selection, and classification. First, the input picture is pre-processed, and then LuNet based segmentation network is implemented to segment the Microaneurysms, Haemorrhage, and soft and hard exudates lesions from the image. Afterward, the features are extracted to perform the classification task using the RAPNet-based technique. Then, among the extracted features, the Aquila optimizer selects the important features and a LightGBM-based classification task is conducted.
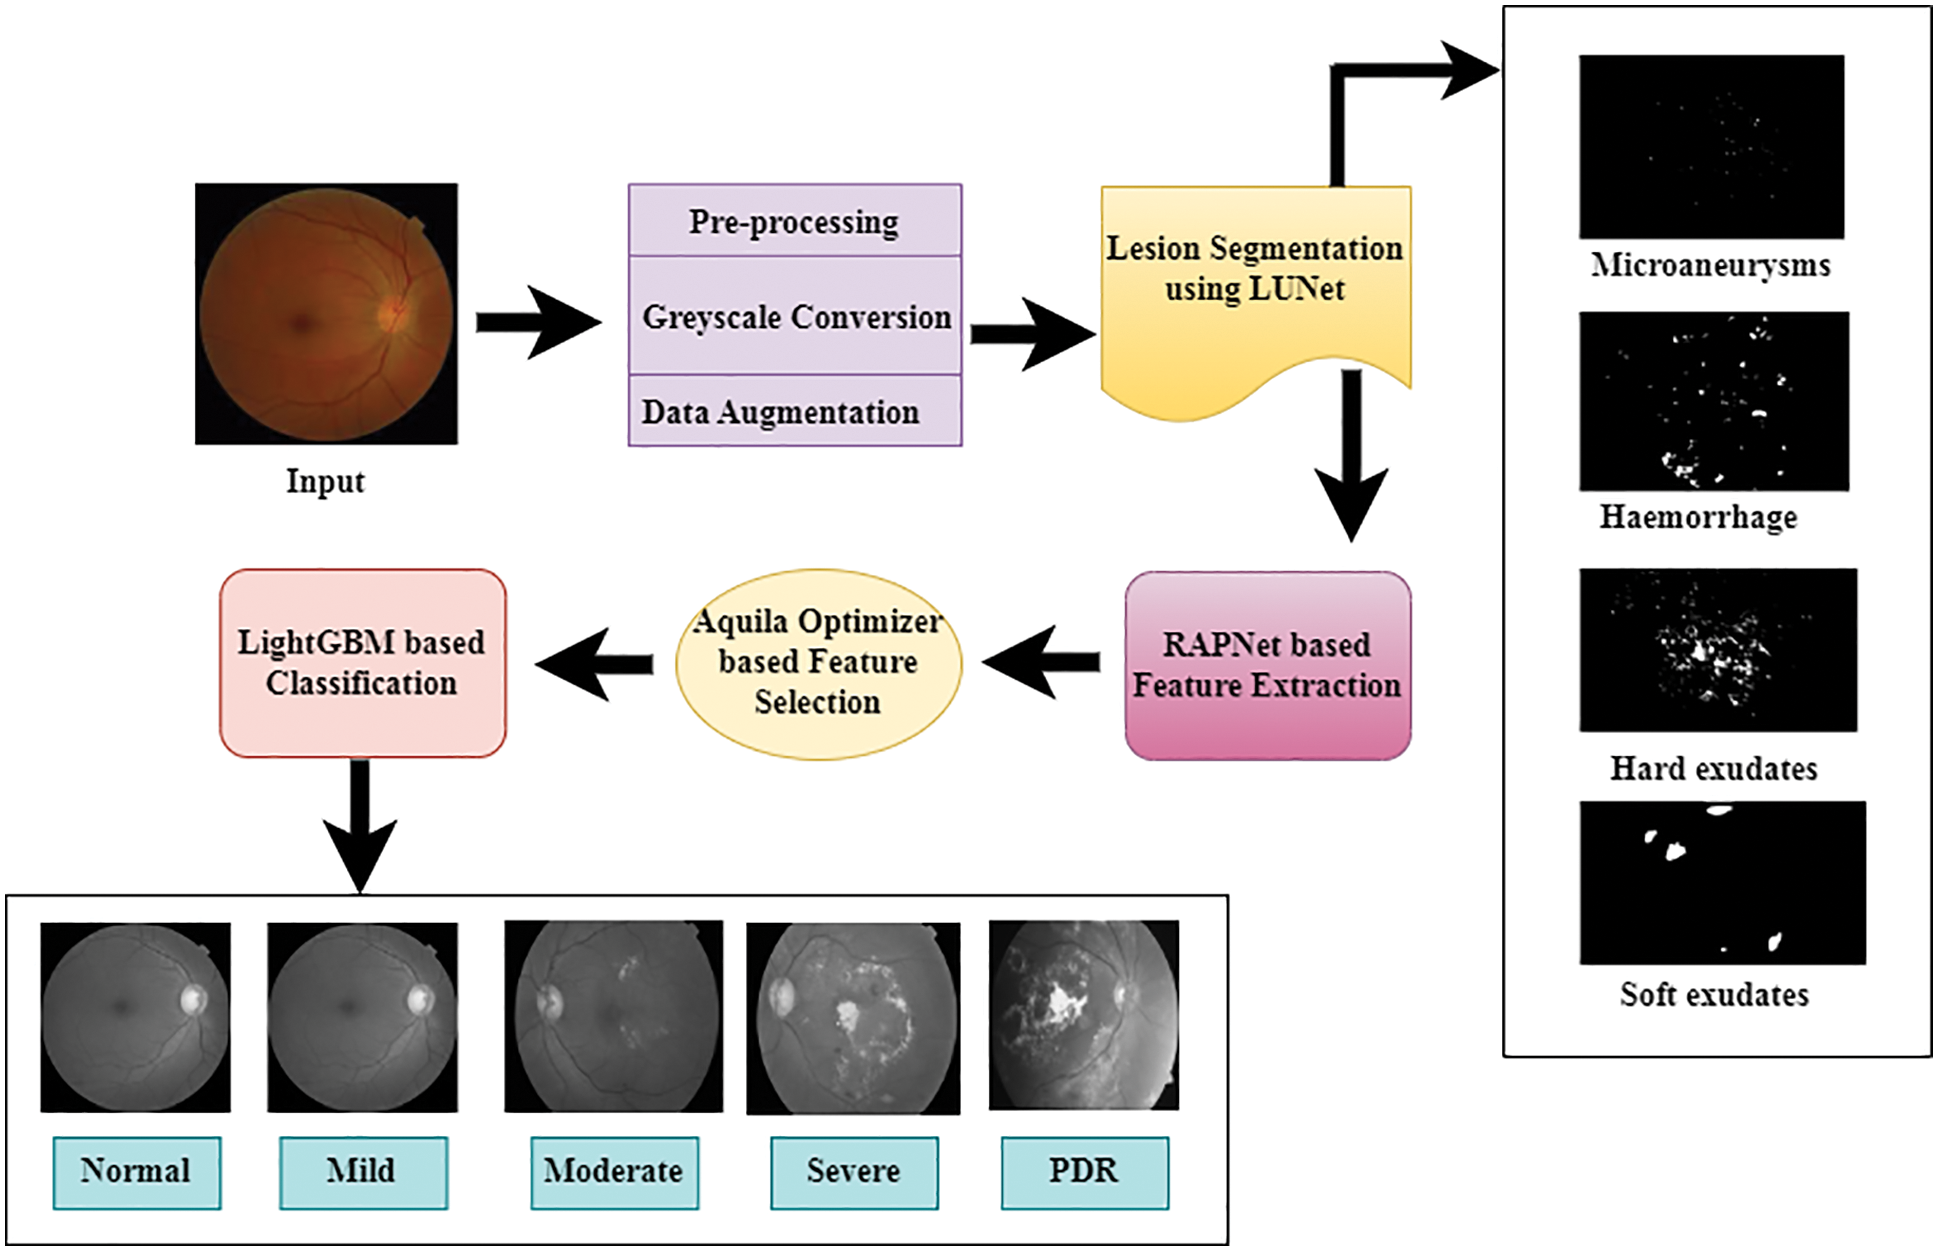
Figure 1: System architecture of proposed methodology
The first phase of the proposed framework is preprocessing. To achieve the best outcomes, RGB to grey conversion is done in this phase. The images obtained from the dataset are in different sizes. Therefore, the images are resized into 521 × 521 size. To avoid overfitting and balance the classes in the dataset, the data augmentation is performed with rotation, shear, horizontal flip, and vertical flip operations.
The LuNet network receives pre-processed images for lesion segmentation. LuNet is a more advanced version of CNN and a hybrid version of LeNet and UNet with numerous modifications. This network contains an encoder and decoder section. Each section contains 4 layers. In four layers, the last two layers are fully connected layers with a sigmoid activation function. The input image was obtained by this network’s first layer, which consists of one max pooling layer and two ConvNet with a 32-bit 3 × 3-filter size. Similarly, two ConvNet are included in the second layer of the LU-Net, along with one pooling layer with a 3 × 3 filter size of 64 bits. These two layers are working on the downsampling process. The retrieved features in this technique are doubled with each downsampling. The ‘eLU’ activation function [28] is used in each layer of this network which is stated in the following equation because it does not reject negative pixels.
Here, the term α is typically set to 1 which is constant. From the equation, it is clear that ELU and ReLu are virtually identical in terms of positive inputs. But the ELU function produces a negative output that is controlled by an exponent function when the input is negative.
The upsampled features in the encoder section are forwarded to the decoder section for downsampling operation. This section contains 2 transpose layers. The first transpose layer has a 2 × 2 filter with 64-bit size and stride 2. The second transpose layer has a 2 × 2 filter with a 32-bit size and stride 2. Each transpose layer contains two ConvNet with 3 × 3 sizes. Finally, two fully connected layers in the LuNet with the sigmoid activation function are used to produce the lesion segmentation map based on the features.
After the lesion segmentation, the feature extraction on the segmented image is conducted using the Refined Attention Pyramid Network (RAPNet). It may combine higher-layer feature maps with lower-layer feature maps to create multi-scale feature maps which provide very deep features of the image. This network is based on Encoder and decoder structure. This network contains five stages. The first three stages contain 1 × 1 convolution layers and another two stages contain atrous convolution with 3 × 3 convolution layers. Between the two convolution layers, the ReLU layer is applied to create a non-linear representation to retrieve low-layer detailed data.
In all residual blocks, the deconvolution process is introduced to upsample the high-level feature maps. Because all the feature maps are of the same size to conduct the fusion operation. After that, the lateral connection is provided with the convolutional block attention module (CBAM), to adjust the feature maps in all layers. This can decrease false detection and increase the precision of feature extraction.
In the encoder section, the features from the image are collected using the pyramid pooling module which is included in the final residual block of the conv5 stage. It performs a global average pooling function and four-level pyramids with 1 × 1, 2 × 2, 3 × 3, and 6 × 6 bin sizes are included in this layer. Then finally tuned feature maps are sent to the corresponding decoding layer for the concatenation operation. All the encoding layers are connected with the corresponding decoding layer. Finally, the obtained feature maps are denoted as P2, P3, P4, and P5.
Additionally, we enhance the feature pyramid structure and create the fusion feature map P2 by concatenating P3, P4, and P5 with a dense link. In this manner, multiscale building extraction feature maps with rich semantic and spatial information are acquired. Particularly, this network has chosen the operation of concatenation rather than element-wise addition using lateral connections and dense connections between upsampled feature maps. Due to this, the final fused feature map P2 is obtained, which has the same spatial size as the original input image.
The extracted features from the RAPNet are forwarded to Aquila Optimizer (AO) [29] to select the most significant features. This algorithm creates an initial population x of Agent N. if the AO identifies the best solution, then the agents are updated in the current population based on the solution. Eq. (2) creates the initial population X, which is made up of N solutions.
In the above equation, the amount of features is denoted by D, UB and LB denote the lower and upper boundaries of the search space, and the random vector with features is denoted by rand (1, D).
Updating Population
In the population updating stage, the populations are changed into Boolean value BXi which is expressed in the following equation.
After the Boolean conversion, the features containing zero values are eliminated from the feature set. Due to this, irrelevant features are removed from the feature set. Afterward, the fitness of each feature is computed by the following equations.
Here, to maintain the balance between the
Terminal Criteria
The stopping conditions are examined at this stage, and if they are not met, the updated stage is repeated. Otherwise, Xb is used as the output of the chosen features and the learning process is stopped.
In this section, LightGBM-based DR classification is conducted based on the selected feature set. It is distributed gradient boosting tree algorithm and is frequently used in classification regression and other issues due to its excellent accuracy low memory usage, and quick performance. Compared to other tree-boosting algorithms, the lightGBM divides the tree leaf-wise based on its best fit. Other tree-boosting algorithms are dividing the tree level-wise or depth-wise. Therefore, the loss of the algorithm is decreased compared to other level-wise algorithms when growing on the same leaf. Hence, the accuracy of the algorithm is also increased compared to other boosting algorithms.
The GOSS (Gradient-based One-Side Sampling) algorithm is the first component of the LightGBM algorithm. GOSS successfully balances precision and sample size for the decision tree in LightGBM. First, the training examples’ absolute gradient values are sorted in descending order, and the set ‘A’ data whose gradient value is less than 100% is chosen. Then, a subset
In the ‘A’ subgroup whose values are fewer or equal to m is represented by Al, whereas which elements are more than m is represented by Ar. Br and Bl are also created based on set ‘B’. Br, Ar, Bl, and Al, are defined as follows:
First, the input features are converted into the histogram form with the same size as the input. Afterward, the leaf node of the histogram is constructed. The created histogram is capable of identifying the ideal split point. The leaf-wise growth strategy, which can only be used up to the depth of the tree’s construction, is used in the next stage. The performances might accelerate even more using this method than they did with GBDT. It's important to not overlook the LightGBM’s last phase. Parallel processing can increase performance even more without sacrificing accuracy.
The proposed system was constructed using Tensor Flow’s Keras framework and the Python language. All tests were conducted using a 2 GB NVIDIA GeForce 930 mx graphics card. Eighty percent of the datasets were used for training, while twenty percent were used for testing. In LightGBM, the values of the hyperparameters are minimum no of leaves = 30, Maximum tree depth = 7, maximum no. of leaves = 105, and no. of trees = 300. In the segmentation network, Adam served as the optimizer for training, the loss function is cross-entropy loss and the epochs are 100. The dropout rate and initial learning rate are 0.5 and 0.001 respectively. For performance assessment, ten runs are carried out to report the results.
Once the network has finished the training, the accuracy measure indicates the percentage of accurate predictions. It is shown together with the accuracy curve, which illustrates the development of the suggested network. The training and testing accuracy and loss of the segmentation network are given in Figs. 2a and 2b respectively. For classification, the testing and training accuracy and loss are given in Figs. 3a and 3b respectively.
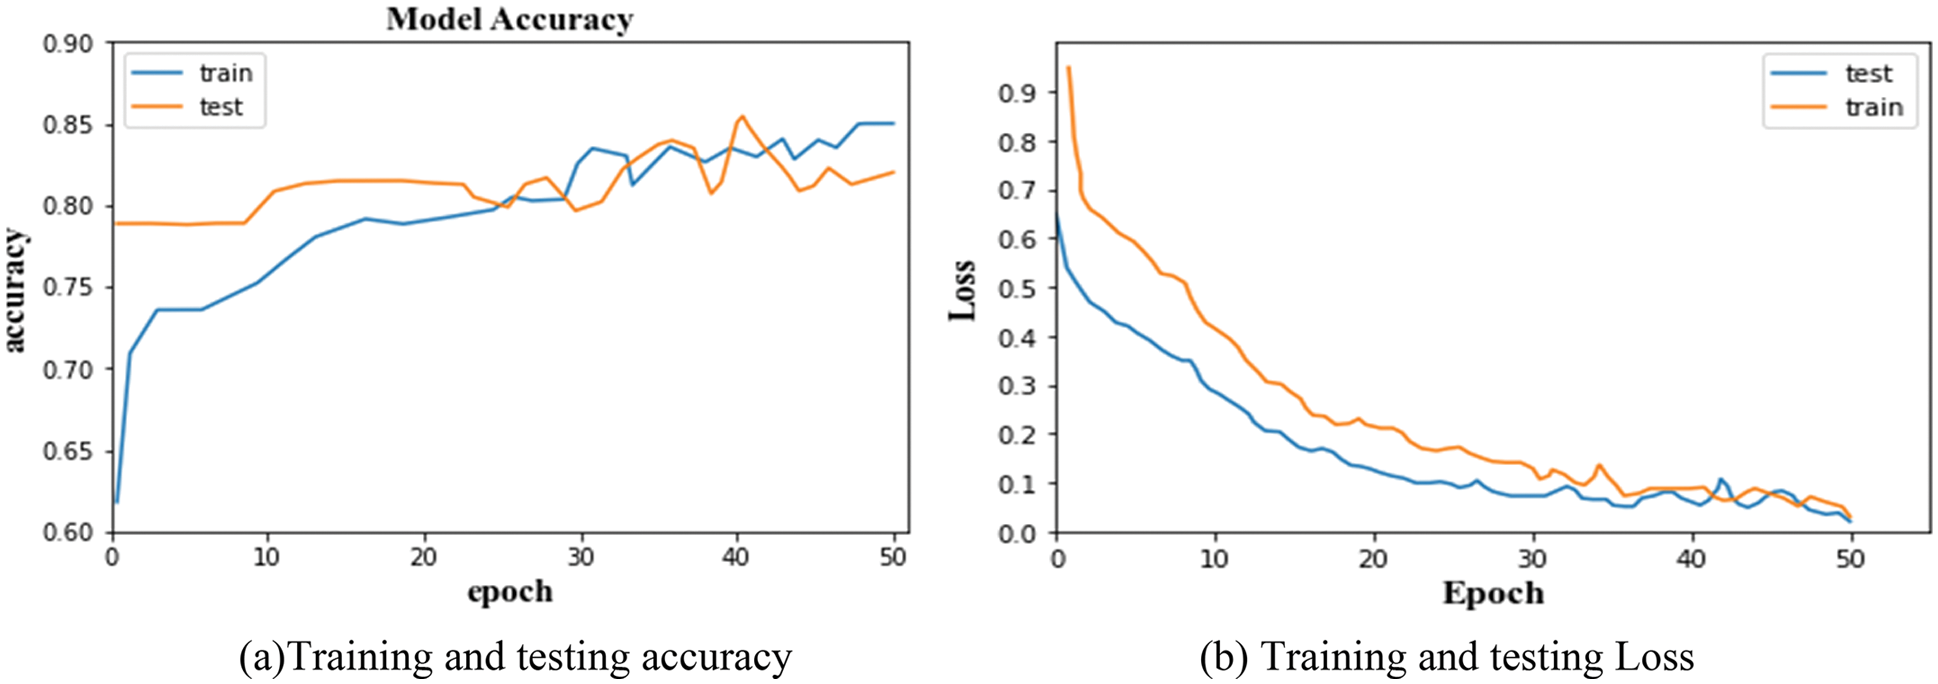
Figure 2: (a) Training and testing accuracy, (b) Training and testing loss
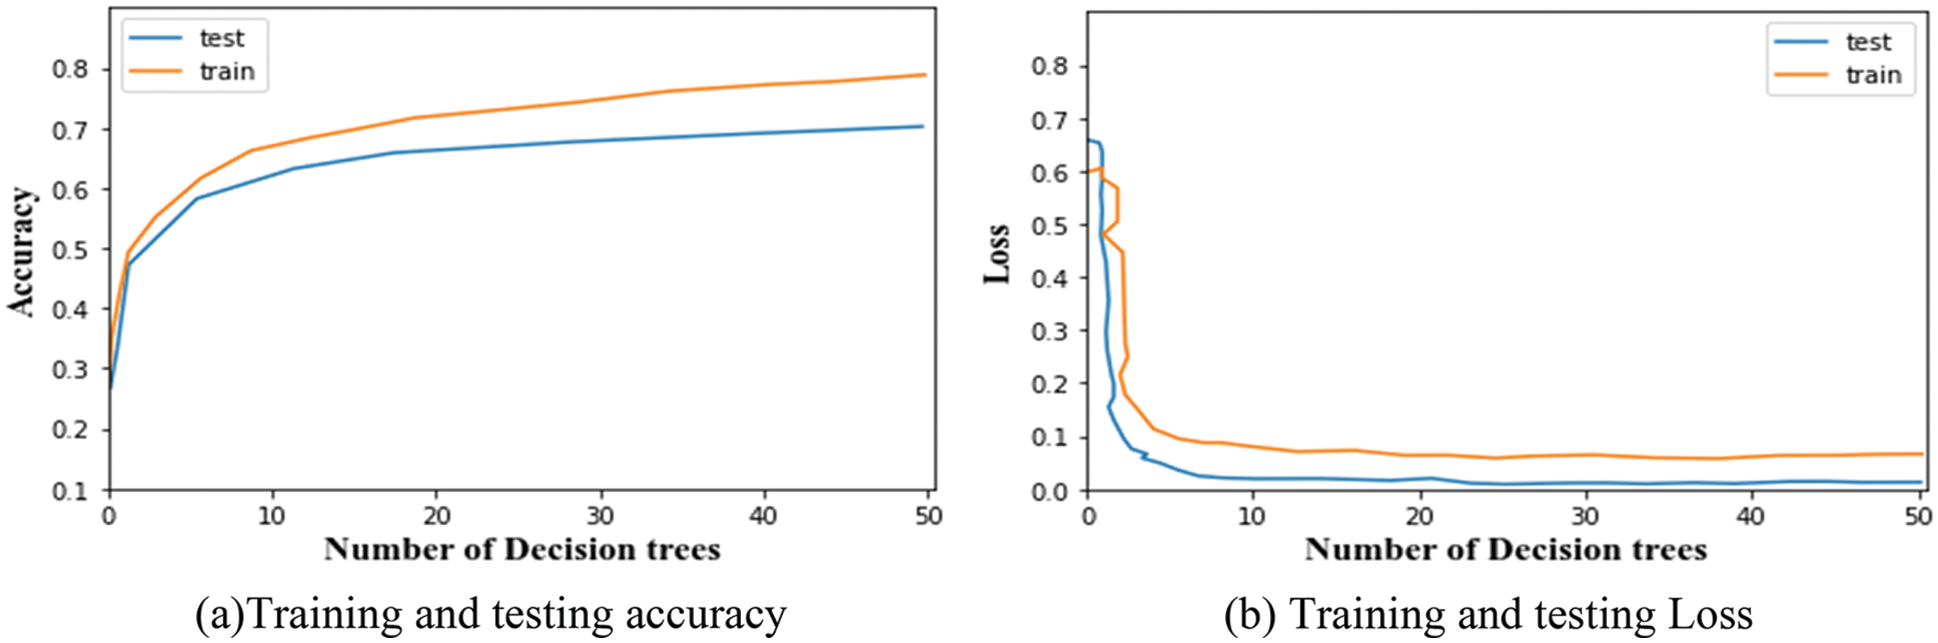
Figure 3: (a) Training and testing accuracy, (b) Training and testing loss
The accuracy and error loss percentage demonstrates considerable improvement throughout the training and testing process, starting at an early level. From the graphs, it is observed that the training and testing accuracy of LuNet is 81.28% and 84.93%. And, the training and testing loss of the segmented network is 0.005 and 0.008. Similarly, the training and testing accuracy of the proposed classifier is 79.71% and 69.83%. And the training and testing loss of the classifier is 0.002 and 0.12. This training and testing analysis demonstrates how the suggested model was able to segment data well and self-learn features based on the dataset provided to classify the DR.
For segmentation, three performance metrics are utilized for evaluation. They are Discrete Similarity Coefficients (DSC), Positive Predicted Value (PPV), and Sensitivity which are expressed in the following equations.
Here, DSC evaluates how closely predictions match actual results; SEN evaluates the rate of true positives (TP). PPV is the ratio of accurately estimated positive outcomes to both correctly and incorrectly predicted positive outcomes.
Fig. 4, provides some illustrations of four different lesions named Microaneurysms, Haemorrhages, soft exudates, and hard exudates, so that we can see how our method can produce more accurate findings without adding extra artifacts and these images are closer to the ground truth images. Furthermore, it is observed that the suggested segmentation technique can maintain the details of small-scale MA and HE regions in addition to segmenting large-scale EX and SE regions. Because of its stability, it can successfully resist disturbance from noise, distortions, and reflecting vessels. The suggested method can accurately separate lesions of varied sizes and shapes from complex fundus images while overcoming the interference of similar tissues like tangled blood arteries and optic discs and other lesion noises. Additionally, it can keep the outline features of EX and MA more effectively. In the image, the segmented lesions are displayed in white color pixels considered as ROI appearing on black background. These ROI parts (lesions) are segmented by the LuNet-based segmentation network. Then, the segmented lesions are further processed by the RAPNet to extract the features from the lesions. The lesion segmentation result of the proposed approach is given in Table 1.
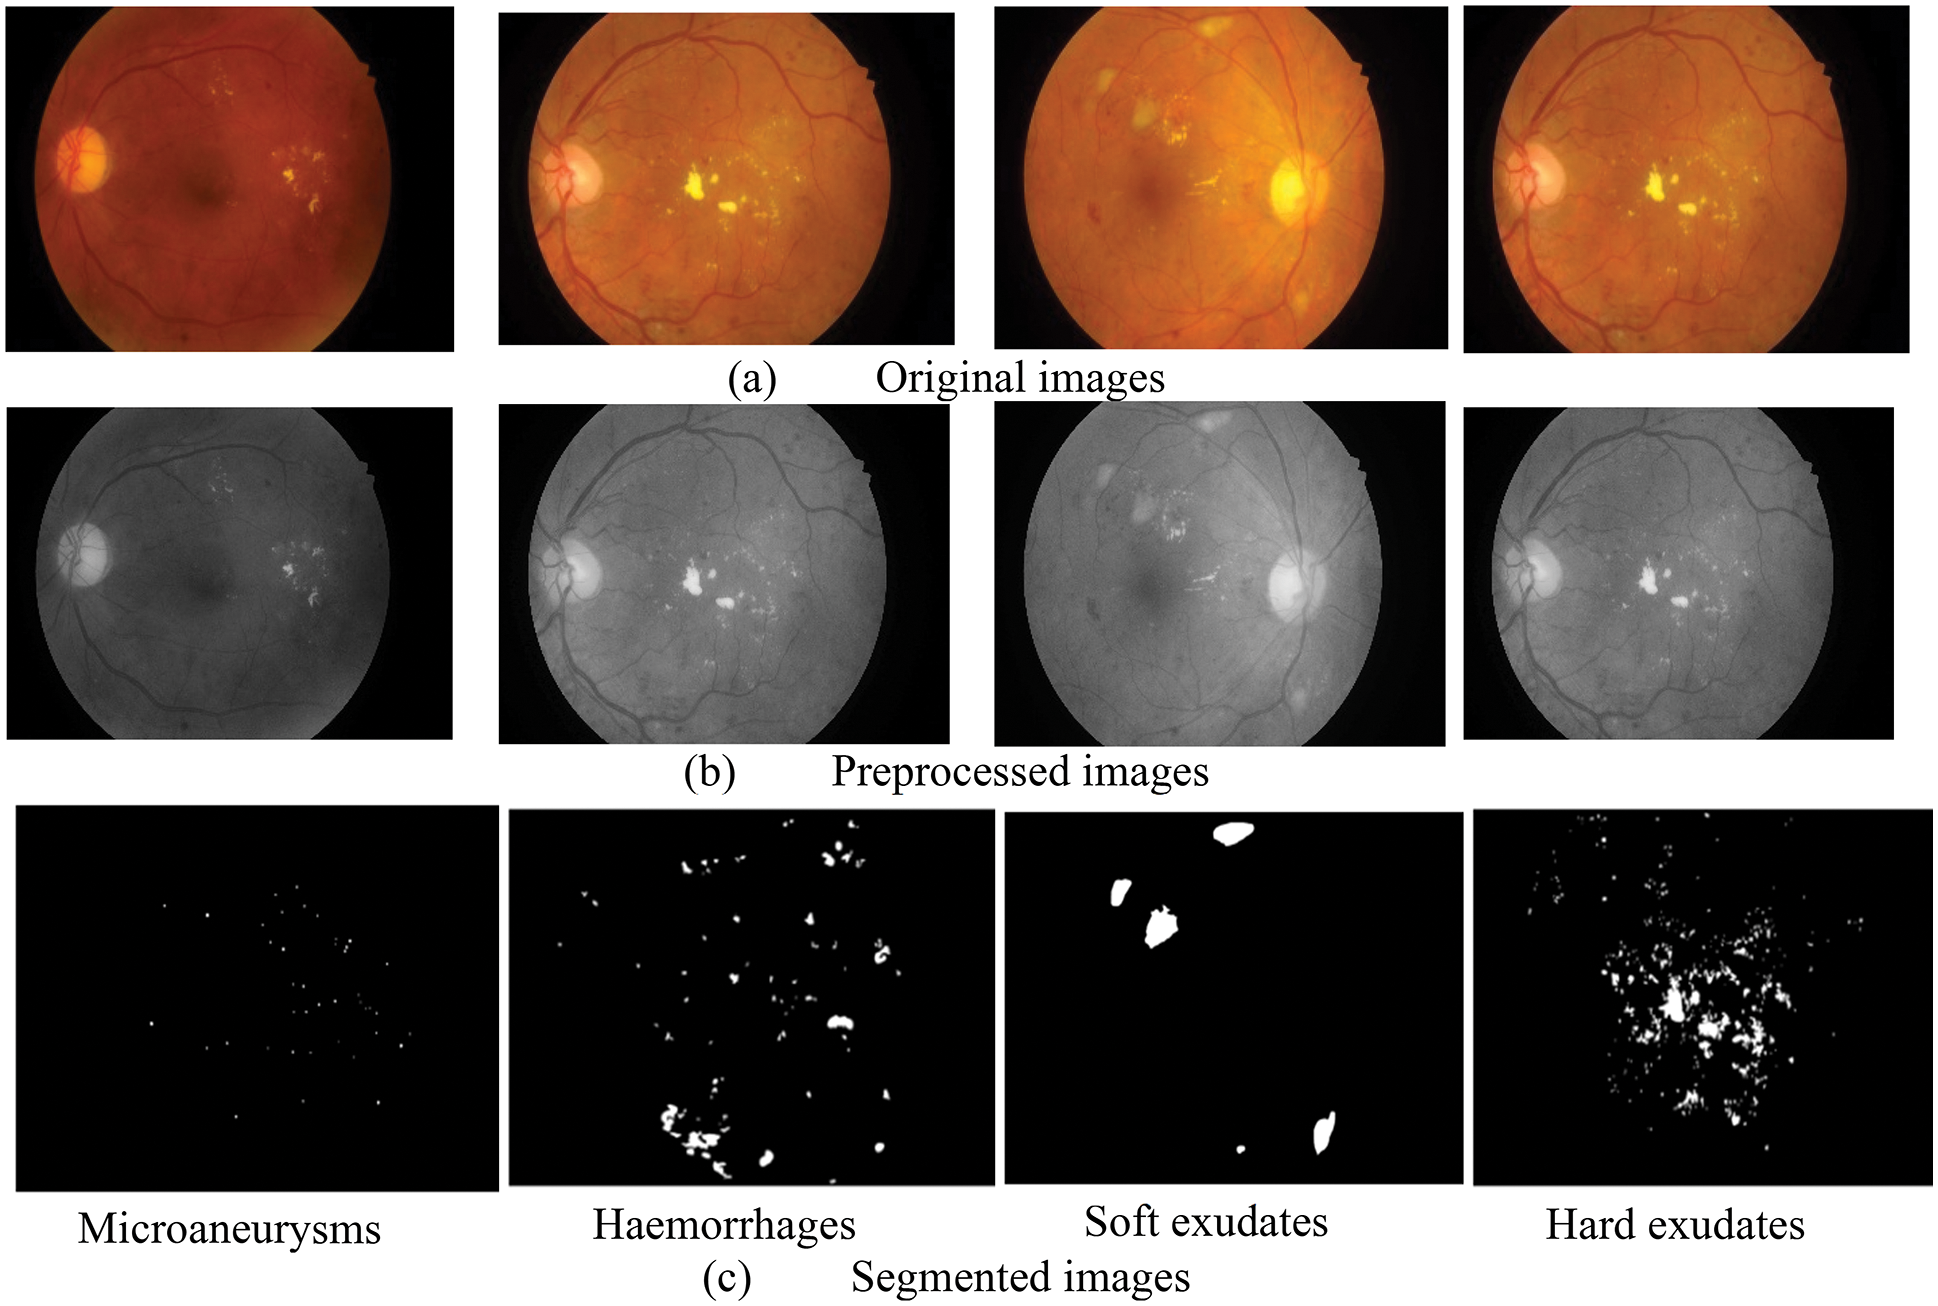
Figure 4: Outcome of segmented images (a) original images, (b) pre-processed images, (c) segmented images
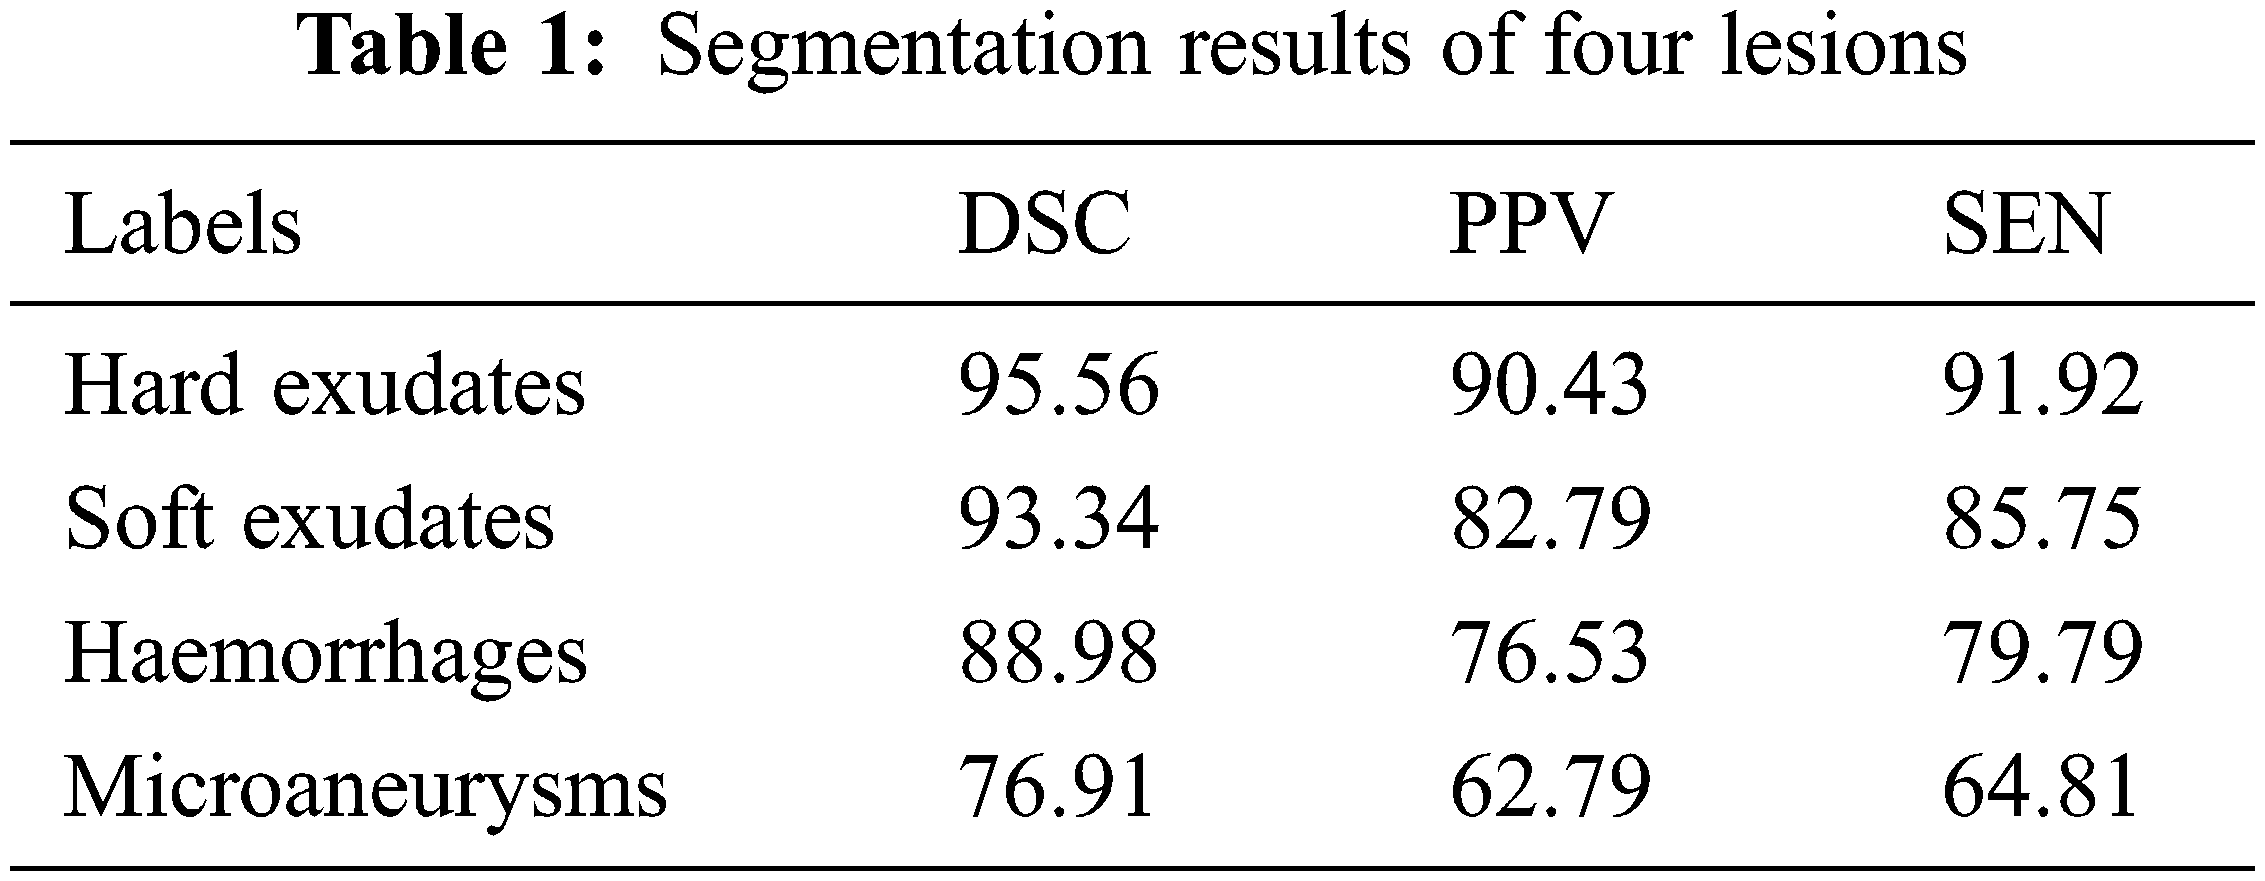
It is evident from the images and table that segmenting hard exudates is a simpler task, whereas segmenting microaneurysms is the hardest assignment. Low sensitivity is a frequent issue with the DR lesion segmentation task. However, the proposed approach provides good sensitive results for all classes. Having classifiers with high sensitivity is equally important to the study of true positive classifications. It is clear from Table 1 that DSCs are superior for all types of lesions. When compared to true positives, PPVs provide more information about the issue of false positive classifications. In terms of PPV, Microaneurysms achieve a very low value compared to all other types (60.79). The graphical representation of Table 1 is given in Fig. 5.
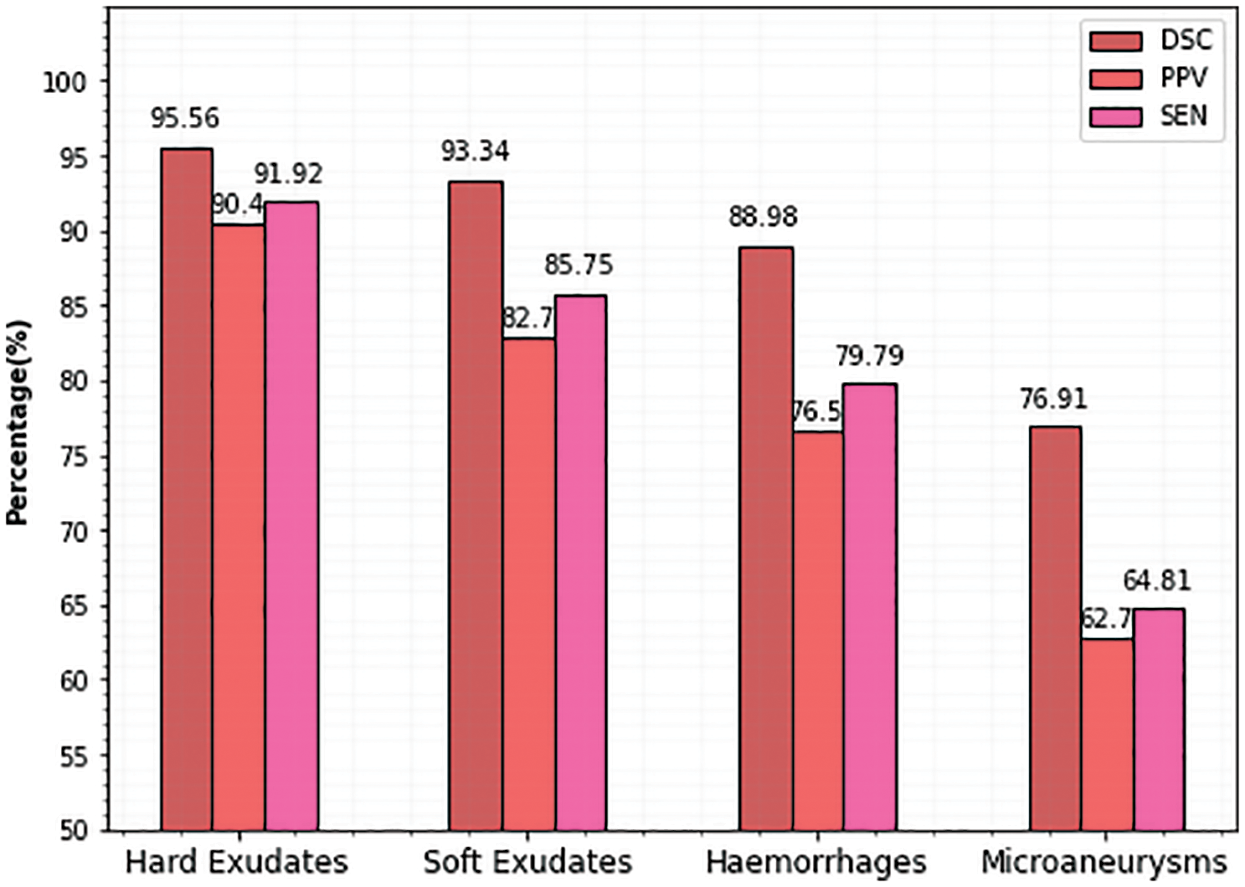
Figure 5: Comparison of proposed lesion segmentation
To measure the classification performance of the study, the metrics sensitivity, specificity, accuracy, and F1-score are taken into account which is explained in the following equations. The model’s accuracy is computed by dividing the number of labels that were accurately categorized by the total number of images in each class.
Here, FN denotes “false negative cases”, FP denotes “false positive instances” TN denotes “true negative cases” and TP stands for “true cases”.
The confusion matrix is the key information needed in the evaluation of a model. Using the related confusion matrices and the basic equations given above, the effectiveness of the classifier and performance metrics are further determined. The confusion matrix of the proposed classifier for the Messidor, APTSO, and IDRiD datasets is shown in Figs. 6–8.
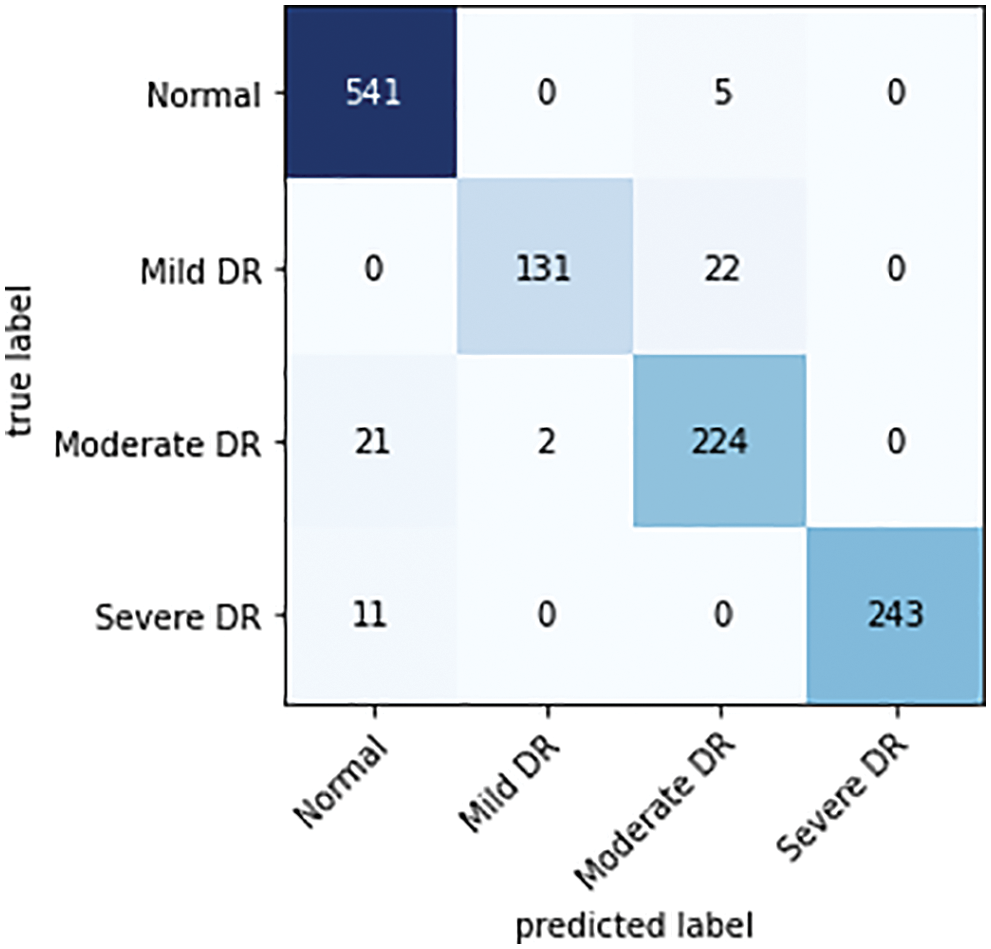
Figure 6: Confusion matrix of a proposed classifier on the Messidor dataset
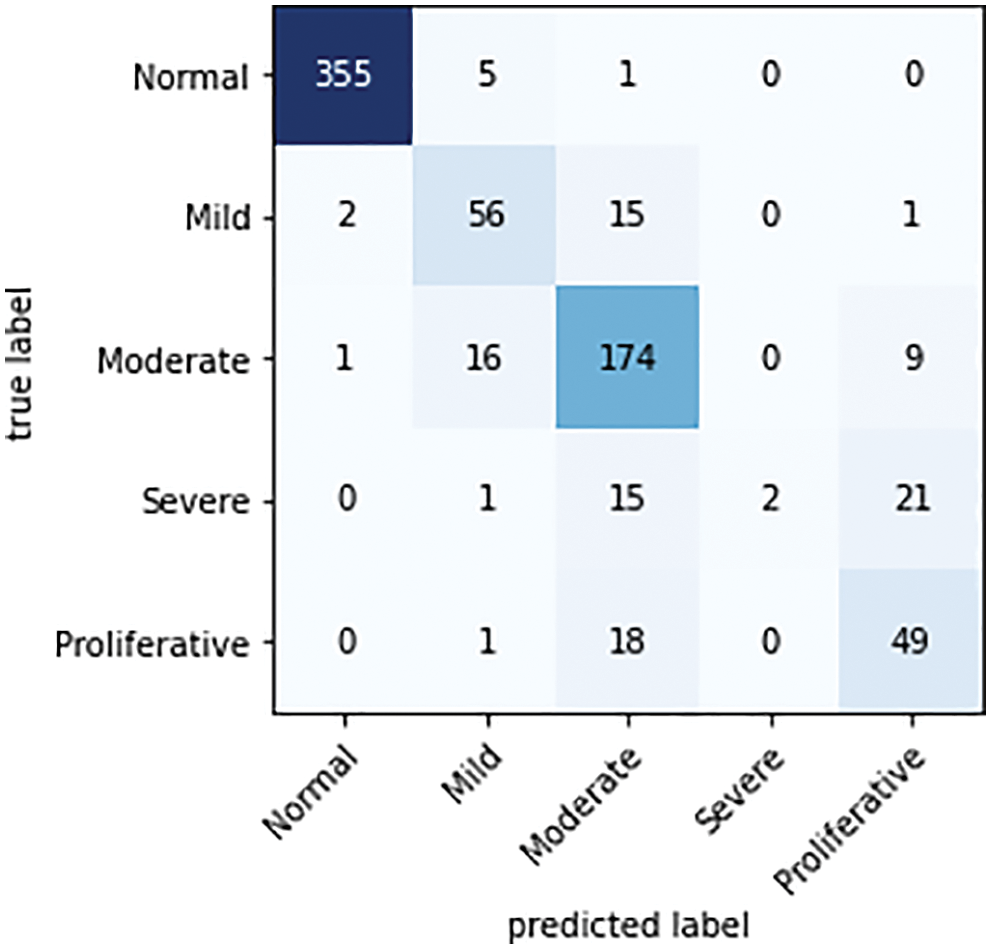
Figure 7: Confusion matrix of the proposed classifier on the APTSO dataset
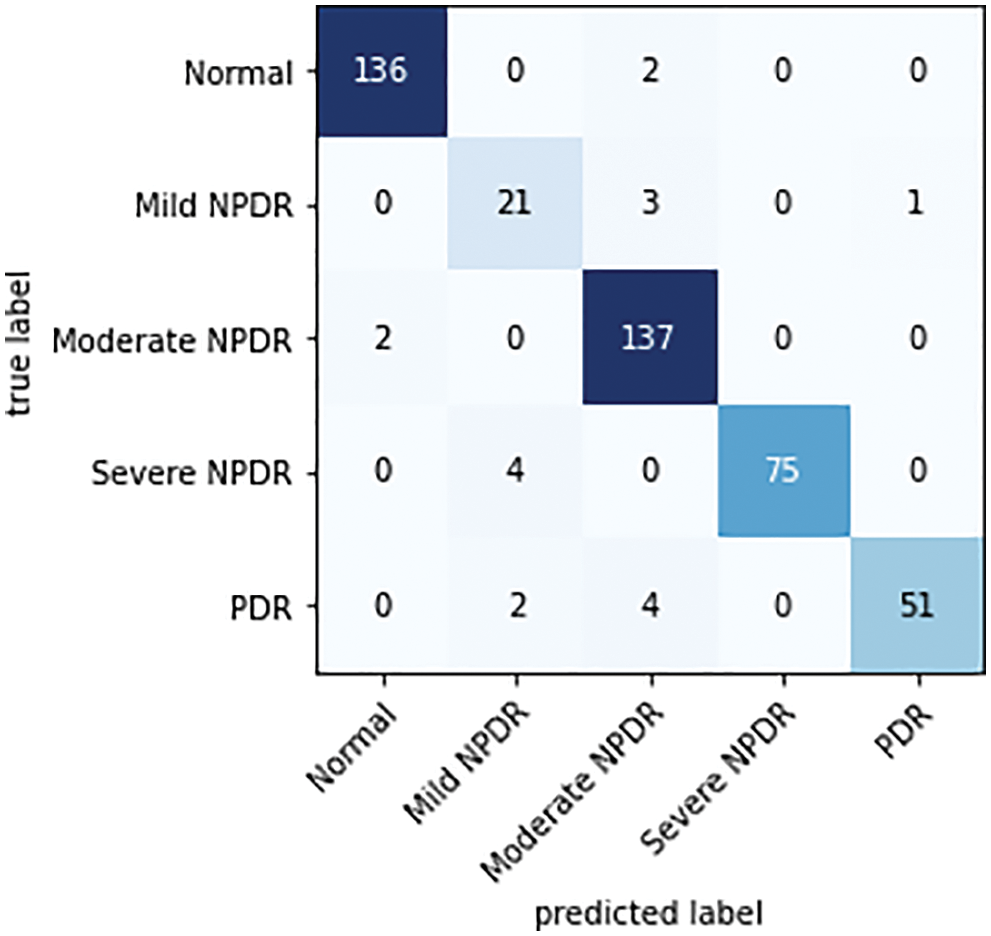
Figure 8: Confusion matrix of the proposed classifier on the IDRiD dataset
There are as many rows and columns in the confusion matrix for the multi-class classification problem as there are classes in the dataset. The primary diagonal elements show the appropriately categorized cases. For each grade level of TP, TN, FP, and FN, observations are made based on the confusion matrix.
While analyzing the confusion matrices, most of the classes are correctly predicted for three datasets. It describes the classification capacity of the proposed approach. To further analyze the efficiency of the proposed approach the recall, specificity, precision, and accuracy of the proposed method were computed individually for all three datasets. The classification results of all the datasets for each class are given in Table 2 and Figs. 9–11 in graphical form.
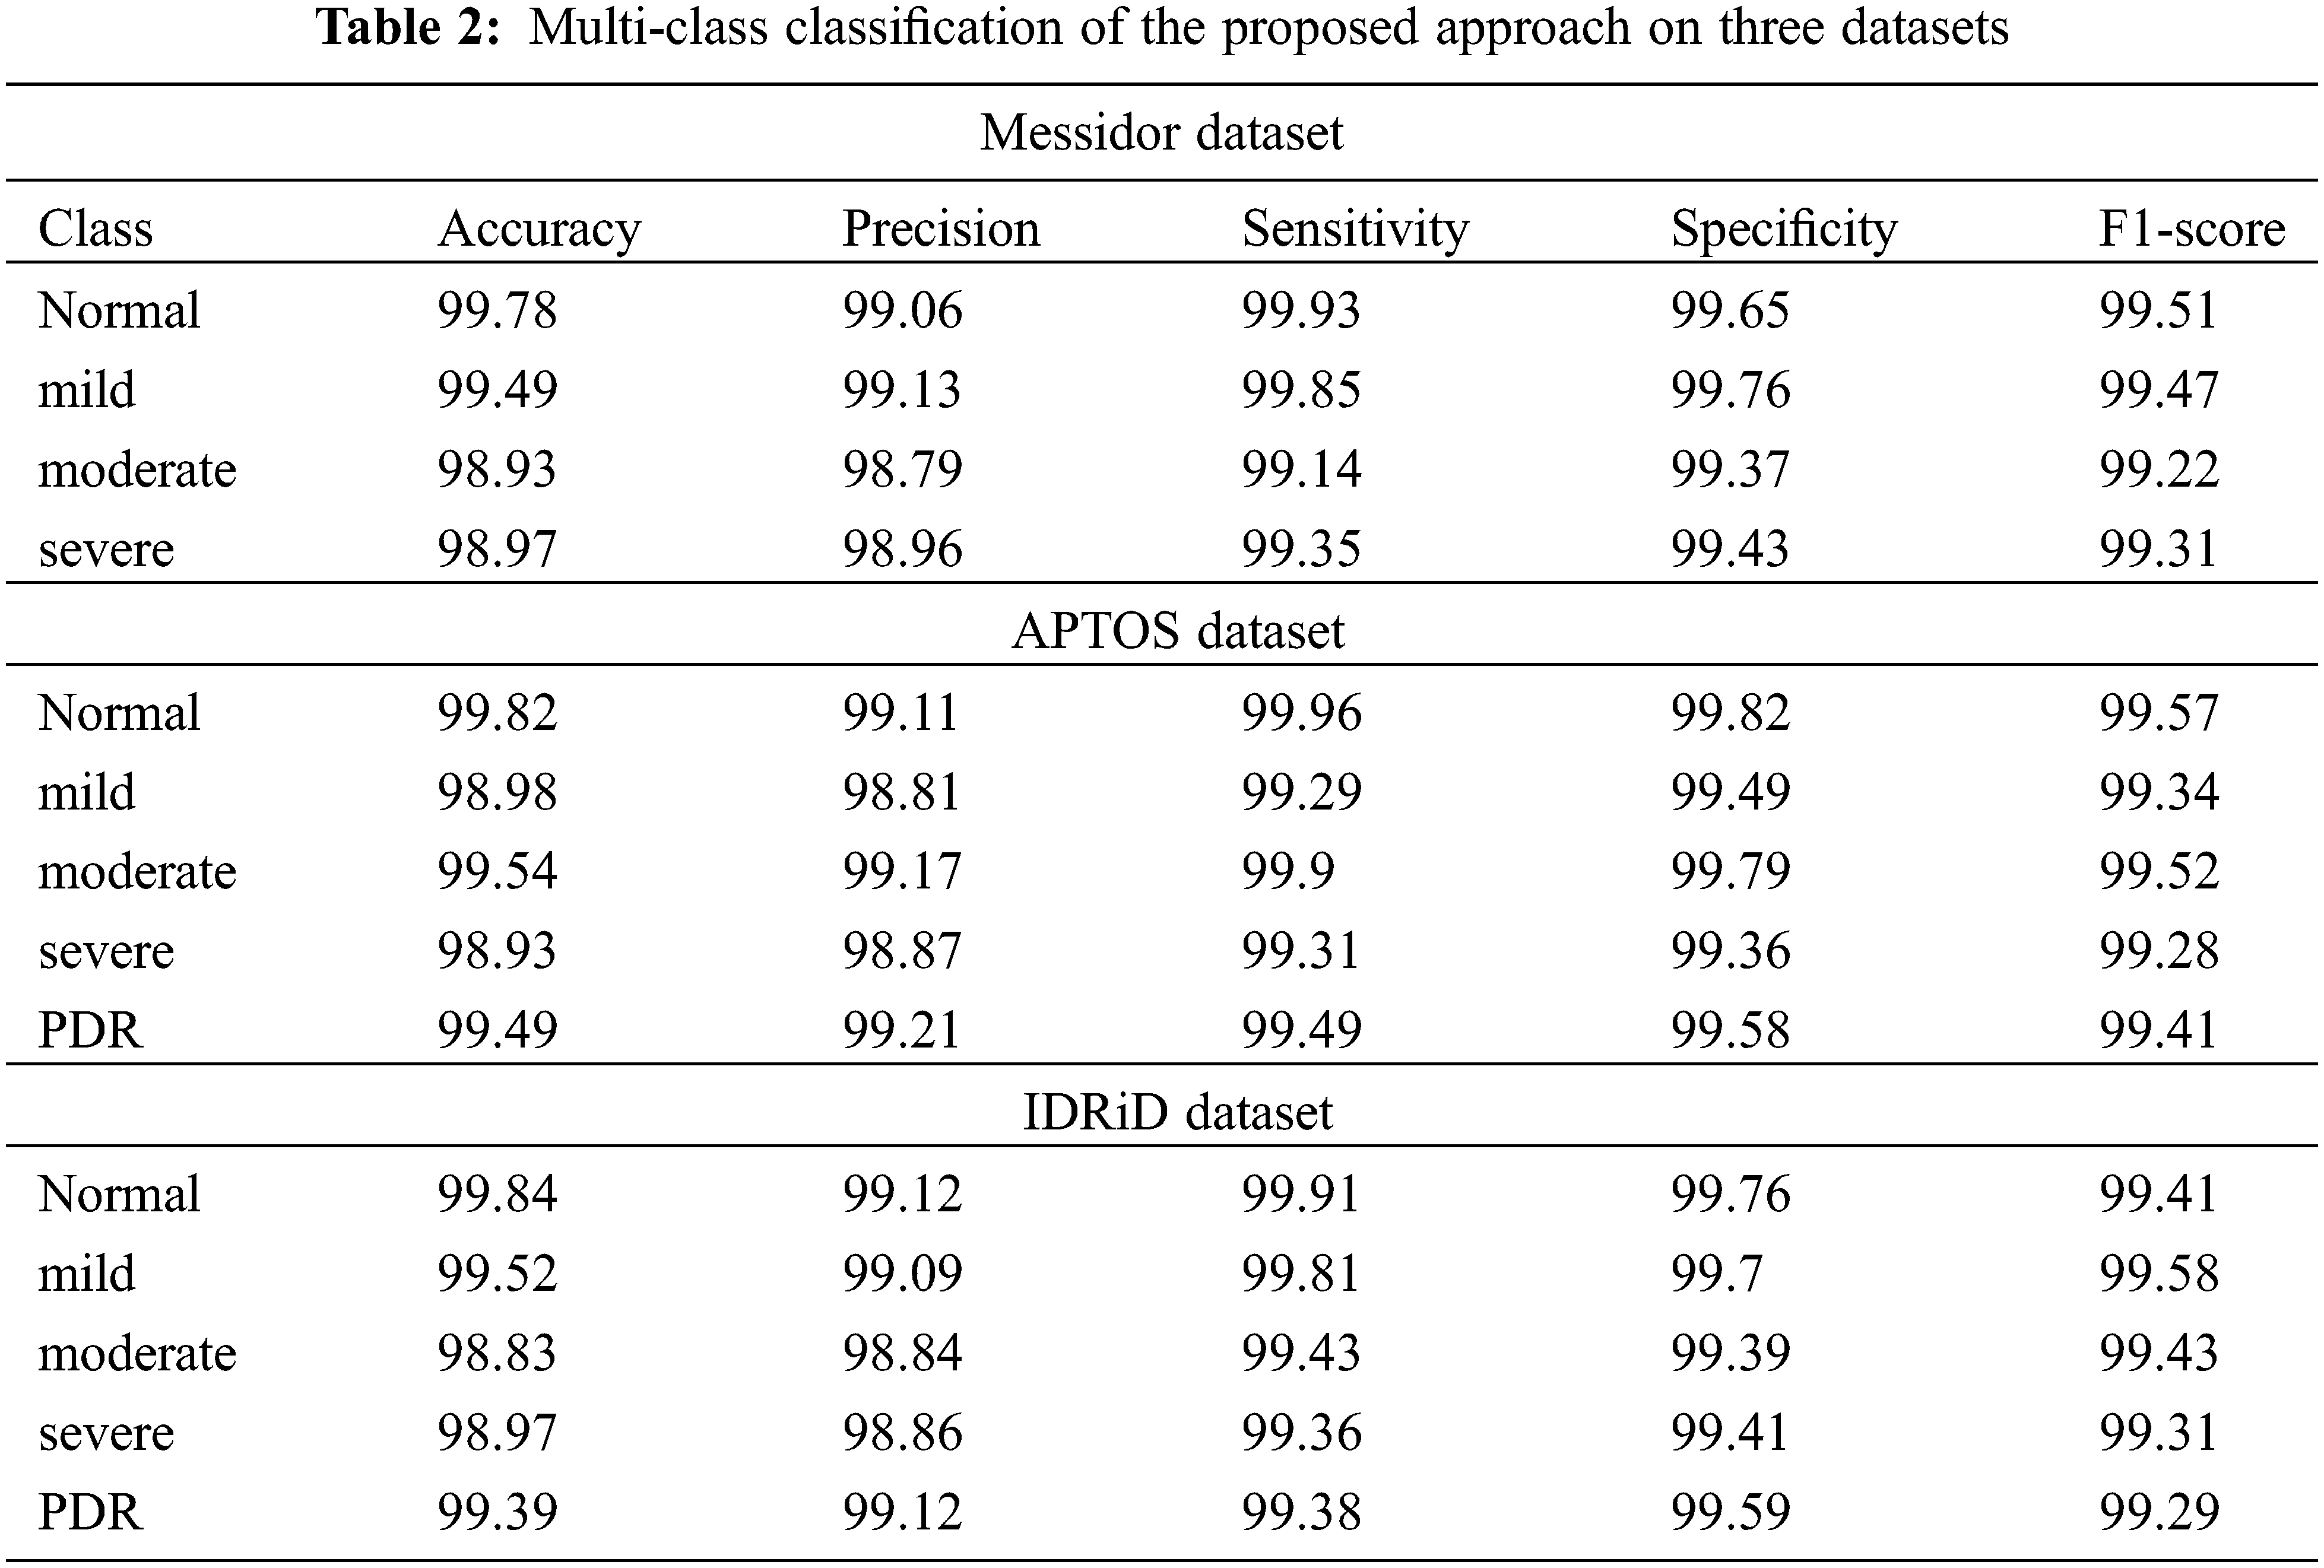
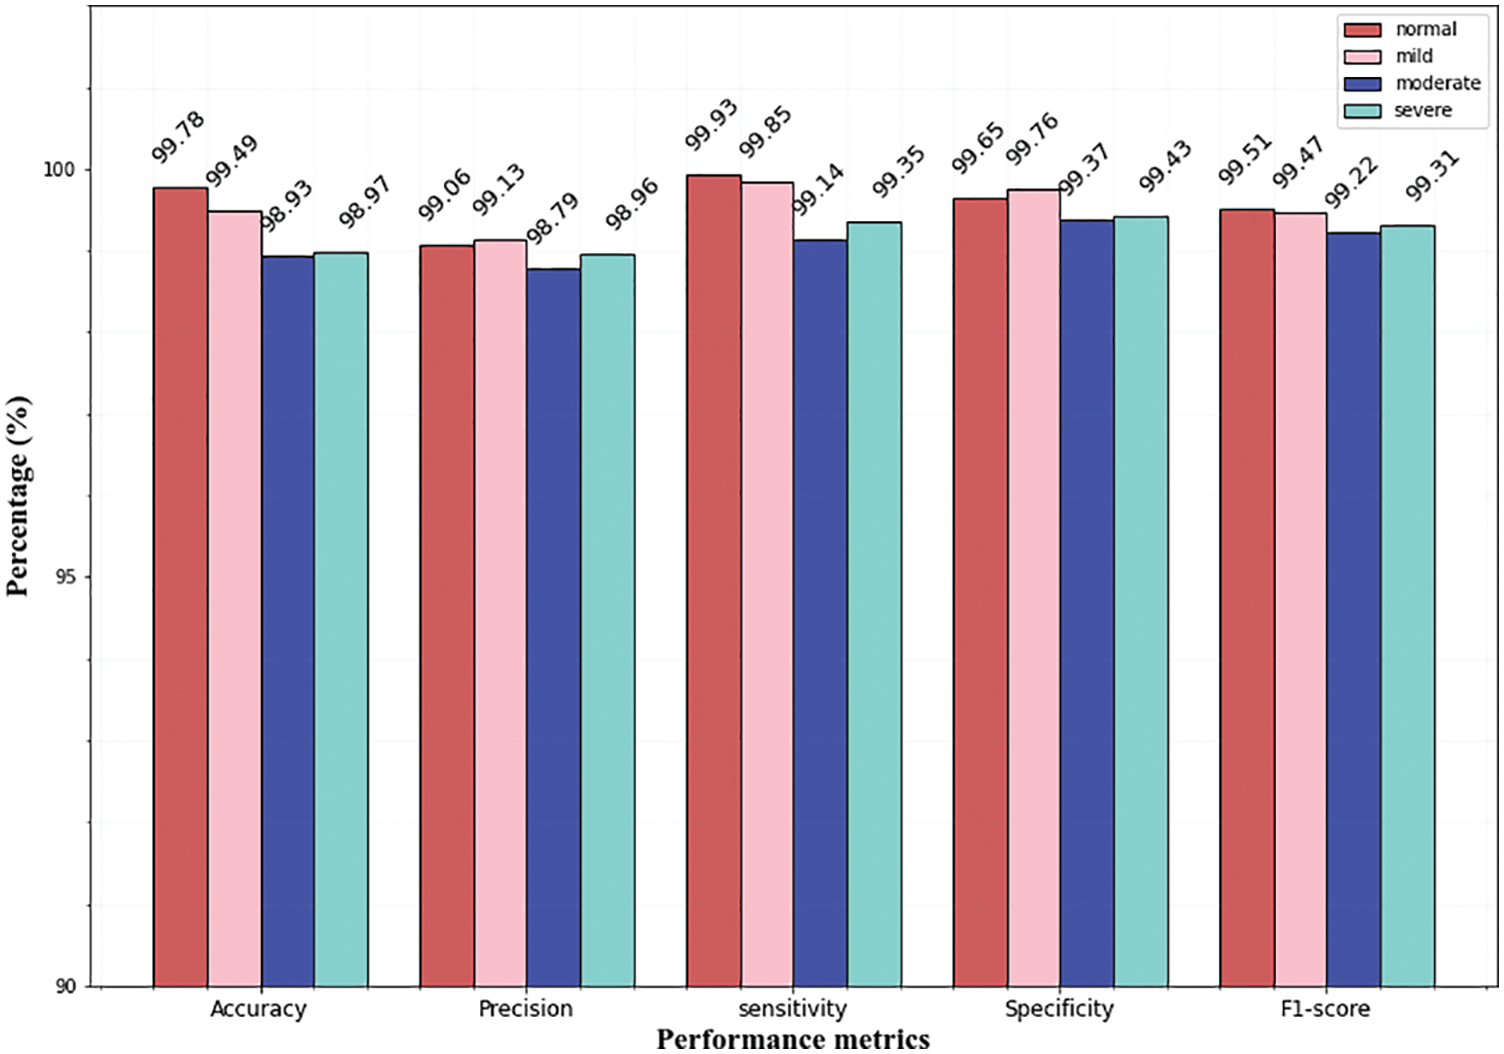
Figure 9: Multi-class classification of Messidor dataset
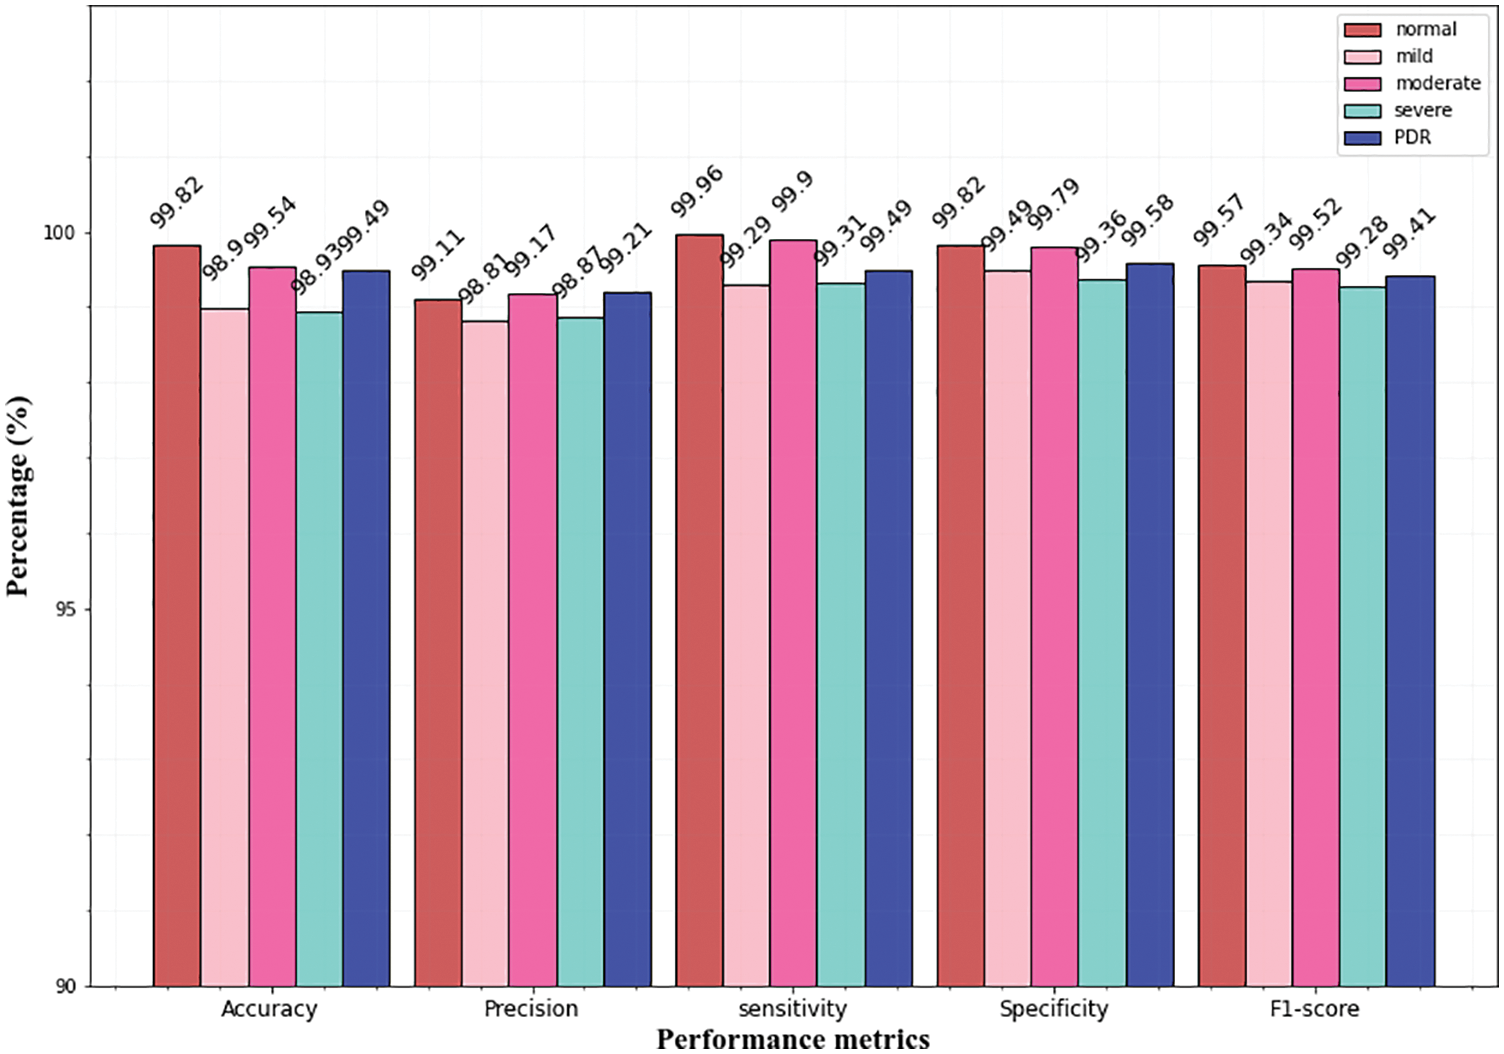
Figure 10: Multi-class classification of the APTSO dataset
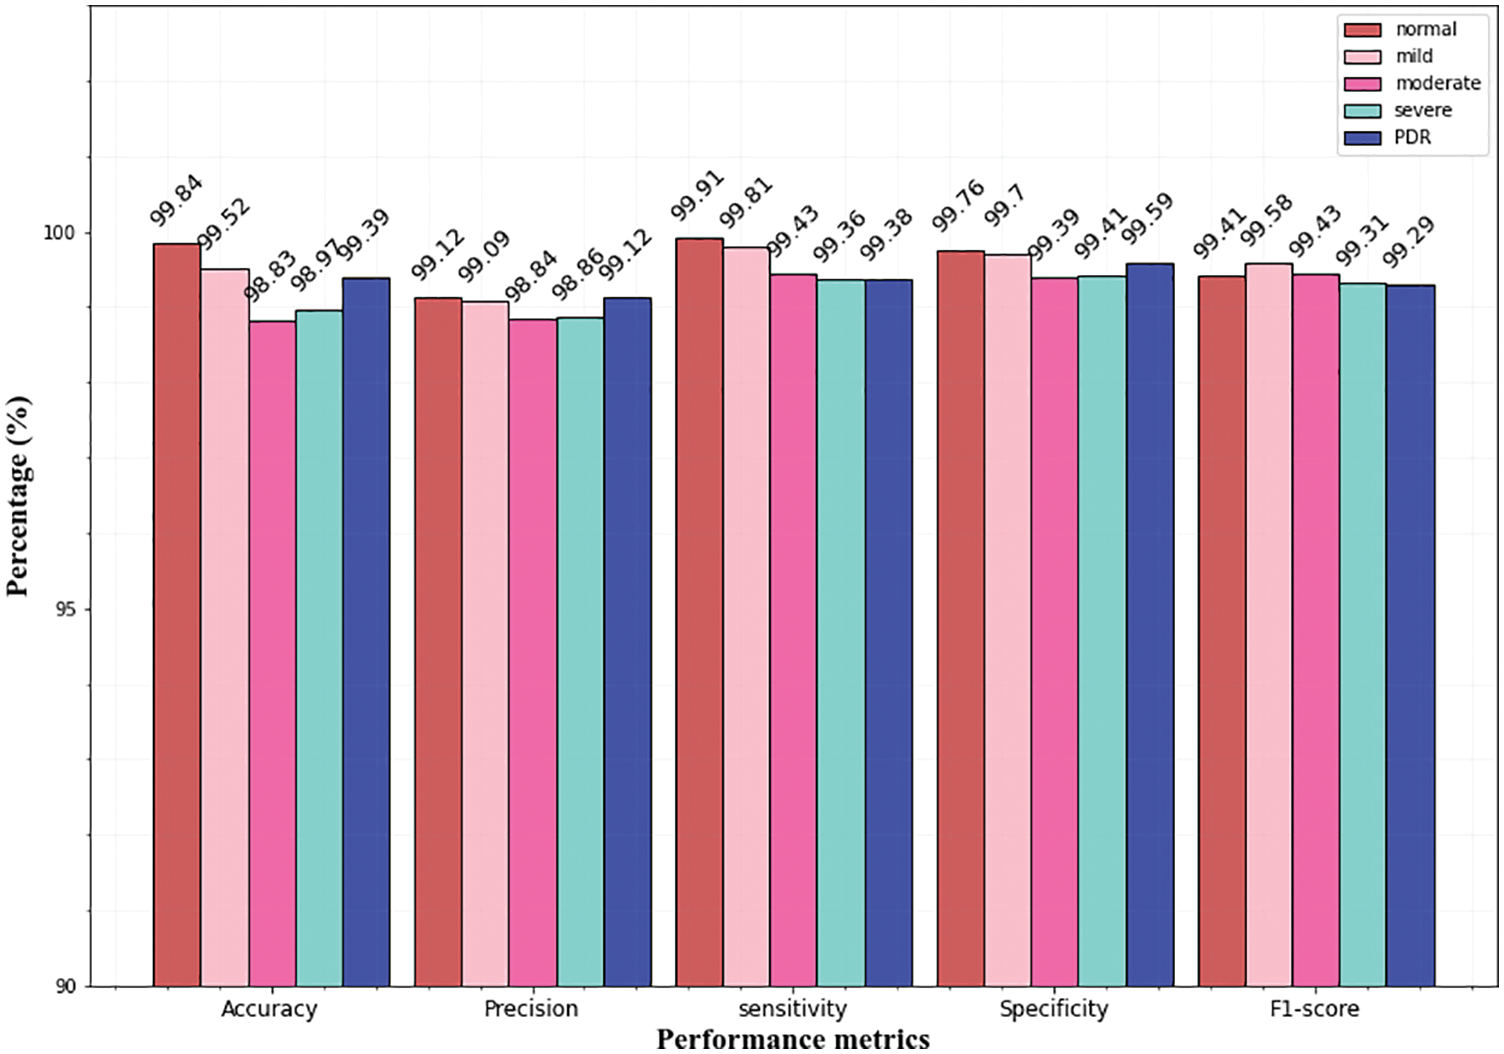
Figure 11: Multi-class classification of the IDRiD dataset
From the above graphs, it is observed that the classifier predicts all the classes almost accurately and achieves superior results. Specifically, the normal, mild classes attain high accuracy for Messidor (99.78% 99.49%), and the IDRiD dataset (99.84%, 99.52%). In the APTSO dataset, the normal and moderate class attains the highest accuracy (99.84%, 99.52%). In the classification of severe class, the classifier yields similar accuracy (98.97%) for the Messidor and IDRiD datasets.
The sensitivity, specificity, and F1 score for all classes provide very good results which show the classification ability of the proposed approach. Fig. 9 represents the classifier performance on the Messidor dataset which contains four classes (severe, moderate, mild, and normal). In the figure, the precision value of the severe class (98.96%) is higher than the moderate (98.79%) class. However, in terms of specificity, the mild class (99.76%) attains high value than all classes.
Figs. 10 and 11 represents the classifier performance on the APTSO and IDRiD dataset respectively. It contains five classes (normal, mild, moderate, severe, and PDR). In Fig. 10, the PDR class attains 99.49% accuracy, 99.21% precision, 99.49% sensitivity, 99.58% specificity and 99.41% f1-score. In Fig. 11, accuracy, precision, sensitivity, specificity and f1-score values for PDR class is 99.39%, 99.12%, 99.38%, 99.59% and 99.29% respectively. From these results, the DR grading performance of the proposed classifier is enhanced for all the datasets.
Different strategies and a variety of datasets are used to implement several different methods for DR classification. In three datasets (Messidor, APTOS, and IDRiD), the effectiveness of the suggested technique is compared to standard current methods, and the comparisons are displayed in Tables 3–5.
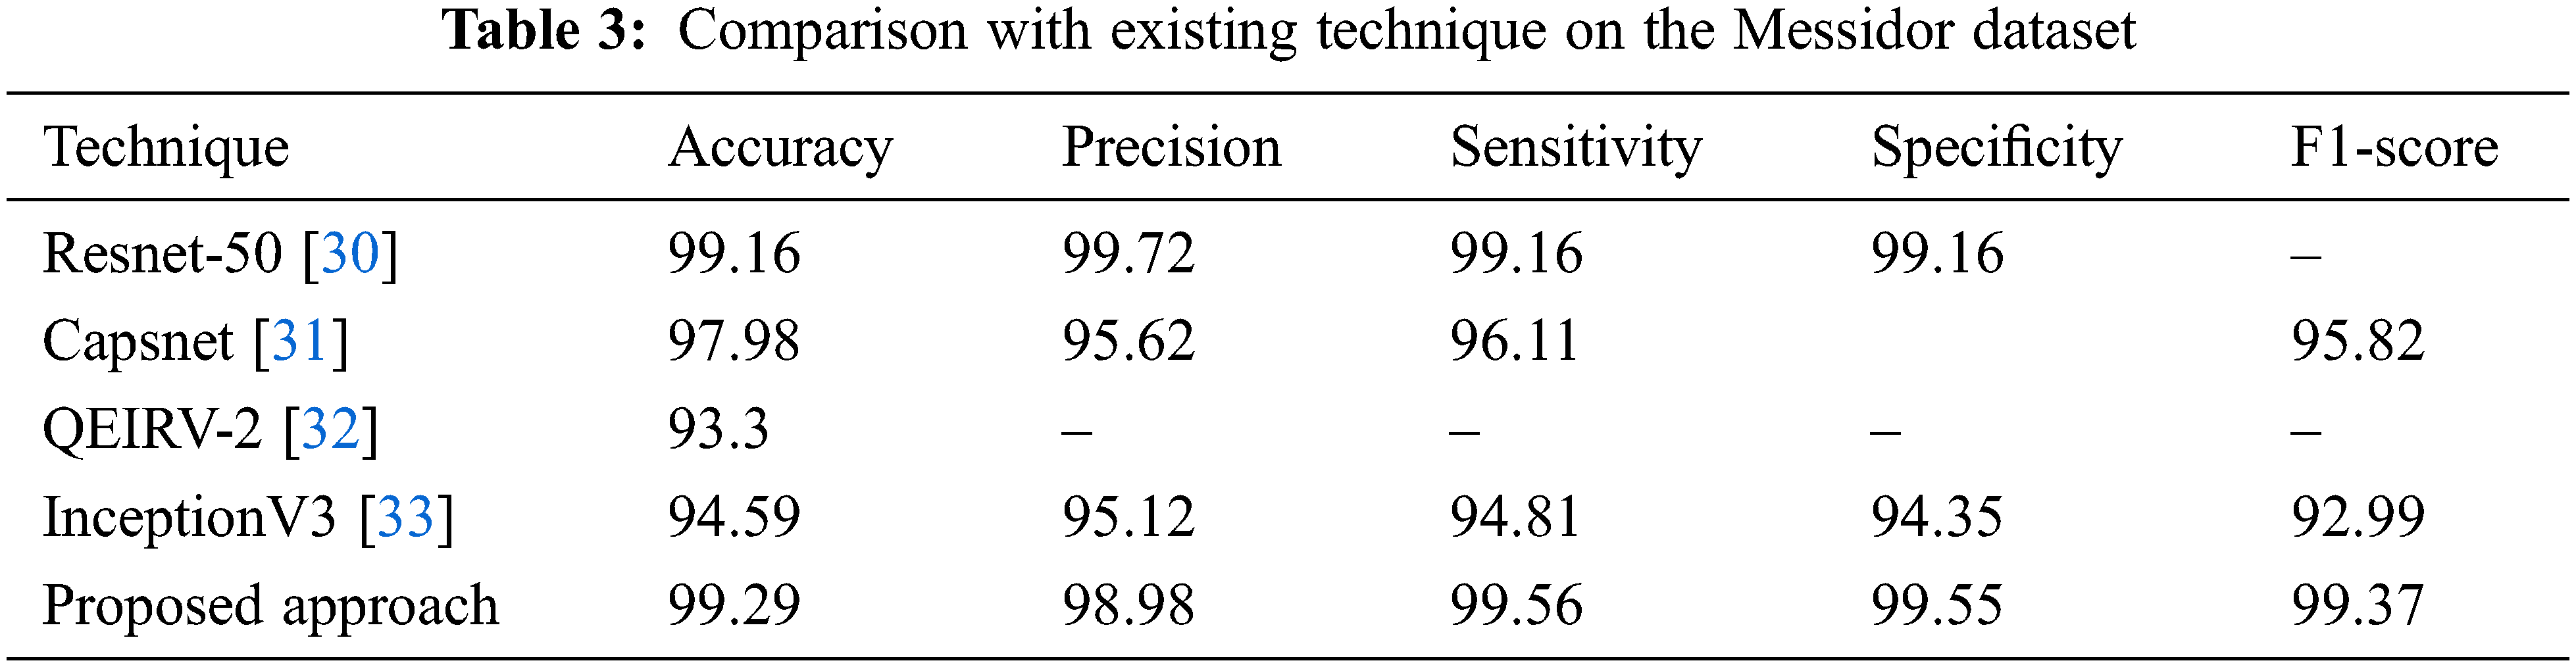
From Table 3, it is observed that the proposed technique outperformed all other techniques with 99.29% accuracy. In all the techniques, the Capsnet provides good performance and attains 97.98% accuracy which is not higher than the accuracy of Resnet-50. It attains 99.16% accuracy on the Messidor dataset which is similar to our proposed approach. Compared to all the techniques, the performance of QEIRV-2 and InceptionV3 is average and they yield 93.3% and 94.59% accuracy correspondingly. The graphical representation of Table 3 is given in Fig. 12. This graph compares the proposed approach with the existing techniques in terms of accuracy.
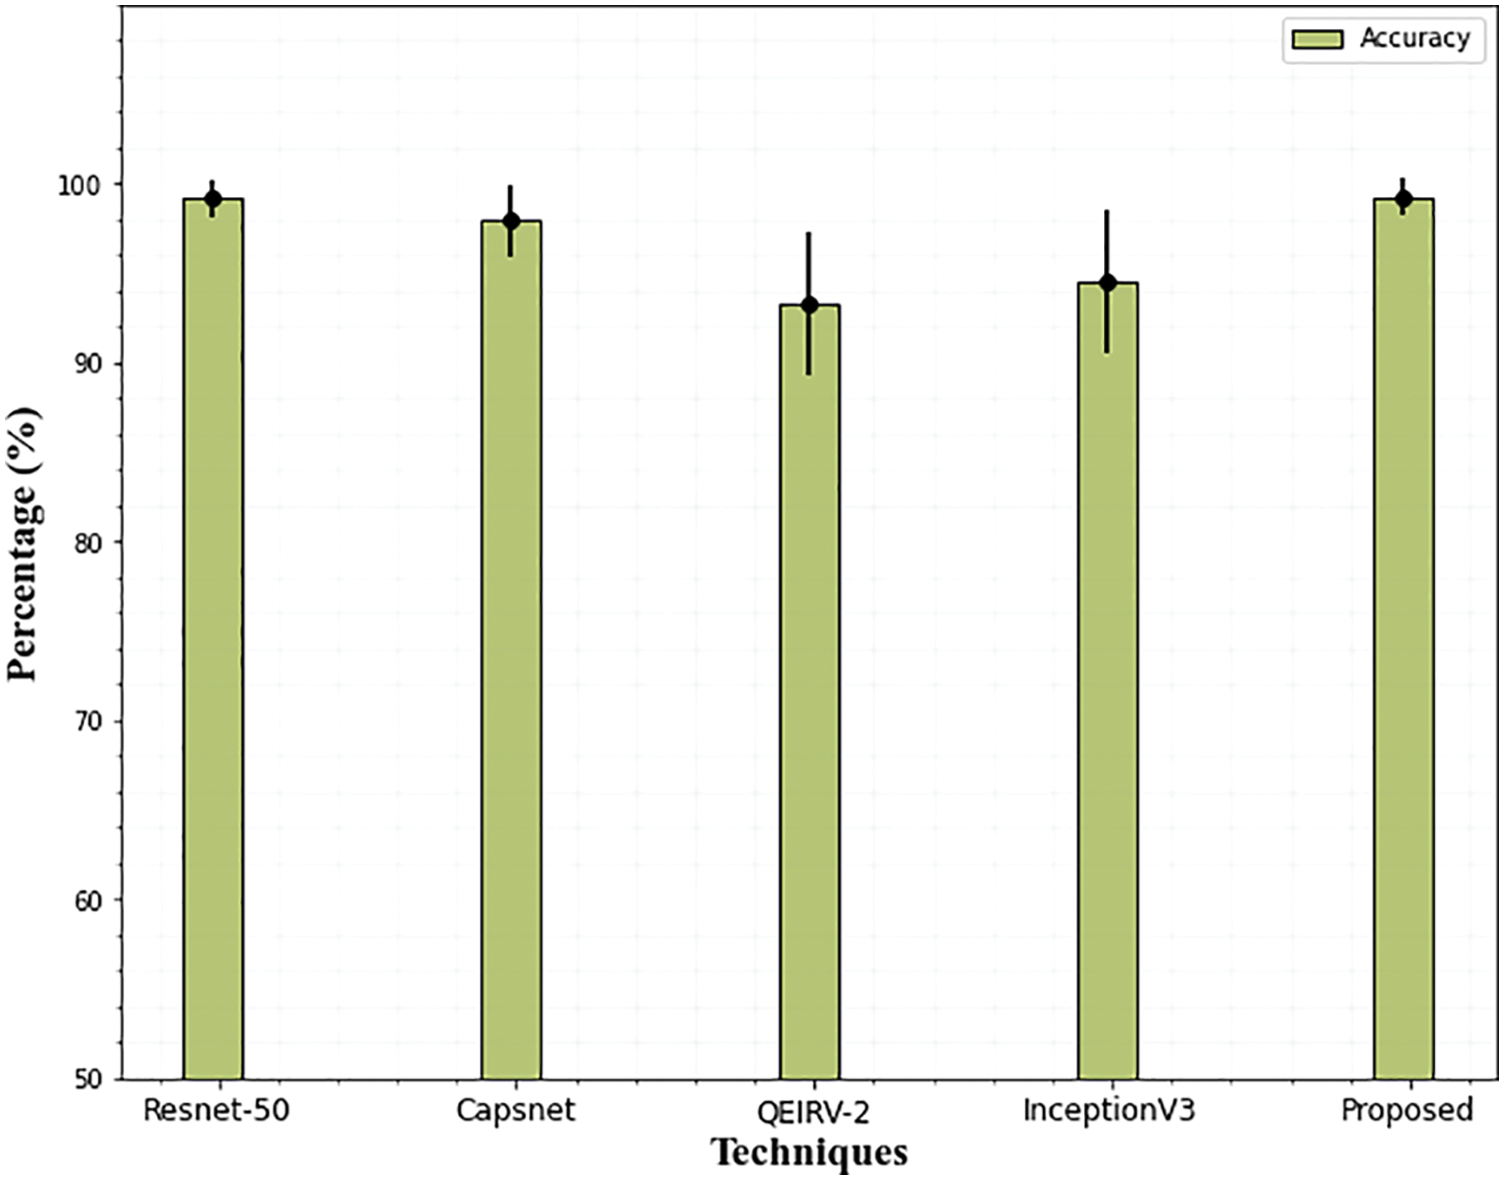
Figure 12: Comparison of accuracy on Messidor dataset. The error bars show the standard deviation
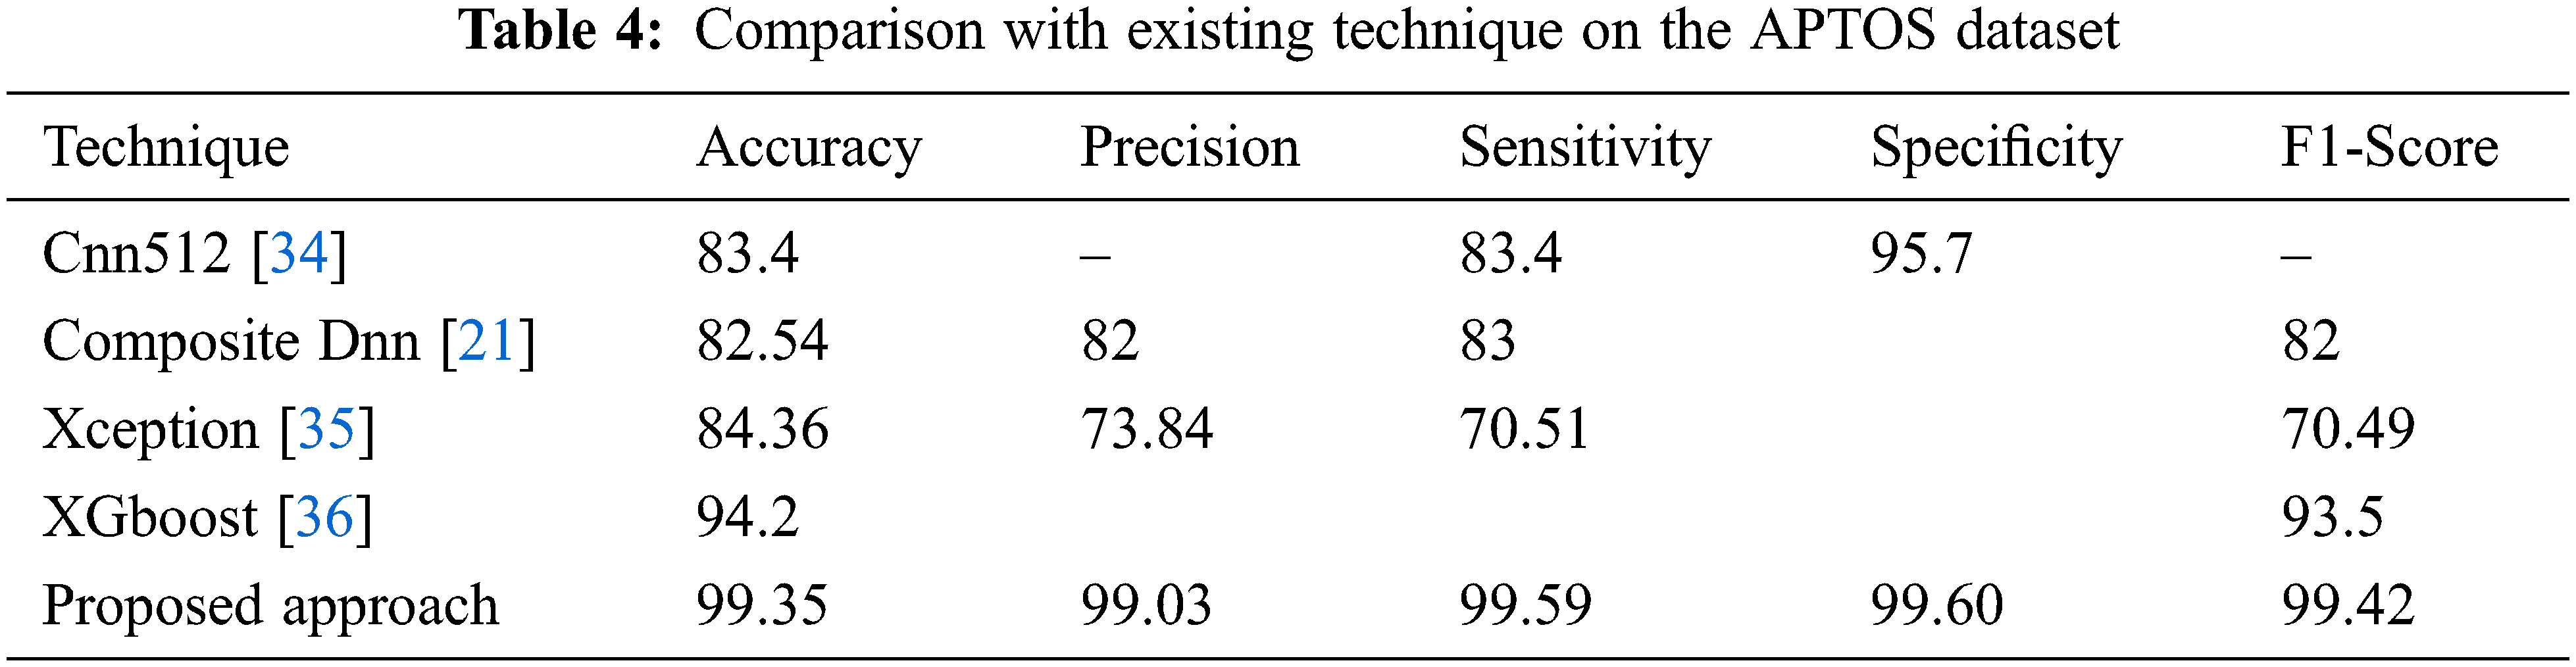
The results of the suggested DR grading and classification approach on the APTSO dataset are shown in Table 4. The suggested model outperforms the current state-of-the-art method with 99.35 percent accuracy, 99.03 percent precision, 99.59 percent sensitivity, 99.60 percent specificity, and 99.42 percent f1-score when compared to the most recent approaches. The suggested method's greatest sensitivity ensures that the classifier accurately predicts the DR and that incorrect case predictions are avoided. Since the sensitivity indicates how well the classifier performs based on the prediction and properly identifies the patients with DR. Fig. 13 compares the accuracy of the suggested method with the current method.
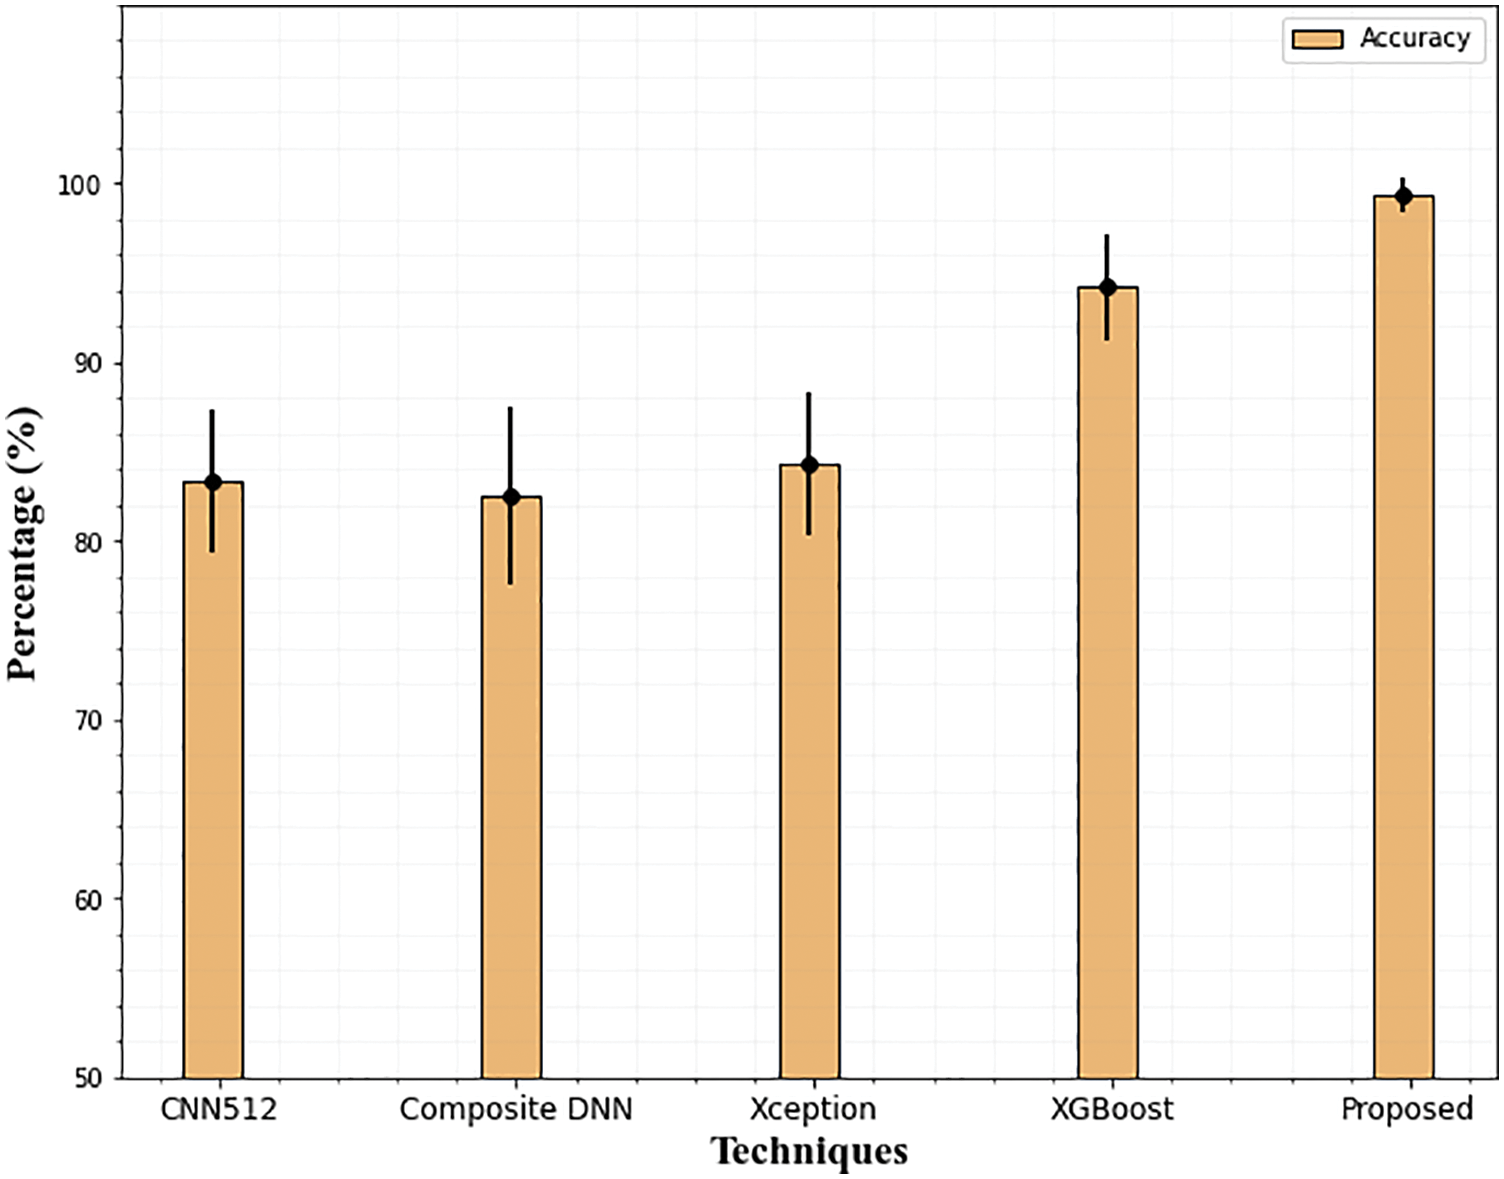
Figure 13: Accuracy comparison of the proposed technique on the APTSO dataset. The error bars show the standard deviation
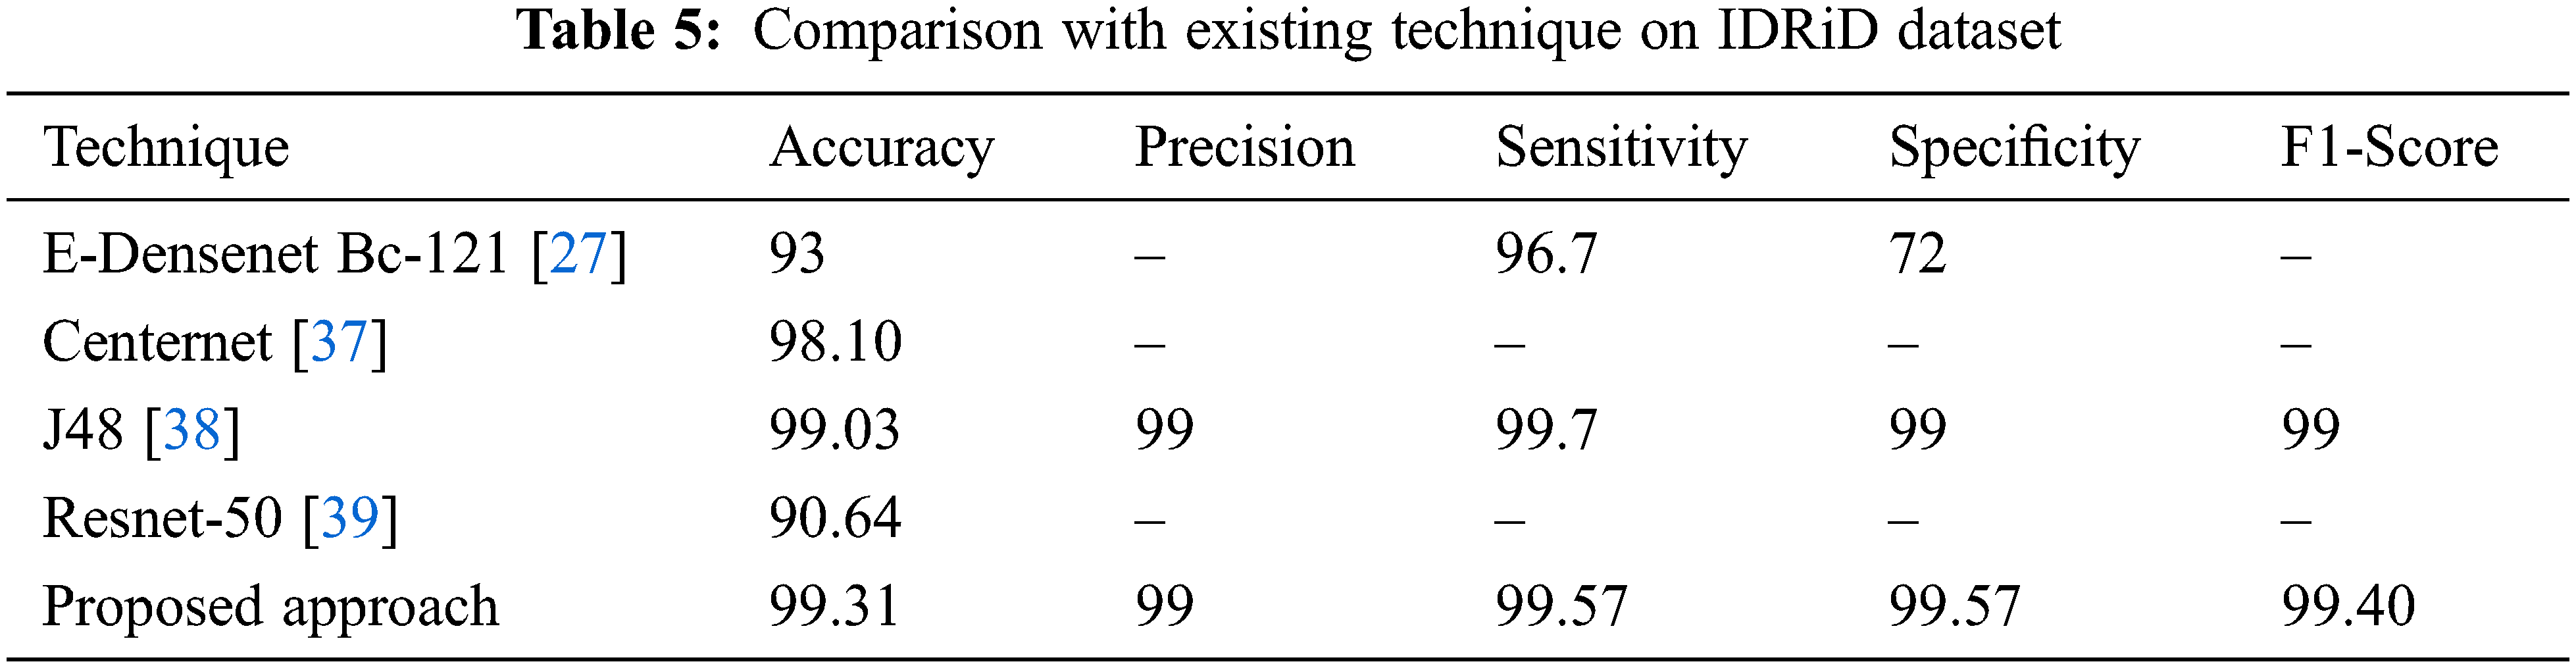
Utilizing the most recent IDRiD dataset serves as proof that the suggested model is generalizable. The proposed methodology has been applied to pictures taken from the IDRiD dataset to provide an overview of classification performance in terms of performance parameters. Observations have been made to determine the proposed model’s capacity for classification.
According to Table 5’s performance results, the suggested approach performs equally well with 99.31 percent accuracy using the IDRiD dataset as well. In other existing techniques, J48 achieves (99.03% accuracy) better results compared to all other techniques. It is evident from examining the graphical representation of Table 5, the Resnet-50 network struggles to accurately grade DR for the IDRiD dataset Fig. 14. The E-DenseNet BC-121 performs better than the Resnet-50 network with 93% accuracy.
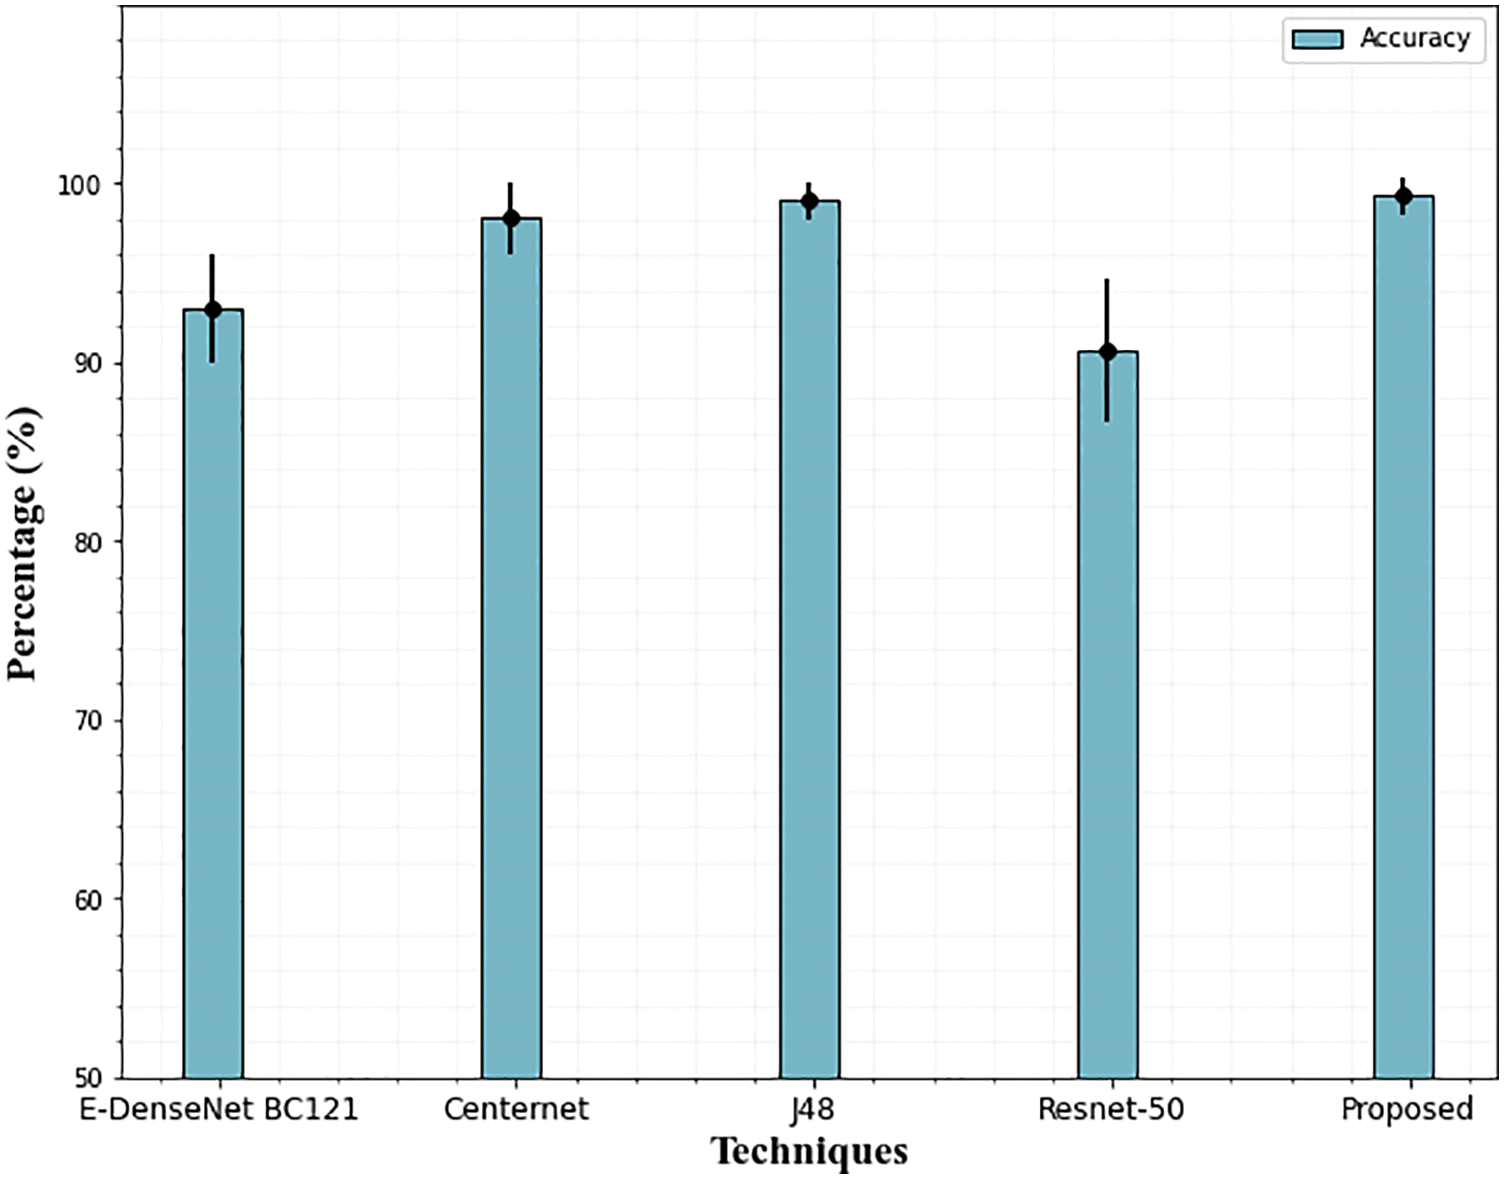
Figure 14: Accuracy comparison of the proposed technique on the IDRiD dataset. The error bars show the standard deviation
5.3 Impact of Feature Selection
As mentioned earlier, selecting the most powerful features and using them to train the learning algorithm can significantly reduce the amount of training data, which, in turn, reduces the model’s time and space complexity. Therefore, in this section, we evaluate the efficiency of the feature selection method which improves the performance of the classifier. The impact of feature selection is displayed in the following Table 6 and Fig. 15.
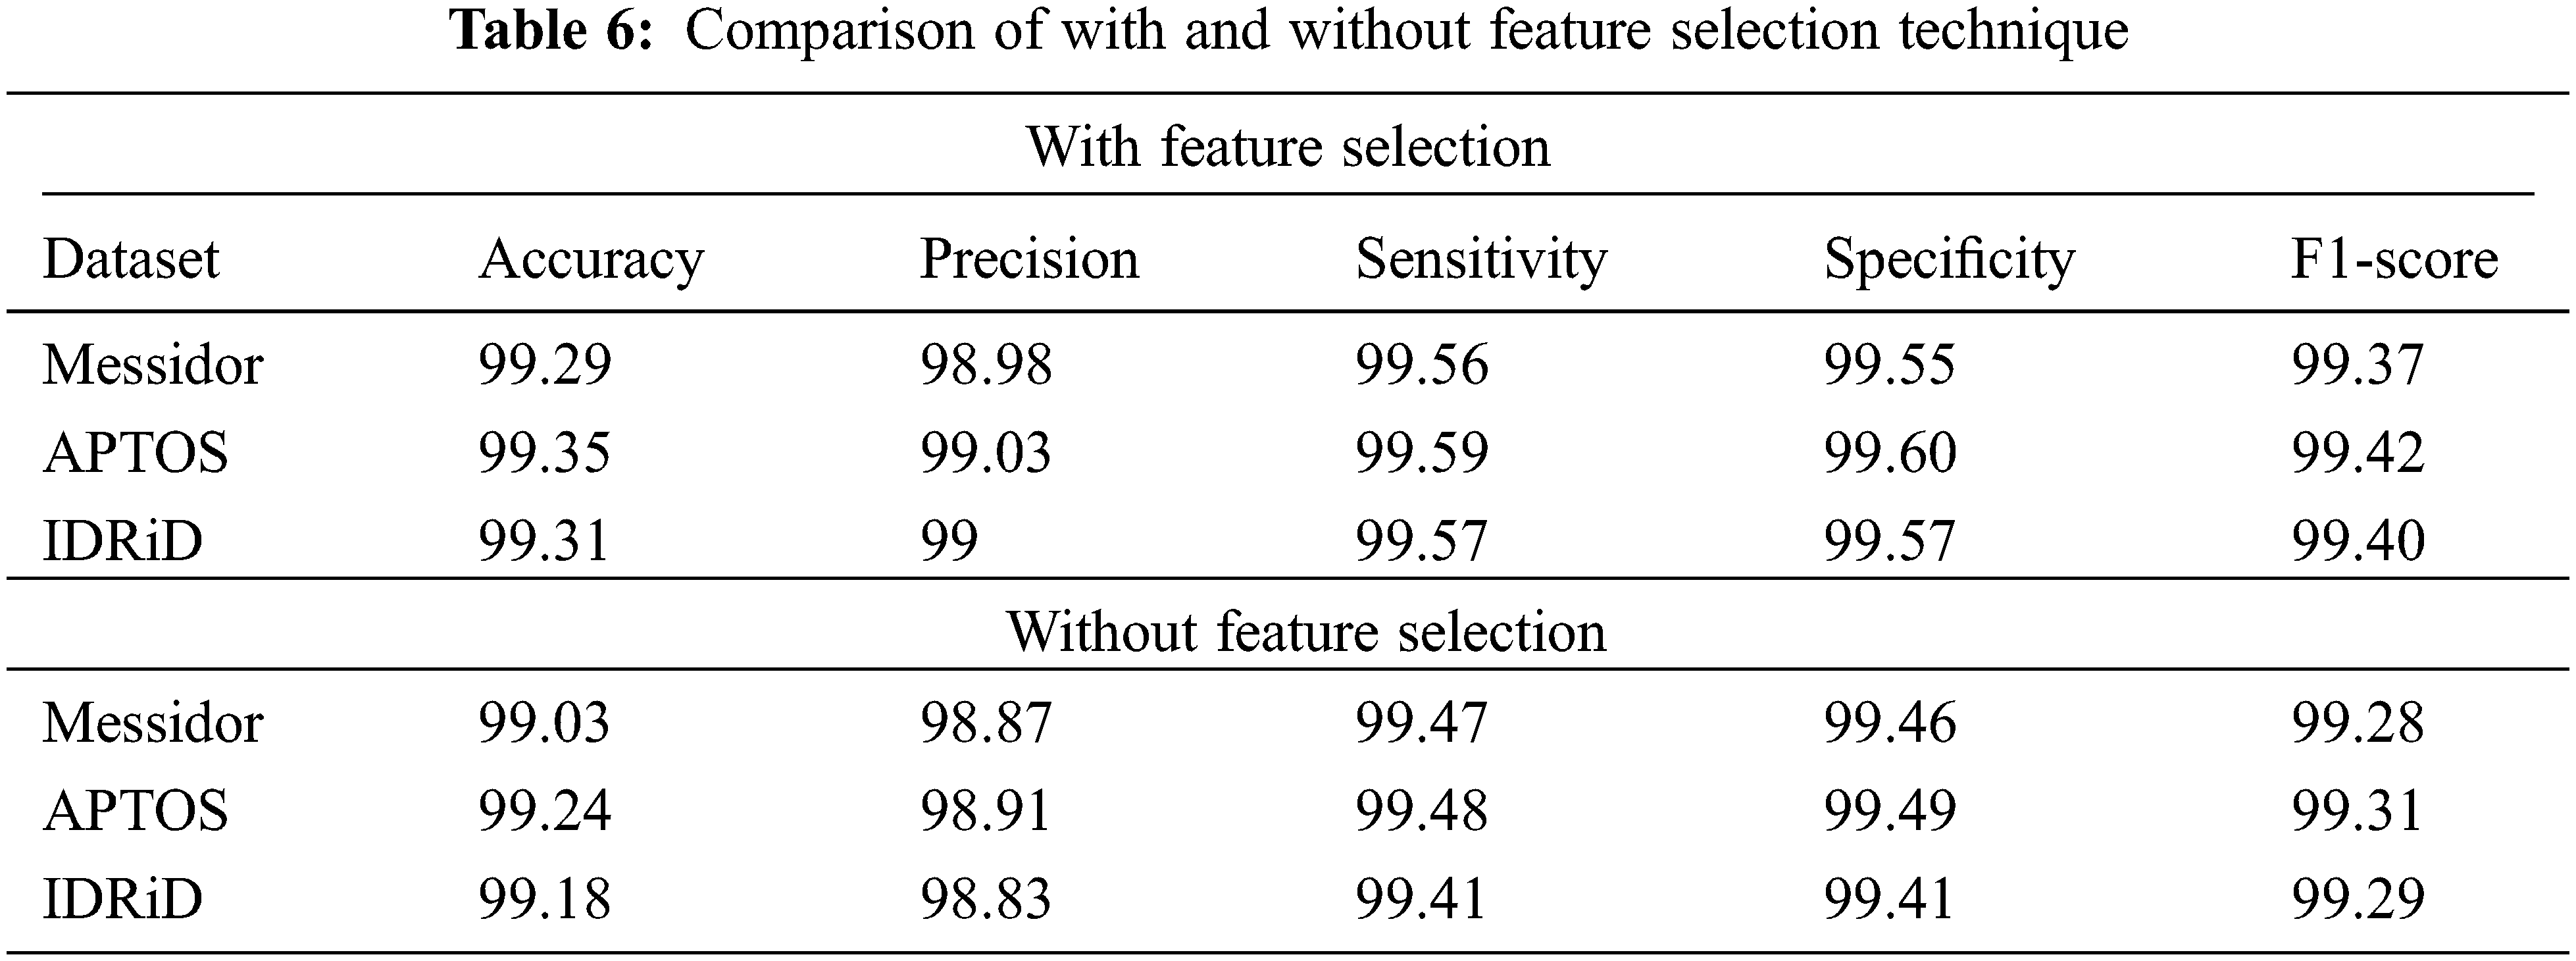
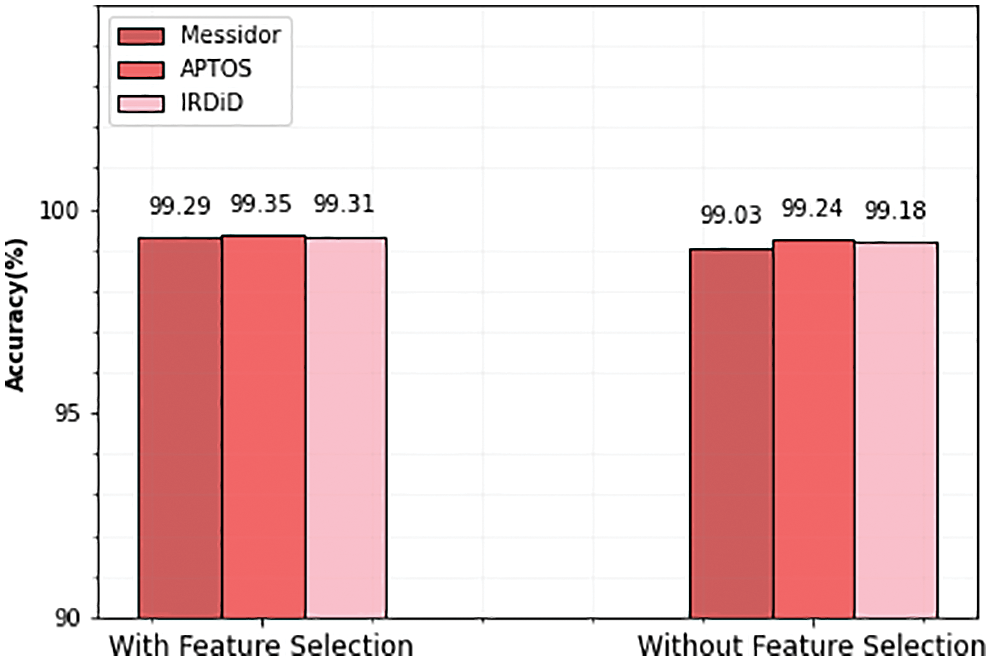
Figure 15: Accuracy comparison of with and without feature selection
From the above table, it is observed that the performance of the classifier is slightly improved with the feature selection technique. In the APTOS dataset, the accuracy of the classifier is 99.24% before the feature selection process. After the selected set of features, the performance of the classifier is increased and produced 99.35% accuracy. Similarly, Messidor and IDRiD datasets also achieve 99.29% and 99.31% accuracy after the feature selection process.
DR is an eye disease that can cause visual loss and has recently spread significantly. For this, the present study suggests a rapid grading method and automatic early DR diagnosis. To categorize lesions according to their severity levels, LuNet lesion segmentation and lightGBM classifier are implemented on fundus pictures. The segmentation technique effectively segments the fundus images into four lesions and achieved good results in terms of DSC, PPV, and SEN. Furthermore, the AO algorithm-based feature selection process is conducted to improve the classification accuracy of DR classes on three datasets. Therefore, the proposed algorithm achieved 99.29%, 99.35%, and 99.31% accuracy for Messidor, APTSO, and IDRiD datasets respectively. Finally, the result findings demonstrate that the method produces successful results in both segmentation and classification when compared to several conventional methods. In the future, this research will expand to recognize more retinal conditions, such as retinopathy of prematurity and glaucoma, among others, and digital applications may be created to make it easier to use the model in clinical settings.
Funding Statement: The authors received no specific funding for this study.
Conflicts of Interest: The authors declare that they have no conflicts of interest to report regarding the present study.
References
1. B. Menaouer, Z. Dermane, N. El Houda Kebir and N. Matta, “Diabetic retinopathy classification using hybrid deep learning approach,” SN Computer Science, vol. 3, no. 5, pp. 1–15, 2022. [Google Scholar]
2. T. D. C. Minh, D. R. Blake and P. R. Galassetti, “The clinical potential of exhaled breath analysis for diabetes mellitus,” Diabetes Research and Clinical Practice, vol. 97, no. 2, pp. 195–205, 2012. [Google Scholar]
3. A. K. Pathak and C. Viphavakit, “VOC biomarker monitoring for diabetes through exhaled breath using Ag/P-TiO2 composite plasmonic sensor,” IEEE Sensors Journal, vol. 21, no. 20, pp. 22631–22637, 2021. [Google Scholar]
4. L. Fang and H. Qiao, “Diabetic retinopathy classification using a novel DAG network based on multi-feature of fundus images,” Biomedical Signal Processing and Control, vol. 77, no. 1, pp. 103–810, 2022. [Google Scholar]
5. G. U. Nneji, J. Cai, J. Deng, H. N. Monday, M. A. Hossin et al., “Identification of diabetic retinopathy using weighted fusion deep learning based on dual-channel fundus scans,” Diagnostics, vol. 12, no. 2, pp. 540, 2022. [Google Scholar]
6. R. Nirthika, S. Manivannan and A. Ramanan, “Siamese network based fine-grained classification for diabetic retinopathy grading,” Biomedical Signal Processing and Control, vol. 78, no. 1, pp. 103–874, 2022. [Google Scholar]
7. A. M. Dayana and W. R. Emmanuel, “Deep learning enabled optimized feature selection and classification for grading diabetic retinopathy severity in the fundus image,” Neural Computing and Applications, vol. 1, no. 1, pp. 1–21, 2022. [Google Scholar]
8. M. N. Ashraf, M. Hussain and Z. Habib, “Deep red lesion classification for early screening of diabetic retinopathy,” Mathematics, vol. 10, no. 5, pp. 686, 2022. [Google Scholar]
9. A. Skouta, A. Elmoufidi, S. Jai-Andaloussi and O. Ouchetto, “Hemorrhage semantic segmentation in fundus images for the diagnosis of diabetic retinopathy by using a convolutional neural network,” Journal of Big Data, vol. 9, no. 1, pp. 1–24, 2022. [Google Scholar]
10. K. R. Remya and M. N. Giriprasad, “An automated exudate detection scheme supporting diabetic retinopathy screening using spatial-spectral-statistical feature maps,” Multimedia Tools and Applications, vol. 81, no. 7, pp. 9829–9853, 2022. [Google Scholar]
11. Y. Guo and Y. Peng, “Multiple lesion segmentation in diabetic retinopathy with dual-input attentive RefineNet,” Applied Intelligence, vol. 1, no. 1, pp. 1–25, 2022. [Google Scholar]
12. A. Erciyas and N. Barışçı, “An effective method for detecting and classifying diabetic retinopathy lesions based on deep learning,” Computational and Mathematical Methods in Medicine, vol. 1, no. 1, pp. 1–15, 2021. [Google Scholar]
13. G. U. Parthasharathi, R. Premnivas and K. Jasmine, “Diabetic retinopathy detection using machine learning,” Journal of Innovative Image Processing, vol. 4, no. 1, pp. 26–33, 2022. [Google Scholar]
14. I. Qureshi, J. Ma and Q. Abbas, “Diabetic retinopathy detection and stage classification in eye fundus images using active deep learning,” Multimedia Tools and Applications, vol. 80, no. 8, pp. 11691–11721, 2021. [Google Scholar]
15. Y. Fu, G. Zhang, J. Li, D. Pan, Y. Wang et al., “Fovea localization by blood vessel vector in abnormal fundus images,” Pattern Recognition, vol. 129, no. 1, pp. 108711, 2022. [Google Scholar]
16. L. Math and R. Fatima, “Adaptive machine learning classification for diabetic retinopathy,” Multimedia Tools and Applications, vol. 80, no. 4, pp. 5173–5186, 2021. [Google Scholar]
17. P. Liu, X. Yang, B. Jin and Q. Zhou, “Diabetic retinal grading using attention-based bilinear convolutional neural network and complement cross-entropy,” Entropy, vol. 23, no. 7, pp. 816, 2021. [Google Scholar]
18. S. S. Athalye and G. Vijay, “Taylor series-based deep belief network for automatic classification of diabetic retinopathy using retinal fundus images,” International Journal of Imaging Systems and Technology, vol. 32, no. 3, pp. 882–901, 2022. [Google Scholar]
19. X. Luo, Z. Pu, Y. Xu, W. K. Wong, J. Su et al., “MVDRNet: Multi-view diabetic retinopathy detection by combining DCNNs and attention mechanisms,” Pattern Recognition, vol. 120, no. 1, pp. 104–108, 2021. [Google Scholar]
20. J. Kaur and P. Kaur, “Automated computer-aided diagnosis of diabetic retinopathy based on segmentation and classification using the k-nearest neighbor algorithm in retinal images,” The Computer Journal, vol. 1, no. 1, pp. 15–20, 2022. [Google Scholar]
21. J. D. Bodapati, N. S. Shaik and V. Naralasetti, “Composite deep neural network with a gated-attention mechanism for diabetic retinopathy severity classification,” Journal of Ambient Intelligence and Humanized Computing, vol. 12, no. 10, pp. 9825–9839, 2021. [Google Scholar]
22. M. Elsharkawy, A. Sharafeldeen, A. Soliman, F. Khalifa, M. Ghazal et al., “A novel computer-aided diagnostic system for early detection of diabetic retinopathy using 3D-OCT higher-order spatial appearance model,” Diagnostics, vol. 12, no. 12, pp. 461, 2022. [Google Scholar]
23. M. K. Jabbar, J. Yan, H. Xu, Z. Ur Rehman and A. Jabbar, “Transfer learning-based model for diabetic retinopathy diagnosis using retinal images,” Brain Sciences, vol. 12, no. 5, pp. 535, 2022. [Google Scholar]
24. S. L. Yi, X. L. Yang, T. W. Wang, F. R. She, X. Xiong et al., “Diabetic retinopathy diagnosis based on RA-EfficientNet,” Applied Sciences, vol. 11, no. 22, pp. 11035, 2021. [Google Scholar]
25. M. Nahiduzzaman, M. R. Islam, S. R. Islam, M. O. F. Goni, M. S. Anower et al., “Hybrid CNN-SVD based prominent feature extraction and selection for grading diabetic retinopathy using extreme learning machine algorithm,” IEEE Access, vol. 9, no. 1, pp. 152261–152274, 2021. [Google Scholar]
26. M. M. Butt, D. N. F. Iskandar, S. E. Abdelhamid, G. Latif and R. Alghazo, “Diabetic retinopathy detection from fundus images of the eye using hybrid deep learning features,” Diagnostics, vol. 12, no. 7, pp. 1607, 2022. [Google Scholar]
27. E. AbdelMaksoud, S. Barakat and M. Elmogy, “A computer-aided diagnosis system for detecting various diabetic retinopathy grades based on a hybrid deep learning technique,” Medical & Biological Engineering & Computing, vol. 1, no. 1, pp. 1–24, 2022. [Google Scholar]
28. D. A. Clevert, T. Unterthiner and S. Hochreiter, “Fast and accurate deep network learning by exponential linear units (elus),” arXiv preprint arXiv:1511.07289, 2015. [Google Scholar]
29. L. Abualigah, D. Yousri, M. Abd Elaziz, A. A. Ewees, M. A. Al-Qaness et al., “Aquila optimizer: A novel meta-heuristic optimization algorithm,” Computers & Industrial Engineering, vol. 157, no. 11, pp. 107250, 2021. [Google Scholar]
30. N. Sambyal, P. Saini, R. Syal and V. Gupta, “Aggregated residual transformation network for multistage classification in diabetic retinopathy,” International Journal of Imaging Systems and Technology, vol. 31, no. 2, pp. 741–752, 2021. [Google Scholar]
31. G. Kalyani, B. Janakiramaiah, A. Karuna and L. V. Prasad, “Diabetic retinopathy detection and classification using capsule networks,” Complex & Intelligent Systems, vol. 1, no. 1, pp. 1–14, 2021. [Google Scholar]
32. C. Bhardwaj, S. Jain and M. Sood, “Deep learning-based diabetic retinopathy severity grading system employing quadrant ensemble model,” Journal of Digital Imaging, vol. 34, no. 2, pp. 440–457, 2021. [Google Scholar]
33. A. Bilal, L. Zhu, A. Deng, H. Lu and N. Wu, “AI-based automatic detection and classification of diabetic retinopathy using u-net and deep learning,” Symmetry, vol. 14, no. 7, pp. 1427, 2022. [Google Scholar]
34. W. L. Alyoubi, M. F. Abulkhair and W. M. Shalash, “Diabetic retinopathy fundus image classification and lesions localization system using deep learning,” Sensors, vol. 21, no. 11, pp. 3704, 2021. [Google Scholar]
35. M. R. Islam, L. F. Abdulrazak, M. Nahiduzzaman, M. O. F. Goni, M. S. Anower et al., “Applying supervised contrastive learning for the detection of diabetic retinopathy and its severity levels from fundus images,” Computers in Biology and Medicine, vol. 1, no. 1, pp. 105602, 2022. [Google Scholar]
36. N. Sikder, M. Masud, A. K. Bairagi, A. S. M. Arif, A. A. Nahid et al., “Severity classification of diabetic retinopathy using an ensemble learning algorithm through analyzing retinal images,” Symmetry, vol. 13, no. 4, pp. 670, 2021. [Google Scholar]
37. T. Nazir, M. Nawaz, J. Rashid, R. Mahum, M. Masood et al., “Detection of diabetic eye disease from retinal images using a deep learning based CenterNet model,” Sensors, vol. 21, no. 16, pp. 5283, 2021. [Google Scholar]
38. S. Gayathri, V. P. Gopi and P. Palanisamy, “Diabetic retinopathy classification based on multipath CNN and machine learning classifiers,” Physical and Engineering Sciences in Medicine, vol. 44, no. 3, pp. 639–653, 2021. [Google Scholar]
39. M. Patil, S. Chickerur, V. Bakale, S. Giraddi, V. Roodagi et al., “Deep hyper parameter transfer learning for diabetic retinopathy classification,” Turkish Journal of Electrical Engineering and Computer Sciences, vol. 29, no. 8, pp. 2824–2839, 2021. [Google Scholar]
Cite This Article
 Copyright © 2023 The Author(s). Published by Tech Science Press.
This work is licensed under a Creative Commons Attribution 4.0 International License , which permits unrestricted use, distribution, and reproduction in any medium, provided the original work is properly cited.
 Downloads
 Citation Tools