 Open Access
ARTICLE
Image Recognition Based on Deep Learning with Thermal Camera Sensing
1 Department of Electrical Engineering, National Chin-Yi University of Technology, Taichung, 411030, Taiwan
2 Department of Information Technology, Takming University of Science and Technology, Taipei, 11451, Taiwan
* Corresponding Author: Sung-Jung Hsiao. Email:
Computer Systems Science and Engineering 2023, 46(1), 505-520. https://doi.org/10.32604/csse.2023.034781
Received 27 July 2022; Accepted 28 October 2022; Issue published 20 January 2023
Abstract
As the COVID-19 epidemic spread across the globe, people around the world were advised or mandated to wear masks in public places to prevent its spreading further. In some cases, not wearing a mask could result in a fine. To monitor mask wearing, and to prevent the spread of future epidemics, this study proposes an image recognition system consisting of a camera, an infrared thermal array sensor, and a convolutional neural network trained in mask recognition. The infrared sensor monitors body temperature and displays the results in real-time on a liquid crystal display screen. The proposed system reduces the inefficiency of traditional object detection by providing training data according to the specific needs of the user and by applying You Only Look Once Version 4 (YOLOv4) object detection technology, which experiments show has more efficient training parameters and a higher level of accuracy in object recognition. All datasets are uploaded to the cloud for storage using Google Colaboratory, saving human resources and achieving a high level of efficiency at a low cost.Keywords
The COVID-19 epidemic continues to cause problems across the globe, and the virus continues to mutate. To prevent the spread of future epidemics, this study proposes an image recognition system based on deep learning and trained to identify mask wearing among the general public, combined with an infrared thermal array sensor that can be used to monitor body temperature. The sensor displays results on a Liquid Crystal Display (LCD) screen and indicates a warning if the body temperature reaches a high level (a symptom of potential infection). The datasets are managed and analyzed through Artificial Intelligence and the Internet of Things (AIoT) [1], with the aim of achieving a more effective measure of epidemic prevention.
Image recognition has been a booming field for deep learning research in recent years, covering for example smart home applications, self-driving vehicles, product defect detection, security monitoring, and medical imaging, all of which are closely related to deep learning image recognition technology. To achieve an ideal result (high accuracy) from the image recognition model in deep learning, the preprocessing of image data is of key importance. Effective image preprocessing, using professional image processing techniques, can reduce noise in the image so that the model is more accurate when extracting features, and also reduces the burden on computing resources. The principle of image recognition is to imitate the human optic nerve, first through strengthening understanding of the boundary, and then gradually combining the operational mode of image recognition. The image recognition method applied to deep learning will first decompose the image into many small pixels, which are used as the input data of the first layer, and then undergo multilevel algorithmic processing to extract features from individual pixels and combine them. The result of the final output layer completes the process of image recognition.
This study uses the object detection method of You Only Look Once (YOLO) [2,3]. Its convolutional neural network (CNN) architecture is shown in Fig. 1, which depicts a model adapted from GoogLeNet. The YOLO network has 24 convolutional layers and 2 fully connected layers. The network in the current study differs from GoogLeNet in using a 1 × 1 convolutional layer in front of some 3 × 3 convolutional layers to reduce the number of filters. This CNN architecture needs only one run to determine the position and category of objects in a picture; hence the speed of recognition is greatly improved [4].
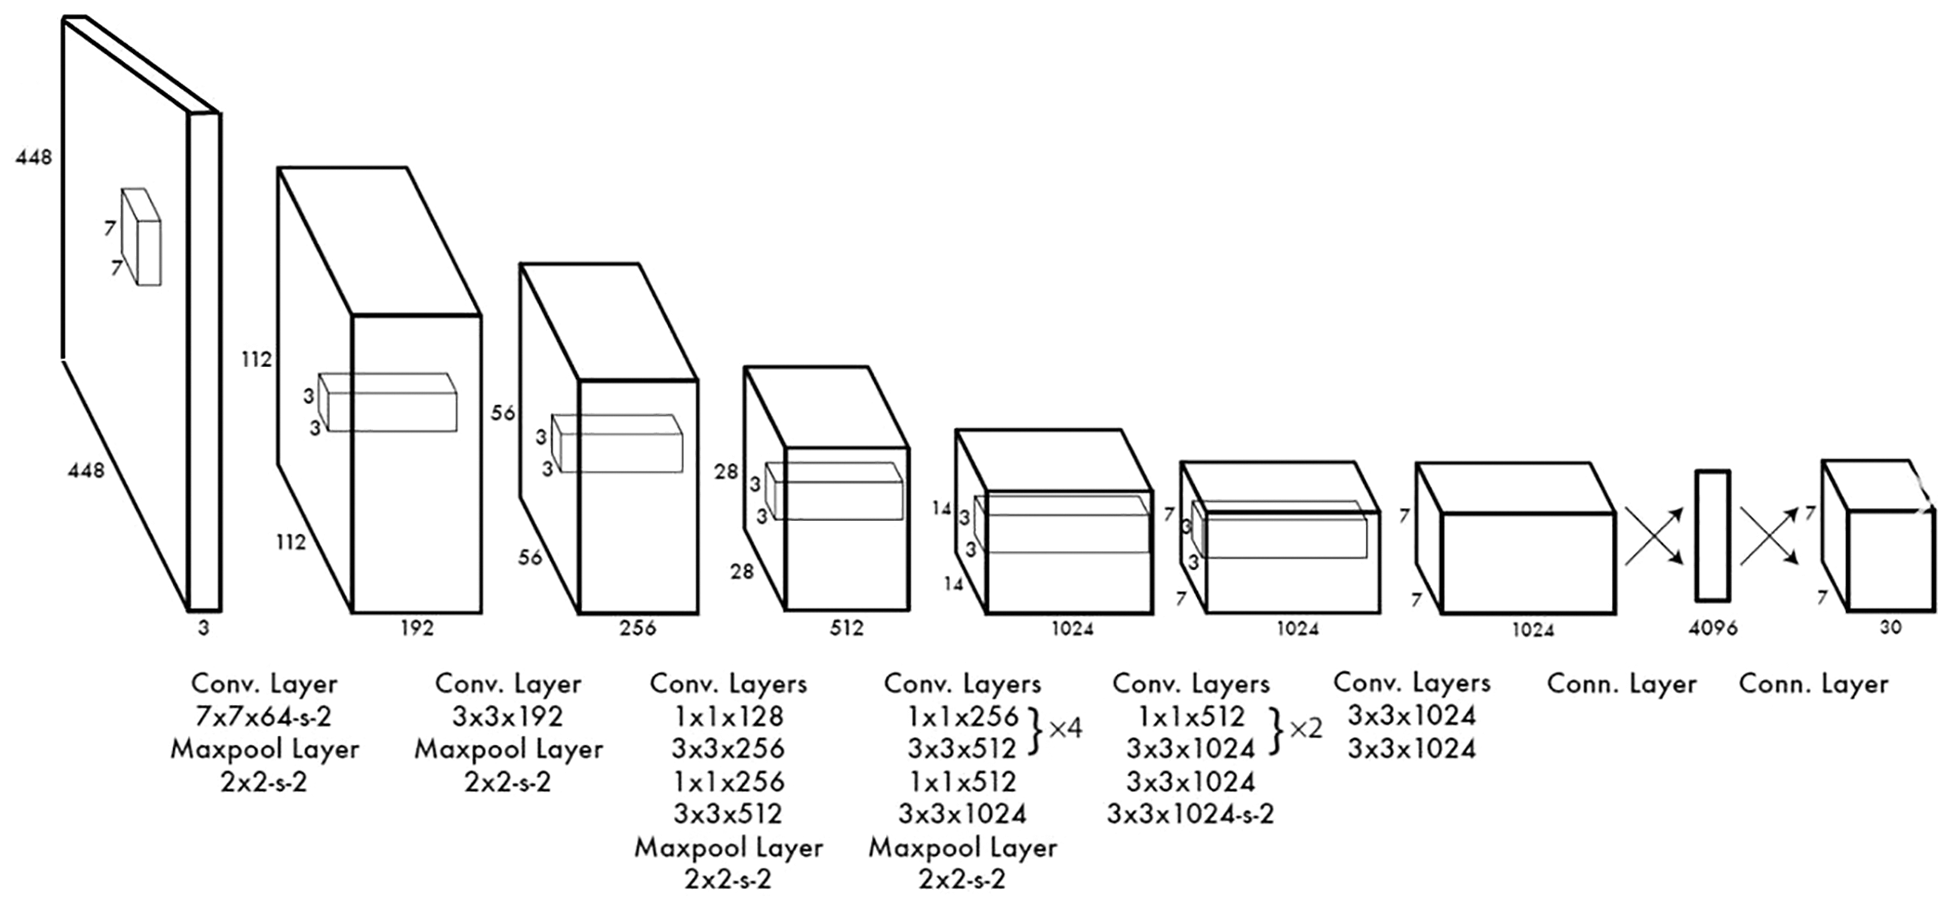
Figure 1: YOLO architecture
Current methods of image detection where the target is people wearing masks are largely based on deep learning [5–7]. In the literature, [8] systematically summarizes the target detection methods of deep learning, and divides them into two frameworks: candidate window-based target detection and regression-based target detection. The frameworks are compared and analyzed, and a reasonable prediction is made for the future research hotspots of target detection methods, based on current directions.
The first type of framework is based on candidate regions. The candidate regions are generated in the initial stage, and the main features of the image are then extracted using CNNs. Finally, the segmentation results are filtered and merged hierarchically into groups. The typical algorithm is Fast R-CNN (Fast Region-based Convolutional Neural Network) [9]. The pedestrian detection method [10] based on candidate regions and PCNN (Parallel Convolutional Neural Network) improves the selective indexing for the extraction of candidate regions, which effectively solves the problem of people in the image. However, the proportion of accurate proposals is low, the extracted features are easily lost, and the detection accuracy is low. Researchers [11] developed a Faster R-CNN method that improves region proposals to a certain extent, and applied it to image detection and mask recognition and monitoring. Experimental results show that the advantages of this method are reflected in a high recognition accuracy and fast calculation speed. When faced with actual engineering work, the method shows high work efficiency. To tackle the problem of bird nest detection on high-voltage towers with complex image backgrounds, researchers [12] proposed a multidimensional image detection method based on Faster R-CNN, making improvements in three dimensions: feature extraction, proposed area extraction, and target detection. The scheme detects the conditions of the identification area and excludes the results of image detection outside this area.
The second type of target detection method is based on regression theory, which divides the image into 7 × 7 grids and predicts two possible positions for each divided grid, including confidence and category. Researchers [13] proposed a moving target detection method based on total variation–kernel regression. The method uses RPCA (Robust Principal Component Analysis) and a three-dimensional total variation model to enhance the continuous characteristics of foreground space and time, remove the interference of dynamic backgrounds, and obtain a clear and comprehensive foreground. Experimental results show that the method is more accurate in detecting moving objects and restoring backgrounds in complex scenes such as dynamic backgrounds and illumination changes. Researchers [14] proposed a target detection algorithm based on the background suppression theory of self-adjusting sequential ridge regression. This suppression algorithm can adapt to the grayscale of primitive neighborhoods and adjust the weighting parameters by itself, which can enhance the target contrast and signal-to-noise ratio while effectively detecting weaker targets with large signal-to-noise ratios.
By comparing the algorithms of these two different frameworks, it can be found that the target detection method based on the first category (candidate regions) has greater accuracy. However, because the generation of candidate regions takes a long time, the method is not highly effective. The second category (regression theory) is fast and has good immediacy because it does not need to find the position of the candidate area, but the level of accuracy is slightly lower. Compared with the traditional detection method of HOG (Histogram of Oriented Gradients) with SVM (Support Vector Machine) and the detection method based on the classic Faster R-CNN ResNet-50, the average accuracy of the method proposed in the present study is an improvement of 43.5% and 15.2%, respectively.
In applying deep learning to image recognition, we have seen the development of a number of research technologies and related products, such as infrared thermal array sensors and LCD sensors. Some image recognition products in the market are connected to infrared sensors. The range of applications and products demonstrates the maturity of the technology, but there is still scope for further development in the practical sphere through different ideas and creativity. The aim of the present study is to enhance the work efficiency of image recognition, and to allow users to become deeply familiar with the technical principles of image recognition and the operating principles of the sensors used. The research uses object detection technology combined with an infrared thermal sensing system, and manages and analyzes the data through the cloud. In practical applications, the real-time personnel behavior detection of field workers requires high immediacy. Therefore, the YOLOv4 algorithm was chosen as the detection method [15]. As a representative of the regression-based target detection method, YOLO not only has high immediacy but is also faster. In experiments on the detection of helmets, a human key point detection model and a hard hat detection algorithm was designed. The sections that follow describe the training process based on the YOLOv4 detection algorithm, and the practicability of the proposed model is verified through model training.
3.1 Deep Learning Architecture
The term deep learning has arguably become a buzzword in recent years, and arguably a rebranding of artificial neural networks. Deep learning refers to machine learning that uses a feature learning algorithm based on data. Its observations can be expressed in a variety of ways. For example, a painting can be represented as a region of a specific shape, a vector of intensity values for each pixel, or more abstractly as a series of edges. However, it is easier to learn its tasks (e.g., face recognition) from examples using some specific representations. The advantage of deep learning is its use of high-efficiency algorithms for unsupervised or semi-supervised feature learning and hierarchical feature extraction to replace general manual feature extraction. The goal of deep learning research is to seek better representations and to build better models that learn representations from large-scale unlabeled data. Representation methods come from neuroscience, like neural coding, trying to draw in the relationship between neuronal responses and neuronal electrical activity in the brain.
3.1.1 Convolutional Neural Network
A convolutional neural network (CNN) consists of one or more convolutional layers and a top fully connected layer (corresponding to a classic neural network), as well as associated weights and a pooling layer, as shown in Fig. 2. This structure enables CNNs to exploit the two-dimensional structure of the input data. Compared with other deep learning architectures, CNNs can give better results in image and speech recognition. The model can also be trained using the backpropagation algorithm. Compared to other deep, feed-forward neural networks, CNNs require fewer parameters to estimate, making them an attractive deep learning architecture. A typical structure can be described as follows.
1. Convolutional layer. A convolutional layer can generate a set of parallel feature maps, which are formed by sliding different convolution kernels on the input image and performing certain operations. In addition, at each sliding position an element-wise product and sum operation is performed between the convolution kernel and the input image to project the information in the receptive field to an element in the feature map. This sliding process is a factor that controls the size of the output feature map. The size of the convolution kernel is much smaller than the input image, and it overlaps or acts on the input image in parallel. All elements in a feature map are calculated by a convolution kernel; that is, the feature maps share the same weights and bias terms.
2. Linear rectification layer. The linear rectification layer uses linear rectification (ReLU), where f(x) = max(0, x) is used as the excitation function. It enhances the nonlinearity of the decision function and the entire neural network without changing the convolutional layer itself.
3. Pooling layer. Pooling is another important concept in CNNs. It is actually a nonlinear form of down sampling. There are many different forms of nonlinear pooling functions, of which max pooling is the most common. It divides the input image into several rectangular areas, and outputs the maximum value for each subarea [16].
4. Fully connected layer. Finally, after several convolutional and max pooling layers, advanced inference in the neural network is achieved through a fully connected layer. As with a regular non-convolutional artificial neural network, neurons in a fully connected layer have connections to all activations in the previous layer. Therefore, their enablement can be computed as an affine transformation; that is, by multiplying by a matrix and then adding a bias offset (a vector plus a fixed or learned bias) [17].

Figure 2: CNN flowchart
YOLOv4 is currently one of the most widely used technologies for object detection. A traditional graphics processing unit (GPU) can be used for training and testing, and YOLOv4 can obtain real-time, high-precision detection results. It is an improved version of YOLOv3 with a number of small innovations [18]. YOLOv4 frames the bounding box in the image, selects the suspected candidate area, and then analyzes and classifies the eigenvalues according to the information in the bounding box. The output detection rate is higher than other object detection methods such as Region-based Fully Convolutional Networks (R-FCN), Single Shot Multi-Box Detector (SSD), and RetinaNet. The features are as follows.
1. Input. First, a 608 × 608 image is inputted for image preprocessing. Mosaic data enhancement uses four images, which are spliced using random scaling, random cropping, and random arrangement. This improves the training speed of the model and the accuracy of the network.
2. Backbone. This is used to extract image features, as shown in Fig. 3. YOLOv4 uses cross-stage partial connections Darknet53 (CSPDarknet53) as the backbone network, which uses the Mish startup function of Fig. 4a as shown in Eq. (1), instead of the original rectified linear unit (ReLU) startup function. Dropblock regularization is added to further improve the generalization ability of the model and reduce the risk of overfitting.
3. Neck connection. This is used to connect the backbone network and the head output layer. The neck connection structure, carefully designed, can improve the diversity and robustness of the features. A spatial pyramid pooling (SPP) component fuses feature maps of different scales and solves the problem of different sizes by pooling a feature map of any size directly to a fixed size and obtaining a fixed number of features. The neck also uses the path aggregation network (PAN) structure to replace the feature pyramid network (FPN) for parameter aggregation, making the CNN suitable for different levels of target detection.
4. Head output layer. This layer completes the output of target detection results. Classification Intersection over Union on Loss (CIoU_Loss) is used to replace the Smooth L1 Loss function, and Distance-IoU non-maximum suppression (DIoU_nms) is used to replace the traditional non-maximum suppression (NMS) operation, thereby further improving the detection accuracy of the algorithm. The equations of the operation are represented by Eqs. (2)–(5).
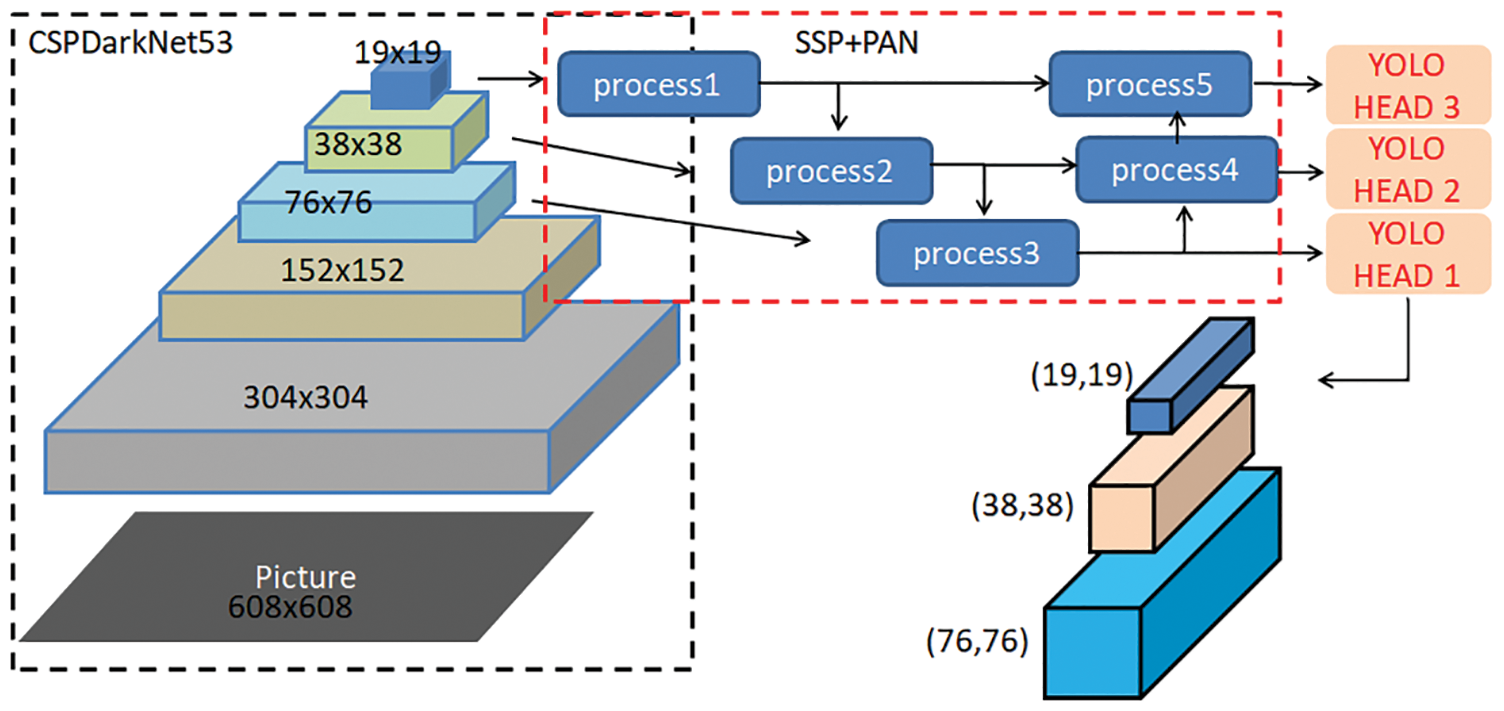
Figure 3: YOLOv4 network structure
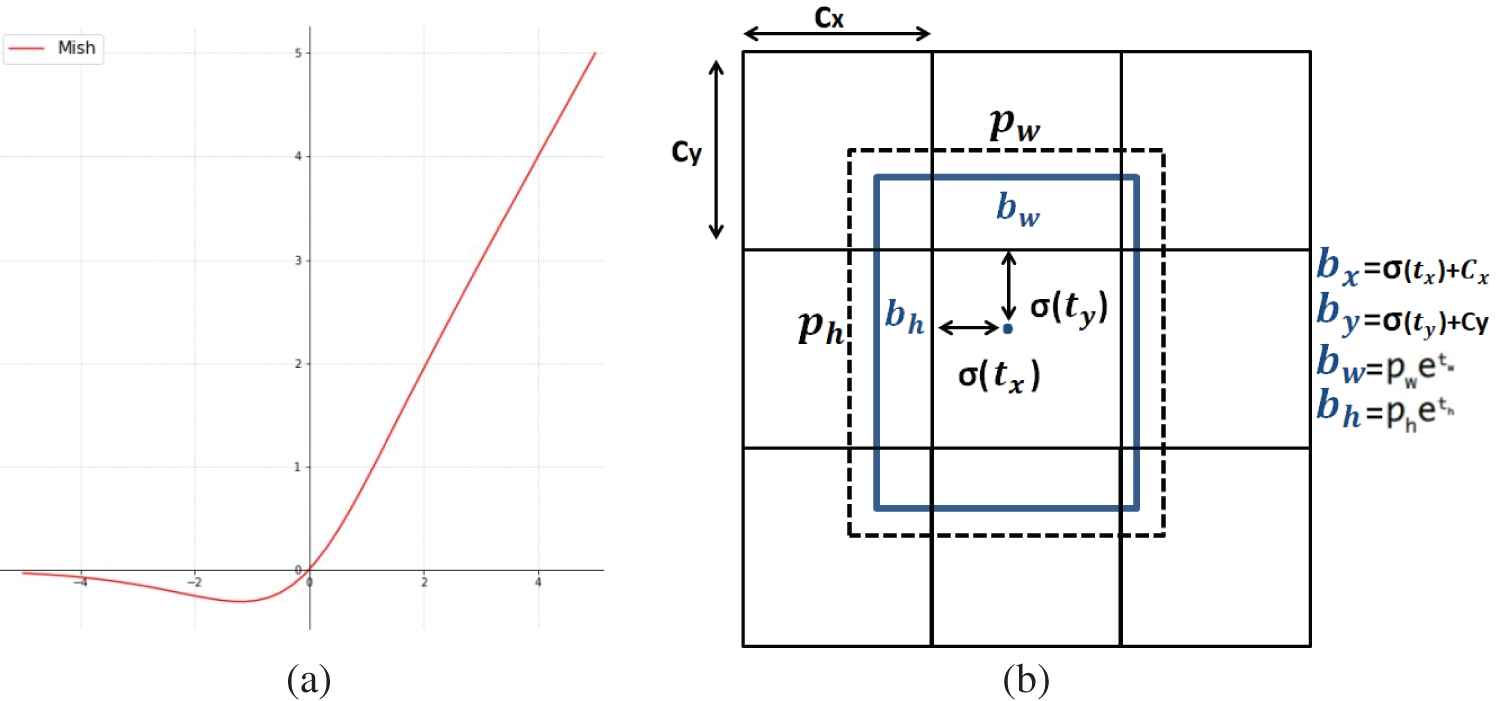
Figure 4: (a) MISH startup function (b) bounding boxes with prior dimensions and location predictions
This process is represented by Fig. 4b, where Cx and Cy represent the upper left corner coordinates of the area where the center point is located, respectively; Pw and Ph represent the width and height of the anchor, respectively; σ(tx) and σ(ty) represent the distance between the center point of the predicted frame and the upper left corner, respectively; and σ represents the sigmoid function, which limits the offset to the current grid and is conducive to model convergence. The variables tw and th represent the predicted width and height offset. The width and height of the anchor are multiplied by the indexed width and height to adjust the length and width of the anchor. The value σ(to) is the confidence prediction value, which is the result of multiplying the probability that the current box has a target multiplied by the IoU of the bounding box and ground truth [19,20].
Google Colaboratory (Google Colab) is a scripting environment for executable code running in the cloud. It is provided by Google as a virtual machine for developers and supports Python and machine learning TensorFlow algorithms. Its main feature is that it only needs a web browser to work and is completely free. With Colab, you can write and execute code, save and share results, and leverage powerful computing resources. All of this can be done using only a browser and Colab also combines with Google Drive as a data analysis tool. Code output and descriptive text can be combined into a collaborative archive [21]. In practical experiments, the Google Colab cloud environment was used to train YOLOv4 in object detection.
3.2.1 Adafruit Metro 3282 Board
Fig. 5a shows the Adafruit Metro 3282 board, which has 32 KB of flash memory and 2 KB of RAM. It runs at 16 MHz and has the Optiboot bootloader preloaded. Metro has two USB–serial converters that can be listened to by any computer and can transmit data to Metro. Metro can also be started and updated via a bootloader. The full-size model has 19 general purpose input/output (GPIO) pins and the mini model has 20 GPIOs, six of which are analog and two of which are reserved for the USB–serial converters. Six pulse-width modulators (one 16-bit, two 8-bit) are also provided on three timers. The Metro board provides an SPI port, a I2C port, and a UART (Universal Asynchronous Receiver/Transmitter) to USB port. The logic level is 5 V, but can be easily converted to 3.3 V by cutting solder jumpers. Metro also provides four indicator light-emitting diodes (LEDs) for easy debugging, including a green power LED; two Receive (RX)/Transmit (TX) LEDs for UART; and a red LED wired to pin PB5/digit #13.

Figure 5: (a) Adafruit metro 3282 board (b) AMG8833 8 × 8 infrared thermal array sensor (c) adafruit 1.44
3.2.2 AMG8833 8 × 8 Infrared Thermal Array Sensor
Infrared is a kind of non-visible light, with a wavelength located between microwave and visible light. Infrared wavelengths range from 760 nanometers to 1 millimeter, with longer wavelengths than red light, and the corresponding frequencies are in the range of about 430 THz to 300 GHz, as shown in Table 1. Most of the thermal radiation emitted by objects at room temperature is situated in this band. Infrared has the ability to penetrate some materials, and the reflection and absorption methods for different materials differ from ordinary visible light. Infrared rays are also distinguished according to different wavelength segments. Generally, segments are classified as near infrared rays, short wavelength infrared rays, medium wavelength infrared rays, long wavelength infrared rays, and far infrared rays. Infrared rays with a wavelength of 850 nm are commonly used in video surveillance applications [22].

Fig. 5b shows the AMG8833 8 × 8 infrared thermal array sensor which uses I2C to transmit data. The sensor can measure temperatures from 0°C to 80°C (32°F to 176°F) with an accuracy of +/−2.5°C (4.5°F). It can detect humans from a distance of up to 7 meters (23 feet). The maximum frame rate is 10 Hz, which is ideal for creating a customized mini thermal imager. It is also possible to communicate via an inter-integrated circuit (I2C) to the Arduino or sensor.
3.2.3 Thin Film Transistor Liquid Crystal Display (TFT–LCD)
A thin film transistor liquid crystal display is a type of liquid crystal display that uses thin film transistor technology to improve the quality of the image. Such displays are collectively referred to as LCD but in fact constitute an active matrix LCD, which is often used in flat-panel displays and televisions. The image elements in the LCD display panel are directly driven by voltage, and when one unit is controlled it will not affect other units. The three primary colors of the LCD (and each pixel) are red, green, and blue. Each color requires a separate cable [23].
Fig. 5c shows an Adafruit 1.44 display, a TFT–LCD screen capable of displaying full hexadecimal color codes with 128 × 128 pixels. It has a 3–5 V power level shifter for compatibility with 3.3 or 5 V logic, an onboard 3.3 V @ 150 mA low-dropout (LDO) regulator, and a built-in micro SD slot. The current consumption is based on LED backlight usage; full backlight consumption is about 25 mA.
3.2.4 Arduino Integrated Development Environment
Arduino is an open source embedded hardware platform, which is used to provide users with interactive embedded projects. Most of the Arduino series circuit boards are designed using AVR microcontrollers (from Alf-Egil Bogen and Vegard Wollan RISC microcontrollers, developed by the Atmel Corporation in 1996). These boards come with a set of digital and analog input/output pins that can be connected to a wide variety of expansion boards and breadboards or other circuits that have serial ports. A USB slot can also be used for loading programs from a personal computer. In terms of software programming, C or C++ are commonly used. In addition to using the traditional compilation toolchain, the Arduino project also provides an Integrated Development Environment (IDE) based on the Processing Language project.
The design of the proposed system of image recognition is shown in Fig. 6a The hardware is mainly composed of a computer and video camera. In practical experiments, the Colab cloud environment is provided with data and parameters for training. After training, the mask recognition results are output, and the frames displayed in the live streaming image screen for identification.
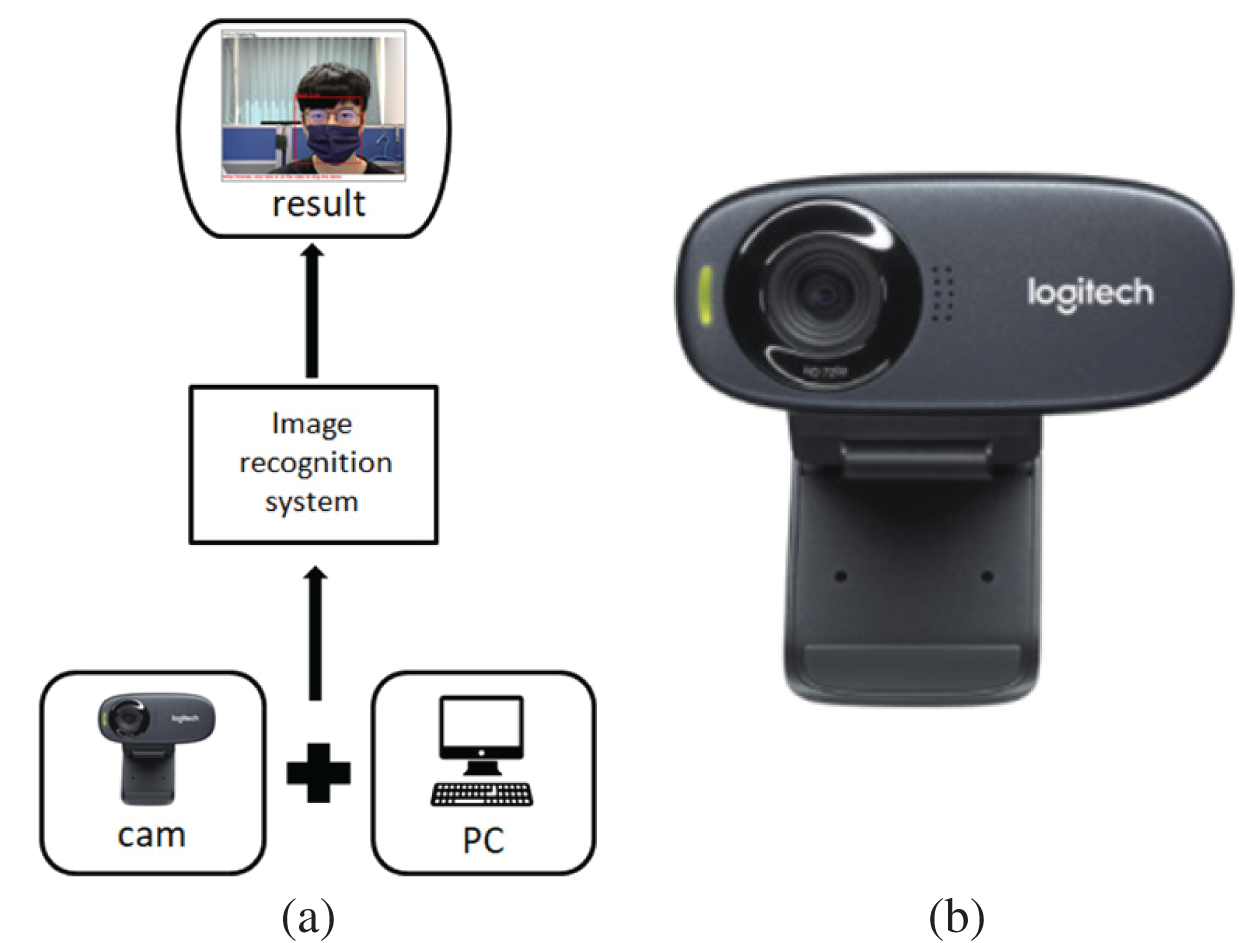
Figure 6: (a) Practical setup (b) logitech C310 HD webcam
Fig. 6b shows a Logitech C310 HD webcam with sharp and smooth widescreen format video calls (720 p/30 fps). With automatic light correction, the webcam can display vivid and natural colors in front of others, and the user can make high-resolution video calls. At 30 fps, the webcam provides smooth video quality with sharp, colorful, and contrasting images.
The architecture of the infrared thermal induction system is shown in Fig. 7. After the hardware device is connected, the program can be designed on the Arduino through its transmission method. The data obtained can not only be displayed in the Arduino sequence on the port monitoring window; real-time monitoring can also be achieved through the web monitoring platform Adafruit I/O, and the data can be stored in the cloud to achieve more complete data monitoring and analysis.
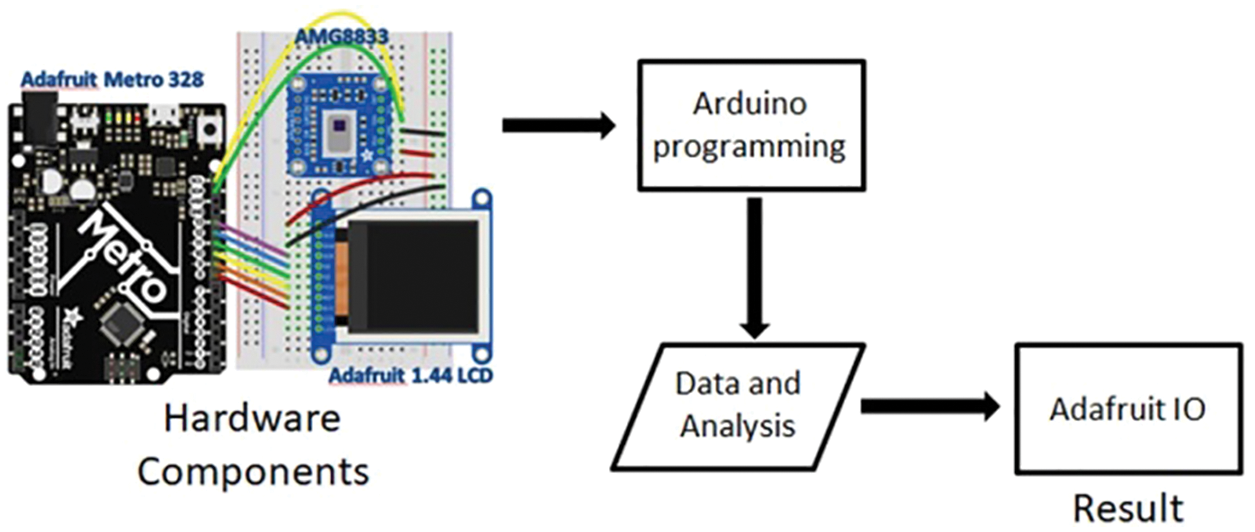
Figure 7: Infrared thermal induction system
3.4 Data Processing and Training
To optimize the accuracy of the model, the reliability of the data and the correct selection of data are both very important. Ideally, both must be error-free, and therefore the task of preprocessing is crucial. Because the object detection model requires a large number of images, in our experiments we collect a large amount of data from our mask datasets on the Internet and preprocess it. In order to improve performance, it is then necessary to enhance the data. There are many data enhancement techniques in the literature [24], all of which can help the model achieve a greater accuracy. Data annotation is also a very important stage in the process as the aim of the system is not only to identify an object, but also to inform the relevant authorities of its exact location. Of paramount importance is the design of the YOLOv4 neural network architecture, as described above. After training, YOLOv4 will select the best model, make predictions on image detection, and classify the results. A flowchart of the whole process is shown in Fig. 8 [25,26].
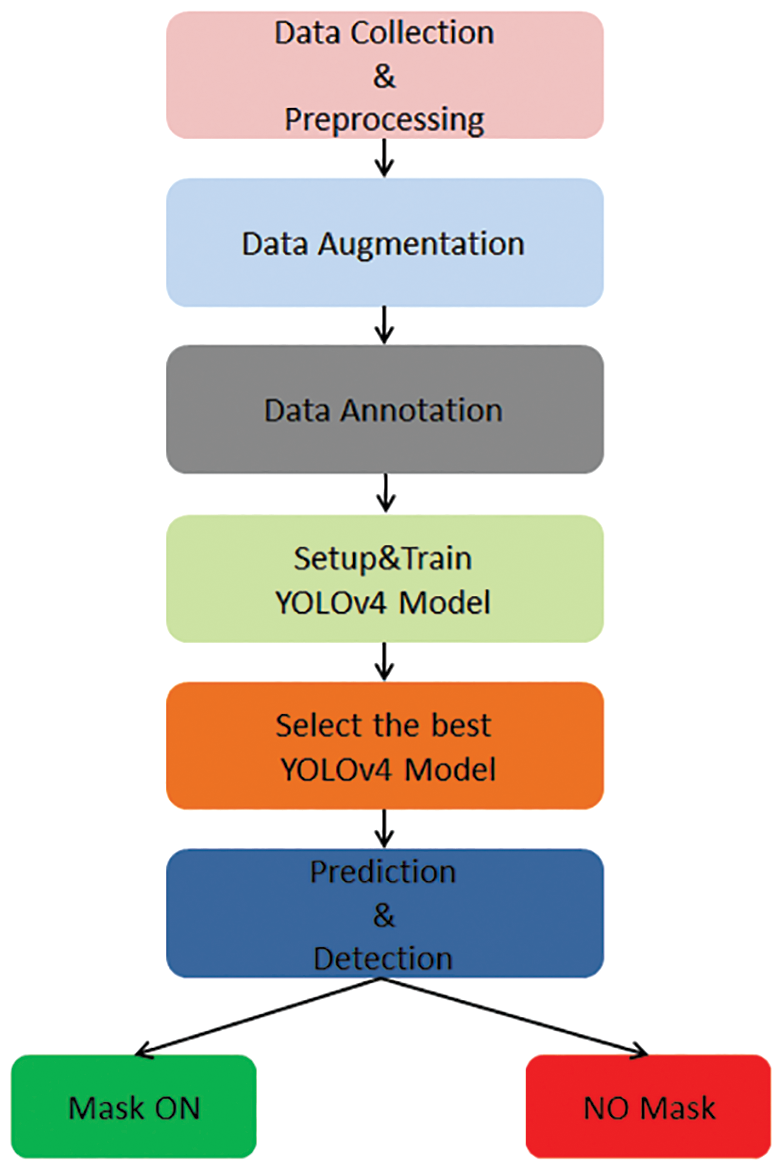
Figure 8: YOLOv4 flowchart
The results of our image recognition experiments are illustrated in Fig. 9. The system is trained using the model of YOLOv4 and the editing execution environment running on Google Colab, and the required results can be seen on the screen. Fig. 9a shows a frame marking mask identification; Fig. 9b shows a frame marking no-mask identification; and Fig. 9c shows a mixed picture of one person wearing a mask and the other not wearing a mask.

Figure 9: Experimental results: (a) mask (b) no mask (c) mixed state
4.2 Infrared Thermal Array Sensing
Fig. 10a shows the temperature display as the result of the infrared thermal sensing system. After the hardware device is connected, the code is uploaded to Arduino, the baud rate is set at 9600, and the serial console shows that the current room temperature is 26.19°C, indicating that the connection is successful.

Figure 10: (a) Real-time display window on the arduino (b) experimental results on adafruit I/O (c) LCD body temperature color display
As shown in Fig. 10b, Adafruit I/O is a web monitoring platform for overall infrared thermal sensing. It not only synchronizes the experimental results with a web page, but can also set a warning when the body temperature exceeds 37.5°C. It can accurately record the time and temperature, and achieve watertight monitoring. Fig. 10c shows how the body temperature of the measured person is displayed, and there will be different color changes according to different temperatures.
4.3 Analysis of YOLOv4 Experimental Results and Mask Data
The accuracy of the results of different identification methods is shown in Table 2. The results show that YOLOv4 has optimized its own model because of the use of cross-stage partial connections (CSP) Darknet53, the spatial pyramid pooling (SSP) network, and the path aggregation network (PAN). The table clearly shows that the level of accuracy is higher than that of the previous generation of YOLO (YOLOv3) and compared with the traditional Fast Region Convolutional Neural Network (Fast RCNN) and Faster RCNN. This is mainly because YOLOv4 makes independent predictions on different feature layers, which makes obvious the effect of improvements in small object detection [27].

The images were labeled using ‘Labellmg,’ a software tool for annotating graphical images. Fig. 11 shows that the coordinates of the target’s position in the image have been marked manually. Subsequently, the pictures can be saved and converted to the format that is required for training. Fig. 12 shows the level of accuracy in identifying a mask wearer and a no-mask wearer. A total of 1200 training set data were collected, 600 with masks and 600 without masks. The test set data consisted of 500 samples, 250 with masks and 250 without masks. Fig. 13 shows a line chart of the training loss. After 50 epochs of training, the loss is basically close to zero, and the training effect is very good [28].
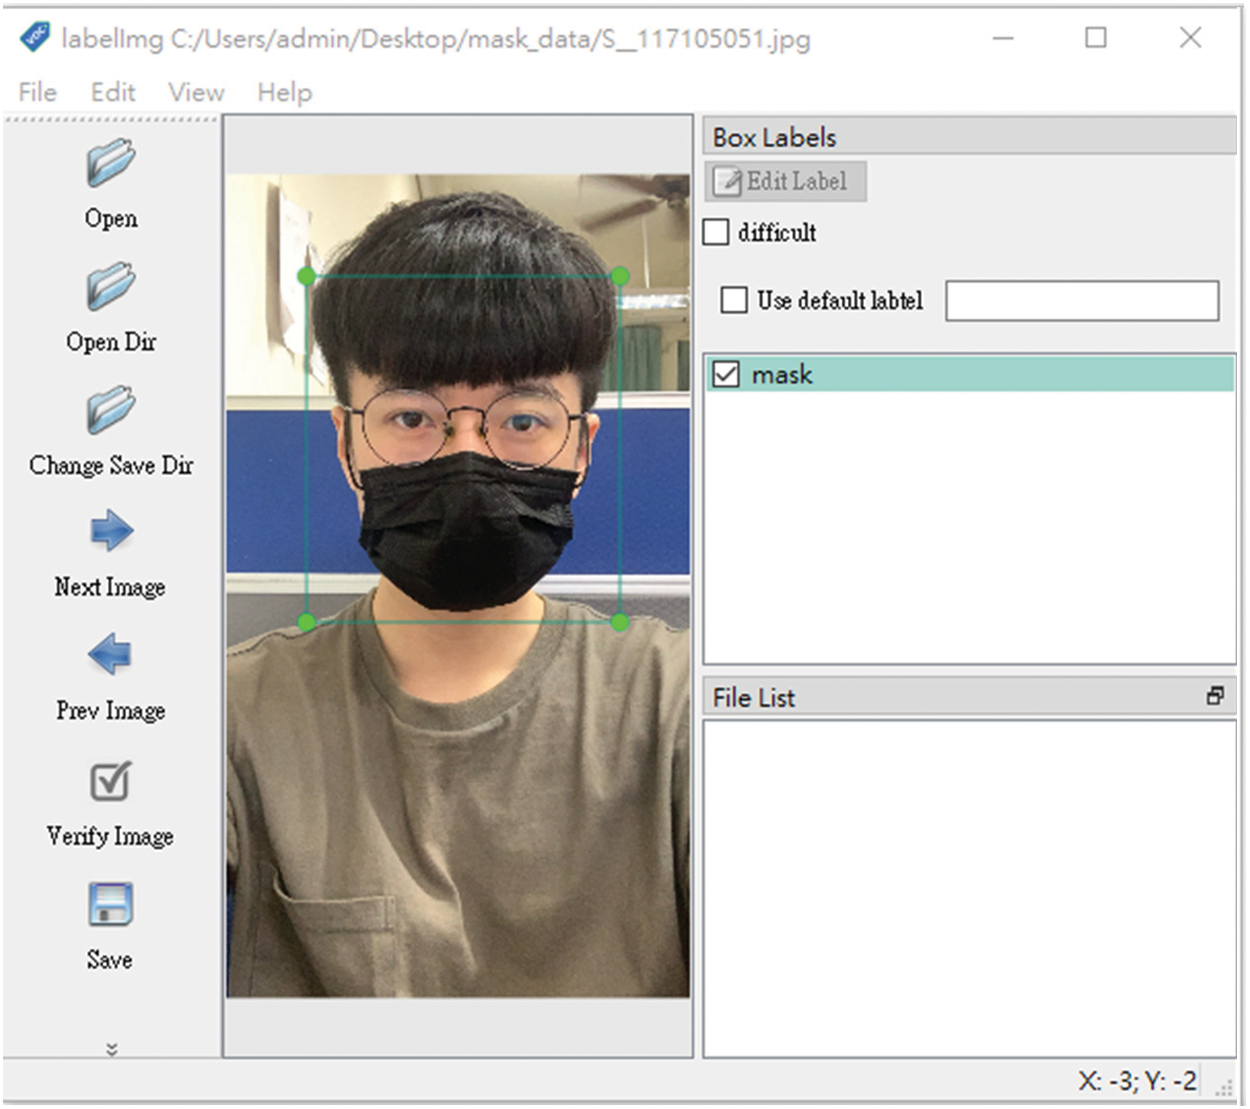
Figure 11: Using ‘Labellmg’ to label images
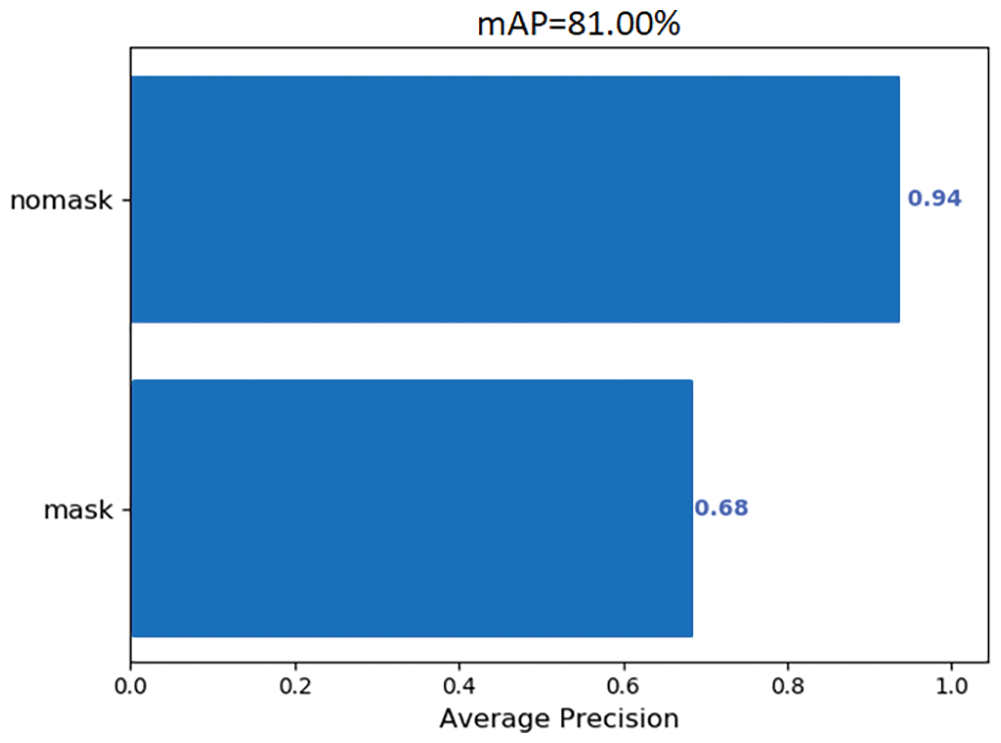
Figure 12: Accuracy: mask and no mask
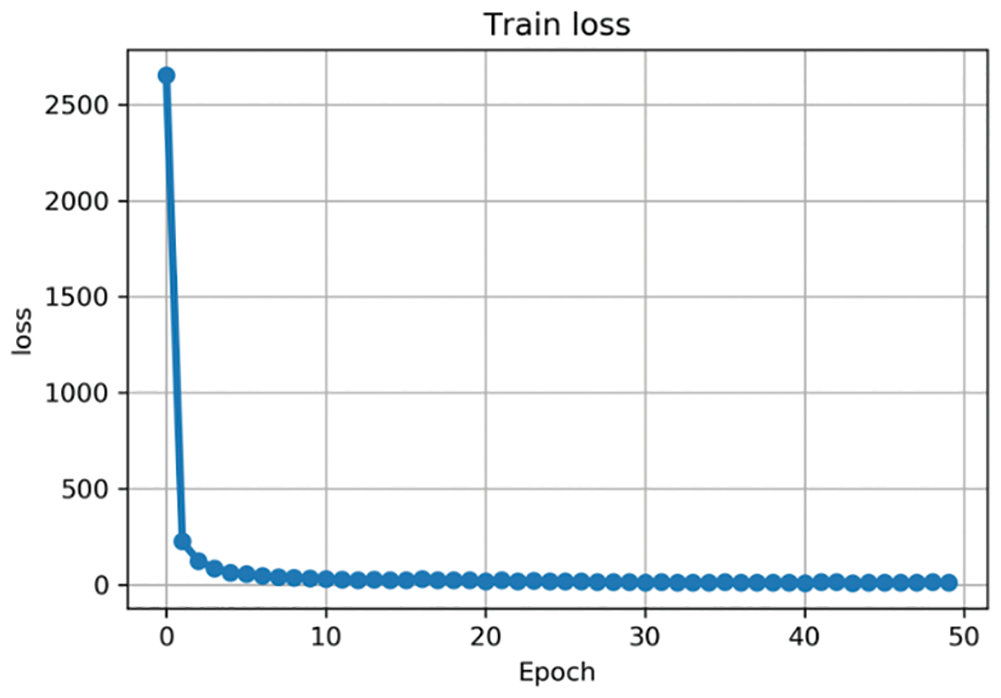
Figure 13: Training loss
4.4 Experiments on Identifying Different Types of Mask
There are many types of mask. In our experiments, samples of masks of different materials and types were used for training (Table 3) and the recognition accuracy was compared (Fig. 14). Images were labeled manually using ‘Labellmg,’ transferred to YOLO files for learning and training, and identified separately. The style of KN95 and N95 masks is slightly different from the surgical and cloth masks that are more commonly worn, but usually few people wear KN95 and N95 masks when outside. KN95 and N95 masks had a low recognition rate, but the more common masks reached a relatively high level of recognition. The number of training samples was not large, which might have impacted accuracy levels, but the results clearly indicate the gap in accuracy.

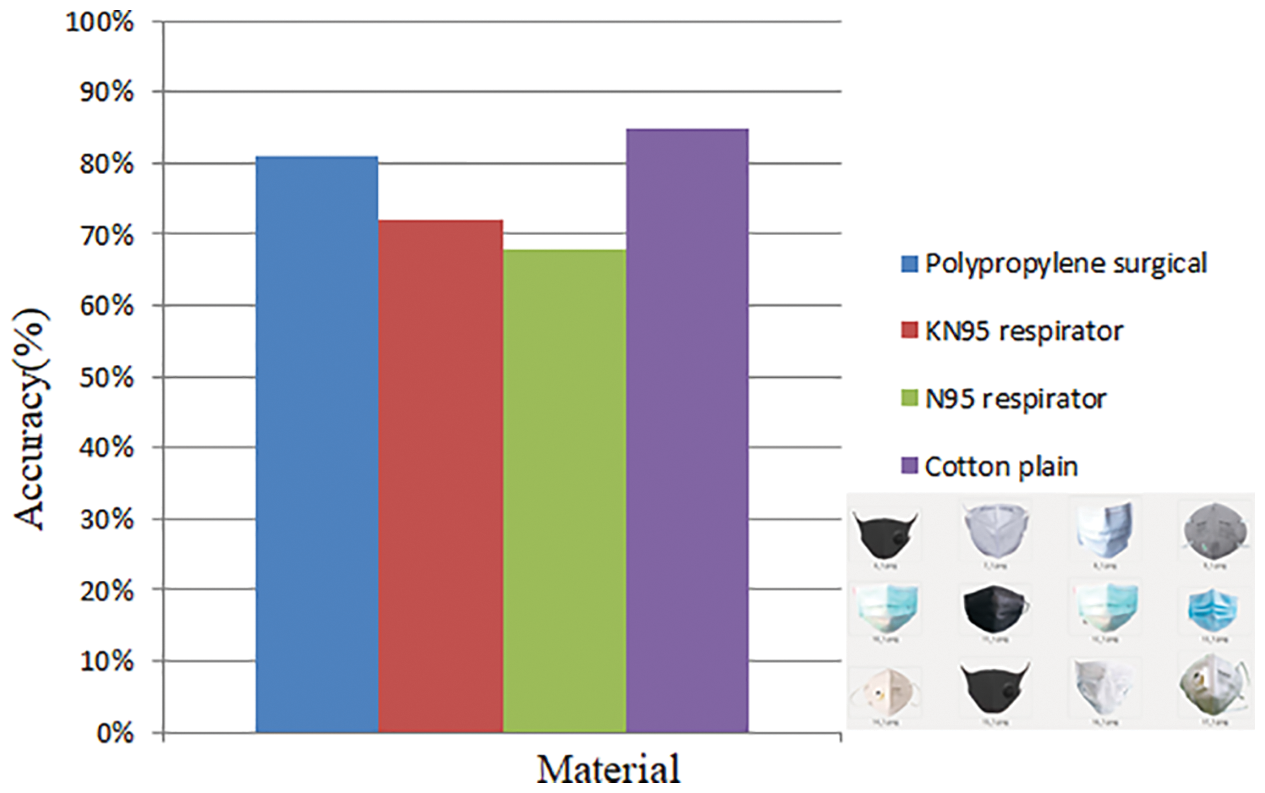
Figure 14: Recognition accuracy for different types of mask
One aim of this study was to combat the impact of the COVID-19 epidemic by monitoring its spread, using an image recognition system combined with an infrared thermal sensor module to monitor body temperature. Practical experiments used the YOLOv4 object detection method to train a CNN to recognize faces and masks, achieving a high level of accuracy in identification (81%), high efficiency, and a low computational cost. All monitoring data can be displayed on the Adafruit I/O cloud platform in real time, and can be stored and analyzed so that the body temperature of anyone captured by a camera at any point in time can be identified.
Our system combines deep learning and AIoT (Artificial Intelligence and the Internet of Things). It can not only be used for epidemic prevention purposes, but can also be combined with more sensors and different ideas according to the multiple applications of the Internet of Things. It can also be used in elderly care. For instance, a camera could be used to monitor movement and a sensor could detect a fall. It can also be combined with the cloud to send out emergency notifications, so that information can be obtained immediately and in real-time. Future work therefore could use the Internet of Things and deep learning to expand the range of applications.
Future work will also make better adjustments by changing the model or parameters in YOLOv4 to test and achieve more efficient experimental results. Current object detection technology is constantly evolving, and this study has only considered the YOLOv4 method. YOLO has been updated to new technologies, such as YOLOv7 and YOLOX, so that it can process the same amount of data faster and more efficiently, especially when faced with large amounts of data.
Acknowledgement: This research was supported by the Department of Electrical Engineering at National Chin-Yi University of Technology. The authors would like to thank the National Chin-Yi University of Technology, Takming University of Science and Technology, Taiwan, for supporting this research. We thank Cwauthors (www.cwauthors.com) for its linguistic assistance during the preparation of this manuscript.
Funding Statement: The authors received no specific funding for this study.
Conflicts of Interest: The authors declare that they have no conflicts of interest to report regarding the present study.
References
1. Y. Wang, L. Wang, Y. Jiang and T. Li, “Detection of self-build data set based on YOLOv4 network,” in Proc 2020 IEEE 3rd Int. Conf. on Information Systems and Computer Aided Education (ICISCAE), Dalian, China, pp. 640–642, 2020. [Google Scholar]
2. M. B. Ullah, “CPU based YOLO: A real time object detection algorithm,” in Proc 2020 IEEE Region 10 Symp. (TENSYMP), Dhaka, Bangladesh, pp. 552–555, 2020. [Google Scholar]
3. J. Redmon, S. Divvala, R. Girshick and A. Farhadi, “You only look once: Unified, real-time object detection,” in Proc 2016 IEEE Conf. on Computer Vision and Pattern Recognition (CVPR), Las Vegas, NV, USA, pp. 779–788, 2016. [Google Scholar]
4. L. L. Hung, “Adaptive devices for AIoT systems,” in Proc 2021 Int. Symp. on Intelligent Signal Processing and Communication Systems (ISPACS), Hualien City, Taiwan, pp. 1–2, 2021. [Google Scholar]
5. S. Jaju and M. Chandak, “A transfer learning model based on ResNet-50 for flower detection,” in Proc 2022 Int. Conf. on Applied Artificial Intelligence and Computing (ICAAIC), Salem, India, pp. 307–311, 2022. [Google Scholar]
6. T. N. Do, T. P. Pham and M. T. Tran-Nguyen, “Fine-tuning deep network models for classifying fingerprint images,” in Proc 2020 12th Int. Conf. on Knowledge and Systems Engineering (KSE), Can Tho, Vietnam, pp. 79–84, 2020. [Google Scholar]
7. A. Aboah, M. Shoman, V. Mandal, S. Davami, Y. Adu-Gyamfi et al., “A Vision-based system for traffic anomaly detection using deep learning and decision trees,” in Proc 2021 IEEE/CVF Conf. on Computer Vision and Pattern Recognition Workshops (CVPRW), Nashville, TN, USA, pp. 4202–4207, 2021. [Google Scholar]
8. B. Hao, S. Park and D. Kang, “Research on pedestrian detection based on faster R-CNN and hippocampal neural network,” in Proc 2018 Tenth Int. Conf. on Ubiquitous and Future Networks (ICUFN), Prague, Czech Republic, pp. 748–752, 2018. [Google Scholar]
9. N. S. Mishra and S. Dhabal, “Medical image fusion using local IFS-entropy in NSST domain by stimulating PCNN,” in Proc 2020 IEEE 1st Int. Conf. for Convergence in Engineering (ICCE), Kolkata, India, pp. 389–392, 2020. [Google Scholar]
10. K. D. Rusakov, “Automatic modular license plate recognition system using fast convolutional neural networks,” in Proc 2020 13th Int. Conf. “Management of Large-Scale System Development” (MLSD), Moscow, Russia, pp. 1–4, 2020. [Google Scholar]
11. T. S. Kim, J. Bae and M. H. Sunwoo, “Fast convolution algorithm for convolutional neural networks,” in Proc 2019 IEEE Int. Conf. on Artificial Intelligence Circuits and Systems (AICAS), Hsinchu, Taiwan, pp. 258–261, 2019. [Google Scholar]
12. Y. Liu, M. Xiang, X. Zhao and R. Zhou, “Design of fast image recognition accelerator based on convolutional neural network,” in Proc 2020 4th Annual Int. Conf. on Data Science and Business Analytics (ICDSBA), Changsha, China, pp. 304–307, 2020. [Google Scholar]
13. S. Javed, A. Mahmood, J. Dias and N. Werghi, “CS-RPCA: Clustered sparse RPCA for moving object detection,” in Proc 2020 IEEE Int. Conf. on Image Processing (ICIP), Abu Dhabi, United Arab Emirates, pp. 3209–3213, 2020. [Google Scholar]
14. J. Liu and L. Liu, “Helmet wearing detection based on YOLOv4-MT,” in Proc 2021 4th Int. Conf. on Robotics, Control and Automation Engineering (RCAE), Wuhan, China, pp. 1–5, 2021. [Google Scholar]
15. Z. Qiang, W. Yuanyu, Z. Liang, Z. Jin, L. Yu et al., “Research on real-time reasoning based on JetSon TX2 heterogeneous acceleration YOLOv4,” in Proc 2021 IEEE 6th Int. Conf. on Cloud Computing and Big Data Analytics (ICCCBDA), Chengdu, China, pp. 455–459, 2021. [Google Scholar]
16. B. Wang, Y. Liu, W. Xiao, Z. Xiong and M. Zhang, “Positive and negative max pooling for image classification,” in Proc 2013 IEEE Int. Conf. on Consumer Electronics (ICCE), Las Vegas, NV, USA, pp. 278–279, 2013. [Google Scholar]
17. L. Xu, J. Wang, X. Li, F. Cai, Y. Tao et al., “Performance analysis and prediction for mobile internet-of-things (IoT) networks: A CNN approach,” IEEE Internet of Things Journal, vol. 8, no. 17, pp. 13355–13366, 2021. [Google Scholar]
18. J. He, “Mask detection device based on YOLOv3 framework,” in Proc 2020 5th Int. Conf. on Mechanical, Control and Computer Engineering (ICMCCE), Harbin, China, pp. 268–271, 2020. [Google Scholar]
19. R. Yang and Y. Chen, “Design of a 3-D infrared imaging system using structured light,” IEEE Transactions on Instrumentation and Measurement, vol. 60, no. 2, pp. 608–617, 2011. [Google Scholar]
20. Y. Li, S. Huang, N. Rong, J. G. Lu, C. P. Chen et al., “Transmissive and transflective blue-phase LCDs with double-layer IPS electrodes,” Journal of Display Technology, vol. 12, no. 2, pp. 122–128, 2016. [Google Scholar]
21. T. Carneiro, R. V. M. D. NóBrega, T. Nepomuceno, G. B. Bian, V. H. C. D. Albuquerque et al., “Performance analysis of google colaboratory as a tool for accelerating deep learning applications,” IEEE Access, vol. 6, pp. 61677–61685, 2018. [Google Scholar]
22. K. V. Sathyamurthy, A. R. S. Rajmohan, A. R. Tejaswar, V. Kavitha and G. Manimala, “Realtime face mask detection using TINY-YOLOv4,” in Proc 2021 4th Int. Conf. on Computing and Communications Technologies (ICCCT), Chennai, India, pp. 169–174, 2021. [Google Scholar]
23. K. Zhang, X. Jia, Y. Wang, H. Zhang and J. Cui, “Detection system of wearing face masks normatively based on deep learning,” in Proc 2021 Int. Conf. on Control Science and Electric Power Systems (CSEPS), Shanghai, China, pp. 35–39, 2021. [Google Scholar]
24. S. I. Ali, S. S. Ebrahimi, M. Khurram and S. I. Qadri, “Real-time face mask detection in deep learning using convolution neural network,” in Proc 2021 10th IEEE Int. Conf. on Communication Systems and Network Technologies (CSNT), Bhopal, India, pp. 639–642, 2021. [Google Scholar]
25. C. H. Tseng, M. W. Lin, J. H. Wu, C. C. Hsieh and H. H. Lin, “Application of people flow and face mask detection for smart anti-epidemic,” in Proc 2021 Int. Symp. on Intelligent Signal Processing and Communication Systems (ISPACS), Hualien City, Taiwan, pp. 1–2, 2021. [Google Scholar]
26. R. R. Mahurkar and N. G. Gadge, “Real-time covid-19 face mask detection with YOLOv4,” in Proc 2021 Second Int. Conf. on Electronics and Sustainable Communication Systems (ICESC), Coimbatore, India, pp. 1250–1255, 2021. [Google Scholar]
27. V. S. Sindhu, “Vehicle identification from traffic video surveillance using YOLOv4,” in Proc 2021 5th Int. Conf. on Intelligent Computing and Control Systems (ICICCS), Madurai, India, pp. 1768–1775, 2021. [Google Scholar]
28. Z. Qin, Z. Guo and Y. Lin, “An implementation of face mask detection system based on YOLOv4 architecture,” in Proc 2022 14th Int. Conf. on Computer Research and Development (ICCRD), Shenzhen, China, pp. 207–213, 2022. [Google Scholar]
Cite This Article
 Copyright © 2023 The Author(s). Published by Tech Science Press.
This work is licensed under a Creative Commons Attribution 4.0 International License , which permits unrestricted use, distribution, and reproduction in any medium, provided the original work is properly cited.


 Submit a Paper
 Propose a Special lssue
 View Full Text
 Download PDF
 Downloads
 Citation Tools