
 Submit a Paper
 Propose a Special lssue
 Open Access
ARTICLE

Weight Prediction Using the Hybrid Stacked-LSTM Food Selection Model
1 Faculty of Computers and Information, Computer Science Department, Suez University, Suez, Egypt
2 Faculty of Artificial Intelligence, Kafrelsheikh University, Kafrelsheikh, 33511, Egypt
3 Faculty of Computers and Information, Computer Science Department, Mansoura University, 35561, Egypt
4 Faculty of Physical Education, Track and Field Competitions Department, Arish University, Egypt
5 Delta Higher Institute of Engineering and Technology, Mansoura, 35111, Egypt
6 Department of Computer Science, Arab East Colleges, Riyadh, 13544, Saudi Arabia
* Corresponding Author: Mahmoud Y. Shams. Email:
Computer Systems Science and Engineering 2023, 46(1), 765-781. https://doi.org/10.32604/csse.2023.034324
Received 13 July 2022; Accepted 18 August 2022; Issue published 20 January 2023
 View Full Text
 Download PDF
Abstract
Food choice motives (i.e., mood, health, natural content, convenience, sensory appeal, price, familiarities, ethical concerns, and weight control) have an important role in transforming the current food system to ensure the healthiness of people and the sustainability of the world. Researchers from several domains have presented several models addressing issues influencing food choice over the years. However, a multidisciplinary approach is required to better understand how various aspects interact with one another during the decision-making procedure. In this paper, four Deep Learning (DL) models and one Machine Learning (ML) model are utilized to predict the weight in pounds based on food choices. The Long Short-Term Memory (LSTM) model, stacked-LSTM model, Conventional Neural Network (CNN) model, and CNN-LSTM model are the used deep learning models. While the applied ML model is the K-Nearest Neighbor (KNN) regressor. The efficiency of the proposed model was determined based on the error rate obtained from the experimental results. The findings indicated that Mean Absolute Error (MAE) is 0.0087, the Mean Square Error (MSE) is 0.00011, the Median Absolute Error (MedAE) is 0.006, the Root Mean Square Error (RMSE) is 0.011, and the Mean Absolute Percentage Error (MAPE) is 21. Therefore, the results demonstrated that the stacked LSTM achieved improved results compared with the LSTM, CNN, CNN-LSTM, and KNN regressor.Keywords
Food choices have a significant impact on the long-term viability of modern diets; therefore, knowing consumer dietary patterns is critical in accomplishing sustainability objectives. Understanding food choices is difficult due to the wide range of elements that influence them, including socio-demographic characteristics, attitudes, beliefs, conventions, consumption environments, and cultural settings. Beyond the aforementioned elements, insights into food decision reasons are useful in comprehending food choices. Food choice motives are the reasons or motives that customers have for selecting or eating food [1]. In the context of long-term food exhaustion, the significance of insights into consumers’ food choice reasons has been demonstrated. Some reasons, e.g., concern for the environment, might be regarded as supportive of sustainable food choices, while others may be seen as roadblocks to making sustainable dietary choices (as, when sustainable food is less delicious or less adequate). Furthermore, various underlying motives can be used to justify various types of sustainable eating choices. Because of the possibility for disputes and trade-offs among varied dietary preferences, it is crucial to investigate sustainability reasons across a wide range of conceivable food-choice factor [2]. Obesity and overweight are significant risk factors for some chronic diseases, such as cancer, cardiovascular, and diabetes disease. Overweight is a public health issue with limited pharmaceutical treatments. It is unknown if individuals with obesity may lose weight with semaglutide at a dosage of 2.4 mg once a week as well as lifestyle adjustments [3]. Variation in obesity incidence among nations may be described by the ‘caloric ecosystem dynamics’: elements affecting food production, consumption, distribution, culture of food, and habits on a wide scale [4]. Finding the link between obesity and food sales is a huge task that has recently been called into doubt. Traditional regression procedures restrict the study to a narrow range of factors and apply independence and linearity assumptions. When it comes to predicting the impact of variations in national diets made up of closely related food categories, these assumptions are virtually likely broken. Instead, we will look at a machine learning (ML) technique, which, unlike first-principles approaches, does not require the analyst to describe a functional form of the model [5]. Machine learning systems employ training samples to uncover patterns and, eventually, to accurately predict future trends. Traditional machine learning methods have often been insufficient with the development of machine learning methodologies, as well as the scale and complexity of data processing. Accordingly, deep learning algorithms have been created, which have more complex structures and greater power in data analysis. Deep learning, also known as a deep neural network (DNN), is a learning method that involves recursive processes in several layers to develop a deep structure and produce a model. Although the interpretation of deep learning is inferior to the interpretation of classical machine-learning approaches, its learning performance is greater [6]. Over time, scientists from many fields have generated issues affecting food choice in conceptual models, which have been identified as a critical lever for improving human and planetary health. However, an interdisciplinary strategy is necessary to understand how different aspects interact with each other in the decision-making process [7]. In this paper, we find that integrating ML and DL techniques in global health can improve predictions and explore rich combinations among the available data, thus improving our understanding of health challenges and aiding the development of new policies. Especially in the areas of nutrition and obesity, the contribution of this paper is the use of the ML method, that is, the K-Nearest Neighbor (KNN)), and four deep learning models are the Long Short-Term memory model (LSTM), the stacked-LSTM model and the Convolutional Neural Network model (CNN) and the CNN-LSTM model to predict pound weight from food selection data. The remainder of this paper is laid out as follows. The literature review is covered in Section 2. The proposed methodology is described in Section 3. Findings and discussions are provided in Section 4. Section 5 presents the conclusions of this study.
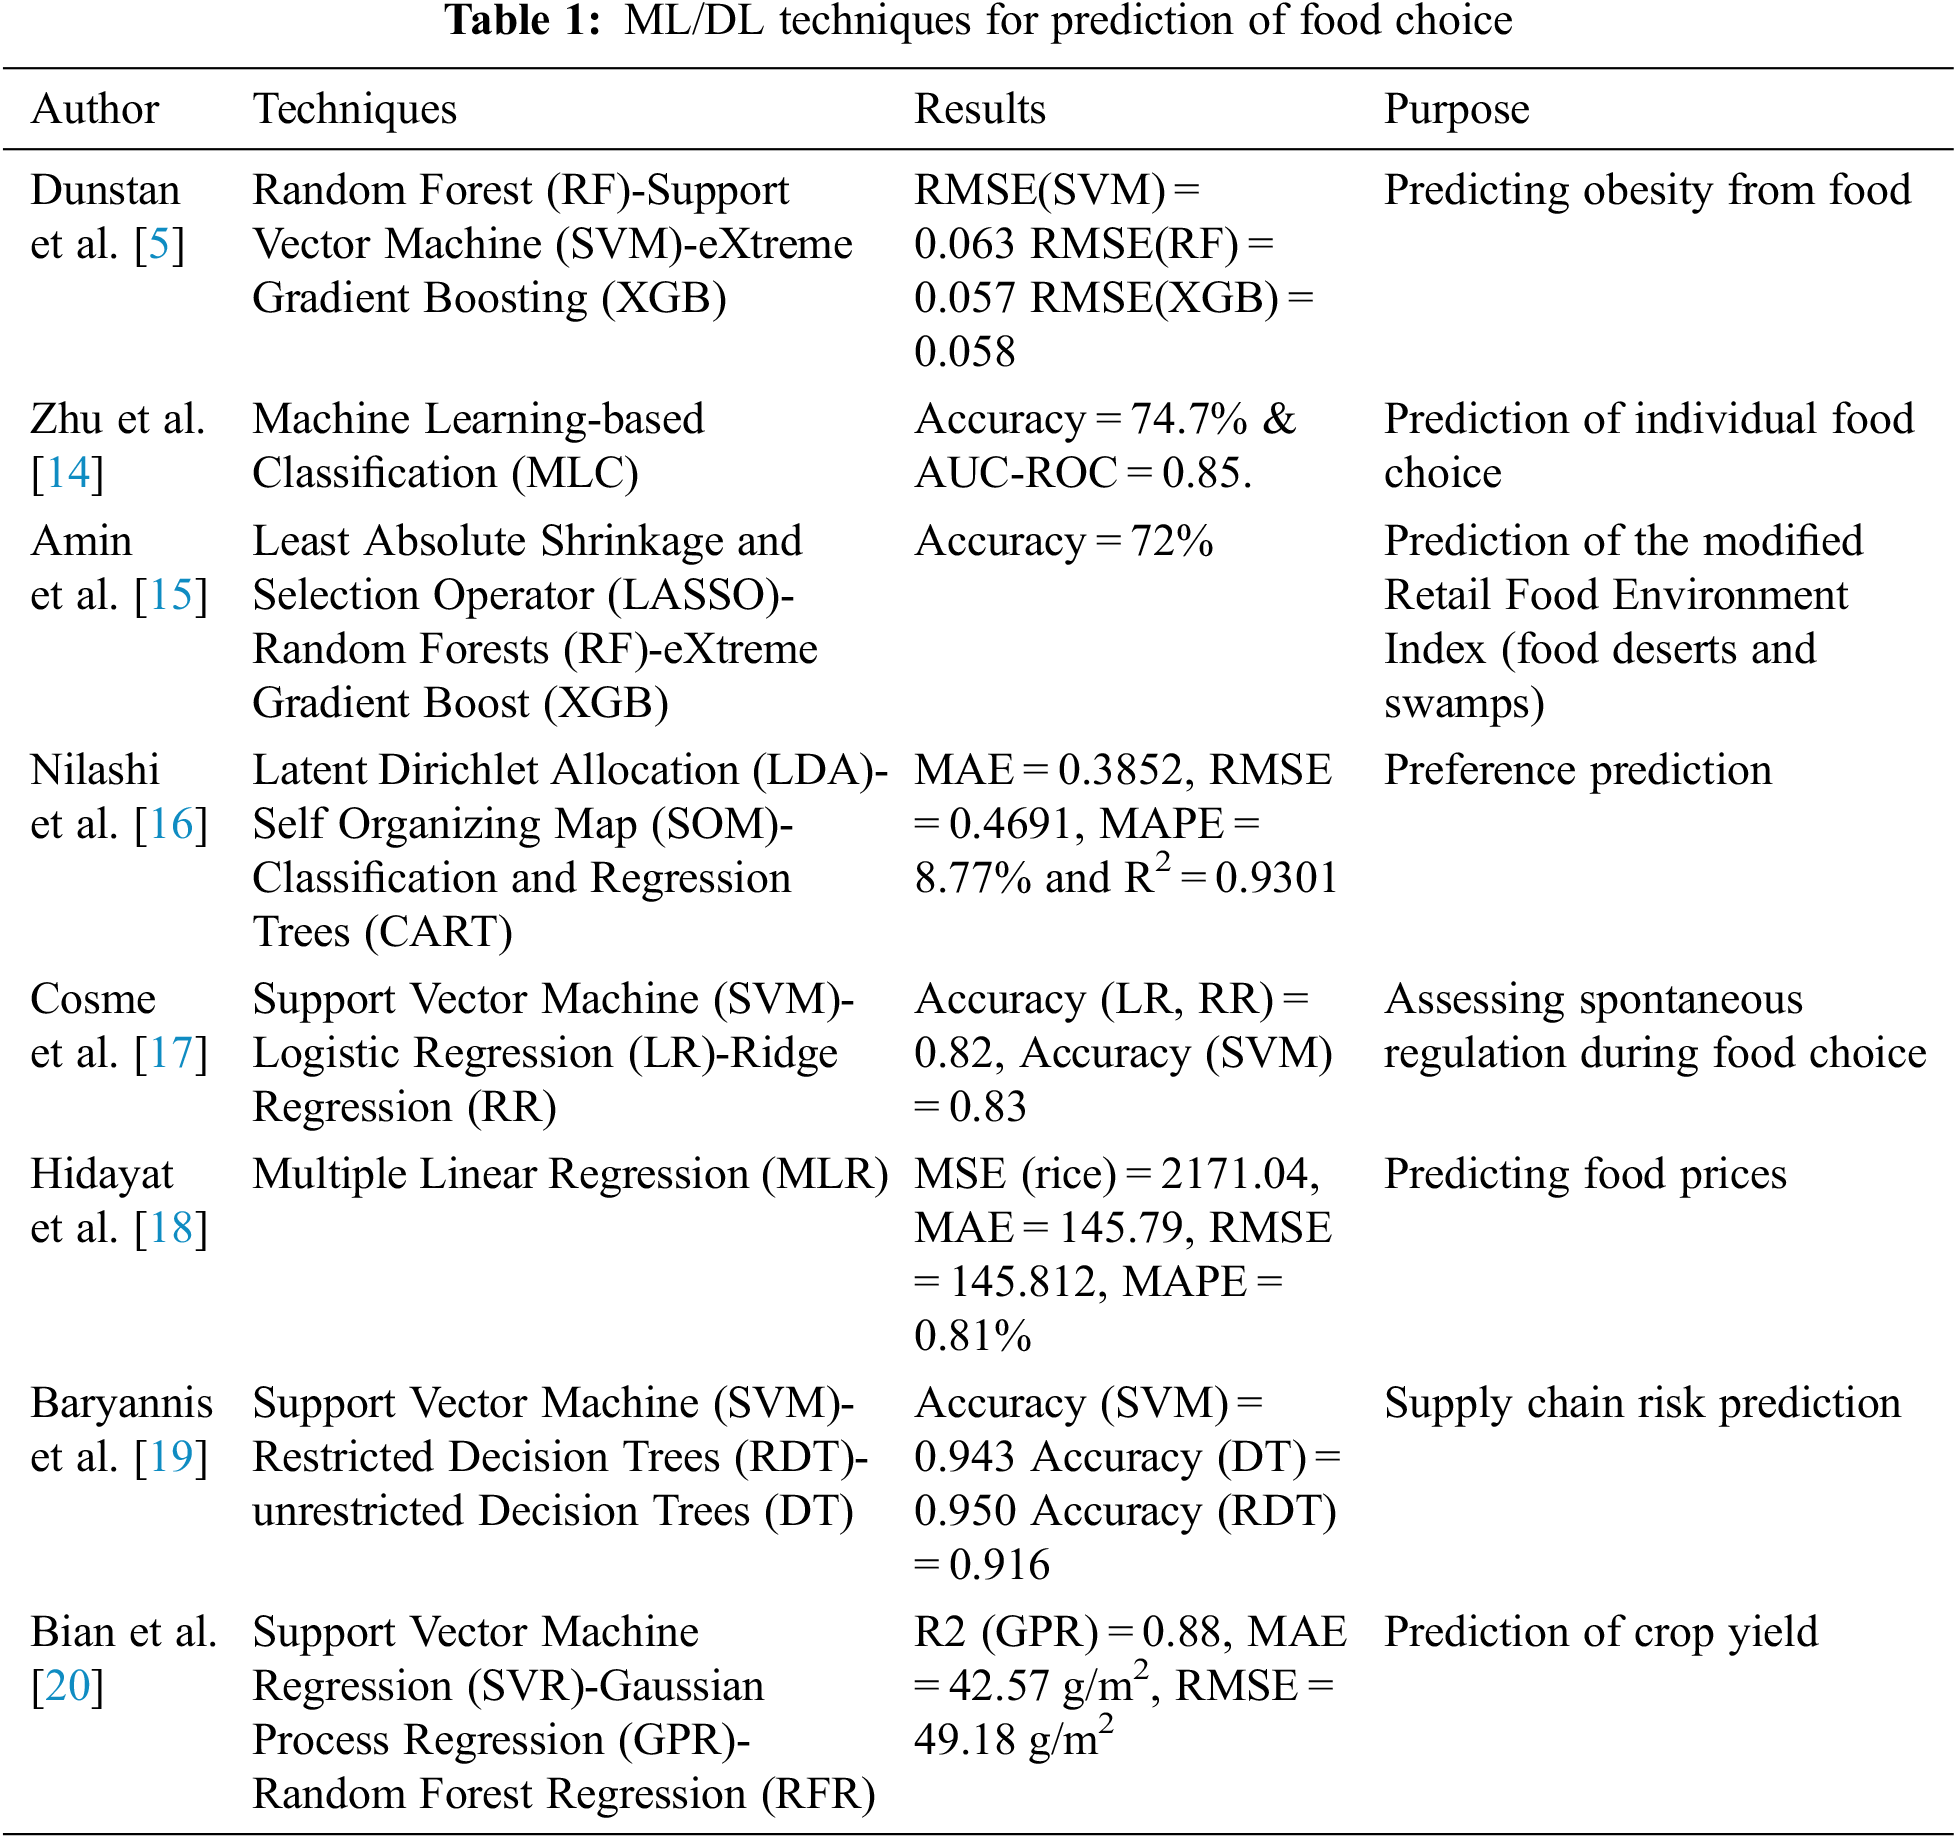
Bi et al. [8] presented a deep learning approach that employed an Auto-Encoder to acquire product attributes from expert-scored sensorial traits, and the sensory data gained was retreated on customer needs using SVM analysis. To verify the total learning process, feature grouping, hedonic contour mapping, and model performance evaluation were used. The findings demonstrated that the DL approach can provide an adequate level of precision, and the hedonic mapping displayed might be of considerable use to manufacturers’ product design or adjustments. Pellegrini et al. [9] looked at weight changes and eating patterns in a group of obese outpatients following a month of compulsory confinement during the COVID-19 epidemic in Northern Italy. By completing the questionnaire, a regression analysis with several variables was done to investigate the connections between BMI/weight modifications and the studied factors. They concluded that less exercise, solitude/boredom, depression/anxiety, increased eating, snacking, deleterious meals, grains, and dessert were all associated with considerably greater weight increasing. Hintze et al. [10] examined the effects of changes in Reinforcing Relative Value (RRV) of impulsivity and food could anticipate weight and structure variations in women who are overweight or obese participating in either quick or gradual weight reduction plans. The findings showed that varying rates of weight reduction had no effect on RRV snacking or impulsivity. Nevertheless, variations in RRV snack anticipated weight or fat mass (FM) decreased, indicating that dietary therapies that either reduce or encourage RRV snack decreases produced a greater reduction in obese. Gere et al. [11] provided a classification approaches for food preference prediction. Thirteen classification models were developed and evaluated after variable filtering. The models were compared using the approach of the summing of ranking variances based on performance metrics. The approach categorized the algorithms by matching the ranks of their evaluation matrix to a specified gold criterion. In each case, decision tree-based approaches outscored all others, regardless of the selection tasks or food product groupings. Between the classifiers, the cost-sensitive decision tree algorithm and Quinlan’s C4.5 achieved higher accuracy than other approaches. Depa et al. [12] studied food-choice motivations in relation to both features of Orthorexia. They investigated the association between Orthorexia, age, food-choice reasons, sexuality, and BMI. The motivations that predicted dietary preferences in healthy orthorexia and orthorexia-nervosa were very dissimilar. Therefore, orthorexia-nervosa, weight control with sensory resumption and mood regulation were the main motivations that exhibited substantial connections. The major motivation for healthy orthorexia was health context, with sensory resumption and price also exhibiting considerable relationships between the lends credence to the concept that Orthorexia nervosa is linked to maladaptive eating habits that are driven by weight control rather than health issues. Nogales et al. [13] presented a study for predicting food and feed risk concerns. Deep learning combined with entity embedding proved to be the optimum collection, with an accuracy reached to 86.81%, 82.31%, and 88.94% throughout each of the simplified Rapid Alert System for Food and Feed (RASFF) process’ three steps in which the experiments were performed. Nevertheless, the Random Forest (RF) systems using a single encoding provided only inferior outcomes, suggesting that the coding had a greater impact on the quality of the findings than the forecasting approach. Table 1 illustrates some of the machine learning and deep learning techniques for different aspects of prediction based on food choice. In the next section, we will discuss the recommended ML/DL techniques for the prediction of weight in pounds based on food choice in the proposed methodology. Moreover, in [14–20], ML approaches are presented to predict suitable food selection with respect to individual choice, food environment, and preference, and obesity, regulation during food choice, food prices, supply chain risk prediction, and crop yield prediction. Shams et al. [21] present a healthy nutrition analysis, as they recommended a suitable diet during the COVID-19 pandemic.
Finding the link between food choices and weight from basic principles is a huge task that has recently been called into doubt. Traditional regression procedures restrict the study to a narrow range of factors and apply independence and linearity assumptions [22]. When modelling the influence of disparities in national dietary habits composed of strongly associated food groups, these assumptions are virtually likely broken. Alternatively, we will look at a Machine Learning (ML) technique, which, unlike first-principles approaches, does not require the investigator to describe a functional method of the approach [23]. Deep Learning (DL) models display remarkable capabilities in classification/regression tasks when appropriate data representing the relevant problem is available. Deep learning approach has begun to be employed in the area of dietetics due to its high power of automatic feature learning, mostly for food calories computation, vegetable and fruit quality assessment, and classification of food categories, and so on [24]. A food recommendation using heuristics and ontology is presented in [25]. Fig. 1 shows the system of proposed methodology using different ML and DL techniques to predict weight from food choice. Machine learning is a subset of artificial intelligence that entails models capable of collecting relevant data from input and using that information for self-learning to make accurate categorization or prediction. Machine learning has grown in prominence because of its accuracy and dependability. Artificial Neural Network (ANN), Decision Trees (DT), Fuzzy Logic (FL), k-means clustering, Nave Bayes (NB), Random Forest (RF), K-Nearest Neighbor (KNN) and Support Vector Machines (SVM). In this paper, the K-Nearest Neighbor (KNN) regressor as a machine learning approach is proposed for the prediction of weights in pound based on food choices.
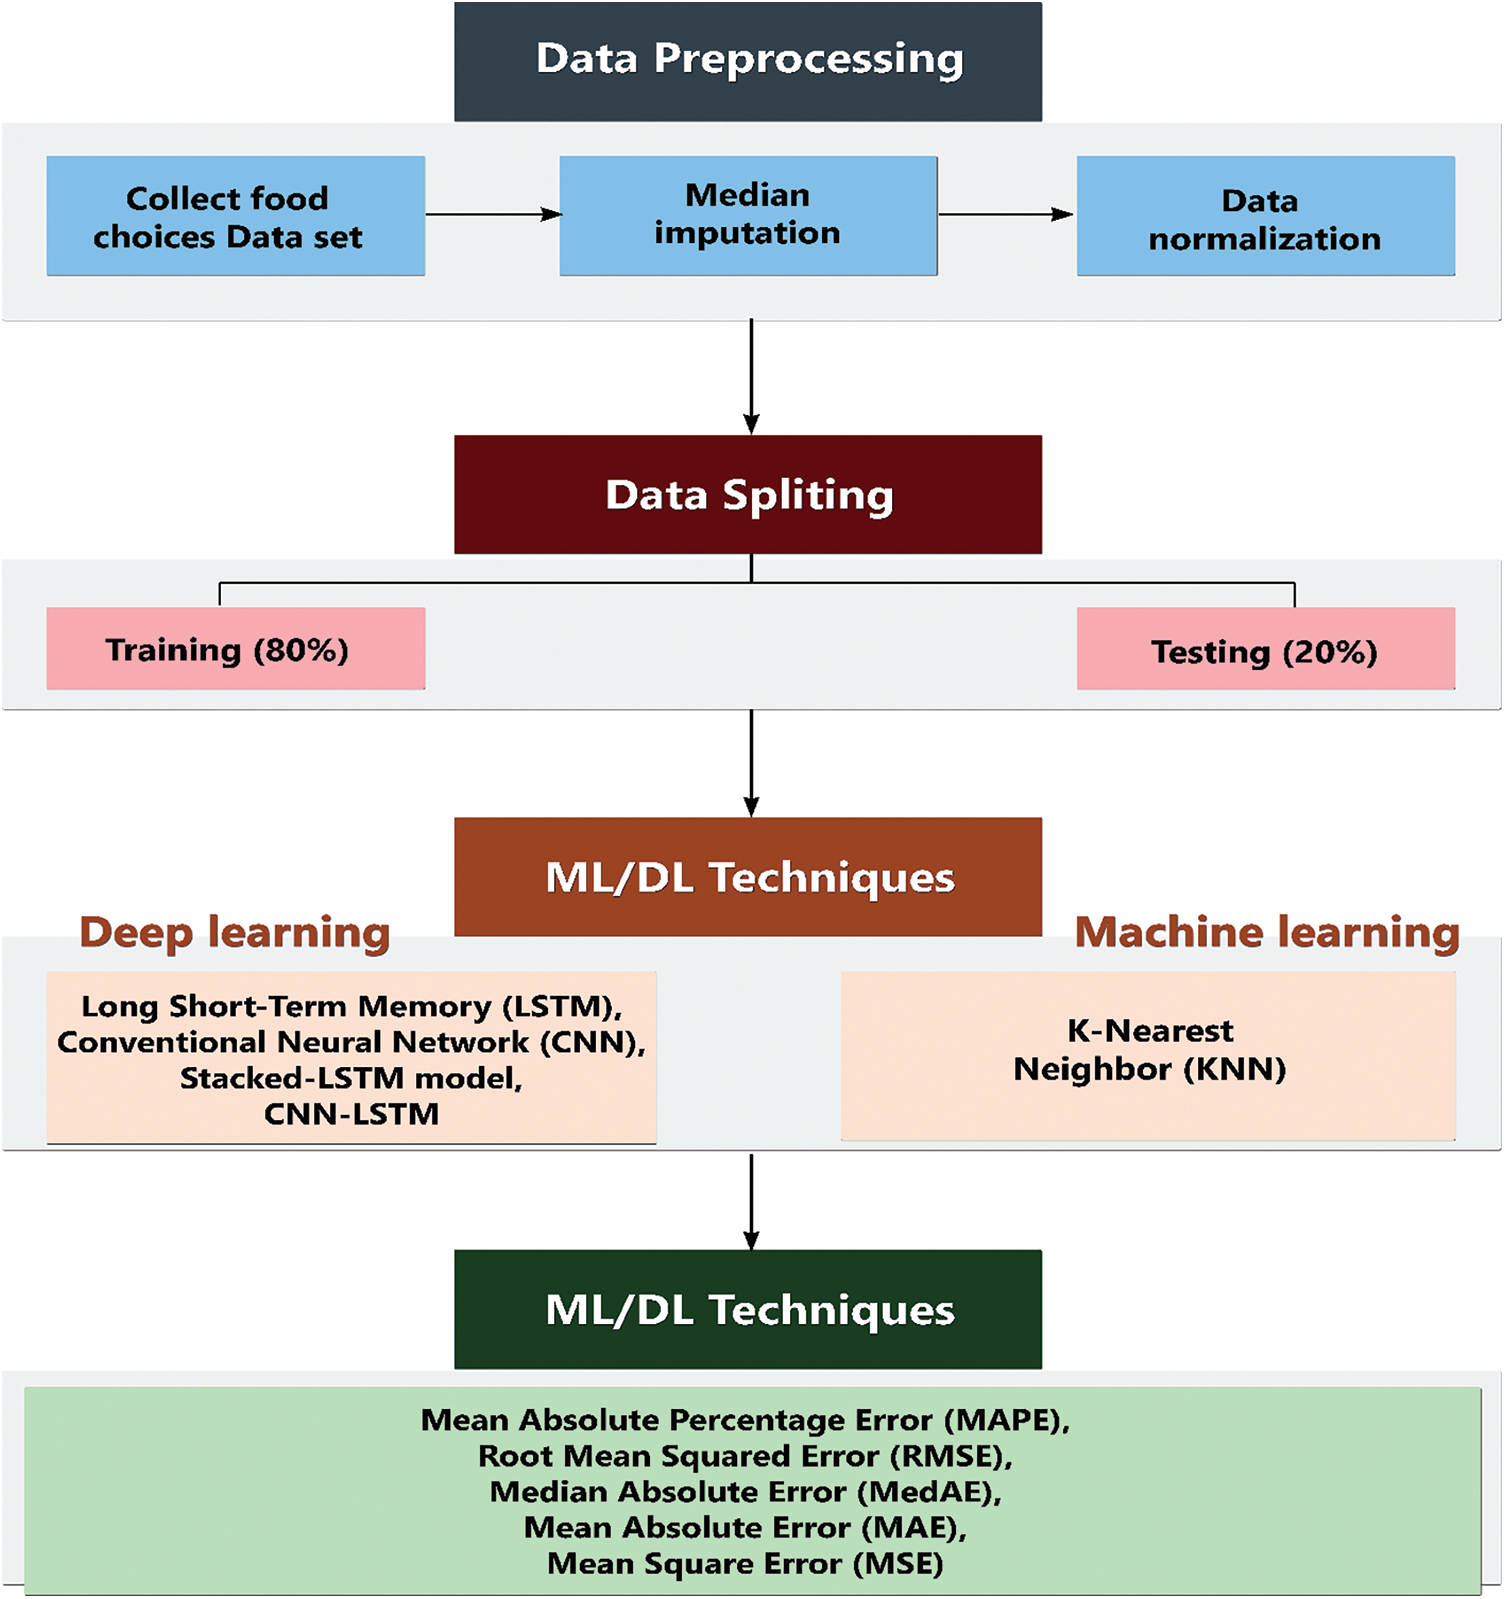
Figure 1: System of the proposed methodology
The distance between various trait values is calculated using KNN to execute classification. The idea is that if the majority of the K similar samples in the trait space (the feature space’s nearest neighbors) belong to a particular group, then the sample does as well. K is generally an integer less than or equal to 20. The chosen neighbors in the KNN approach are all samples that have been accurately categorized. Based on the categorized choice of the nearest samples, this technique solely determines the class to which the samples to be categorized belong. To circumvent the matching problem between items, the distance between items is calculated using KNN as a non-similarity index between objects. The distance is usually the Euclidean or Manhattan distance (defined in Eqs. (1) and (2), respectively) [6].
The KNN algorithm is presented in Fig. 2, where it is also shown that the result largely relies on the K value choice. Another machine learning subfield, deep learning, has shown greater performance in the image categorization of various food items and has demonstrated its ability to surpass even humans in certain circumstances [21–25]. In this study, four deep learning models are utilized to predict the weight in pounds based on food choices, namely, the long short-term memory (LSTM) model, conventional neural network (CNN) model, stacked-LSTM model, and CNN-LSTM model.
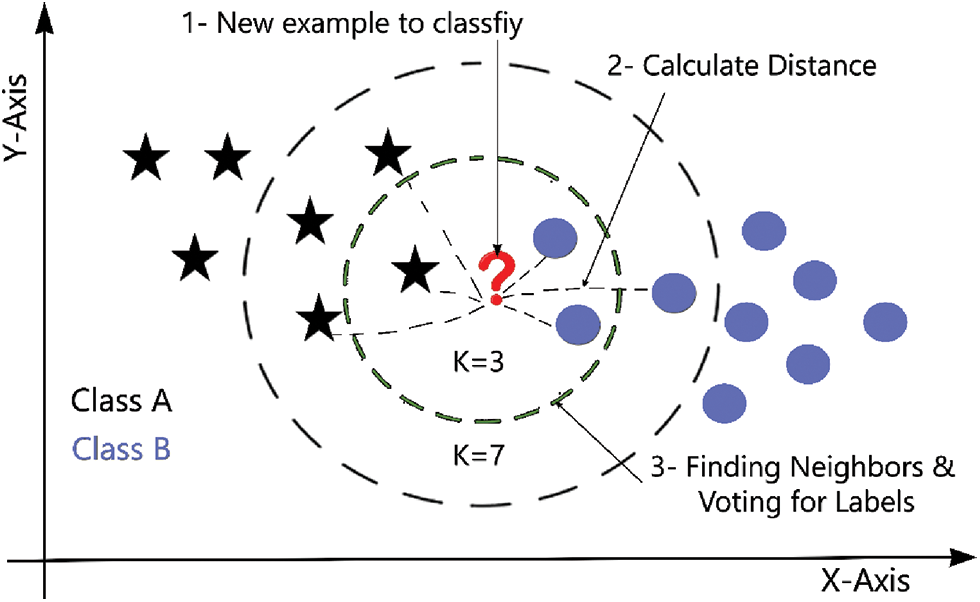
Figure 2: An example of KNN model
3.2 Convolutional Neural Networks (CNN)
Convolutional layers, fully connected layers, pooling layers, nonlinear layers, and the output are the components of CNN. The possibility that precisely captures a particular or group of image groupings is CNN’s outcome. CNN image recognition method Fig. 3. Datasets are regarded as necessary for successful training because CNN can learn how to extract relevant features from input images [26]. The input image may be read as a series of matrices, with the output determining what item this image is most probably to be. The dot product of the source images and the weight matrix of the filter is computed by the convolutional layer. The result is utilized as the layer’s outcome. The filter will move around the whole image, doing the identical dot product process each time [27,28]. The convolution process may be described as in Eq. (3).
where n_in is the no of incoming indices or the tensor’s ultimate dimension, Xk indicates the kth source index, Wk is the kth sub-convolution kernel matrix, and s(i, j) is the value of the relevant result matrix element associated with the convolution kernel W. The ReLU function, f(x) = max(0, x), is commonly employed for the output of nonlinear layers. For each negative value in the input image, the ReLU function returns a value of zero, but for each positive value, it returns the same value [6].
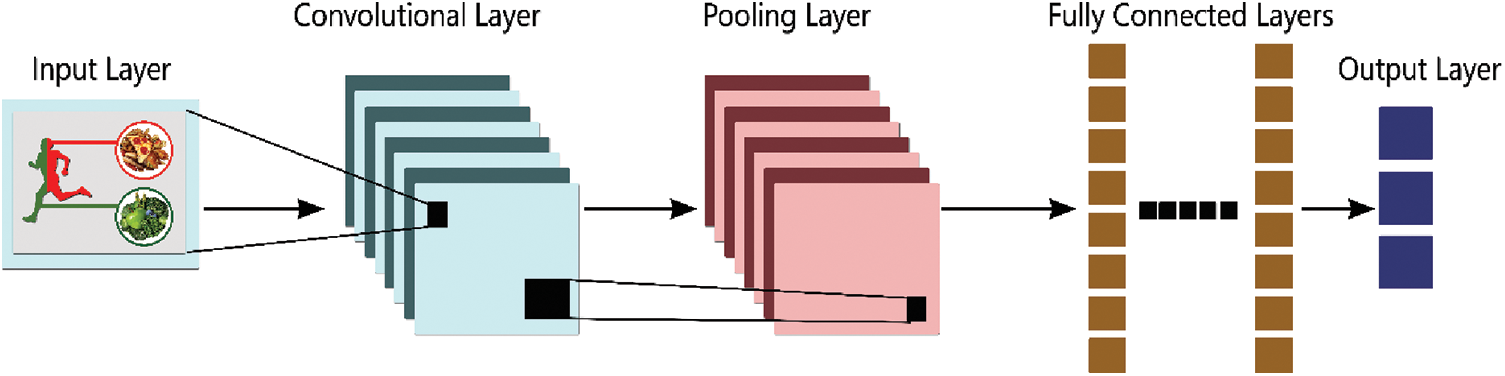
Figure 3: The typical CNN architecture
3.3 Long Short-Term Memory (LSTM)
To natively include time dependency into neural network topologies, the recurrent neural networks have been proposed. The key concept is to extend the capabilities of traditional ANN approaches by dynamically providing a sequential framework. Because of LSTM ability to learn both long-and short-term interconnections of a problem, it has been proven a huge success. It has been also developed to deal with the vanishing gradient issue that most RNN designs have [29]. The primary data processing units of LSTM are referred to as “cells.” In normal MLP, these cells may be seen as more advanced neurons. A cell has numerous gates that maintain and govern the flow of information throughout an arbitrary length sequence. This capability allows LSTM to determine whether information is important in both the short and long term. As a result, it is ideal for any form of sequential issue. A LSTM cell is defined as in Eqs. (4)–(9) [30].
where x and h represent the input state and the hidden state, respectively. The present time step is represented by t.
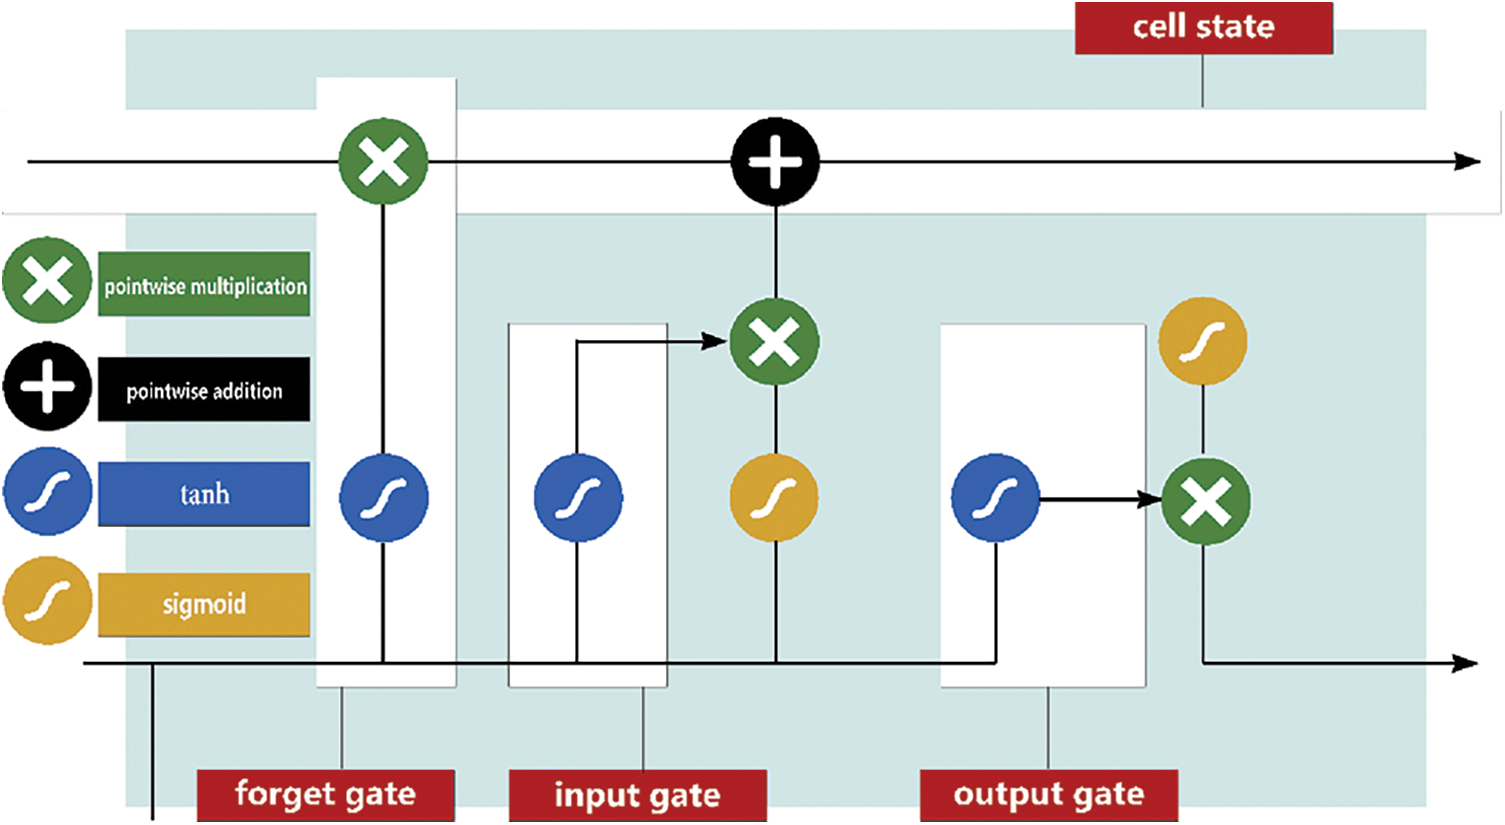
Figure 4: The structure of a standard LSTM neural network
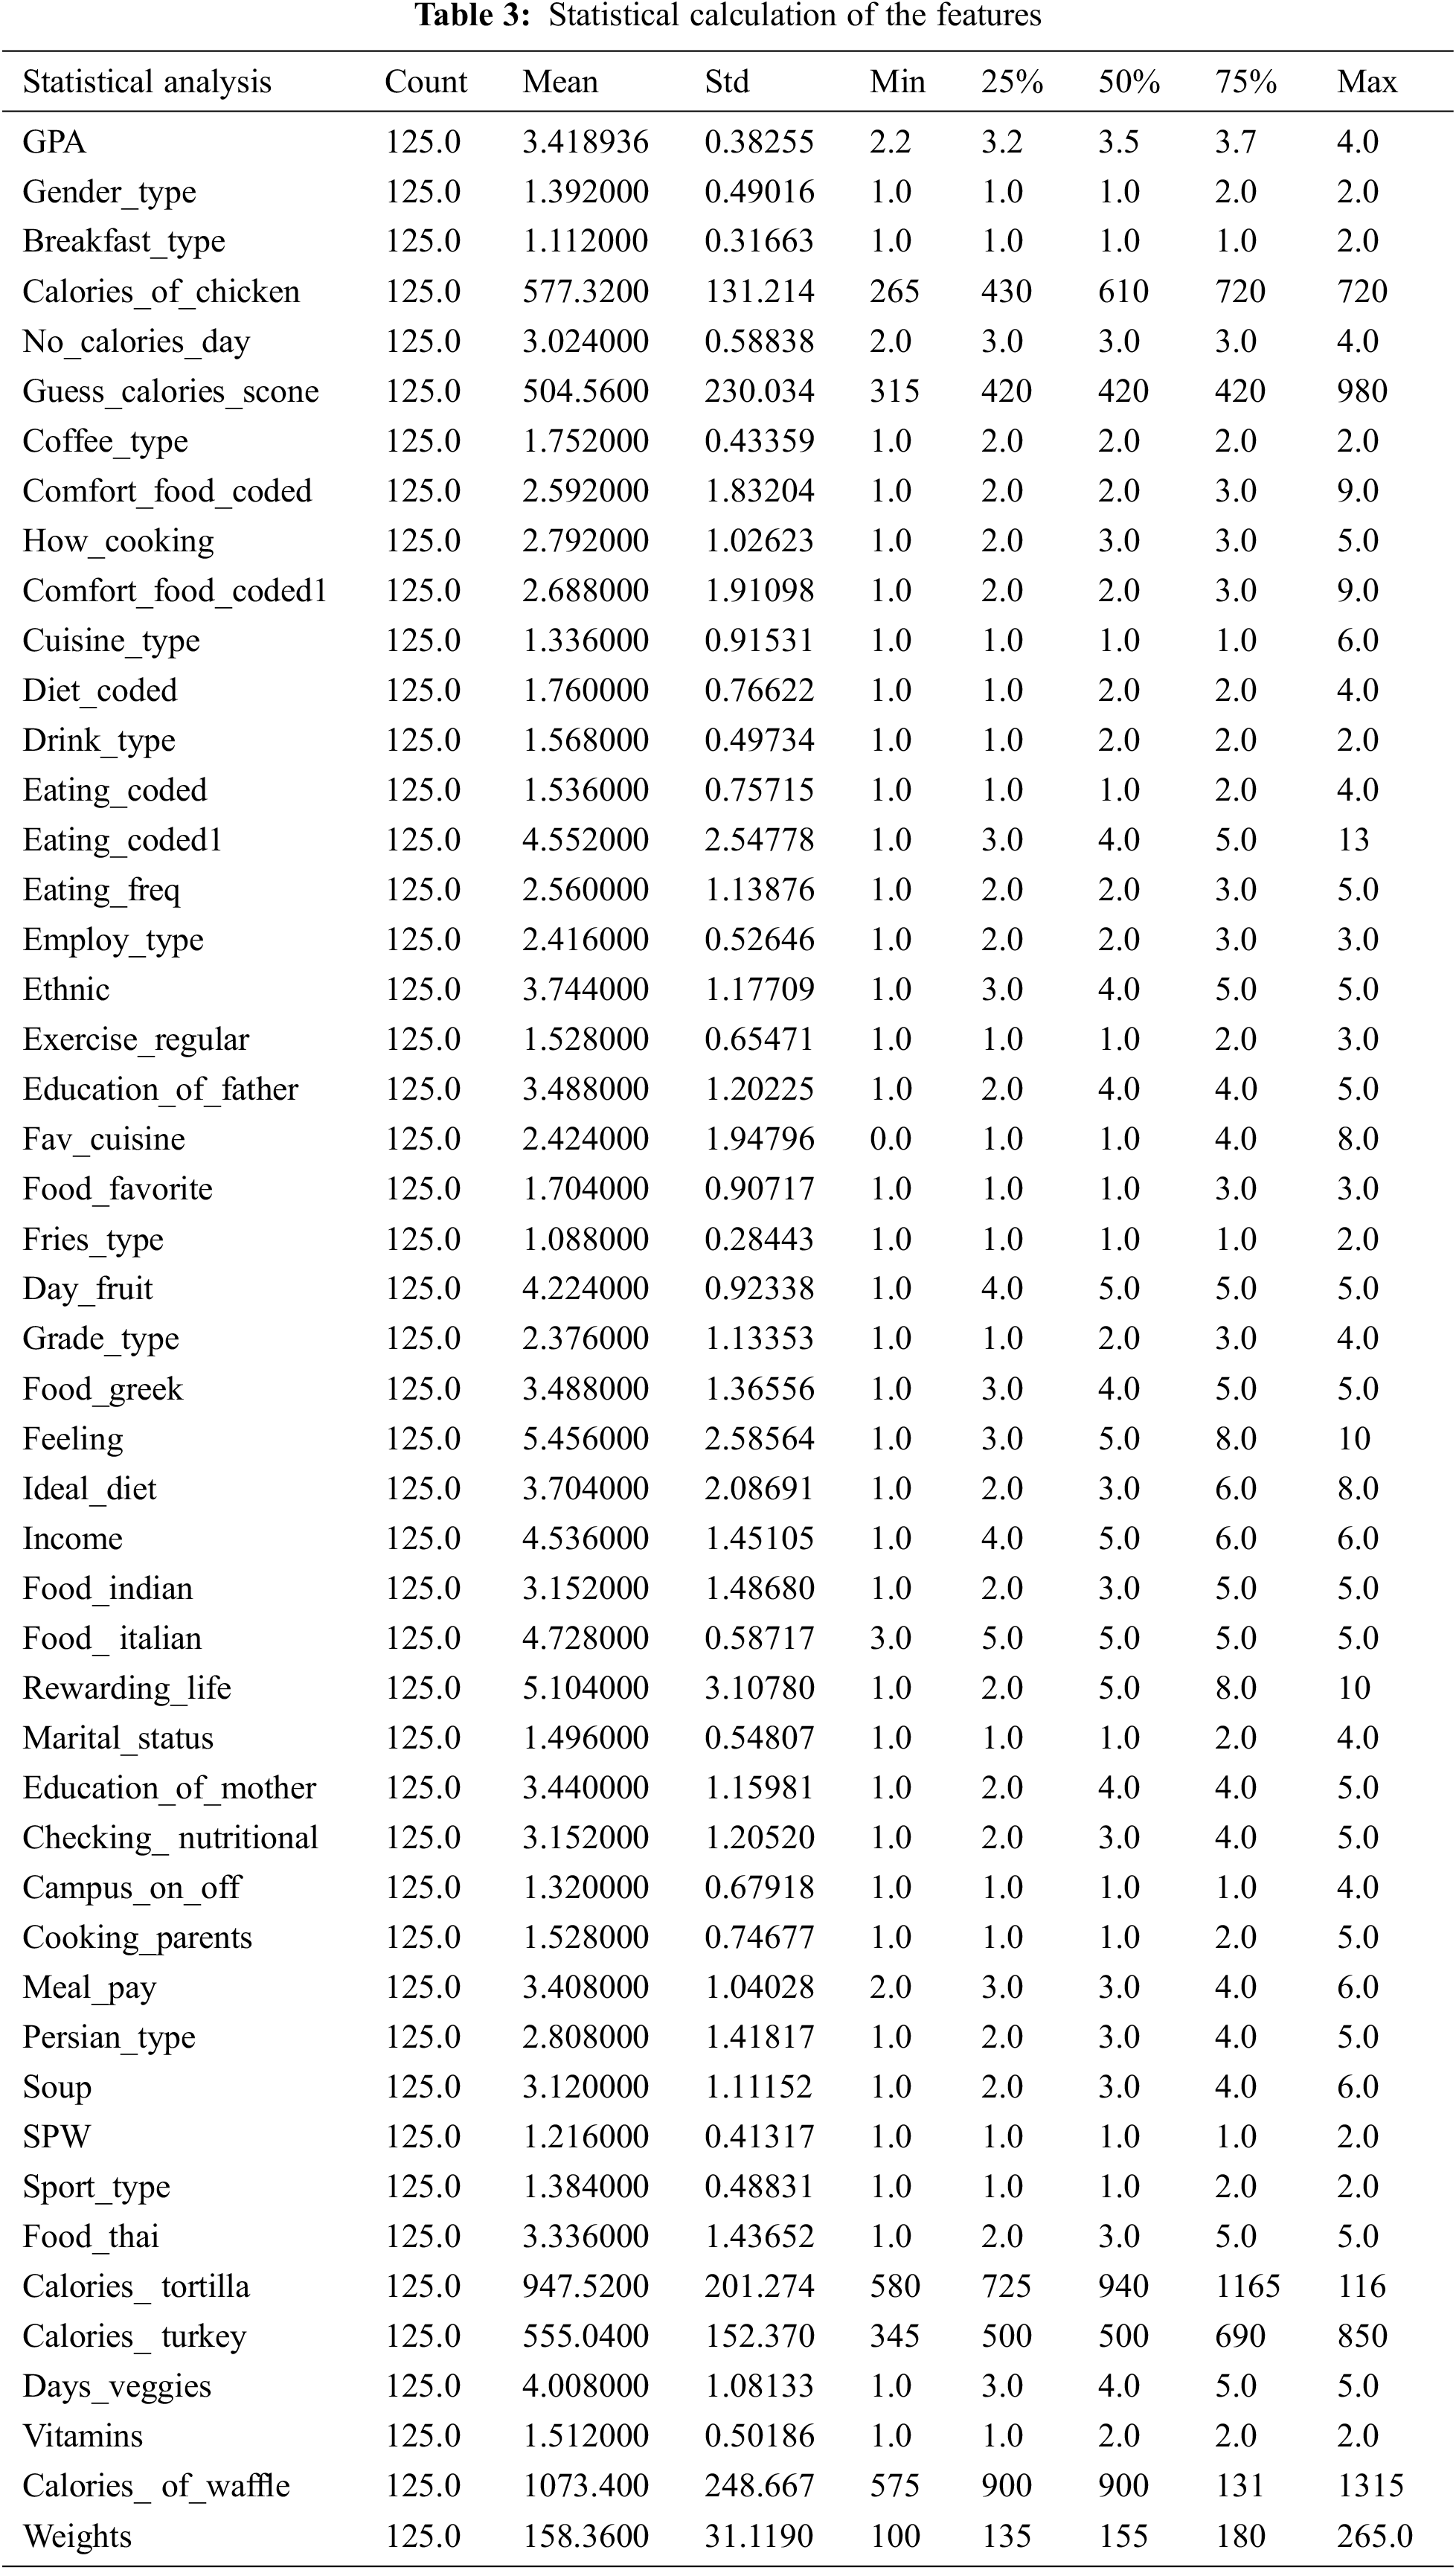
The dataset is available at https://www.kaggle.com/datasets/borapajo/food-choices. The dataset includes 49 features; 48 are the predictors, and one feature is the target feature. The description of the features is demonstrated in Table 2. The violin plot for the target feature is shown in Fig. 5. The correlation matrix for the features is presented in Fig. 6. The statistical calculation for the features is demonstrated in Table 3.
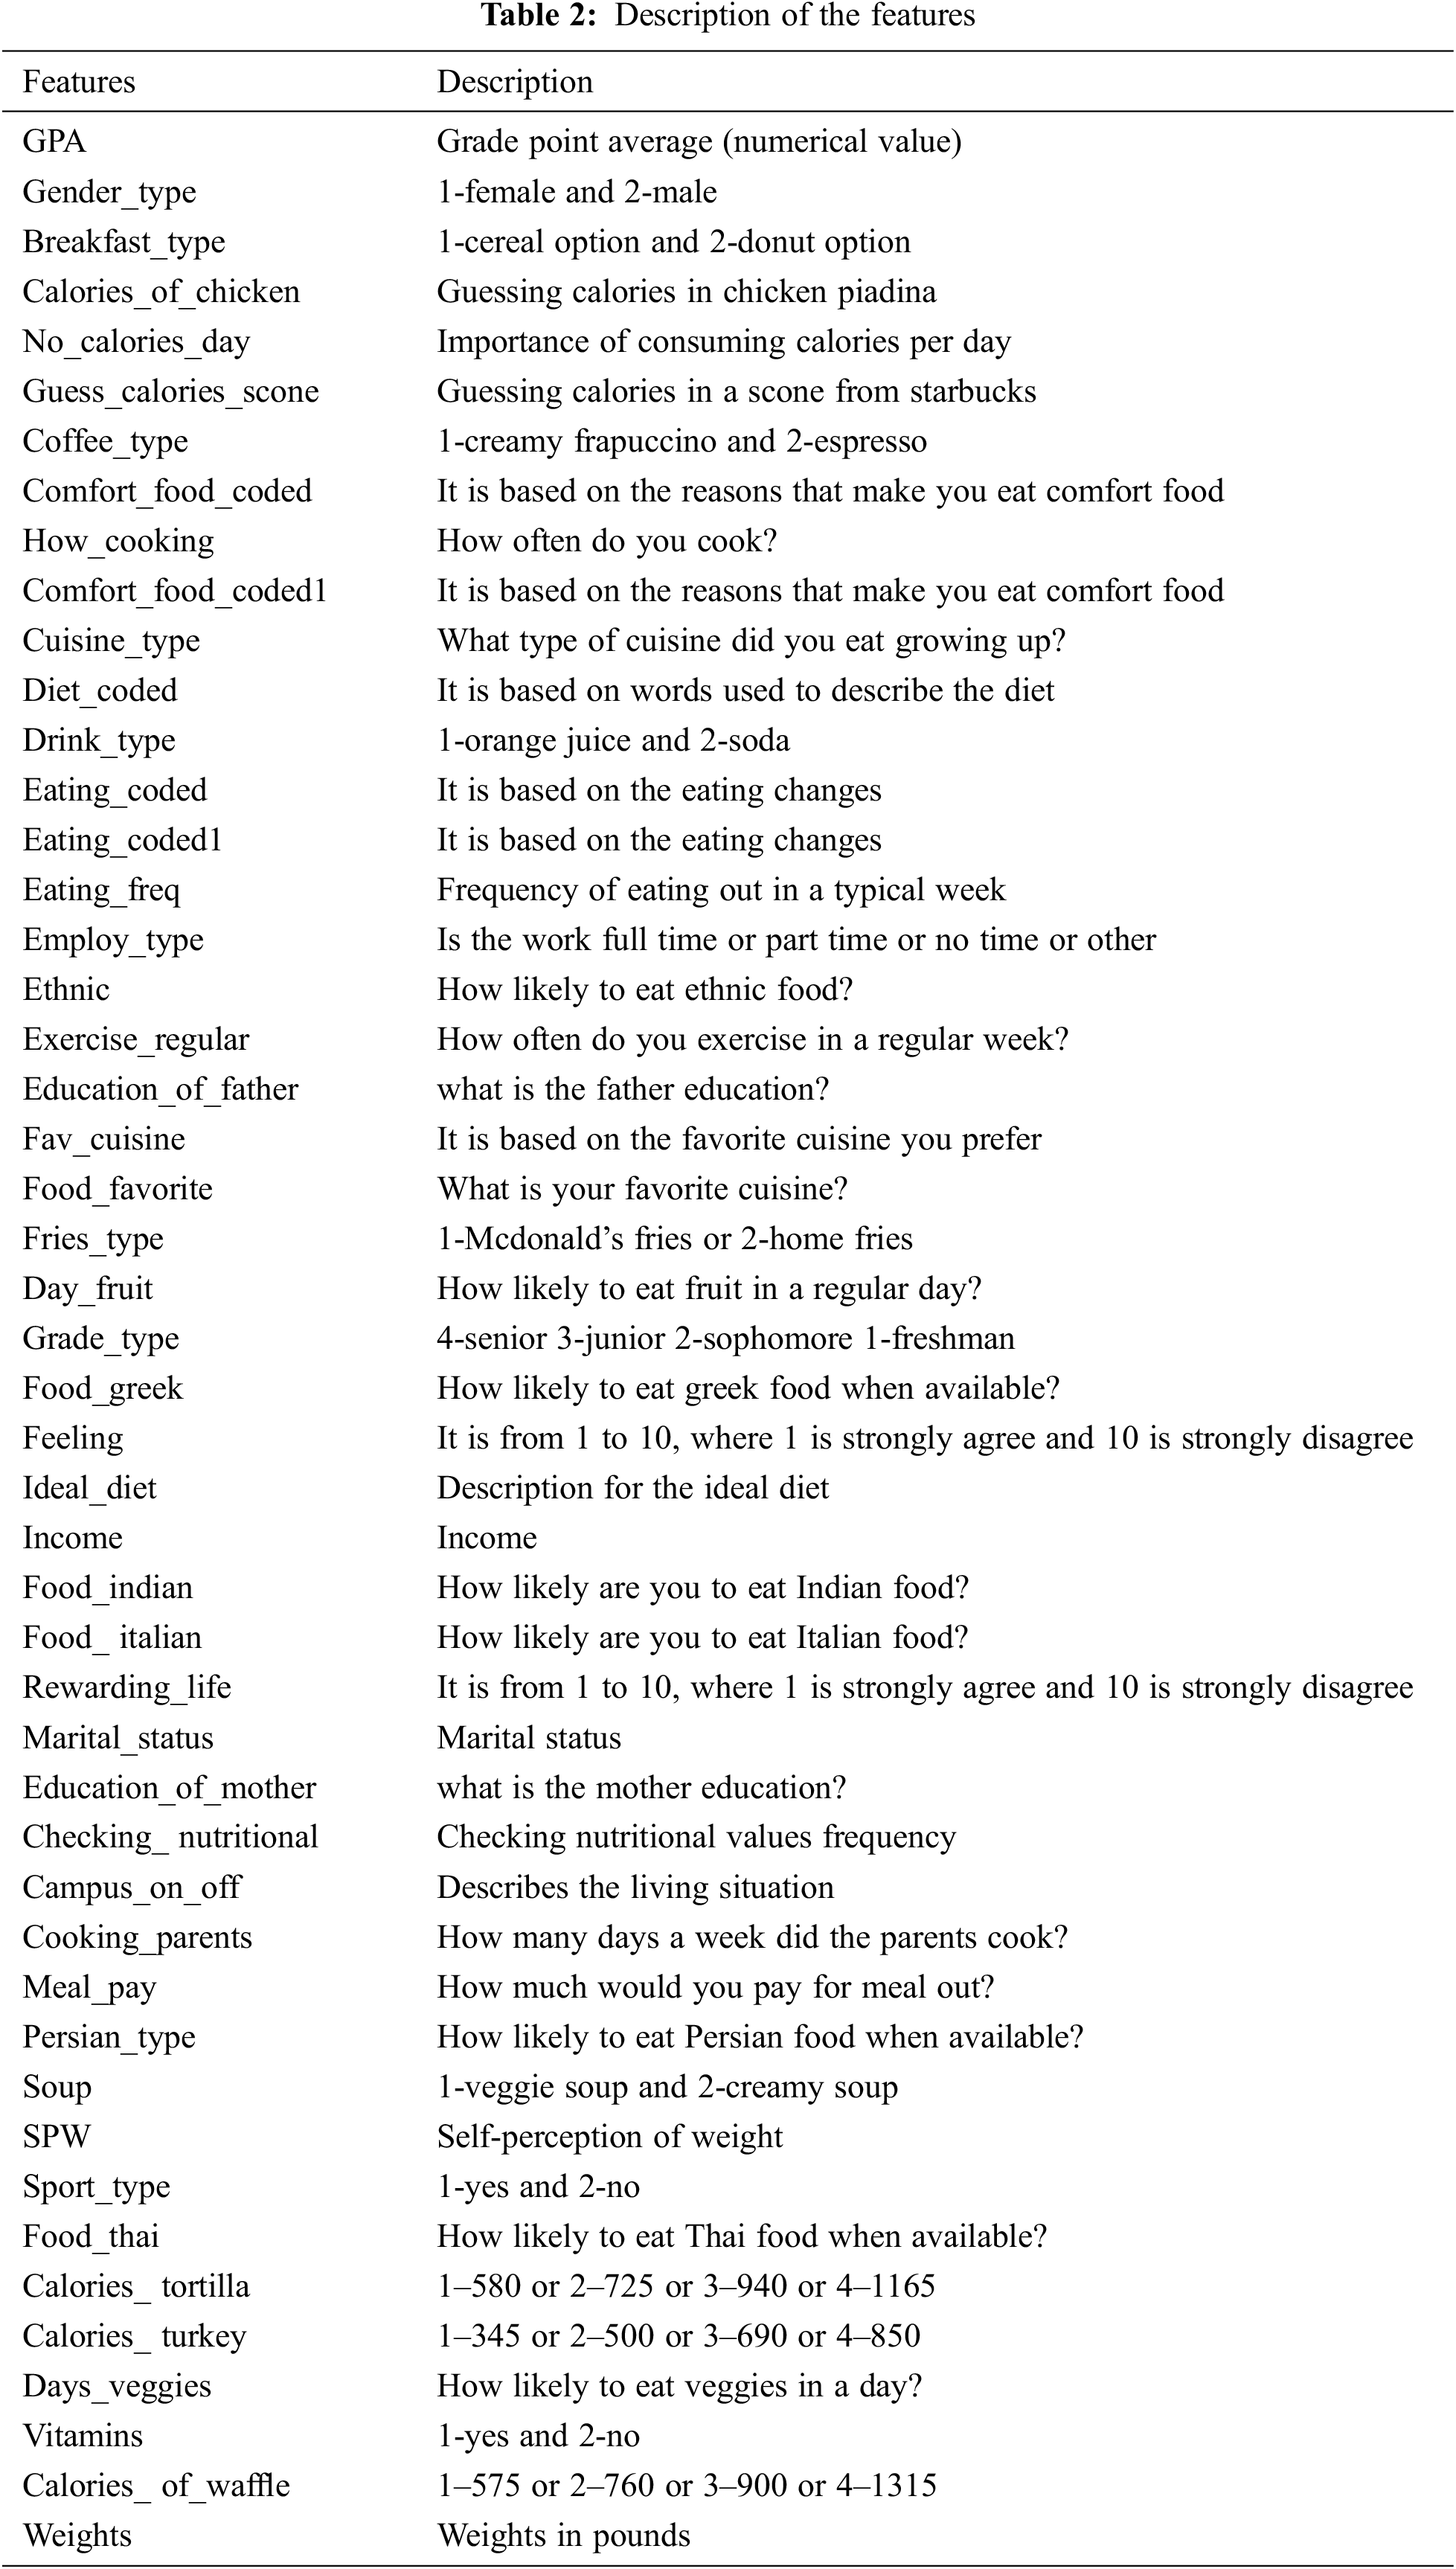
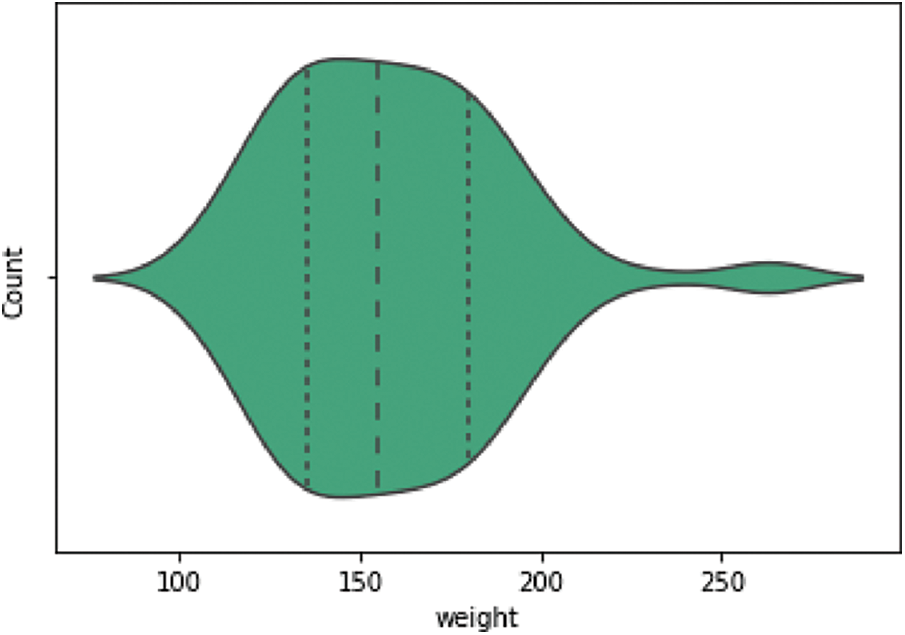
Figure 5: Violin plot for the target feature
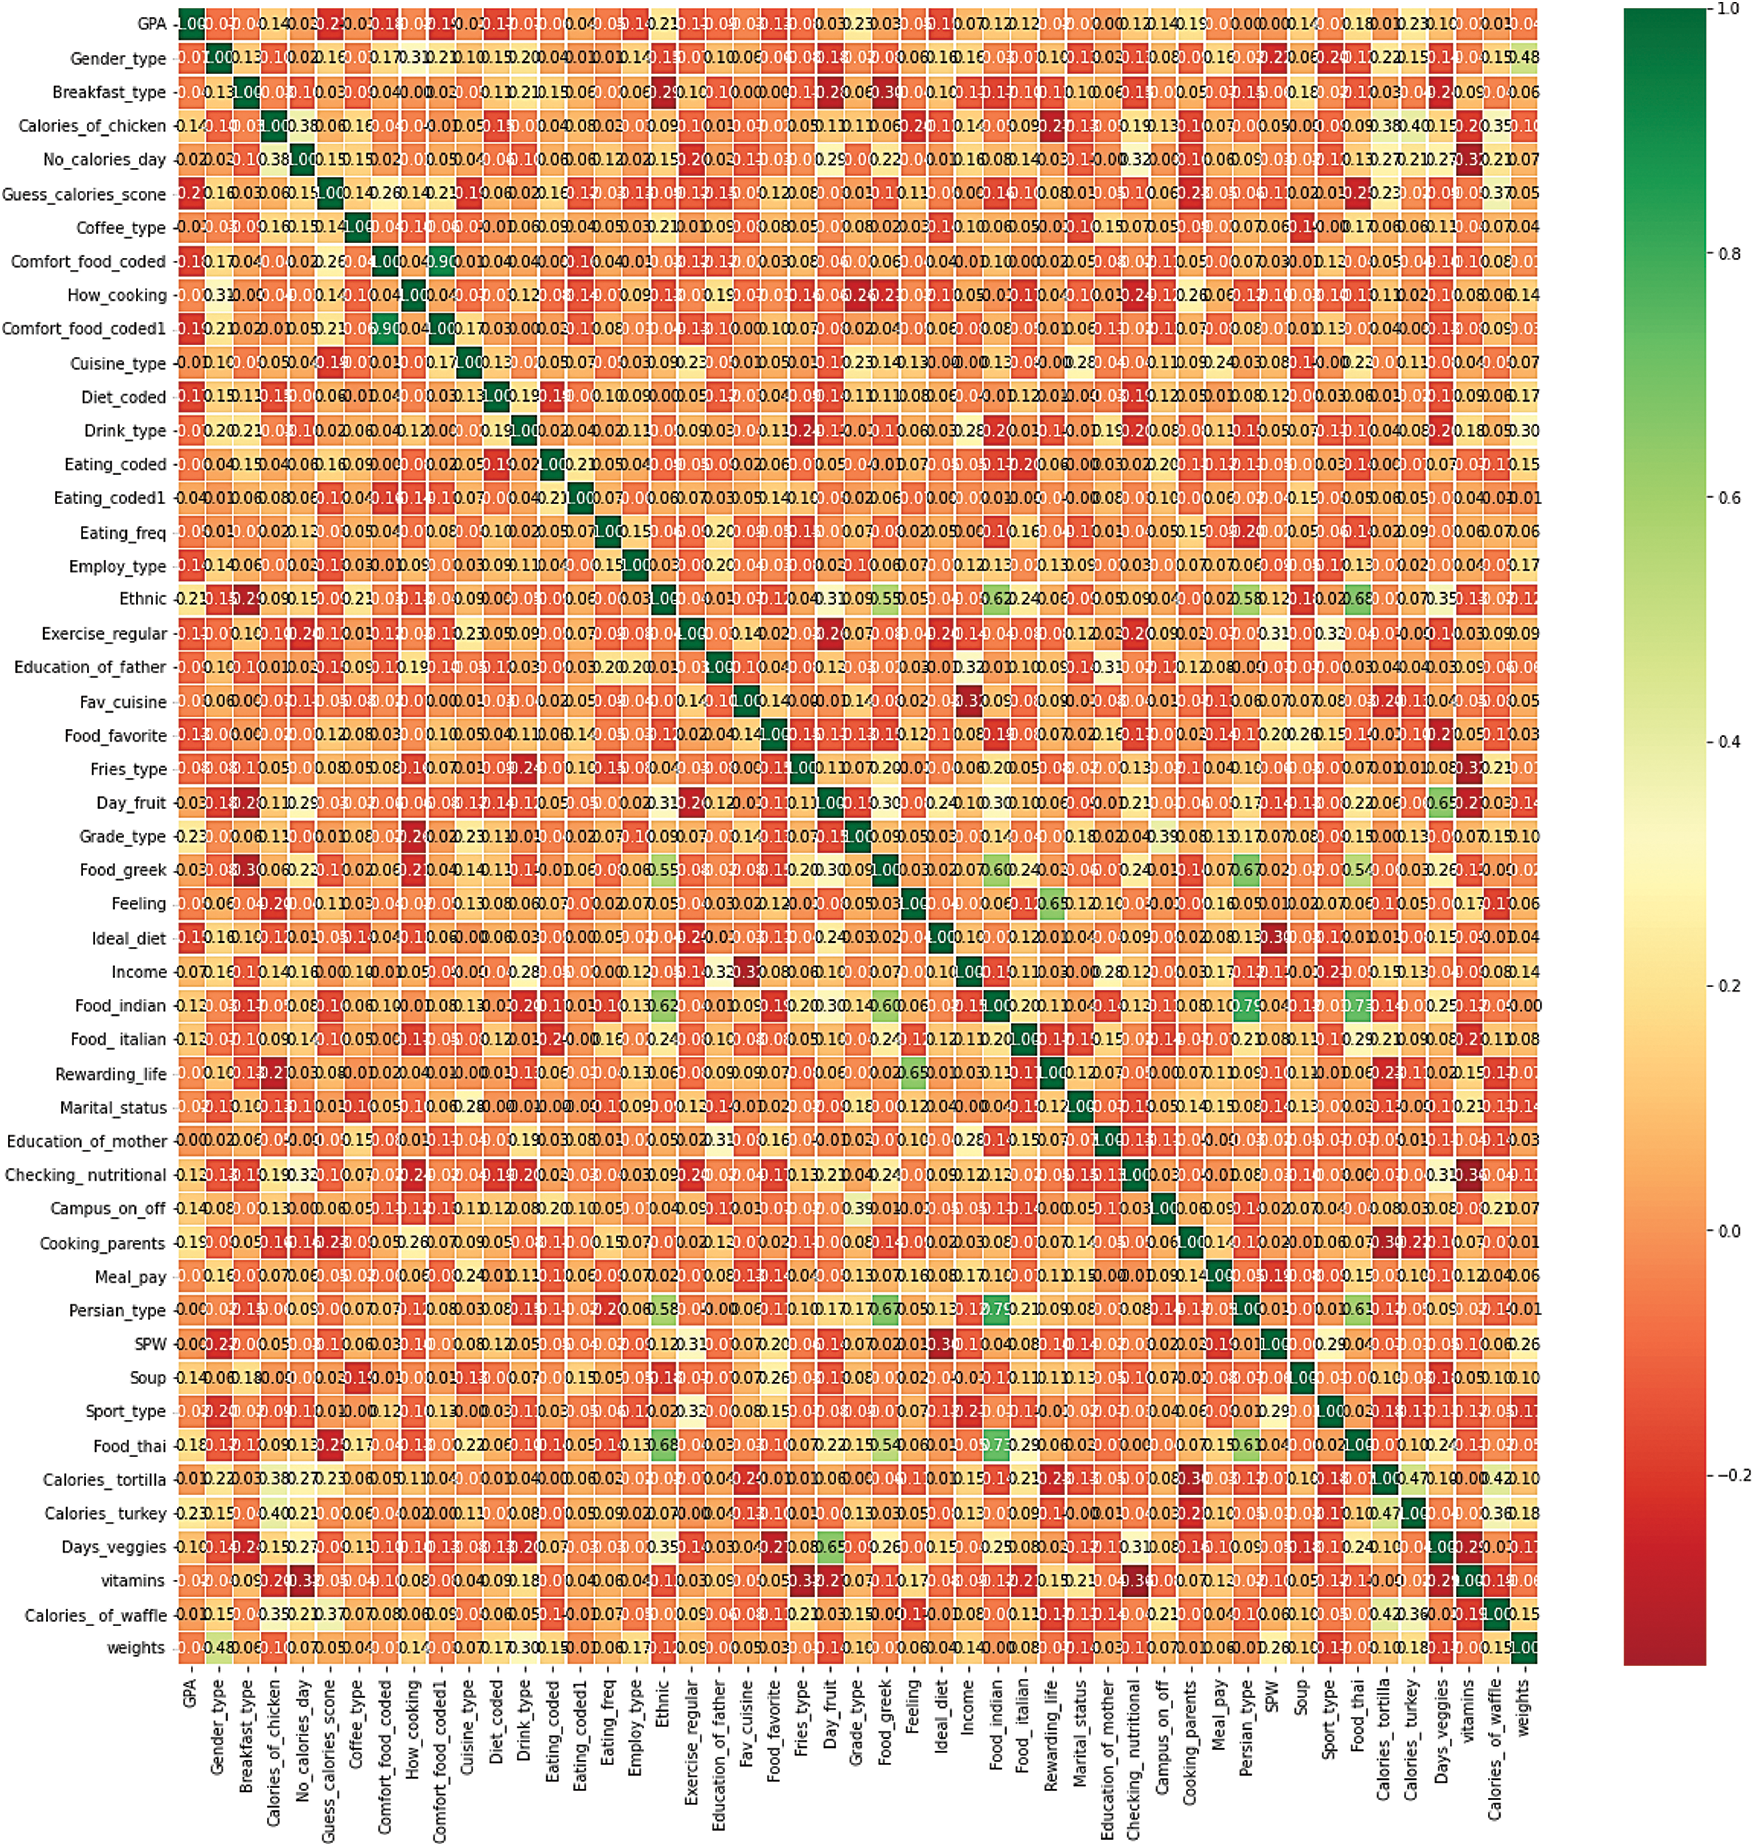
Figure 6: Correlation matrix for the features
Five error analysis criteria are presented to analyze the suggested models in order to verify the efficacy and performance of the prediction models. These criteria are given in Eqs. (10)–(14), where
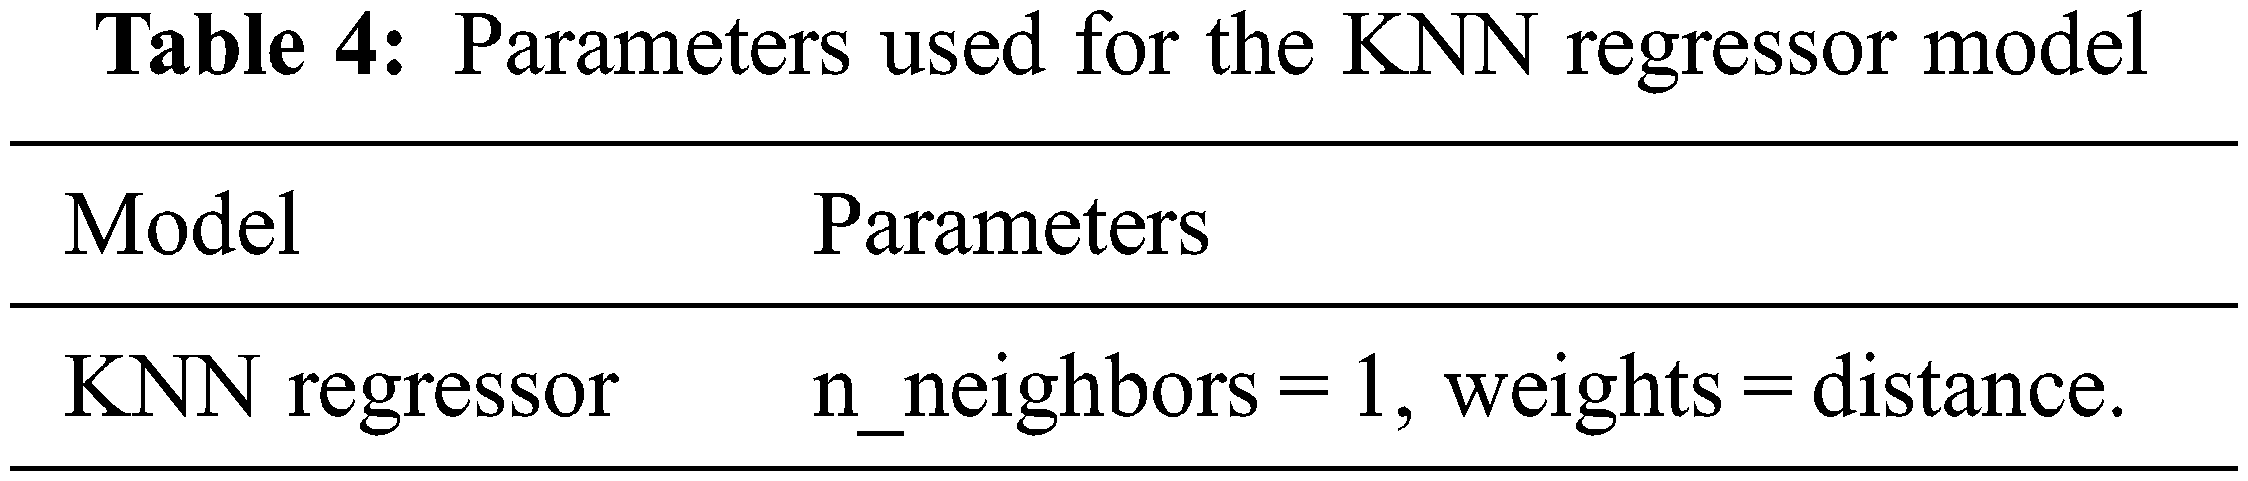
The major experiments used to assess the effectiveness of the stacked-LSTM model are detailed in this section. A version of the Jupyter notebook (6.4.6) was used to execute the stacked-LSTM model. The Jupyter notebook simplifies the process of running and writing Python code. It is a popular open-source tool for building and running deep learning and machine learning algorithms for classification and regression. In this study, the performance of the stacked-LSTM model was compared with the models, namely, LSTM, CNN-LSTM, CNN, and KNN. The performance of these models was evaluated using MAE, MedAE, MSE, MAPE, and RMSE as the evaluation metrics. In the LSTM model, the number of hidden units is 100. The batch size is 32, the used learning rate is 0.001, the iterations number is 100, the Adam optimizer is the used optimizer, the time steps are 48, and the activation function in the output is a linear function. In the stacked-LSTM model, three layers are used. The first layer consists of 128 hidden units, the second layer consists of 128 hidden units, and the third layer consists of 32 hidden units. The batch size is 32, the used learning rate is 0.001, the iterations number is 100, the used optimizer is the Adam optimizer, the time steps are 48, and the used activation function is a linear function. In the CNN-LSTM model, the model includes three convolution layers, one max-pooling layer, one LSTM layer, one hidden layer, and an output layer that returns a single, continuous value. The first convolution layer consists of 64 filters. The number of kernel sizes is 7. The second convolution layer contains 32 filters. The number of kernel sizes is 3. The third convolution layer contains 16 filters. The number of kernel sizes is 3. The LSTM layer includes 128 hidden units. The hidden layer includes 32 neurons. The activation function used in the output layer is the linear function. In the CNN model, the model consists of three convolution layers one max-pooling layer, one hidden layer, and an output layer that returns a single, continuous value. The first convolution layer contains 64 filters. The number of kernel sizes is 7. The second convolution layer contains 32 filters. The number of kernel sizes is 3. The third convolution layer contains 16 filters. The number of kernel sizes is 3. The hidden layer includes 32 neurons. The activation function used in the output layer is the linear function. In the KNN Regressor model, the parameters used for the model are presented in Table 4. Five evaluation metrics, namely, mean squared error (MSE), mean absolute error (MAE), median absolute error (MedAE), root mean squared error (RMSE), and mean absolute percentage error (MAPE), were computed for the models, namely, the LSTM model, stacked-LSTM model, CNN-LSTM model, CNN model, and KNN regressor model, respectively. Table 5 demonstrates the performance of the models utilized in this study.
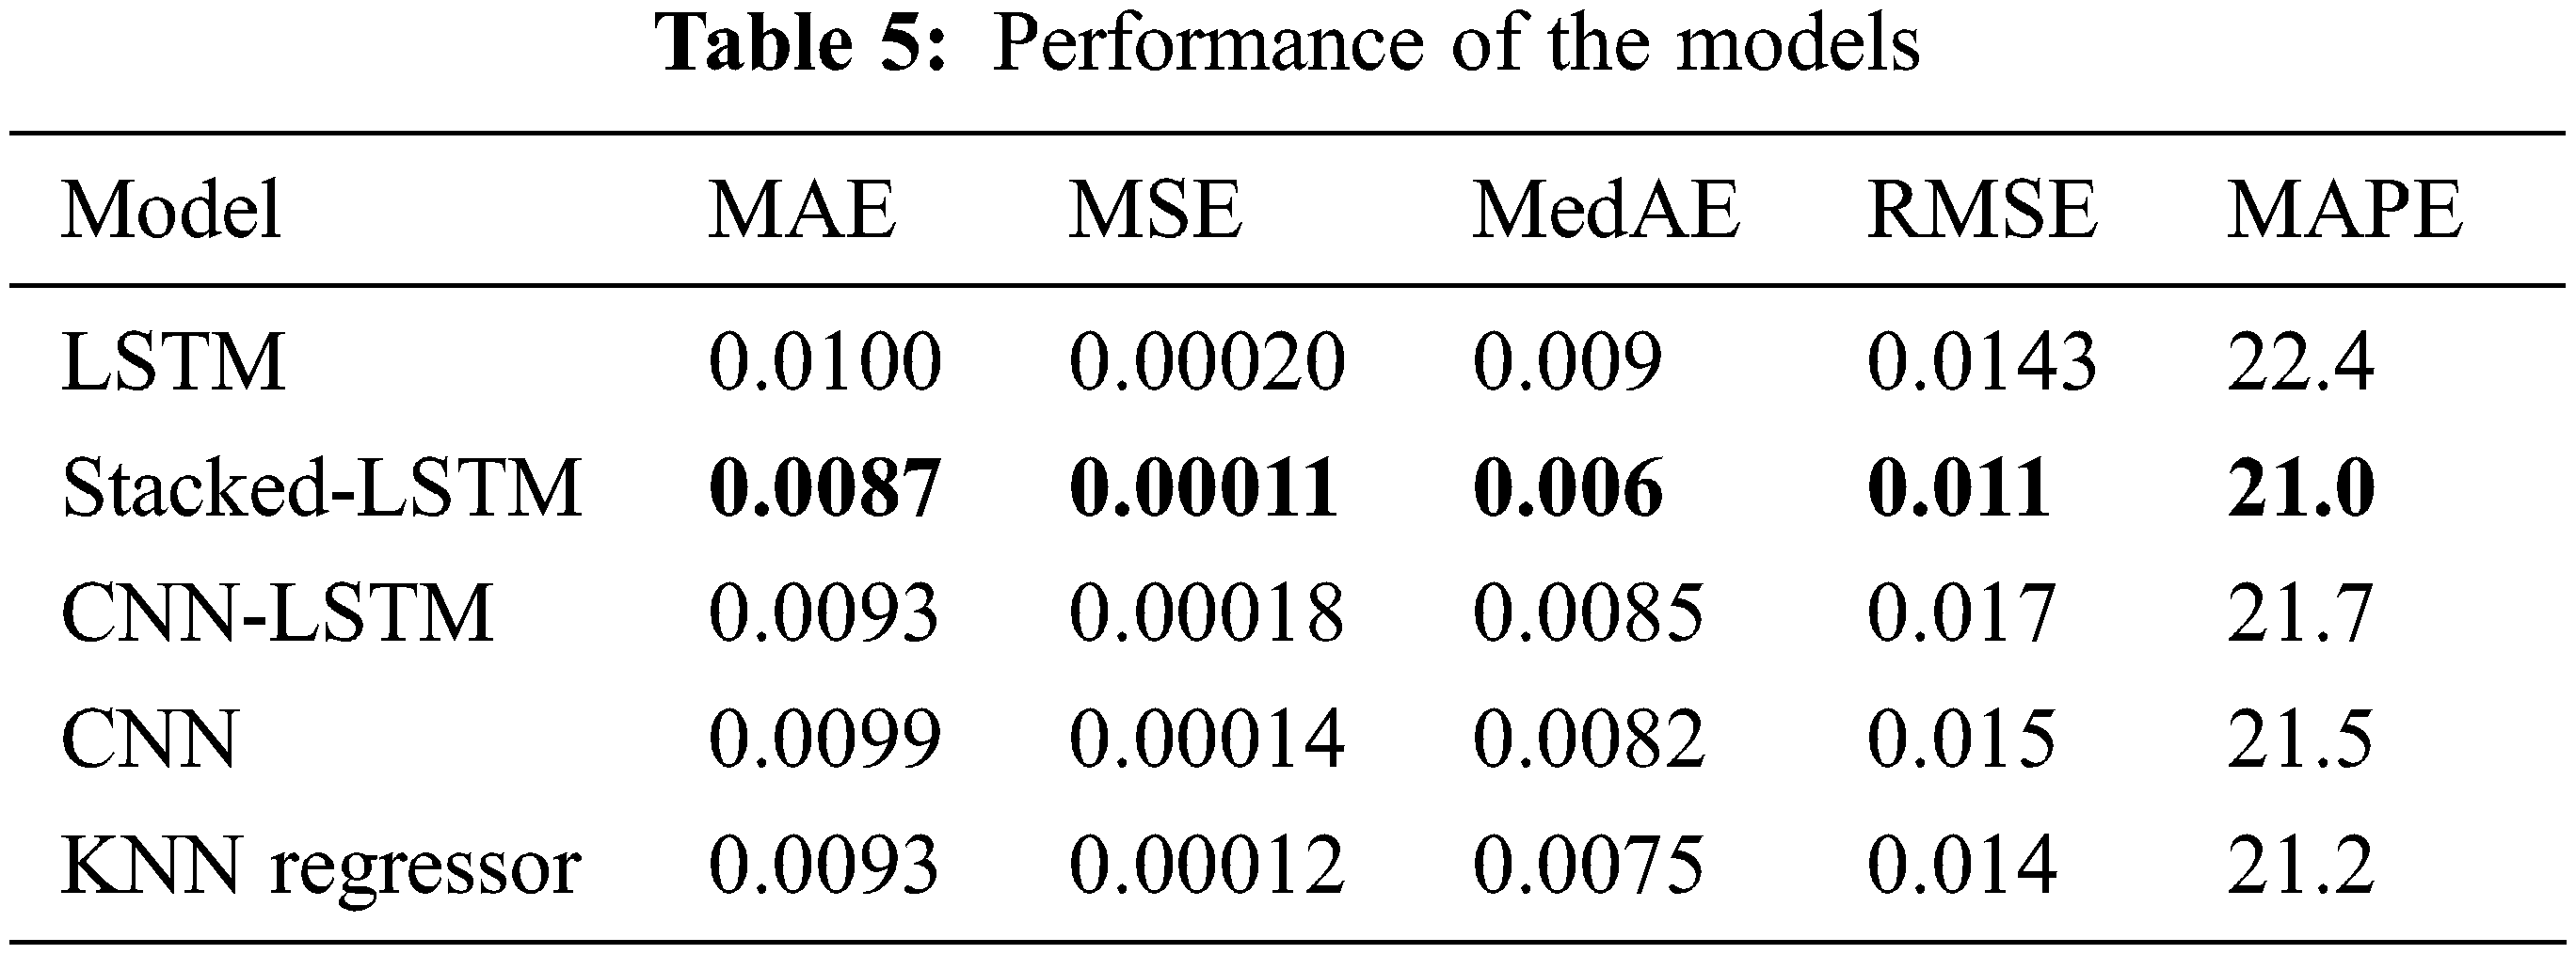
As shown in Table 5, the stacked-LSTM model archives better results. Its MAE, MSE, MedAE, RMSE, and MAPE are 0.0087, 0.00011, 0.006, 0.011, and 21, respectively. The LSTM model achieved the lowest results among all models; its MAE, MSE, MedAE, RMSE, and MAPE were 0.0100, 0.00020, 0.009, 0.0143, and 22.4, respectively. Figs. 7–10 demonstrate the relationship between mean absolute error, mean squared error and number of epochs using the LSTM model, stacked-LSTM model, CNN-LSTM model, and CNN model, respectively. Fig. 11 illustrates a comparison between the actual error rate values and the predicted error values for the models, namely, LSTM, stacked-LSTM model, CNN model, CNN-LSTM model, and KNN model, respectively.
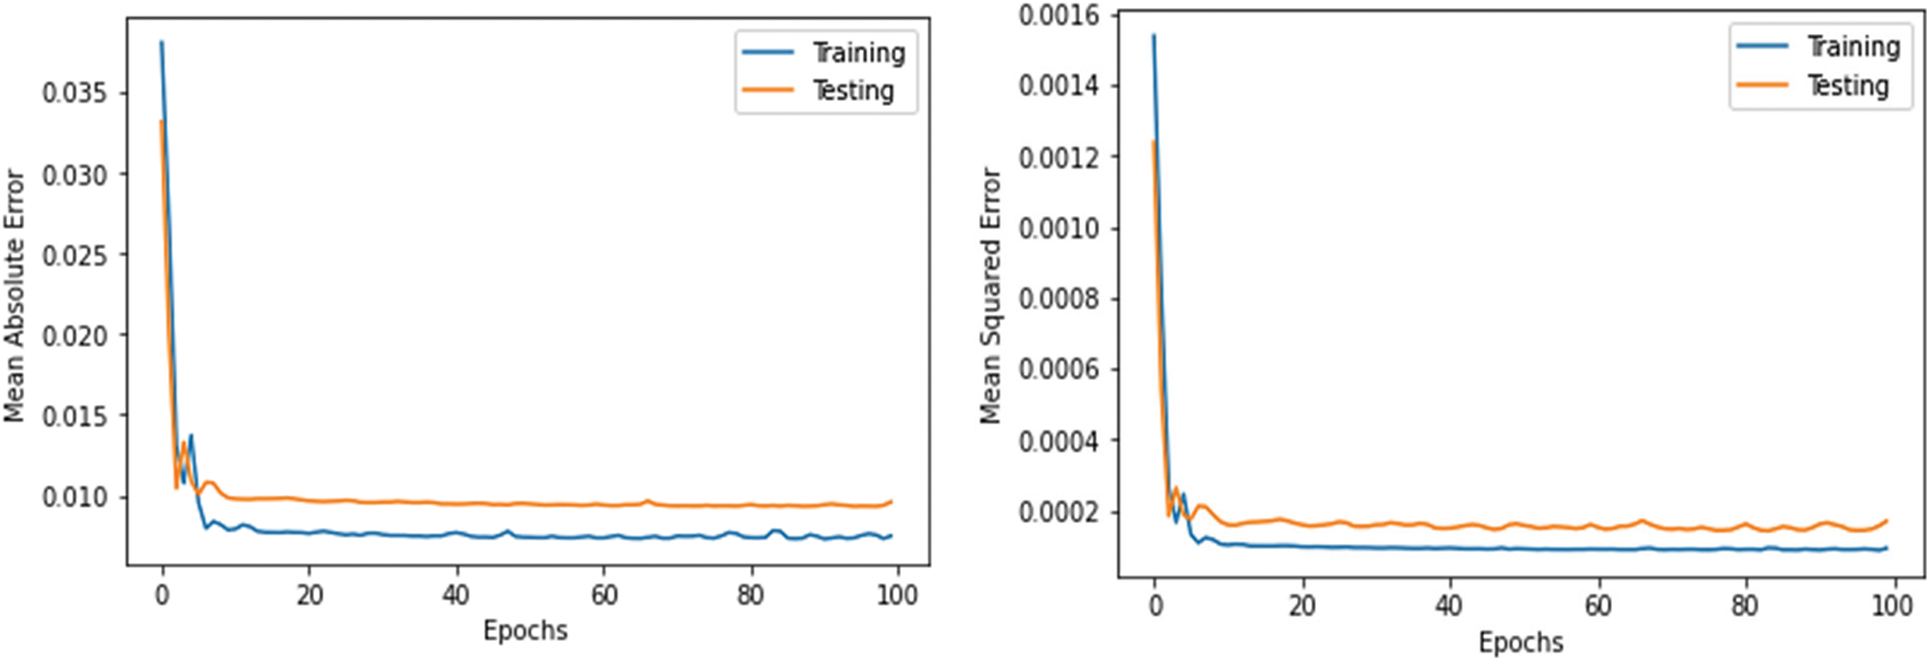
Figure 7: Relation between mean absolute error, mean squared error and number of epochs using LSTM
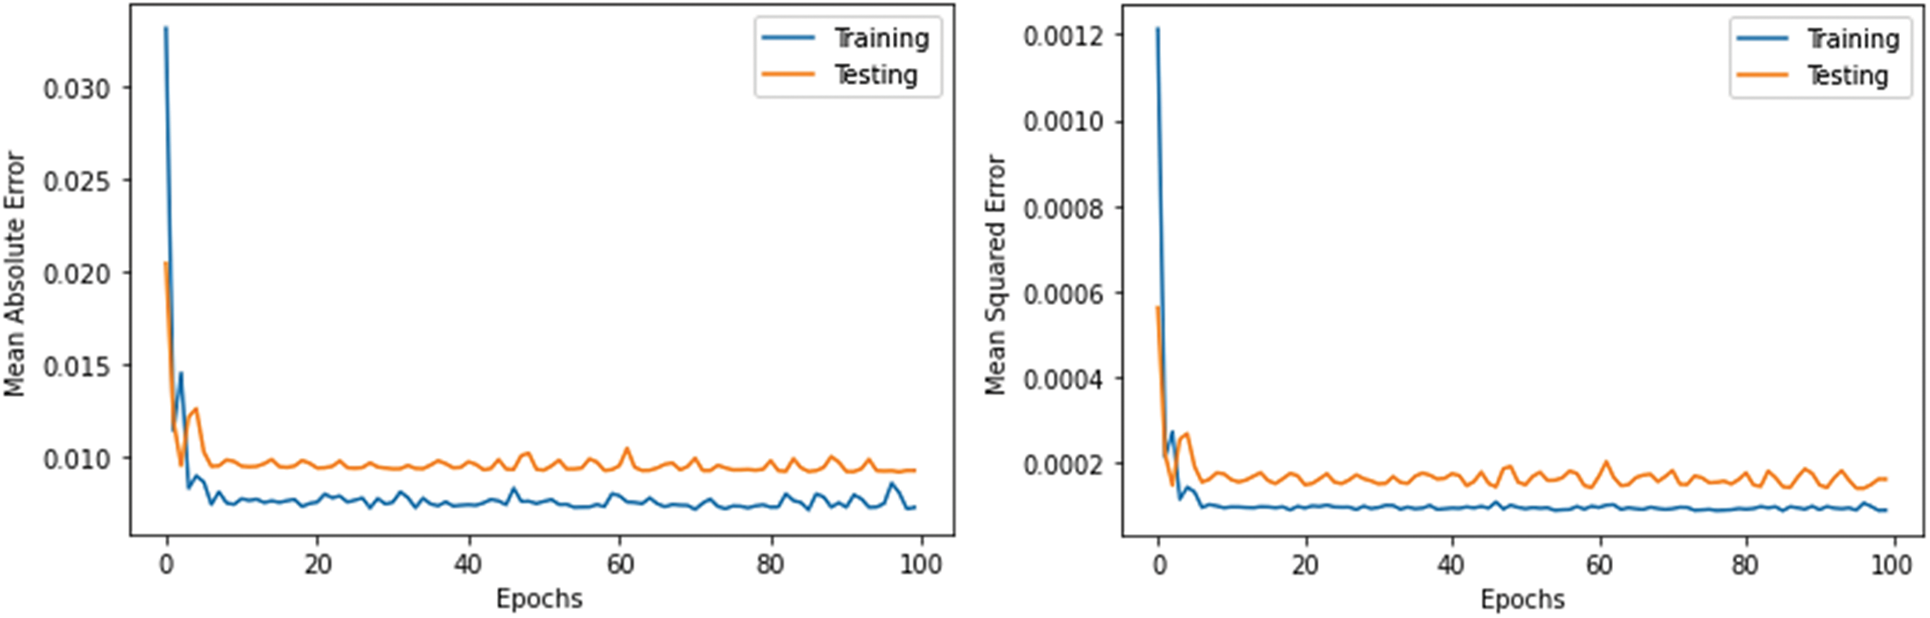
Figure 8: Relation between mean absolute error, mean squared error and number of epochs of stacked-LSTM
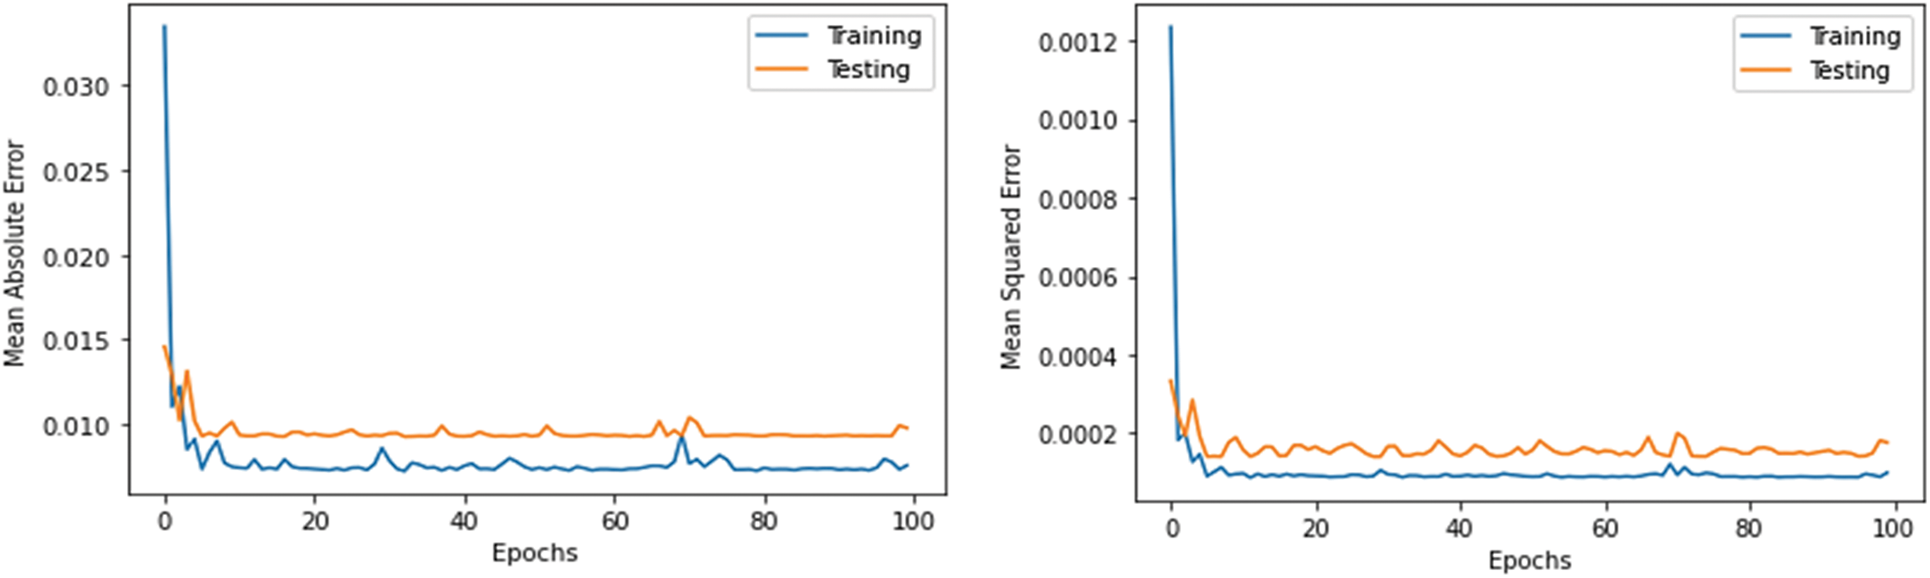
Figure 9: Relation between mean absolute error, mean squared error and number of epochs of CNN-LSTM
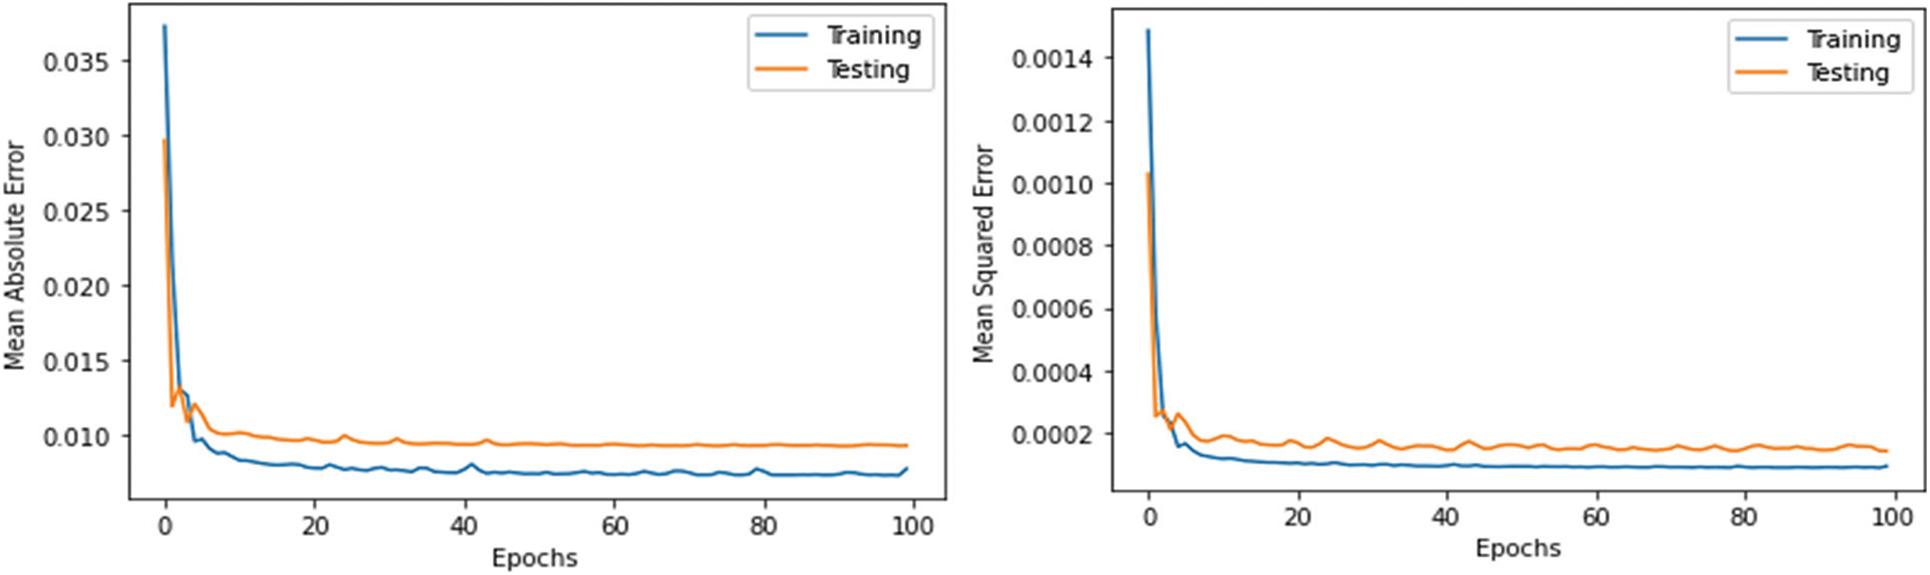
Figure 10: Relation between mean absolute error, mean squared error and number of epochs using CNN model
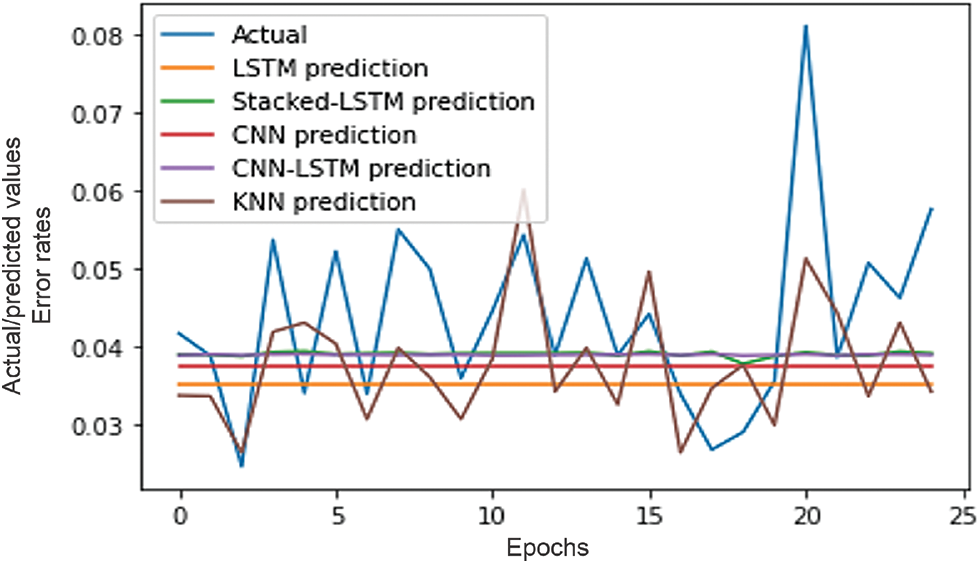
Figure 11: Comparison between actual values and predicted values
In this paper, an effective stacked-LSTM model was developed for the weight prediction of food choices. The proposed stacked-LSTM model uses three layers, where the first layer consists of 128 hidden units, the second layer consists of 128 hidden units, and the third layer consists of 32 hidden units. The Adam optimizer is also used. Several performance metrics, namely, MAE, MSE, MedAE, RMSE, and MAPE, are utilized to assess the suggested model’s effect. The suggested model’s performance was compared to four other models, namely, the LSTM model, the CNN model, the CNN-LSTM model, and KNN. The stacked-LSTM model achieved the best results among the four models, where MAE, MSE, MedAE, RMSE, and MAPE were 0.0087, 0.00011, 0.006, 0.011, and 21, respectively. Possible future work may consider augmenting the model with a food recommendation system. The effect of weight prediction in general healthcare systems as well as the impact of nutrition during the current COVID-19 epidemic are other important considerations.
Funding Statement: The authors received no specific funding for this study.
Availability of Data and Materials: A data availability is found in https://www.kaggle.com/datasets/borapajo/food-choices.
Conflicts of Interest: The authors declare that they have no conflicts of interest to report regarding the present study.
References
1. M. C. Onwezen, M. J. Reinders, M. C. D. Verain and H. M. Snoek, “The development of a single-item food choice questionnaire,” Food Quality and Preference, vol. 71, pp. 34–45, 2019. [Google Scholar]
2. M. C. D. Verain, H. M. Snoek, M. C. Onwezen, M. J. Reinders and E. P. Bouwman, “Sustainable food choice motives: The development and cross-country validation of the sustainable food choice questionnaire (SUS-FCQ),” Food Quality and Preference, vol. 93, no. 104267, pp. 1–11, 2021. [Google Scholar]
3. J. P. H. Wilding, R. L. Batterham, S. Calanna, M. Davies, L. F. Van-Gaal et al., “Once-weekly semaglutide in adults with overweight or obesity,” New England Journal of Medicine, vol. 384, no. 11, pp. 989–1002, 2021. [Google Scholar]
4. S. Basu, “The transitional dynamics of caloric ecosystems: Changes in the food supply around the world,” Critical Public Health, vol. 25, no. 3, pp. 248–264, 2015. [Google Scholar]
5. J. Dunstan, M. Aguirre, M. Bastías, C. Nau, T. A. Glass et al., “Predicting nationwide obesity from food sales using machine learning,” Health Informatics Journal, vol. 26, no. 1, pp. 652–663, 2020. [Google Scholar]
6. L. Zhu, P. Spachos, E. Pensini and K. N. Plataniotis, “Deep learning and machine vision for food processing: A survey,” Current Research in Food Science, vol. 4, pp. 233–249, 2021. [Google Scholar]
7. P. -J. Chen and M. Antonelli, “Conceptual models of food choice: Influential factors related to foods, individual differences, and society,” Foods, vol. 9, no. 12, pp. 1–21, 2020. [Google Scholar]
8. K. Bi, T. Qiu and Y. Huang, “A deep learning method for yogurt preferences prediction using sensory attributes,” Processes, vol. 8, no. 5, pp. 1–12, 2020. [Google Scholar]
9. M. Pellegrini, V. Ponzo, R. Rosato, E. Scumaci, I. Goitre et al., “Changes in weight and nutritional habits in adults with obesity during the ‘lockdown’ period caused by the COVID-19 virus emergency,” Nutrients, vol. 12, no. 7, pp. 1–11, 2020. [Google Scholar]
10. L. J. Hintze, É. Doucet and G. S. Goldfield, “The relative reinforcing value of snack food is a significant predictor of fat loss in women with overweight or obesity,” Applied Physiology, Nutrition, and Metabolism, vol. 47, no. 2, pp. 134–140, 2022. [Google Scholar]
11. A. Gere, K. Héberger and S. Kovács, “How to predict choice using eye-movements data?” Food Reseach Intenational, vol. 143, no. 110309, pp. 1–7, 2021. [Google Scholar]
12. J. Depa, J. R. Barrada and M. Roncero, “Are the motives for food choices different in orthorexia nervosa and healthy orthorexia?” Nutrients, vol. 11, no. 3, pp. 1–14, 2019. [Google Scholar]
13. A. Nogales, R. Díaz-Morón and Á. J. García-Tejedor, “A comparison of neural and non-neural machine learning models for food safety risk prediction with european union RASFF data,” Food Control, vol. 134, no. 108697, pp. 1–11, 2022. [Google Scholar]
14. C. Zhu, T. Beatty, Q. Zhao, W. Si and Q. Chen, “Using genetic information to improve the prediction of individual food choice: A case study of alcoholic beverages,” bioRxiv, vol. 44, no. 18, pp. 2–34, 2021. [Google Scholar]
15. M. D. Amin, S. Badruddoza and J. J. McCluskey, “Predicting access to healthful food retailers with machine learning,” Food Policy, vol. 99, no. 101985, pp. 1–22, 2021. [Google Scholar]
16. M. Nilashi, H. Ahmadi, G. Arji, K. O. Alsalem, S. Samad et al., “Big social data and customer decision making in vegetarian restaurants: A combined machine learning method,” Journal of Retailing and Consumer Services, vol. 62, no. 102630, pp. 1–18, 2021. [Google Scholar]
17. D. Cosme, D. Zeithamova, E. Stice and E. T. Berkman, “Multivariate neural signatures for health neuroscience: Assessing spontaneous regulation during food choice,” Social Cognitive and Affective Neuroscience, vol. 15, no. 10, pp. 1120–1134, 2020. [Google Scholar]
18. W. Hidayat, M. Ardiansyah and K. Kusrini, “Decision support system for selection of staples food and food commodity price prediction post-covid-19 using simple additive weighting and multiple linear regression methods,” in 2020 3rd Int. Conf. on Information and Communications Technology (ICOIACT), IEEE, Yogyakarta, Indonesia, pp. 45–50, 2020. [Google Scholar]
19. G. Baryannis, S. Dani and G. Antoniou, “Predicting supply chain risks using machine learning: The trade-off between performance and interpretability,” Future Generation Computer Systems, vol. 101, pp. 993–1004, 2019. [Google Scholar]
20. C. Bian, H. Shi, S. Wu, K. Zhang, M. Wei et al., “Prediction of field-scale wheat yield using machine learning method and multi-spectral uav data,” Remote Sensing, vol. 14, no. 6, pp. 1–18, 2022. [Google Scholar]
21. M. Y. Shams, O. M. Elzeki, L. M. Abouelmagd, A. E. Hassanien, M. Abd Elfattah et al., “HANA: A healthy artificial nutrition analysis model during COVID-19 pandemic,” Computers in Biology and Medicine, vol. 135, no. 104606, pp. 1–16, 2021. [Google Scholar]
22. J. Peacock and P. Peacock, “Oxford handbook of medical statistics,” in Oxford University Press, 1st ed., vol. 1. New York, USA: Oxford University Press Inc., pp. 76–98, 2011. [Google Scholar]
23. A. L. Samuel, “Some studies in machine learning using the game of checkers,” IBM Journal of Research and Development, vol. 44, no. 1.2, pp. 206–226, 2000. [Google Scholar]
24. L. Zhou, C. Zhang, F. Liu, Z. Qiu and Y. He, “Application of deep learning in food: A review,” Comprehensive Reviews in Food Science and Food Safety, vol. 18, no. 6, pp. 1793–1811, 2019. [Google Scholar]
25. M. A. El-Dosuky, M. Z. Rashad, T. T. Hamza and A. H. El-Bassiouny, “Food recommendation using ontology and heuristics,” in Int. Conf. in Advanced Machine Learning Technologies and Applications (AMLTA), Springer, Cairo, Egypt, pp. 423–429, 2012. [Google Scholar]
26. M. Elhoseny, Z. Tarek, I. El-Hasnony, “Advanced cognitive algorithm for biomedical data processing: COVID-19 pattern recognition as a case study,” Journal of Healthcare Engineering, vol. 2022, pp. 1–11, 2022. [Google Scholar]
27. T. U. Rehman, M. S. Mahmud, Y. K. Chang, J. Jin and J. Shin, “Current and future applications of statistical machine learning algorithms for agricultural machine vision systems,” Computers and Electronics in Agriculture, vol. 156, pp. 585–605, 2019. [Google Scholar]
28. A. Y. Abyaneh, A. H. G. Foumani and V. Pourahmadi, “Deep neural networks meet csi-based authentication,” ArXiv Preprint, ArXiv1812.04715, pp. 2–8, 2018. [Google Scholar]
29. D. Arpit, B. Kanuparthi, G. Kerg, N. R. Ke, I. Mitliagkas et al., “h-detach: Modifying the LSTM gradient towards better optimization,” ArXiv Preprint, ArXiv1810.03023, ICLR, pp. 1–19, 2018. [Google Scholar]
30. E. -S. M. El-Kenawy, M. M. Eid, M. Saber and A. Ibrahim, “MbGWO-SFS: Modified binary grey wolf optimizer based on stochastic fractal search for feature selection,” IEEE Access, vol. 8, pp. 107635–107649, 2020. [Google Scholar]
31. R. H. Assaad and S. Fayek, “Predicting the price of crude oil and its fluctuations using computational econometrics: Deep learning, LSTM, and convolutional neural networks,” Econometric Research in Finance, vol. 6, no. 2, pp. 119–137, 2021. [Google Scholar]
32. A. Botchkarev, “Evaluating performance of regression machine learning models using multiple error metrics in azure machine learning studio,” SSRN3177507, pp. 1–16, 2018. [Online]. Available: https://ssrn.com/abstract=3177507. [Google Scholar]
33. M. Y. Shams, A. Tolba and S. Sarhan, “A vision system for multi-view face recognition,” International Journal of Circuits, Systems, and Signal Processing, vol. 10, no. 1, pp. 455–461, 2017. [Google Scholar]
Cite This Article
 Copyright © 2023 The Author(s). Published by Tech Science Press.
This work is licensed under a Creative Commons Attribution 4.0 International License , which permits unrestricted use, distribution, and reproduction in any medium, provided the original work is properly cited.
 Downloads
 Citation Tools