
 Submit a Paper
 Propose a Special lssue
 Open Access
ARTICLE

Spatio Temporal Tourism Tracking System Based on Adaptive Convolutional Neural Network
1 Department of Computer Science and Engineering, Rajalakshmi Institute of Technology, Chennai, Tamil Nadu, 600104, India
2 Department of Computer Science and Engineering, R. M. D. Engineering College, Chennai, Tamil Nadu, 601204, India
* Corresponding Author: L. Maria Michael Visuwasam. Email:
Computer Systems Science and Engineering 2023, 45(3), 2435-2446. https://doi.org/10.32604/csse.2023.024742
Received 29 October 2021; Accepted 15 February 2022; Issue published 21 December 2022
A correction of this article was approved in:
Correction: Spatio Temporal Tourism Tracking System Based on Adaptive Convolutional Neural Network
Read correction
 View Full Text
 Download PDF
Abstract
Technological developments create a lot of impacts in the tourism industry. Emerging big data technologies and programs generate opportunities to enhance the strategy and results for transport security. However, there is a difference between technological advances and their integration into the methods of tourism study. The rising popularity of Freycinet National Park led to a master plan that would not address cultural and environmental issues. This study addresses the gap by using a synthesized application (app) for demographic surveys and Global Navigation Satellite System (GNSS) technology to implement research processes. This article focuses on managing visitors within the famous Freycinet National Park. Extremely comprehensive structured data were analyzed in three phases, (1) identifying groups of visitors who are more likely to use the walking trails, (2) those who are more and less likely to visit during/peak crowding times, and (3) finally creating an integrated Spatio-temporal dependency model via a machine-based learning system for real-time activity. This research examines innovative techniques that can offer energy resources to managers and tourism agencies, especially in detecting, measuring, and potentially relieving crowding and over-tourism.Keywords
The data mining method is used for organizing the data according to the pattern of the consumer plans. The user pattern required for the data warehouse gives relevant and relative data. There are two distinct types of data mining techniques: descriptive and predictive. The descriptive approach offers detailed knowledge on structured data when the predictive approach projects data. Data mining can detect a given pattern from a vast volume of data. A successful data mining method can handle the quantity, veracity, variety, velocity, and value of large-scale data. Data mining is an innovative technique employed in various novel applications. Tourism management is one of the research fields gradually being integrated into data mining. Several travelers across the globe are willing to travel where they need a costless guide to travel to various tourist spots worldwide. Tourism is one of the largest industries in the world, contributing to the United States Dollar (USD) 8.3 trillion of global Gross domestic product (GDP) in 2017, and is expected to grow by 3.8 percent annually over the next decade. The critical contribution of tourism is attributed to spending by travelers when traveling. Thus, creating effective marketing strategies and travel products becomes critical for tourism managers to understand travel behavior to optimize return on investment by companies’ automated monitoring of visitor behavior.
The GNSS technology measures the accuracy at the mm level of the static displacements. Its complex measuring precision has also increased significantly over vertical and horizontal direction over the past two decades, with measuring accuracies between 20 and 10 mm. SHM has built and implemented successfully GNSS-based surveillance systems for long-range bridges, walls, chemicals, and buildings. However, several works have improved GNSS measurement precision due to ephemeris error constraint, ionospheric error, tropospheric error, multipath error, receiver measurement noise, etc.
Researchers quickly discovered that the new survey-based questionnaire approach is unsuccessful in gathering accurate data about tourism activities. Because of the rich information, travel diaries are used as supplementary data sources. Diaries are typically used to record traveler habits, preferences, places visited, dates and times of visits, and modes of transport. Travel diaries have been used in numerous researches to gain insights into the tourist’s preference for events, travel experiences, and movement trends to assist tourism executives in managing destinations. Although the parts of visit journals are commonly used for research, their ability to provide valuable and helpful data to travel industry specialists is not fully used. As a rule, travel journals provide information about travel designs and the importance of these examples. As a rule, the word “utility” refers to how valuable an example is and how system settings can be used to converse with it. Travel journal focuses on tourist movement inside the much-looked Freycinet national park. Extremely detail-oriented data were analyzed in three stages;-a group of visitors who became more eager to use the walking tracks, some more and less are interested in visiting at peak crowding periods, and finally, developing an integrated Spatio-temporal dependence mechanism using a machine-based learning system.
The article describes the effect that creates approaches can have on natural resource managers and tourism authorities, particularly when it comes to identifying, assessing, and eventually reducing crowd and over-tourism. The use of machine learning for intelligent retail and tourism applications is the ultimate objective of providing value-optimizing user goods and services. One way to do this is by recommending systems learned from the characteristics of products that each customer has enjoyed in the past and common user expectations to provide a recommendation that maximizes the likelihood of users purchasing that product. Smartphones and wearable devices are fitted with various sensors that can provide information about what the users are doing (moving, driving, playing, etc.) and their surroundings (weather, geolocation, etc.). It is called contextual awareness, which can provide valuable information to suggest systems. The Spatio-temporal dependency model combines Gaussian processes with pure spatial dependency structures and a strictly temporal component.
This investigation aims to assess the efficiency of a hybrid swarm intelligence-based machine learning system that includes accelerated particle swarm optimization for tuning hyperparameters and improves forecasting accuracy by supporting vector regression in multi-output minus squares [1]. The evaluation of the APSO algorithm is done using five benchmark functions with unimodal and multimodal characteristics. The obtained results show that APSO is very successful and quickly converges. APSO self-tuning was developed to ensure that optimum parameters are applied to APSO. A graphical user interface was developed to expand the variety of practical applications of the proposed framework to improve its usability. Experiments involving optimized MOLSSVR were performed using a feature of the RBF kernel. Many computer/deep learning approaches with metaheuristic algorithms can be designed using the same hybrid approach. This study showed that the proposed virtualization of hybrid swarm knowledge in a dual-output scheme will allow structural and geotechnical engineers to diagnose, monitor, and predict natural hazard-related issues.
The outcomes explain how various consumer groups pass the world over. Of course, not all sources of LBSN (location-based social networks) are equally appropriate for specific use cases, but researchers and tourism analysts with tools need to evaluate this. There are certain drawbacks to operating with limited knowledge regarding the traveler’s mobility [2]. So, they must filter out a lot of trips regarding data quality problems as the results could be biased against the actions of tourists to post their position on LBSNs constantly. A statement of the findings should also be carried out with caution. Thus, they need to bargain with around two outdated static informational collections on Foursquare and Flickr and put a ton of exertion into making our rundown of Twitter trips utilizing the official APIs. Numerous LBSNs, for example, Facebook, Instagram, or Snapchat, don’t require the autonomous substance to be acquired.
MMRAs will promote creativity and design breakthroughs by encouraging engineering teams to access rich, personal customer data and transparently allow customers to share their experiences. Moreover, MMRAs can go beyond the boundaries of conventional research techniques and encourage creative Big Data ways to interact with empowering specialists and technologists to get closer to the bona fide voice of customers. Though MMRAs are economical, they are also a good alternative for standard knowledge acquisition [3]. It follows their challenges, allowing the development of which configuration groups are to manage new systems and capabilities.
The research applies to current studies at second homes in two respects. The work measures the Medium spatial and temporal resolution of Corsica’s second home, an island in the Mediterranean. Since this field is not quantitatively studied, our results will likely provide applicable information only for local government action. The importance of space and time from a methodological perspective is established [4]. For other second home analyses, spatial, temporal, and Spatio-temporal information is most likely overlooked. In addition, to our knowledge, the method has not been used to investigate second homes in each location. Besides latent spatial and temporal details, the inclusion of amenity and socio-economic factors provides additional insights into the second home ratio in Corsica. However, implementations of quantitative methods are only in their infancy stage in second home analyses, and much remains to be learned. The constraint comes firstly from data quality. Second, the quantitative approach would tackle the data complexities of both the spatial and the temporal. But addressing these issues extensively complicates the product’s design or requires more versatile models. Finally, in Bayesian spatial modeling, the endogeneity of the independent variable is still under study.
Travel recommendation systems tend to keep up with improvements in technology. Current approaches can produce customized, actual-time, perspective-conscious guidance instead of early-stage travel forecasts that provide linear guidance based on internal information sources. Considering that the traveler undertakes an exploratory trip, contextual analysis plays a crucial role in providing contextualized suggestions using cultural information [5]. Remember that the Big Data capabilities are still to be thoroughly exploited by the movement recommender system. The need is to be emphasized for more protection and security considerations while structuring new calculations for improvement as the level of individualization and contextualization develops.
It develops a method that explicitly integrates safety and mobility within pathfinding. The critical point in developing mobility and security-based pathfinding issues is to increase valuable data from the investigation gathered from associated vehicles. Three essential security files were acquainted with to talk about wellbeing, crash recurrence, volatilities of course speed and increasing speed, and unpredictability of driver. To quantify a cost work called “course impedance,” the calculation consolidates the inferred wellbeing lists and travel time depending on the client’s predefined versatility and security loads and recommends a course with the least impedance esteem [6]. It proposes a novel approach focused on knowledge gaps in several main aspects: incorporating security and driving hazard in pathfinding, utilizing Big Data delivered by Connected Vehicles (CV) to catch and evaluate framework and driver hazard, and consolidating CV information with ongoing travel data in a way discovering issues.
The social practice of promoting harmony dramatically impacts the people of China. Both features complement each other to strike a rare balance between tolerantly fine and thoughtfully structured. The US varies considerably from China. The ideology of leisure consumption by U.S. visitors makes restaurants (and maybe other places of tourism) a place for them to look for life and pleasure [7]. Furthermore, their promotion of freedom of speech often eliminates the uncertainty of awarding lower scores while experiencing negative experiences. Specific recommendations include changing the food category and flavor to match Chinese visitor preferences, paying close attention to the menu description and food specifications set by Chinese tourists, asking U.S. tourists about the meal occasion followed by recommending appropriate tables, seating Chinese tourists in a quiet location and offering e-coupons to potential Chinese tourists.
The most important commitment of this exploration is its idealistic combination with enormous information investigation of the theoretical framework for the visitor typology. The typology hypotheses and the job SIT (Special Interest Tourism) holding inside the traveler area were put to an exact test with online life information [8]. The outcomes are following the past contention that SIT presently has a lot more extensive standard crowd (sharks) or, instead, that the idea of the mass travel industry has widened its degree to retain specific recently arranged visitor exercises as SIT domain [9]. Travel journals focus on a massive job of providing bits of information to venture out guided tour activities that help the travel industry leaders make critical decisions and make choices. Despite frequent usage, the movement journal’s capacity has not been used without restriction. A significant portion of ongoing exploration is based on current travel examples to introduce regular travel activities for various applications [9]. The importance of these travel trends offers essential guidance in designing highly effective travel packages for transport and tourism practitioners. But it was not noticed. A large-scale data collection documenting Turkish travelers’ outbound travel behavior has proved the benefit of the proposed solution.
A hetero-generous graph-based, collaborative user education network and Point of Interest (POI) sin LBSN (UP2VEC) description is introduced. The depictions of experienced users and POIs are independent of the task. They can also be used legally as inputs for various LBSN events, such as plans for POIs and predictions of social relations. Via a heterogeneous POI client diagram [10], UP2VEC jointly prepares social cooperation, geological effects, and time-consciousness. It also makes use of the effective implanting calculation method for portrayal learning. The suggested solution has simultaneous computing power, which applies to large datasets. The experimental results indicate that the user and POI insights obtained from such a strategy can be used to improve the performance of LBSN tasks, such as the suggestion of location and prediction of connections. Hence, the design of the neural network and the attention mechanism built by LBSN are to be deliberated to optimize POI learning and user representation.
An increasing number of transport researchers have faced the explosion of big data when dealing with research issues. This thesis aims to reduce the research gap by using advanced data mining techniques [11]. The current research is not without bounds. The number of participants in the survey is lowered for this study. A systematic study with many survey participants from a wide range of transportation safety practitioners with a broader range of bug data issues and concerns is needed. This work is among the first to integrate contextual research and GIS diagrams for the data-mine scenic region into travel blogs [12]. It demonstrates the importance of those user-generated contents to attract the scenic area’s demand and satisfaction analysis. This is an observational study of travel guide data on scenic area attractions, with significant room for future studies. Recommendations incorporate dissecting the photographic substance of movement guides, directing special investigations among various fragments of the visitor advertisements, and breaking down cross-approval utilizing regular information.
It should be noted, however, that this is not the absolute achievable value because GNSS precision depends on many factors, including the availability and visibility of satellite, the blockage of signals from trees and buildings, the effect of multi-path errors, and the experience of observers to name but a few [13]. Such sources of error might have led to the attained low accuracy. The findings, however, already indicate GNSS’s ability to produce topographical maps worthy of supporting the mentioned environmental applications, although essential to point out that this is not definitive due to the problems of error sources and restricted data.
The decentralized networking system recently became very popular. China’s government and industrial society pay much attention to the emerging technologies and new applications in this field. Currently, the hotspot in the academic sector for various unorthodox tourism emergencies is prediction and decision-making based on an autonomic networking platform. In addition, the data mining and intelligent tourism emergency prediction platform are to be incorporated to expand the implementation of the autonomous networking program, which has a specific effect in helping the government leverage the tourism industry’s capacity [14].
The existing data mining methodology focusing on individual variable research will be implemented to evaluate the primary factors of resort occupancy levels. The advantages of this model are that subordinate factors are commonly autonomous and have a specific practical premise [15]. The decided factor weightings give knowledge into the potential degree of their impact on inheritance levels in various lodgings.
This research focuses on tourist mobility inside the famous Freycinet national park. The accurate information was analyzed in several phases by identifying the groups of users who are more likely to walk through the tracks, those who are more inclined to visit during peak crowding periods, and eventually developing an optimized space and time-dependent system through a machine-based training method.
The conceptual hybrid model CNN_RNN takes the time series function map as data in this research. It includes community features, design, facilities, climate, and events. Independent time series are historical data relating to visitor traffic, time factors, environmental factors, and a Baidu search database. This Principle concerns the vector-word approach used in the analysis of natural languages. At this point, expansive Tourist Conservation is a natural language to be referred to. An associated set of characteristics in a tuple is considered the number of visitors within the time series; then, it must establish nearly new regression data. The number of historic tourists is collectively classified by its associated characteristics at each moment. Then, while sliding the window into the CNN module, the feature map generated by the input time series data is given. The width of the Screen flipping is set to 16, the step size is set to 1, and the scale of the interface characteristics chart is set to 16 to allow subsequent network measurements. In time series also, the function map for inputs is ordered.
The first groupings of information must be standardized to [0, 1] to increase the accuracy of standards and to align the information before the neural network CNN_RNN is used for relapse. This article uses the standardization process min_max, which shows the formula below:
where *
This study selects Freycinet Scenic Spot’s daily historical data as the original data from 2015 through 2019. The data from 2015 to 2019 will be included as a collection of training; the data for 2019 was used to collect tests.
The framework was developed with a deep learning approach. Deep learning has been used in recent decades for a variety of applications. Specifically, in Spatio-temporal implementations, two key types of deep learning frameworks are often used: Convolution neural networks (CNNs) for viewing spatial and recurrent neural networks (RNNs) to learn temporally, as shown in Fig. 1. For each region, input (entry) and outflow (exit) is computed as a two-channel flow matrix; the computational steps follow. The two-channel interval flow matrices are then fed separately into the three components in each fragment of time to model the three temporal properties: closeness, length, and trend. The time axis reflects modern times, history, and distant history. The accuracy of the classification is determined as shown below:
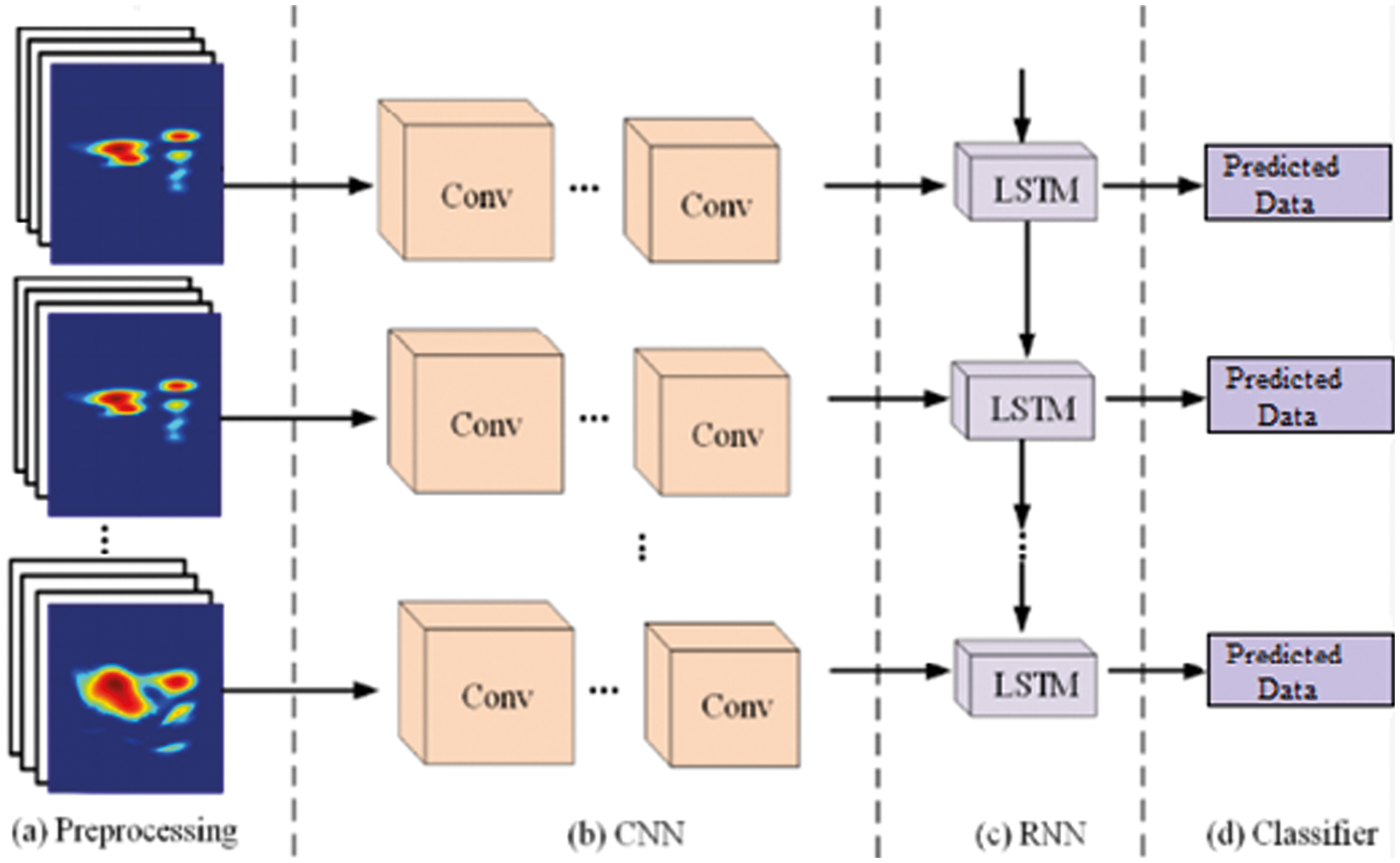
Figure 1: CNN_RNN block diagram
The three parameters consist of a neural network convolution followed by residual units capturing spatial dependence between nearby and remote areas. The yield of the three parameters is modified once more, considering grids of parameters that applied various loads with the impacts of various parameters in various areas. Each segment is made up of layers of convolution and delay units. The spatio region’s reliance is created utilizing the CNN layer, and the calculation’s delay engineering is utilized to display the fleeting closeness, time, and example properties of the visitor stream.
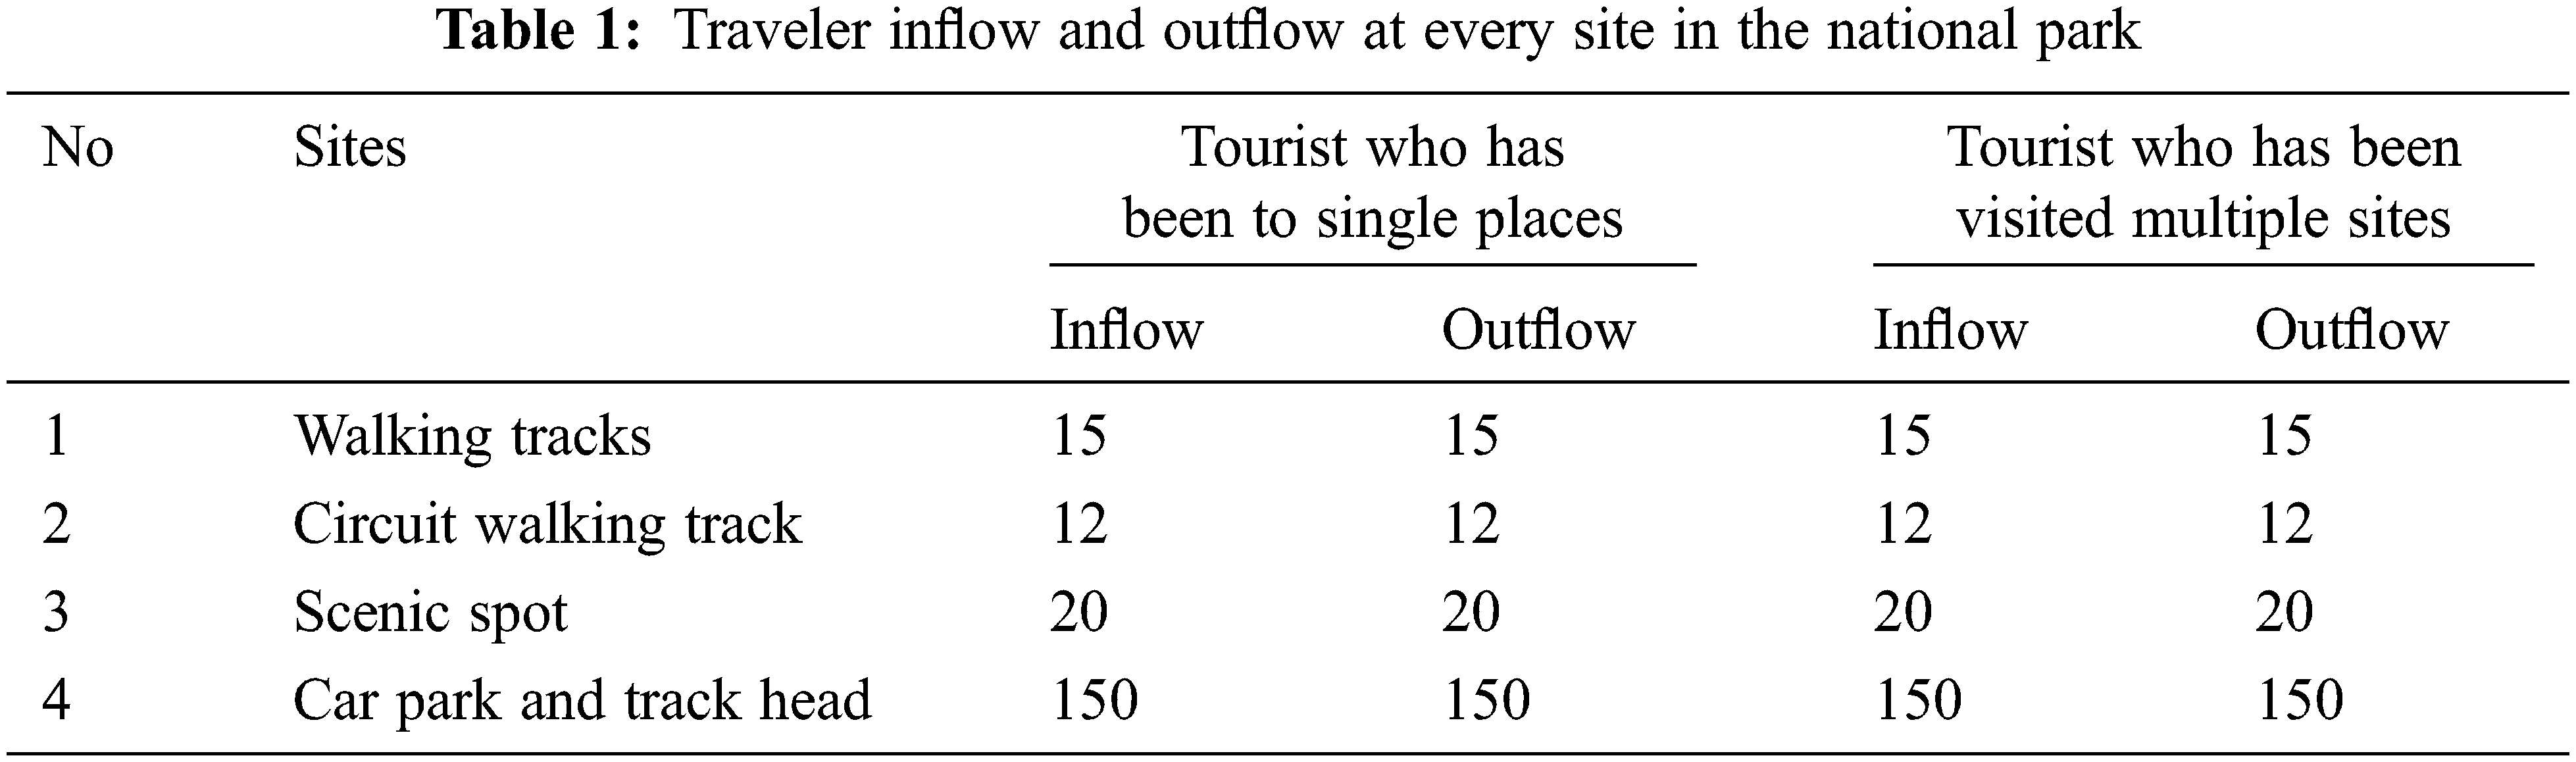
These approaches used the same information as the first two phases and measured the usage of the Freycinet National Park’s only four major tourist attractions, as shown in Tab. 1. There are other sites within the park, and phase one and phase two tests were performed, and it was determined to focus only on the populated areas. The number of single tourist influxes (entry) and outflows (exit) results were shown at each location. The model is then used to measure the number of tourists visiting the exact location more than once, compared to the actual number of tourists.
GNSS frameworks provide opportunities for discovering, finding new, attractive travel industry objects, gathering spots, culture, etc. For those concerned with developing travel industry outcomes, these developments empower a relatively straightforward method for getting specific data from the region within a short timeframe. Applying post-handling pre-treatment opens space for the elective utilization of the obtained sets of zone detailed data, for example, for understanding an intuitive introduction or touring. The data for this investigation is derived from a more significant task that followed the development of accessible, autonomous occasional visits. Because of the limitations of the techniques surveyed, a different system for collecting the following information has been developed. The tailored Smartphone application was made with the GSP, which included an exit and study section and follow-up capabilities.
where N is the total number of days
The defined sample interval is [a, b] or the time interval from the period a to time b is t hours; the time interval of [c, a] is set simultaneously, and the time delay is also t hours. Let the first phone users be collection B, where the total number of persons is listed as being, and allow the second phone users to collect C, where the final number of participants is counted as C.
(1) The total number of the tourist attractions in the time frame [a, b], with the set is expressed as
(2) The number of tourists to the tourist spot, both within the time [c, a] and next time [a, b] when the range is described as
(3) The number of tourists who were not in the scenic spot during the timeframe [c, a] but appeared within the timeframe [a, b], with the array represented as
(4) The outflow of the scenic spot over a given period is the number of visitors that took place within [c, a] but did not appear within [a, b], the set is represented as:
(5) The massive increase with a certain amount of time in the scenic spot is the net change in the number of visitors at the scenic spot over the period [a, b] as opposed to the period [c, a]. The list is translated as
(6) The transition in the picturesque spot over a given timeframe is the net increase in the number of travellers over the period [0, b] the increase in the number of visitors over the period [a, b] in addition to the aggregate gain during [0, a]. The finding can be translated as
Let S be the segment of the trip defined by the Sj = (P j, A j) tuple, where P j is a P j = {P 1, A j is a list of user parameters A j = {start, end, mode, target} with, start < end is the start time of the phase, the end stops time of the section, the model is transported, the goal is objective of the trip. The trip variable is, and a single line identifier is j. Using the equations below, check the accuracy o GNS data:
where (n) and (t) variables are used to count the number of places in P j and to extract the time mark from a location. In idle mode, the possible number of GNSS position seconds with a sampling rate of 1 Hz is equal to the segment length.
The GNSS app was loaded into a Smartphone with three gigabytes of data, allowing members to participate. The investigation telephone could be connected using a hotspot function to these individual’s member telephone to access the information from their gadgets. Members are selected from India’s three major parts. The data analysis twisted on three key issues to access infrastructure usage: the specification of how the parking system is used and the specification of the Spatio-temporal dependency of tourist flexibility. The Spatio-temporal dependency model is built in a machine-based learning environment by visualizing spatio-and temporal properties. Both are contextualized under the Proximity and Time concept.
4 Spatio-Temporal Dependence Tourist Model
Consumption of both the machine-based learning state and the Jupyter open-source level is established. The reality (e.g., spatio-worldly, dependence) is viewed using the nearness hypothesis and demonstrated for close and far-off spatio properties. Fleeting dependence for range, time, and pattern characteristics is also conceived and demonstrated. In all environments, the inflow (passage), for instance, when a traveler leaves one district to another area, of a population in a particular region is determined by the surge (departing). The flow can also be affected by the far-off city, for example, when vacationers travel a far-reaching way to visit vacation spots from their accommodation. The development of sightseers is affected by their season of appearance when thinking about worldly conditions.
Applied spatio-temporal for tourists. We omitted concurrent temporal delays in the template for the objectives of tourist identification; the final model is given as:
where
where Ỳ assigns the tourist, the value expected, and y is the actual value. Remember that all expected values, regardless of whether log-changed or unified, must be interpreted back to the first scale to measure the tourist estimation error.
The other modeling subject is “time,” which includes visitor numbers at the opening/closing time. The third transient reliance was enhanced as a set where the volume follows some pattern with a period delay, including changes initiated by broadened sunshine hours throughout the winter season. In the long run, the inflow and outflow of travelers to any region are characterized at a given time by the all outnumber of vacationers that enter and leave the territory. A calculation has been developed to scan inflow and outflow dependent on the relative enhancements to the set hypothesis.
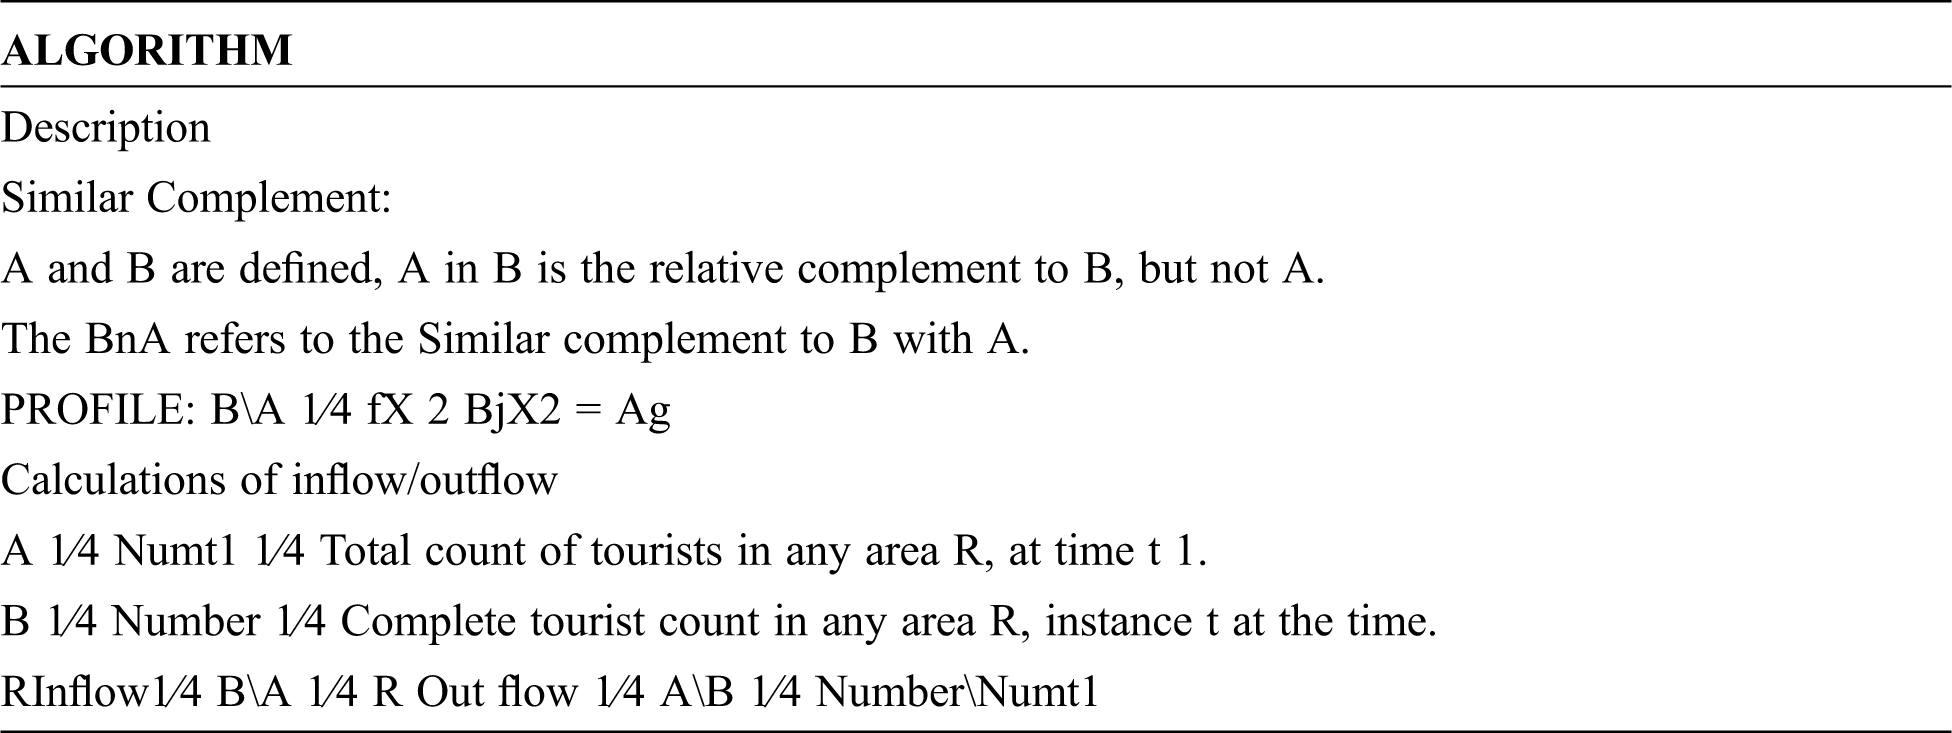
After calculating the tourist inflow/outflow at any location at any time, implemented this algorithm into the simulation and visualization techniques model.
Following this, the hour of takeoff flight and all-out term of stay were collected through expanded stopping use inside the “Stopping and Track Points” records. The appearance hour has been dictated by distinguishing the first and last points in the “Stopping and Track Points” informational collection. If the phone begins in the recreation center (for example, the battery is at the running level), the flight time would be disparaged.
However, this has been considered as the only way to deal with these questions of stopped telephones before they return to the parking lot. It also reported the subset of tourists who arrived in the parking area after 1 p.m. and left before 12 am while tourists used the car-park between 12:00 and 1:00 p.m as shown in Fig. 2. Utilizing such occasions, a virtual rundown was made in the ArcGIS setting and the conveyance of their stopping time was envisioned. Each vacationer’s dataset was joined with the subtleties acquired during the overview of section and touristic action.
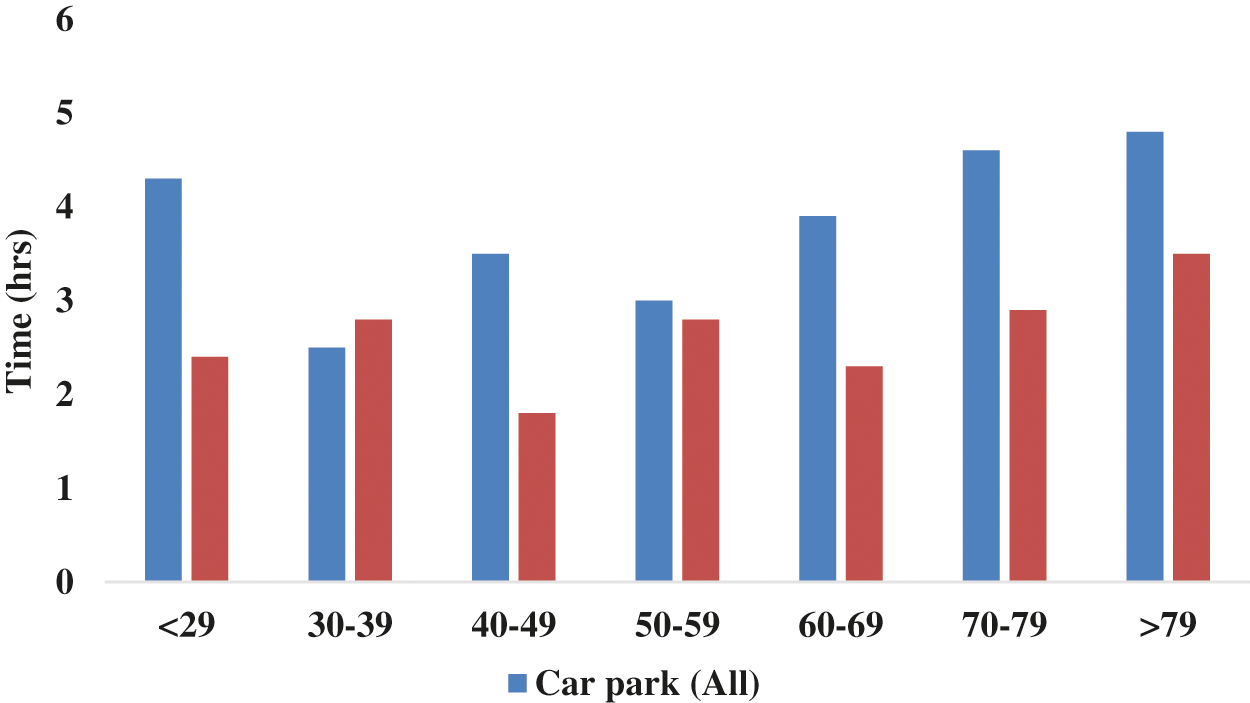
Figure 2: Time using car park by age
All days are given in a 24-h decimal process and the model to assess tourists on both days is shown in Fig. 3. Saturday has emerged as one of the quietest days for all locations when determining the use of trails by travelers during the weekdays.
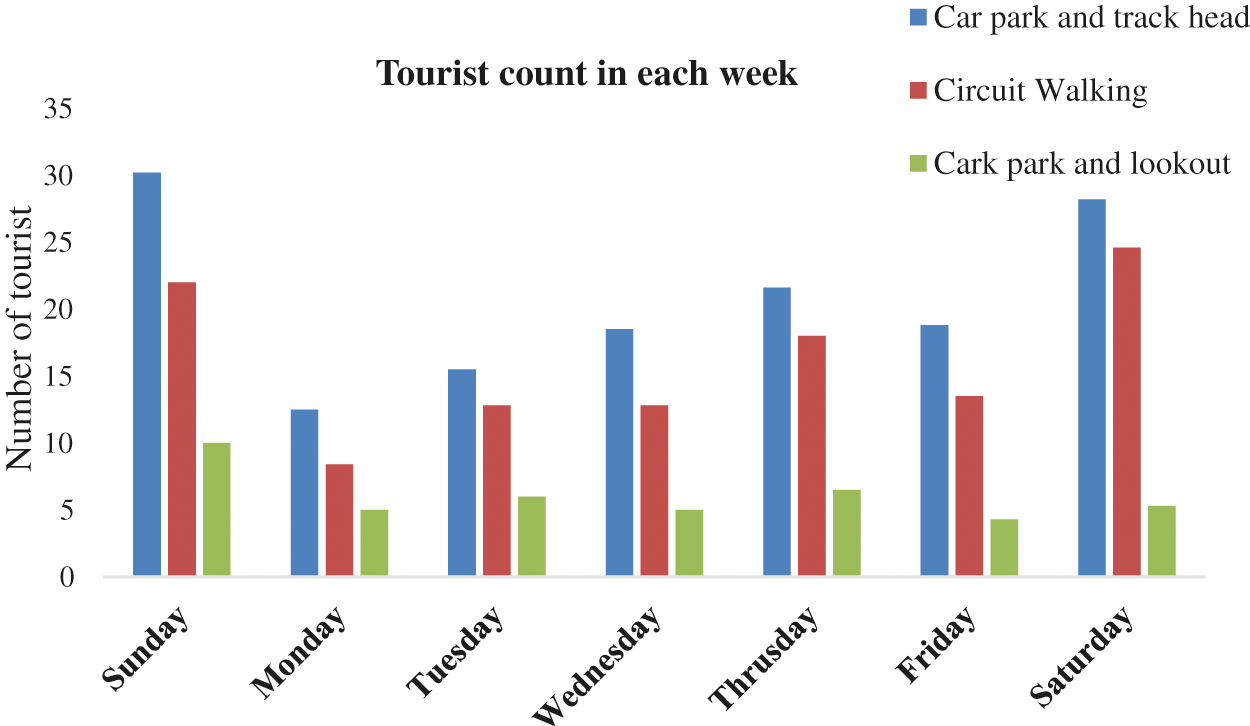
Figure 3: Tourist movements by location and weekday, via locations in the national park
In January, fewer visitors are there to the park among the range of months, but this is due to recruitment starting this month. The following months indicated that in February and March, a quick increment of travelers is noticed to the vehicle park and track head; in addition to the vehicle park to watch out, visitors visiting Freycinet National Park has also declined conceivably because of the climate as shown in Fig. 4.
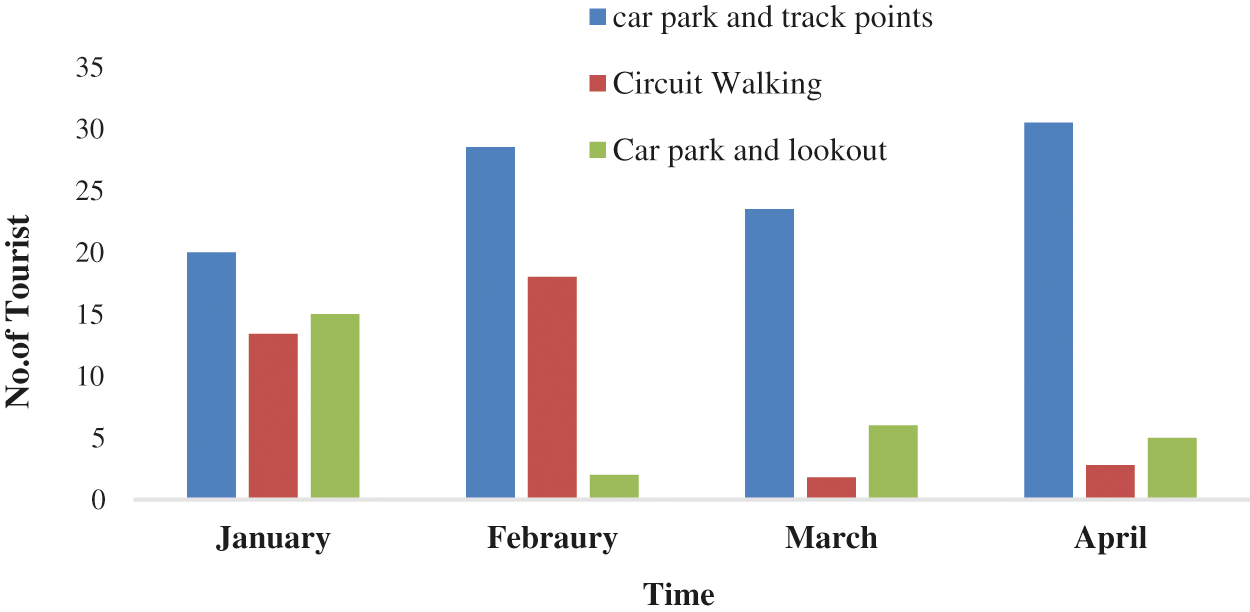
Figure 4: Development of visitors by site and month in local freycinet national park
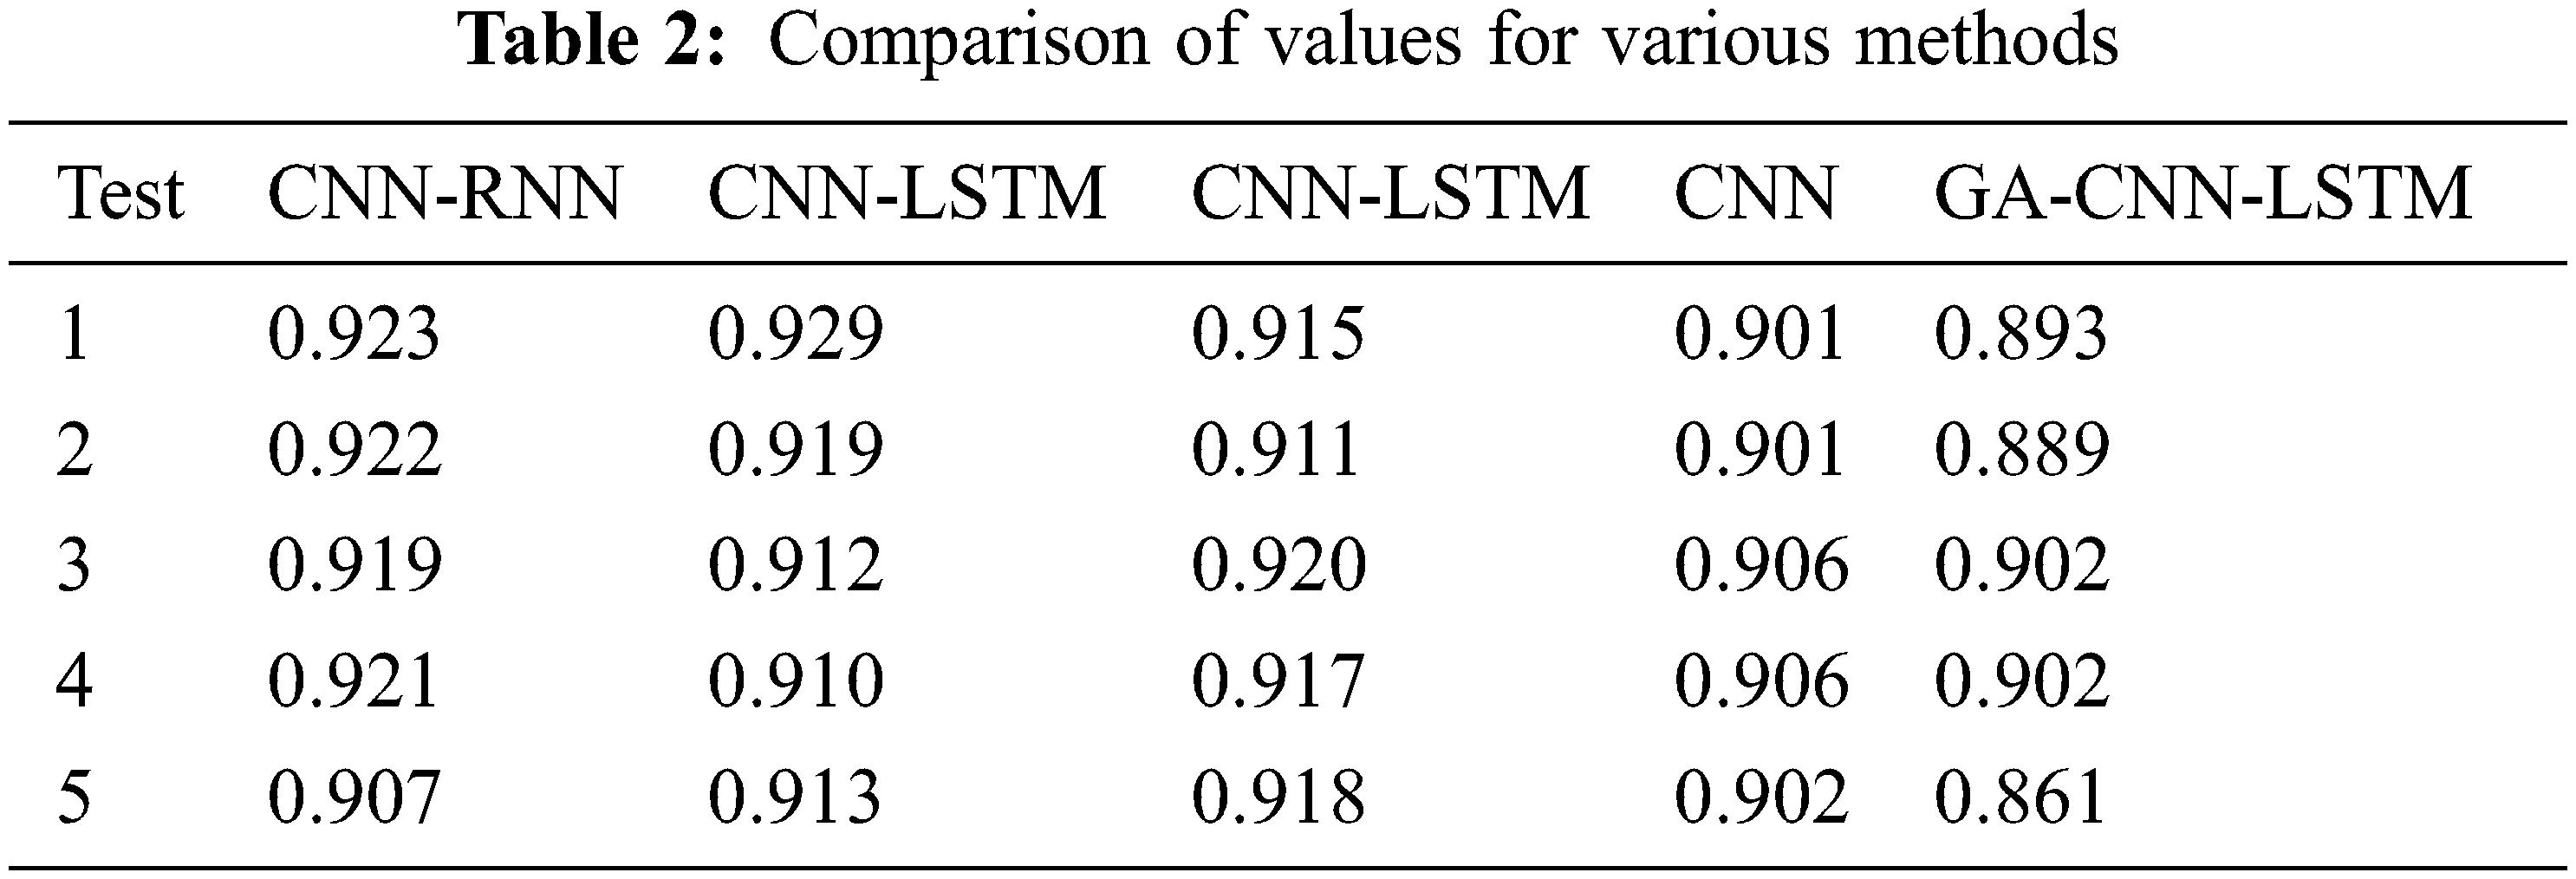
Tab. 2 describes the comparison of values using various methods for tourism prediction. Convolution neural networks (CNNs) for viewing spatial and recurrent neural networks (RNNs) to learn temporally. The CNN-RNN algorithm provides 0.907, the CNN-LSTM algorithm provides 0.913, the CNN algorithm provides 0.902, and the GA-CNN-LSTM algorithm gives 0.861 for 5 test data.
Tourism has become a significant part of the national economy. An important issue for the tourist management team is how to handle tourists scientifically and effectively. Tourist flow prediction is the management principle. The tourist management department can only make a rational allocation of tourist resources under the assumption of reliable prediction and ensuring sustainable tourism growth. The Source of this analysis is a national park. It uses environmental historical data to create a new collection of data to express tourist flow and develop a prediction method based on the GNSS mobile app. At the same time, by the correlation studies, the lag duration between web search and travel has been given. Like other algorithms, this GNSS approach automatically forecasts the regular tourist flow more accurately than other algorithms. However, in the experiment, some weaknesses are found that are worth further investigation. Definitions include how influencing factors such as pre-processed data and CNN_RNN construct can be identified. While the precision of the CNN_RNN hybrid over the peak duration is higher than the other algorithms, the average peak-time of predictive efficiency remains inadequate. In this investigation, the GNSS forecast approach suggested by and large provides new thoughts for forecasting the daily stream of travelers. This strategy has good prospects in the research for developing tourism management which can create a stable tourism industry with sustainable growth.
Funding Statement: The authors received no specific funding for this study.
Conflicts of Interest: The authors declare that they have no conflicts of interest to report regarding the present study.
References
1. A. Crivellari and E. Beinat, “LSTM-based deep learning model for predicting individual mobility traces of short-term foreign tourists,” Sustainability, vol. 12, no. 1, pp. 349, 2020. [Google Scholar]
2. W. D. Linus, S. Avradip, R. Rinita and W. Wolfgang, “Mining trips from location-based social networks for clustering travelers and destinations,” Information Technology & Tourism, vol. 22, no. 1, pp. 131–166, 2020. [Google Scholar]
3. W. Green, C. Robert and M. Gasparin, “Mobile market research applications as a new voice of customer method: Implications for innovation and design management,” Research-Technology Management, vol. 63, no. 1, pp. 49–55, 2020. [Google Scholar]
4. P. G. Griffin, M. Megan, C. Simek and W. R. William, “Mitigating bias in big data for transportation,” Journal of Big Data Analytics in Transportation, vol. 1, no. 11, pp. 1–15, 2020. [Google Scholar]
5. S. Renjith, A. Sreekumar and M. Jathaveda, “An extensive study on the evolution of context-aware personalized travel recommender systems,” Information Processing & Management, vol. 57, no. 1, pp. 102078, 2020. [Google Scholar]
6. H. Nima, A. Ramin, A. J. Khattak and L. D. Han, “Integrating safety and mobility for pathfinding using big data generated by connected vehicles,” Journal of Intelligent Transportation Systems, vol. 1, no. 17, pp. 1–17, 2020. [Google Scholar]
7. J. S. Sixue, “Motivation and satisfaction of Chinese and US tourists in restaurants: A cross-cultural text mining of online reviews,” Tourism Management, vol. 78, pp. 10407, 2020. [Google Scholar]
8. M. S. David, A. P. Kirilenko and S. Stepchenkova, “Special interest tourism is not so special after all: Big data evidence from the 2017 great American solar eclipse,” Tourism Management, vol. 77, pp. 104021, 2020. [Google Scholar]
9. V. HuyQuan, G. Li and R. Law, “Discovering highly profitable travel patterns by high-utility pattern mining,” Tourism Management, vol. 77, pp. 104008, 2020. [Google Scholar]
10. Q. Yaqiong, L. Xiangyang, L. Chenliang, T. Hechan and M. Jiangtao, “Heterogeneous graph-based joint representation learning for users and POIs in location-based social network,” Information Processing & Management, vol. 57, no. 2, pp. 102151, 2020. [Google Scholar]
11. D. Subasish and G. Griffin, “Big data and transportation safety: Connecting the dots,” In The Proceedings of Transportation Research Board Annual Meeting, Texas A&M Transportation Institute, pp. 12–16, 2020. [Google Scholar]
12. J. Shao, C. Xuesong and A. M. Morrison, “How can big data support smart scenic area management? an analysis of travel blogs on huashan,” Sustainability, vol. 9, no. 12, pp. 2291, 2017. [Google Scholar]
13. D. Buhalis and M. Foerste, “Socomo marketing for travel and tourism: Empowering co-creation of value,” Journal of Destination Marketing & Management, vol. 4, no. 3, pp. 151–161, 2015. [Google Scholar]
14. J. Liu, D. Junping, S. Zengqi and J. Yingming, “Tourism emergency data mining and intelligent prediction based on networking autonomic system,” In 2010 Int. Conf. on Networking, Sensing and Control (ICNSC), pp. 238–242, 2010. [Google Scholar]
15. Wu H. Edmond, L. Rob and J. Brianda, “Data mining for hotel occupancy rate: An independent component analysis approach,” Journal of Travel & Tourism Marketing, vol. 27, no. 4, pp. 426–438, 2010. [Google Scholar]
Cite This Article
 Copyright © 2023 The Author(s). Published by Tech Science Press.
This work is licensed under a Creative Commons Attribution 4.0 International License , which permits unrestricted use, distribution, and reproduction in any medium, provided the original work is properly cited.
 Downloads
 Citation Tools