
 Submit a Paper
 Propose a Special lssue
 Open Access
ARTICLE

Early Warning of Commercial Housing Market Based on Bagging-GWO-SVM
1 Department of Civil Engineering, Henan University of Technology, Zhengzhou, 450001, China
2 Department of Civil Engineering, Zhengzhou University of Aeronautics, Zhengzhou, 450015, China
* Corresponding Author: Keqing Zhao. Email:
Computer Systems Science and Engineering 2023, 45(2), 2207-2222. https://doi.org/10.32604/csse.2023.032297
Received 13 May 2022; Accepted 27 June 2022; Issue published 03 November 2022
 View Full Text
 Download PDF
Abstract
A number of risks exist in commercial housing, and it is critical for the government, the real estate industry, and consumers to establish an objective early warning indicator system for commercial housing risks and to conduct research regarding its measurement and early warning. In this paper, we examine the commodity housing market and construct a risk index for the commodity housing market at three levels: market level, the real estate industry and the national economy. Using the Bootstrap aggregating-grey wolf optimizer-support vector machine (Bagging-GWO-SVM) model after synthesizing the risk index by applying the CRITIC objective weighting method, the commercial housing market can be monitored for risks and early warnings. Based on the empirical study, the following conclusions have been drawn: (1) The commodity housing market risk index accurately reflect the actual risk situation in Tianjin; (2) Based on comparisons with other models, the Bagging-GWO-SVM model provides higher accuracy in early warning. A final set of suggestions is presented based on the empirical study.Keywords
Since China’s reforms and opening up, the real estate industry has become one of the country’s most important macroeconomic drivers. However, the real estate industry is subject to a variety of risks, including price risk, inventory risk, and market risk. These problems will have a significant adverse effect on the economy of the country. In terms of consumers, the high cost of commodities will result in residents’ wealth being largely absorbed by real estate, thereby reducing the quality of people’s lives and increasing investment risks. Commodity housing market risks pose a potential threat to real estate companies, which limits their own development as well as harming the industry as a whole. Consequently, it is of great importance for consumers, real estate companies, and the country in general to establish a commodity housing risk warning system.
Risk factors in the industry of commercial real estate are numerous. One major factor that influences the commodity housing market is the house price. According to Liu et al. [1], house price fluctuations can elevate regional systemic financial risk. Risks associated with the commodity housing market have also been related to improper lending by financial institutions. Wang et al. [2] proposes to take into account the dynamics of the bank-real estate lending network for preventing real estate risks. According to Borrero-Dominguez et al. [3], empirical analysis revealed that the success rate of real estate crowdfunding was higher for projects financed by real estate enterprises than for those financed primarily through sales. The state of the national economy influences the risk of commodity housing markets. In Yang [4], consumer price index (CPI) and real estate development investments are identified as two of the major determinants of commodity housing market risk. According to Wang et al. [5], M2 and gross domestic product (GDP) are two of the primary influences on house prices. Recent studies have focused on the factors affecting risk related to the commodity housing market by constructing a system of indicators. Clayton [6] analyzed data about the Canadian real estate market, developed a comprehensive rating index, and analyzed the factors that contribute to the market’s risk. Zhang [7] uses the existing index system as the basis for building a comprehensive index of risks associated with the Beijing real estate market.
For the purpose of assessing whether there is a risk in the real estate market, indicators systems, statistical tests and models are commonly employed. Wu et al. [8] identified supply and demand indicators to assess real estate investment risk. Ustundag et al. [9] proposed combining fuzzy rules and fuzzy hierarchical analysis to develop a comprehensive model for assessing real estate investment risk. Zevadskas et al. [10] used the Technique for order performance by similarity to ideal solution (TOPSIS) gray method and the Complex proportional assessment (COPRA) method to evaluate the factors influencing the value of real estate. A study conducted by Tsai et al. [11] investigated the interaction between housing market risks in different cities by using a vector autoregressive (VAR)-multivariate generalized autoregressive conditional heteroskedasticity model (MGARCH) and a fluctuating impulse response function. CO [12] developed a threat management model that is based upon a static VAR model incorporating features of real estate investment risk. Wang et al. [13] examined a model for calculating the risk values of real estate development projects. Zhang et al. [14] developed a real estate financial risk analysis model, based on a gray Bayesian network and factor analysis models.
Currently, the most widely used early warning models for the commodity housing market are the STV Cross Section Regression Model (STV) [15], Markov regime switching (Markov) [16] and KLR signal analysis (KLR) [17]. The commodity housing market is often characterized by non-stationarity and non-linearity, resulting in relatively low early warning accuracy of these methods.
Machine learning methods are popular among scholars due to their high accuracy in prediction. Artificial Neural Networks (ANN) and Support Vector Machines (SVM) are the most commonly used models in current practice [5]. It should be noted that the artificial neural network model requires a large number of samples, parameter adjustment is challenging, and it is not possible to interpret its results [18]. SVMs are designed to handle small sample sizes while avoiding “dimensional disasters” and providing good generalization to avoid overfitting [19]. Wang et al. [20] developed an urban real estate early warning model based on SVMs for Beijing’s real estate market and recommended policy based on the model’s results. Wang et al. [21] achieved an optimized support vector machine model using the particle swarm algorithm, which optimizes the parameters of the model.
In recent years, scholars have increasingly focused on the Long Short Term Memory (LSTM) [22] and ensemble learning models (EL). The ensemble learning model combines the knowledge of multiple students, and its results are more accurate than the traditional single model [23]. Bootstrap aggregating (Bagging) is a learning algorithm that does not have a strong dependence on individual learner, and it can enhance the generalization capacity and noise tolerance of each individual learner [24]. Zhan et al. [25] proposes a Bagging-random forest learning system (BLS) that is more effective than other benchmark models at predicting COVID-19 flooding. Choi et al. [26] quantified the impact of renewable energy output on the power system using the Bagging-eXtreme Gradient Boosting model (XGBoost). The results indicate that the Bagging model is superior to other ensemble learning models, such as decision trees.
To develop grey wolf optimizer-support vector machine (GWO-SVM) models, we utilized SVM models to forecast market risks and Grey Wolf Optimizer (GWO) algorithms to determine hyperparameters of the model. After this process is completed, the GWO-SVM model is integrated with Bagging to improve prediction accuracy and generalization capabilities.
This paper is structured as follows: Section 2 focuses on the principles of SVM, GWO and Bagging methods. Section 3 will analyze the influencing factors affecting the commodity housing market and establish the index system and risk index. In Section 4, an early warning system and an early warning system regarding the commodity housing market in Tianjin will be established. The purpose of Section 5 will be to present the research findings and make policy recommendations. The conclusion will be provided in Section 6.
Support Vector Machines (SVM) stands for Support Vector Machine, which can be used for classification of discrete variables and prediction of continuous variables. SVC refers to Support Vector Classification (SVC), which is a classification algorithm within the SVM framework. As a result of its capacity to convert a high-dimensional linearly indivisible space into a low-dimensional linearly distinguishable space, this algorithm will generally have greater prediction accuracy than other single classification algorithms (such as Logistic Regression, Decision Trees, Parsimonious Bayes, KNN, etc.) [19].
As a result, SVM models enable small sample classifications with good generalization ability and robustness, while avoiding dimensional catastrophes and local optimum situations.
Suppose the training sample set has n samples:
The above equation can be expressed by adding the penalty factor C and the slack variable as:
Addition of the Lagrangian function is expressed as follows:
It is typical for SVM to use kernel functions to map the original data into high-dimensional space, converting nonlinear problems into linear ones for solving. In this paper, the polynomial kernel (POLY) is selected since it has better performance in nonlinear datasets than other kernel types: select
From Eq. (1) and Eq. (2), we have:
Set the optimal Langrange multiplier
In light of the above analysis, it is possible to obtain an optimal classification function:
2.2 Gray Wolf Optimization Algorithm
The Grey Wolf Optimizer (GWO) algorithm was first proposed by Seyedai [27] first proposed in 2014, is a novel pack intelligence optimization algorithm inspired by wolf predation behavior. There is a very strict hierarchy within the Grey Wolf family, which belongs to the canine family. The highest ranking wolf is
It is generally accepted that the hunting process of wolves is divided into three stages, starting with tracking, chasing, approaching and then pursuing, encircling and harassing the prey until it stops moving, then attacking the prey. Following is a detailed description of the process.
Wolf hunters are known to round up prey by the following method:
where, t is the number of current iterations of the algorithm;
In this equation,
When the gray wolf identifies the prey location, the wolf
where
The step size and direction of the wolf
In the event that the prey ceases moving, the wolf begins to attack. In the iterative process, the
As outlined below are the specific steps of the optimization process for the GWO algorithm (Fig. 1).
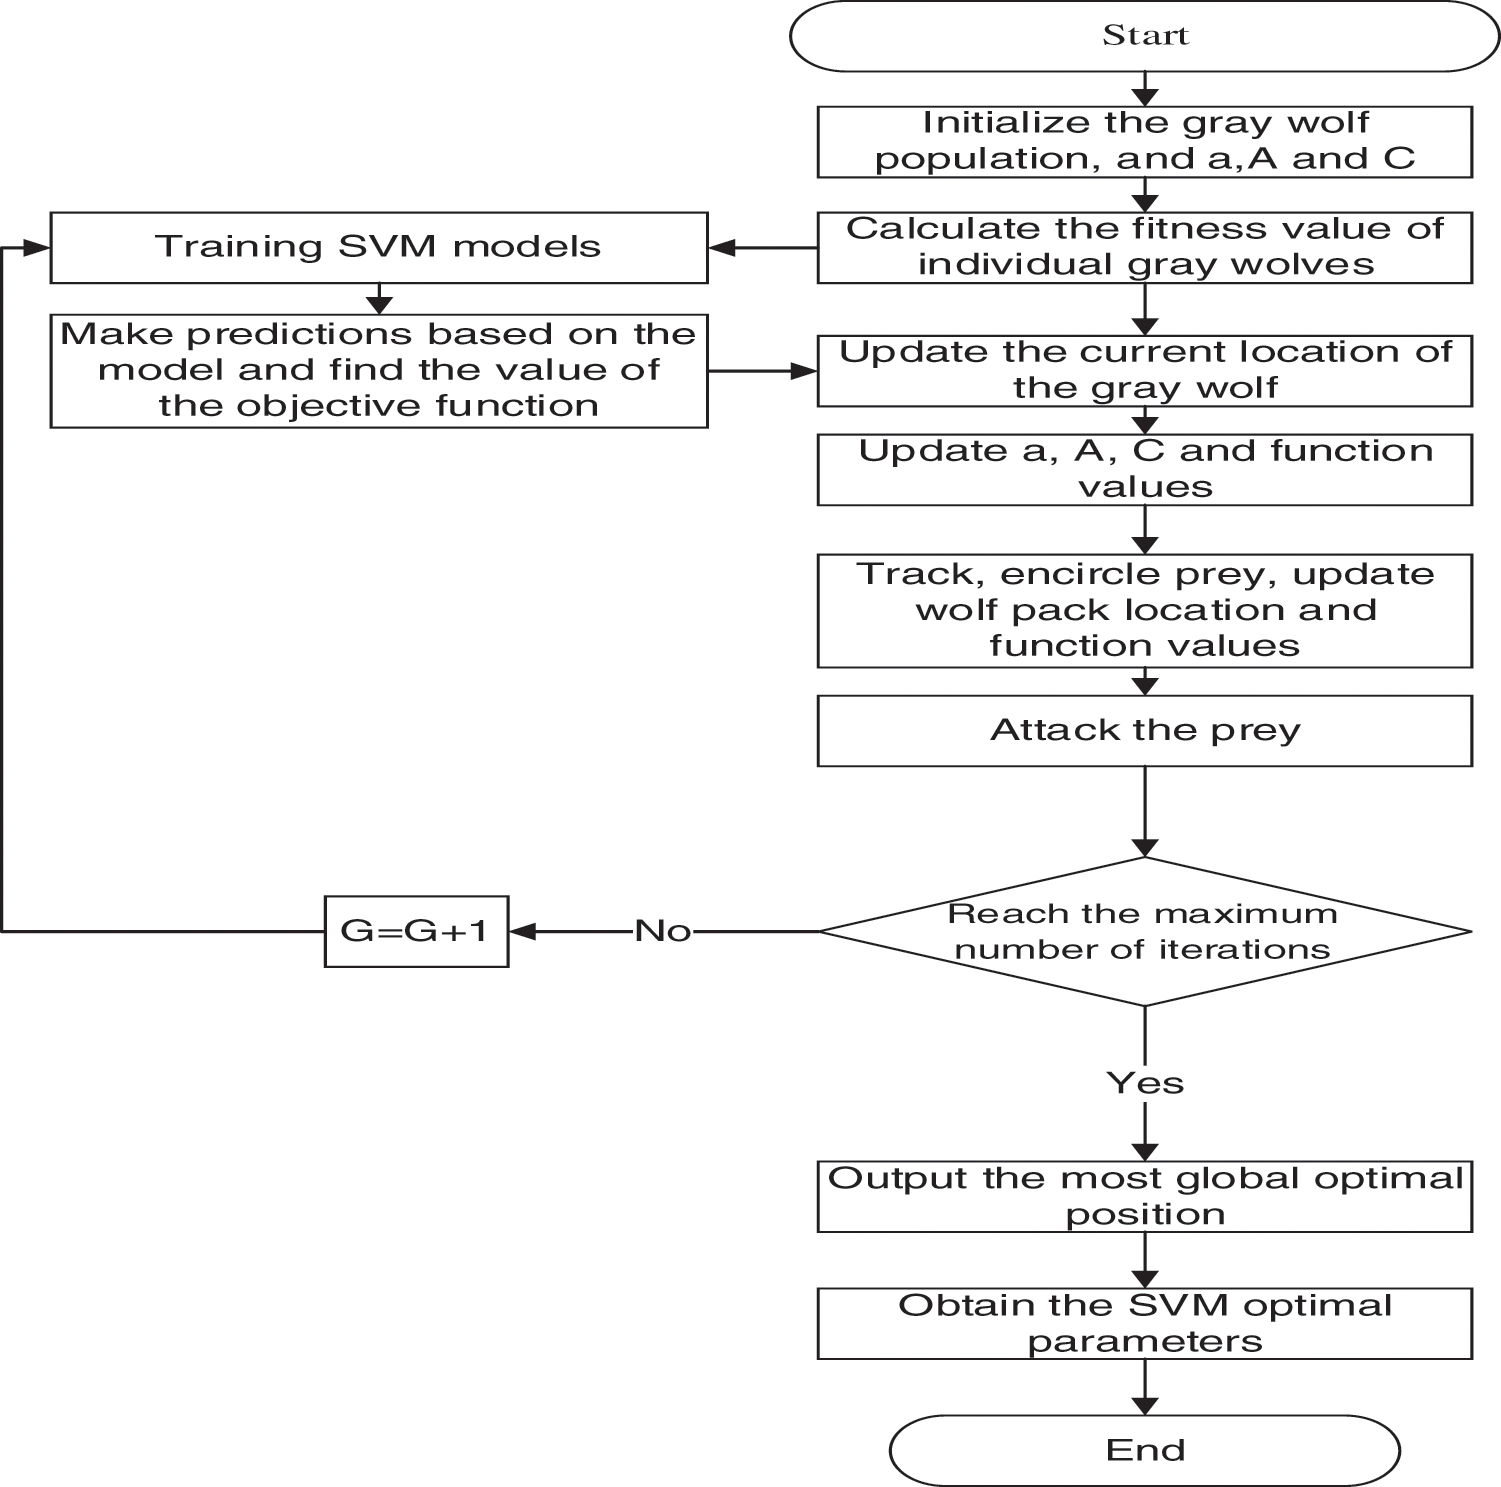
Figure 1: GWO-SVM model
Step 1: The initialization of the parameters of the GWO algorithm includes setting parameters such as the number of populations N, and the maximum number of iterations
Step 2: Training the SVM model and calculating the value of its function, i.e., the position of the
Step 3: Calculating the prey position based on the wolf position and function values, and initiating a hunting search on the prey.
Step 4: In the event that the maximum number of iterations is not reached, then repeat Step 2–4, once again until the maximum number of iterations is reached and the iteration is complete. For the time being, the global optimal position corresponds to the optimal value of the parameter Cand parameter
Step 5: The optimal parameters are incorporated in the SVM modeling process.
2.4 Integrating the GWO-SVM Model
The goal of integration learning is to combine multiple weak classifiers into a single robust classifier to improve the overall generalization of the classifier. In which weak classifiers are classifiers with slightly higher classification accuracy than random guesses.
Bootstrap aggregating (Bagging), originally proposed by Leo Breiman in 1996. For improved accuracy and stability, which reduces errors and avoids overfitting, this algorithm is usually combined with regression and classification algorithms. Essentially, it is a bootstrap sample, which is a randomized selection from N data points, with each sample playback and repetition repeated for a total of N times. As shown in the figure below, the base learner adopts the GWO-SVM model described in the previous section, which creates an integrated GWO-SVM model (Fig. 2).
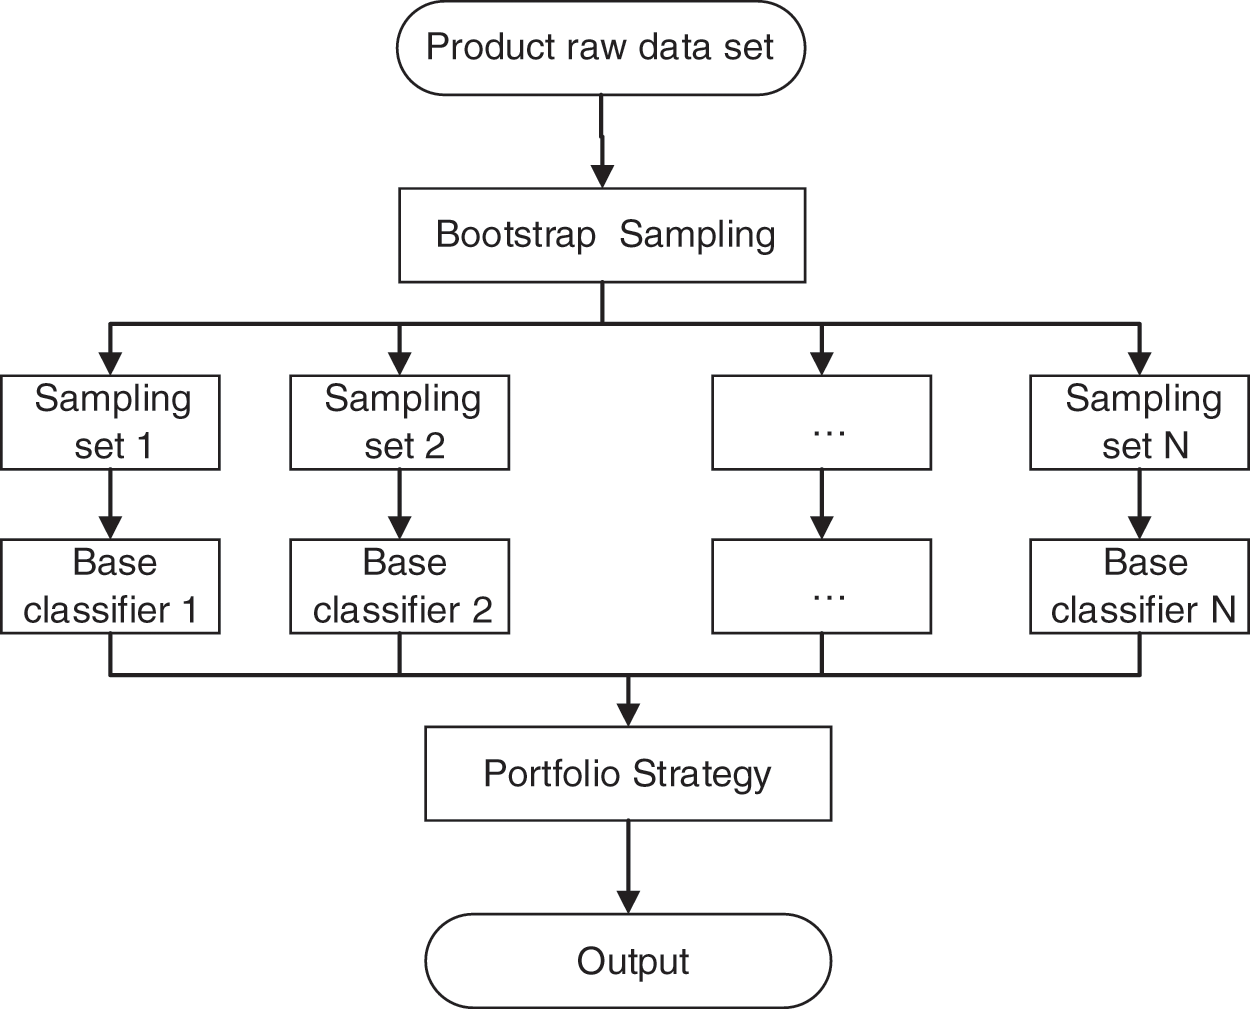
Figure 2: Bagging model
3 Commodity Housing Market Risk Metrics
3.1 Risk Warning Index System Construction
There is no unified standard for establishing indicators in the research on real estate early warning, and the same is true for establishing indicators for detecting risks in the commercial housing market. Presently, scholars are expected to adhere to six general principles when selecting risk indicators, including comprehensiveness, sensitivity, operability, independence, and effectiveness.
The analysis of the literature reveals that relative indicators are more indicative of the development of real estate market risk than absolute indicators. As a result, this paper uses relative indicators to quantify the risk associated with the commercial housing market. As a result of the above analysis and literature search, a total of 12 indicators are used to present the indicator system of this paper [4,7], [19,20,28] (Tab. 1).
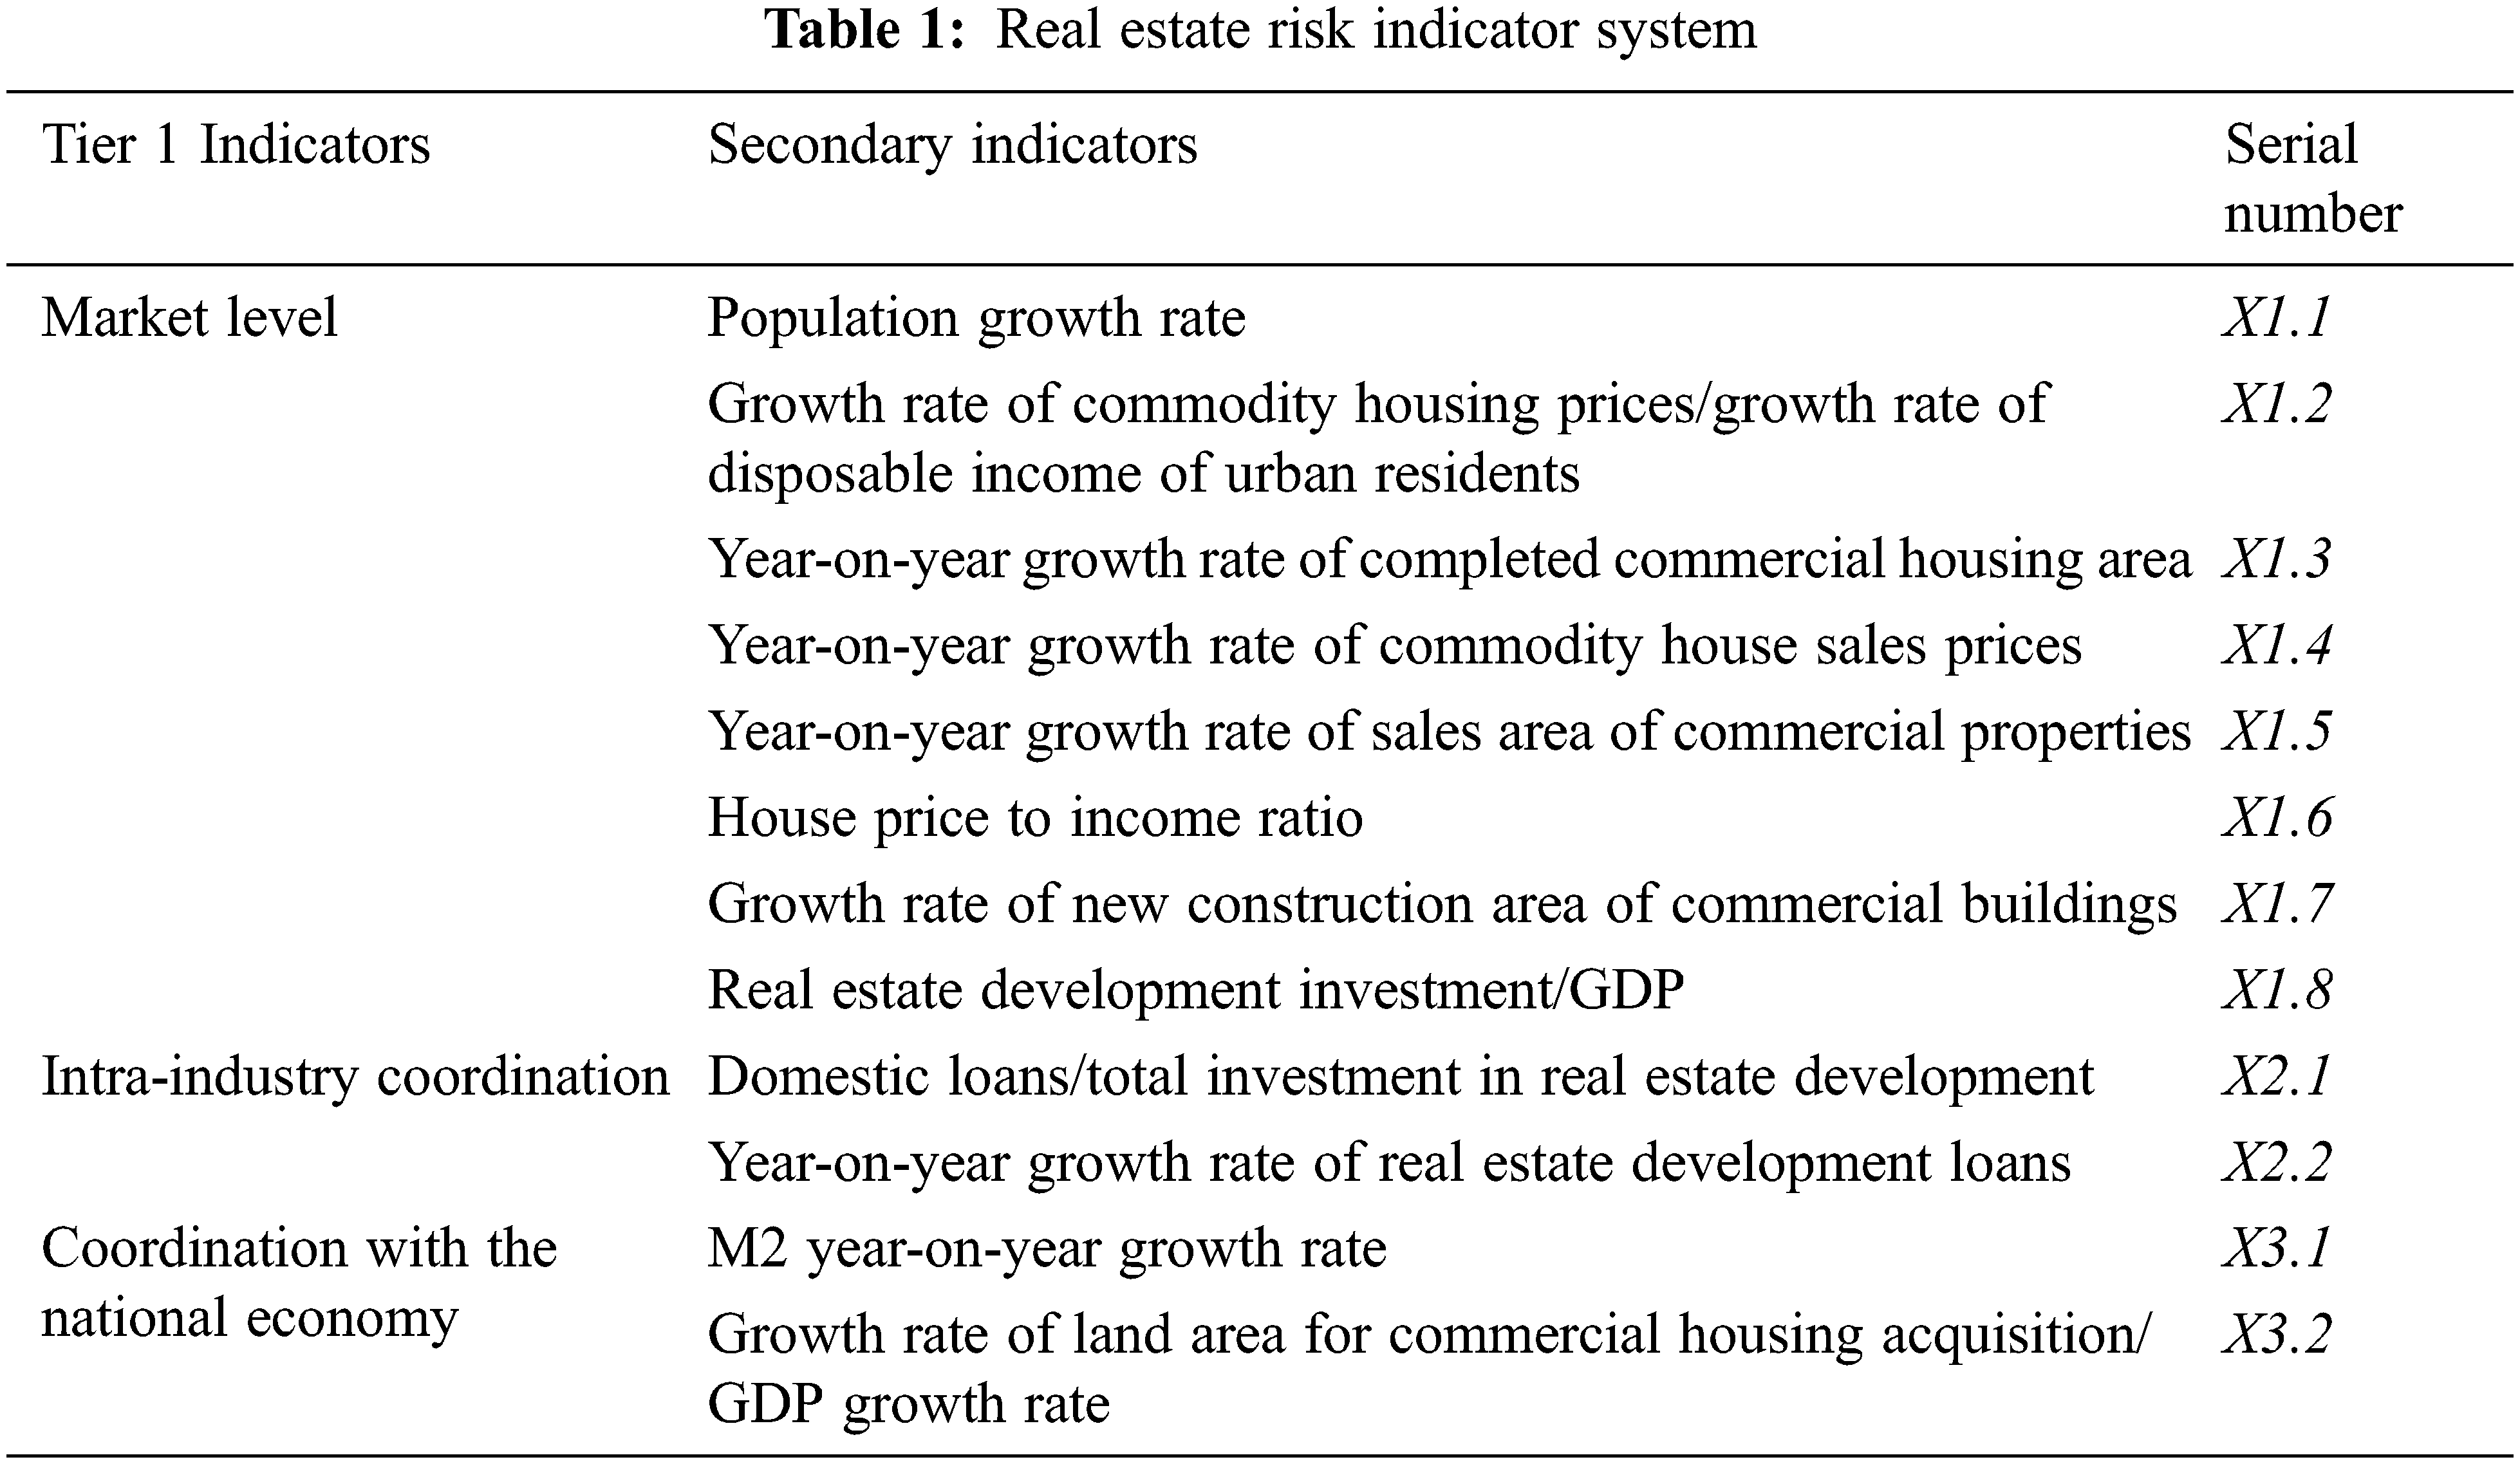
Based on data from the National Bureau of Statistics, Tianjin Bureau of Statistics and the CHOICE database, the above indicators span the period from January 2010 to December 2020.
3.2 Risk Warning Indicator Screening
A list of 11 indicators is initially selected and screened for certain characteristics. A number of methods exist for selecting features, including gray correlation, lasso, and principal component analysis. It is impressive that Random Forest (RF) has a high level of accuracy in feature selection and a high level of consistency of feature subsets [29]. Therefore, this paper selects RF method to screen the commodity housing risk warning index system.
The RF method determines the importance of each feature to be selected and selects the features based on the ranking results. Assume that the original number of samples is N and the feature dimension is m. Input a training sample set
As a segmentation function, the Gini Index is used to compute the “Gini Importance” as a measure of the importance of each feature, which is expressed as.
where:
where,
3.3 Risk Warning Index Establishment
The risk early warning index is established following a final screening of the indicators initially formed. In view of the late state of China’s real estate industry as well as the short timeliness and poor stability of relevant data, any risk warning research based on historical data may be subject to significant errors. An effective risk warning index can minimize the problems discussed above while still retaining its flexibility. By contrast with subjective weighting methods such as entropy and standard deviation, CRITIC’s objective method of weighting allows for one to consider both the intensity of comparison and the conflict between indicators, as well as providing strong objective properties. For this reason, the risk warning index was established using the CRITIC objective assignment procedure. Its calculation formula is as follows:
where,
4 Tianjin Commodity Housing Market Risk Measurement and Early Warning
4.1 Tianjin Commodity Housing Market Risk Metric
As a pioneer of reform and opening up, a coastal open city, and the economic center of the Bohai Sea Rim region, Tianjin excels in these fields. As a representative of the Northern Region, the Tianjin housing market is considered to be indicative of the entire market, and the metrics and early warning research presented in this paper on the commodity housing market risk in Tianjin can aid real estate markets in Northern Regions in preparing to deal with it in advance. As a result of this study, twelve primary indicators are selected and ranked in importance and then filtered by RF (Fig. 3). Based on the results of the screening process of the commodity housing market in Tianjin, the following results have been obtained in Tab. 2: population growth rate (X1.1), growth rate of commodity housing prices/growth rate of disposable income of urban residents (X1.2), year-on-year growth rate of completed commercial housing area (X1.3), year-on-year growth rate of sales area of commercial properties (X1.5), house price to income ratio (X1.6), growth rate of new construction area of commercial buildings (X1.7), domestic loans/total investment in real estate development (X2.1), and growth rate of land area for commercial housing acquisition/GDP growth rate (X3.2). Following the determination of the final indicators, the CRITIC method was applied to combine the above eight indicators into the commodity housing market risk index (Fig. 4).
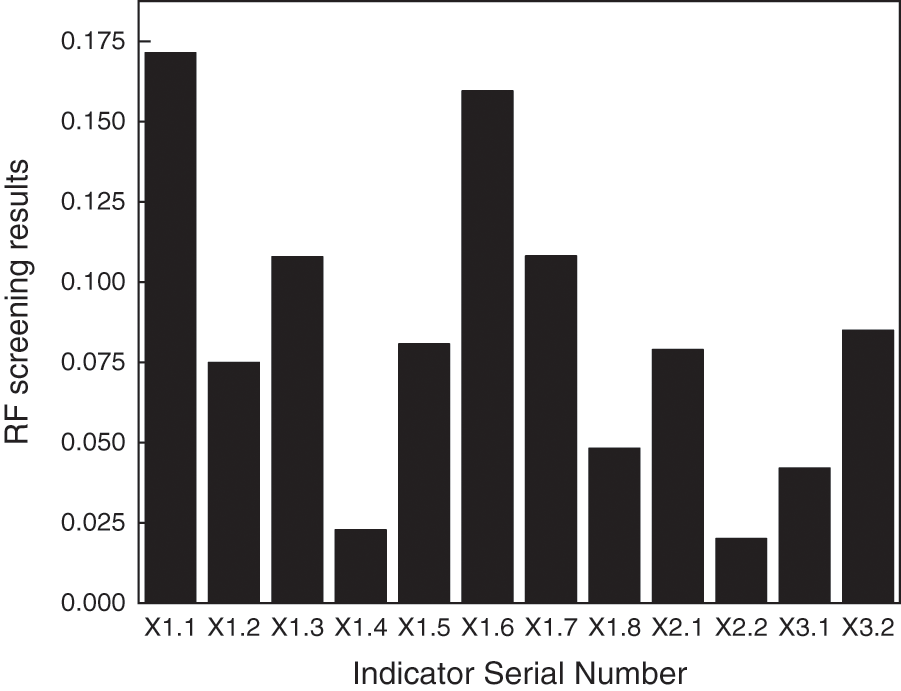
Figure 3: Random forest screening results
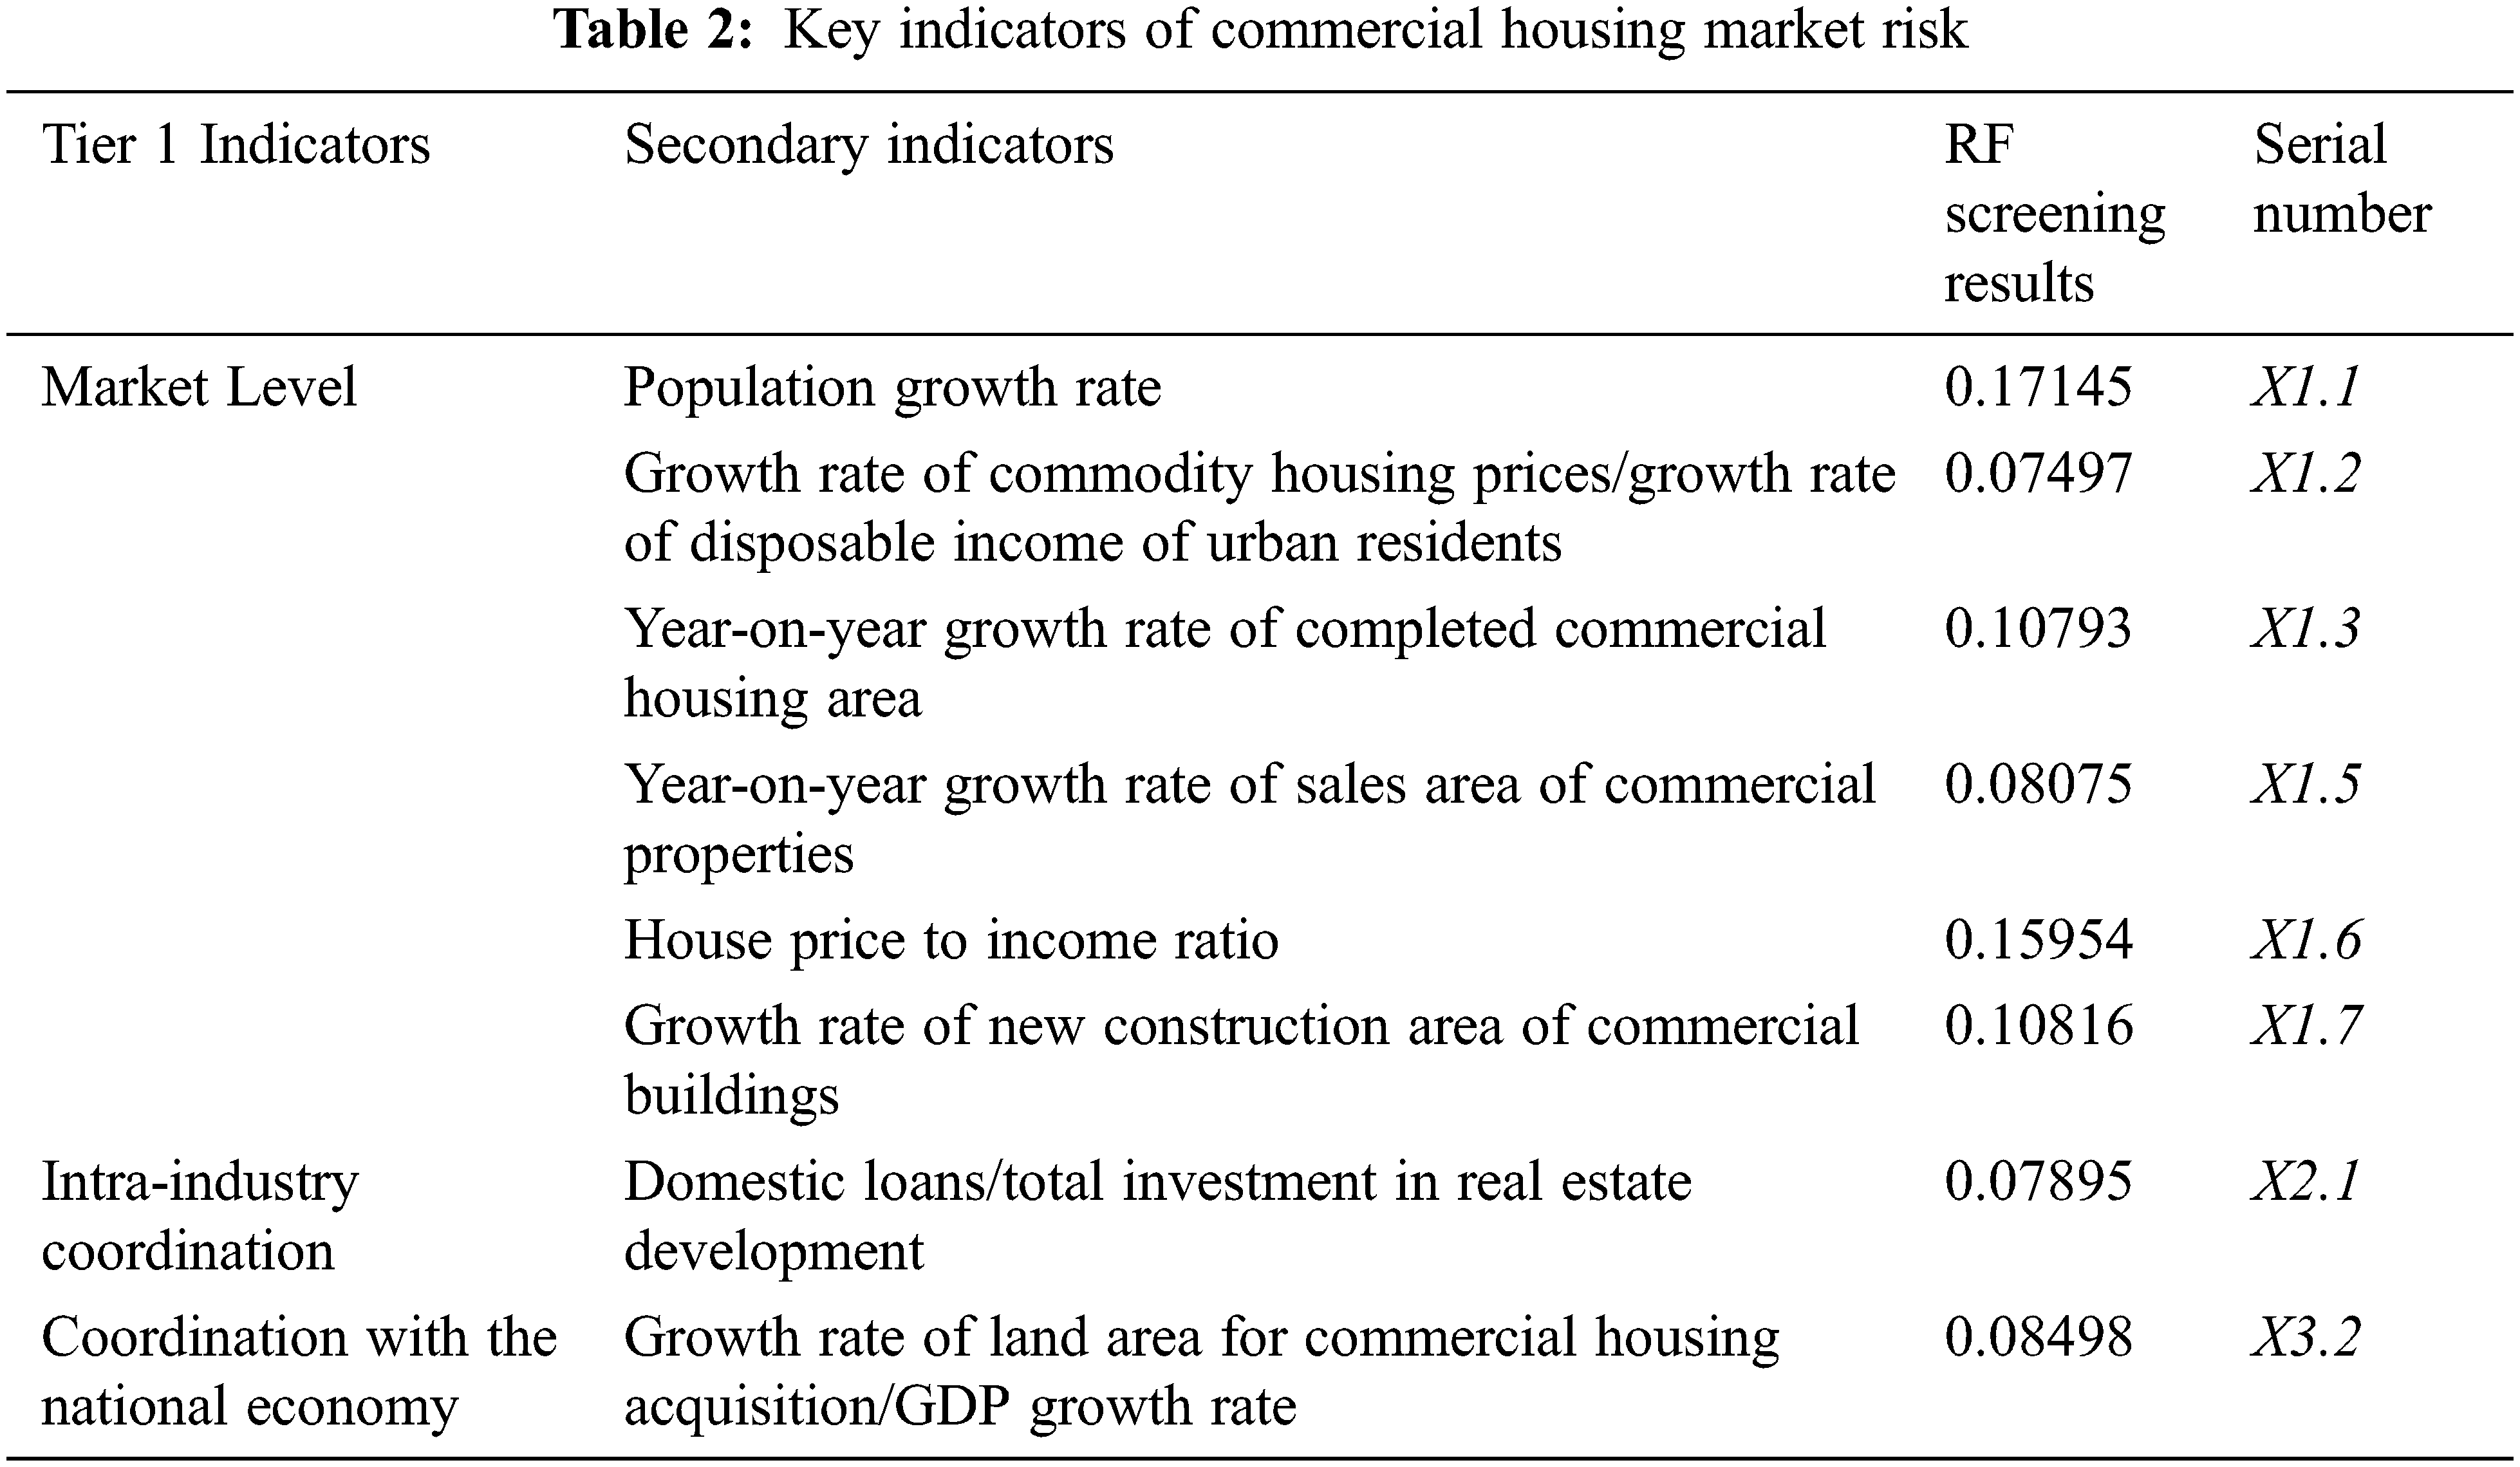
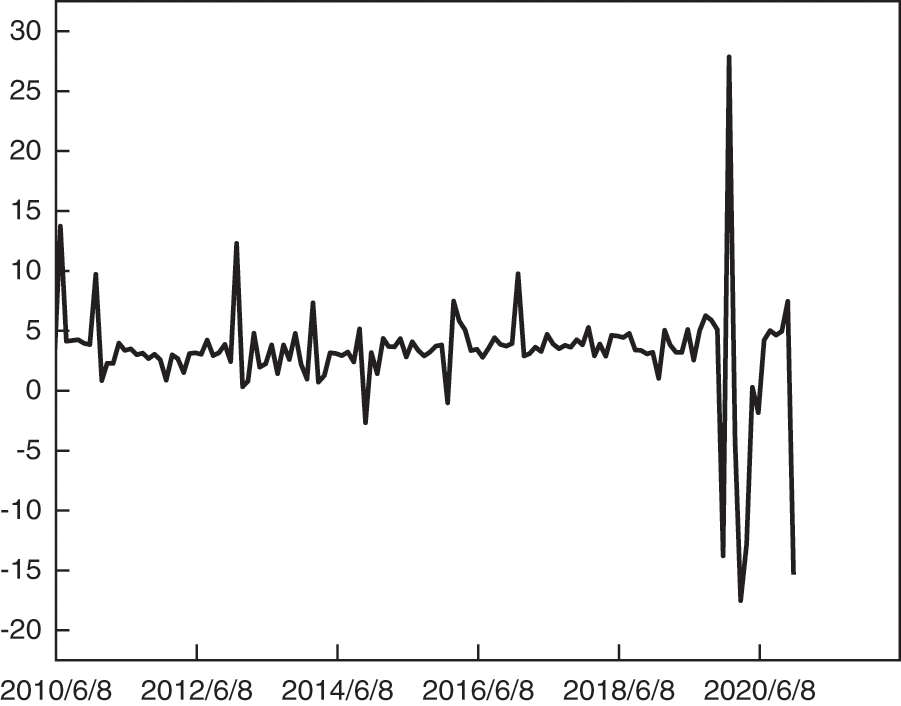
Figure 4: Commodity housing market risk index
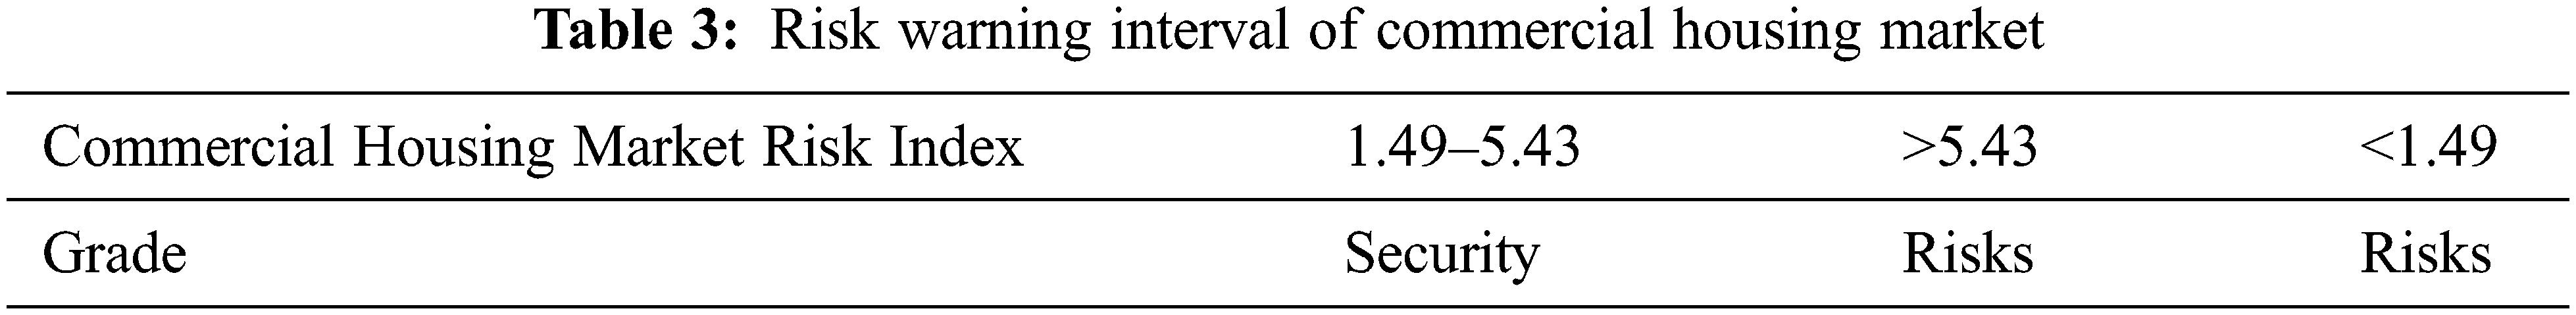
The question of how much of the risk index should be regarded as a safe area becomes relevant after synthesizing the risk index. Currently, three methods are available for resolving the problem: In the first method, alarms will be raised when the risk index exceeds the sum of the mean and one to one and a half times the standard deviation; In the second method, alarms are sounded if risk index surpasses 90% of the norm; In the third method, a reference index is found which already exists and when the risk index is higher than the reference index, a crisis is considered to be present [30]. Considering that the second method lacks systematic science and that the third method does not yield a reference index, we chose the first method in this study and use the sum (difference) of the mean and one standard deviation as the threshold value by which a significant risk is supposed to exist. As the presence of extreme values of the data can affect the final results, all indices that exceed the sum (difference) of the mean and two times standard deviation are removed, and the next steps are conducted. As shown in Tab. 3, the risk warning interval is divided into three sections.
It is essential to determine the reliability of a commodity housing market risk index prior to applying it in an accurate manner. Based on cardarelli [31], a measure of the robustness and reliability of a financial investment index is if it provides an indication of the period of stress that would exist in the event of an actual event. On the basis of this approach, the paper attempts to compare the risk profile in the commodity housing market risk index with actual real estate market risk events.
As a whole, the commodity housing market in Tianjin is subject to cyclical fluctuations, and is divided into four stages of development, as shown below.
Phase I (January 2010-December 2012): Tianjin showed a trend of rising and then declining commodity housing risk. Early in 2010, real estate prices in Tianjin continued to rise, creating greater risk. To mitigate the risk of excessive price increases, the State Council issued the “ten national articles” for the first time on April 17. Tianjin issued the “Ten Articles of Tianjin” on July 4, which establishes policies intended to solve the city’s real estate issues. Following that, Tianjin instituted a series of policies aimed at controlling the rising housing prices. Such as the “Notice on Issues Related to the Purchase of Newly Built Commercial Housing in the Six Districts of the City by Families of Residents of the City and Foreign Provinces” issued by the Municipal Land Resources and Housing Administration on October 13. By early 2011, there was a reduction in the rate of house price increases, and the risk was reduced through the continued implementation of financial and land policies.
Phase 2 (January 2013-January 2016): Risks in Tianjin commercial housing increased and then declined. The housing market began to rebound and rise in 2013 and the risk of commercial housing increased after the real estate market exchanged price for volume. Consequently, the municipal government of Tianjin issued “Article 5 of Tianjin” to suppress the real estate market as a means of stabilizing the real estate market. In response to the imbalance in supply and demand of commodity housing, the city of Tianjin abolished the purchase restriction policy in 2014 and encouraged residents to purchase properties according to the policy regarding land, money, taxation, etc. De-stocking came to a head in 2015, and the regulations of finance, taxation, and home ownership continued to be relaxed, which inevitably led to a heating up of the market and a reduction of the risk of commodity housing.
Phase 3 (February 2016-August 2019): Risks associated with commercial housing in Tianjin increased and then declined. In 2016, the housing market continued to experience high prices and risks, and Tianjin introduced the “three articles of Tianjin” to strengthen the management of housing and the market, as well as the “930” new policy on September 30 to implement regionalized purchase restrictions and differential credit policies. In 2017, in accordance with General Secretary Xi’s “no speculation in housing” policy and by further implementing market regulation and control measures, Tianjin implemented measures to further restrict housing purchases, price control and add other market management measures, resulting in a gradual stabilization of the commodity housing market. In the following two years, Tianjin strictly implemented its real estate regulation and control policy. The Ministry of Housing and Construction maintained the positioning that “the house is for living, not speculation”, implemented the long-term property management mechanism, and promoted the steady and balanced development of the commodity housing market.
Phase 4 (September 2019-December 2020): As of the end of 2019, the outbreak of the COVID-19 has caused a considerable impact on China’s commercial housing market, reducing the willingness and capability of residents to purchase commercial real estate, and providing a period of over-cold fluctuations for real estate firms and the market.
Comparing the above comparison with the actual real estate risk events reveals that the fluctuations of the risk index synthesized in this paper roughly coincide with those of the risk index. The results show that the risk index of the commodity housing market synthesized in this paper can represent the actual risk situation in Tianjin, for which the reliability has been established.
4.2 Tianjin Commodity Housing Market Risk Warning
This paper presents a Bagging-GWO-SVM early warning model, where the risk index is the label value of the model; therefore, all the data of the model has been prepared. In all, 132 data samples are categorized into two categories: “safety” and “risk”. 70 percent of the data samples are selected at random to serve as training sets, while the rest are used as test sets. The maximum number of iterations of the model is set to 30, degree = 4, and the parameters C and gamma are optimized by the gray wolf algorithm. and class_weight = ‘balanced’ due to the imbalance of the classification situation. Training is conducted with the training set, and testing of the classification effect of the model is conducted with the test set, resulting in the optimal parameter settings:
The ROC curve is used to evaluate the classifier, and the critical value is determined based on its generalization performance. AUC represents the area under the ROC curve. The closer the AUC is to 1, the better a model’s performance in terms of generalization. Fig. 5 presents the ROC curve plotted in this paper. In the figure, the ROC curve is near the upper left corner, and the AUC is 0.98, showing the excellent performance of the bagging-GWO-SVM model in this paper.
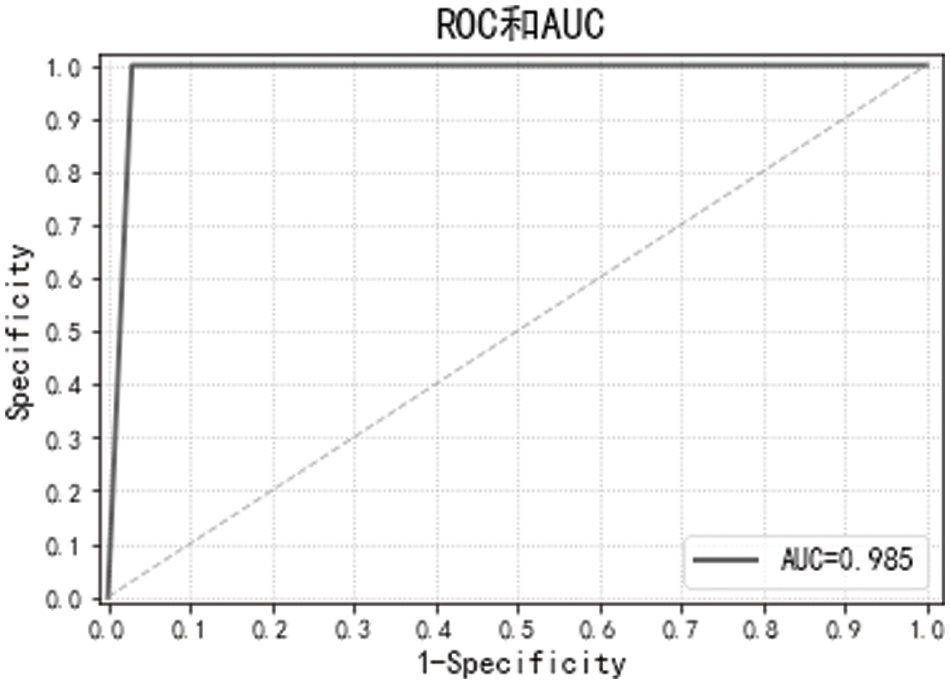
Figure 5: ROC curve
The main objective of this paper is to evaluate the early warning effect of the bagging-GWO-SVM model. For comparison, SVM, K-Nearest Neighbor (KNN), Plain Bayesian (NB), Logistic Regression (LR), and Bagging-SVM were chosen, which were trained 30 times, respectively, as shown in Tab. 5.
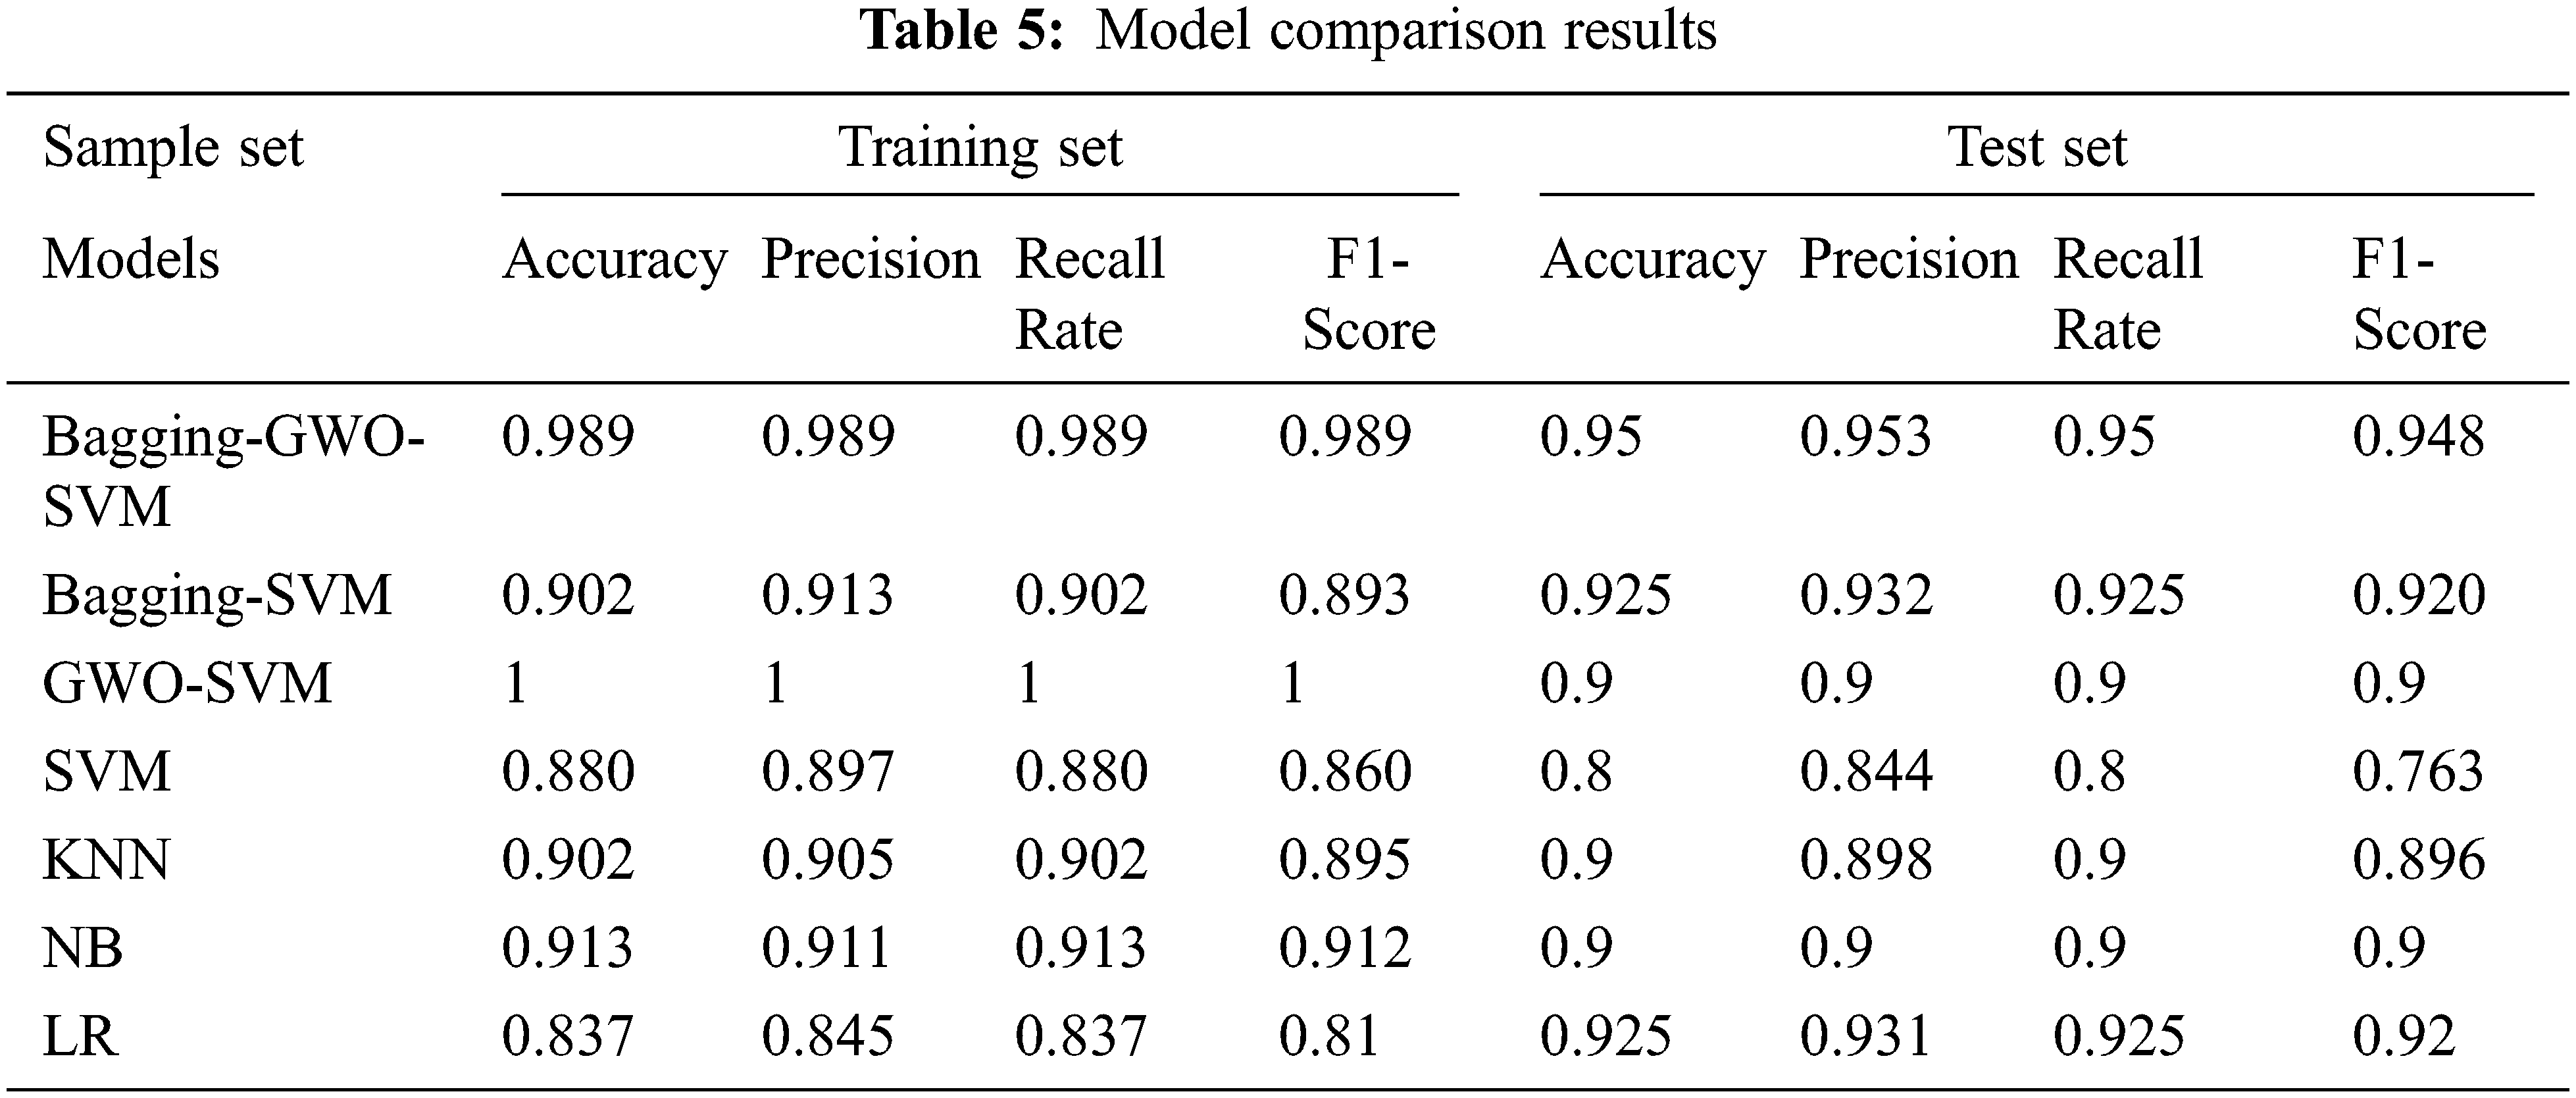
Based on the data in the table, it is possible to draw the following conclusions.
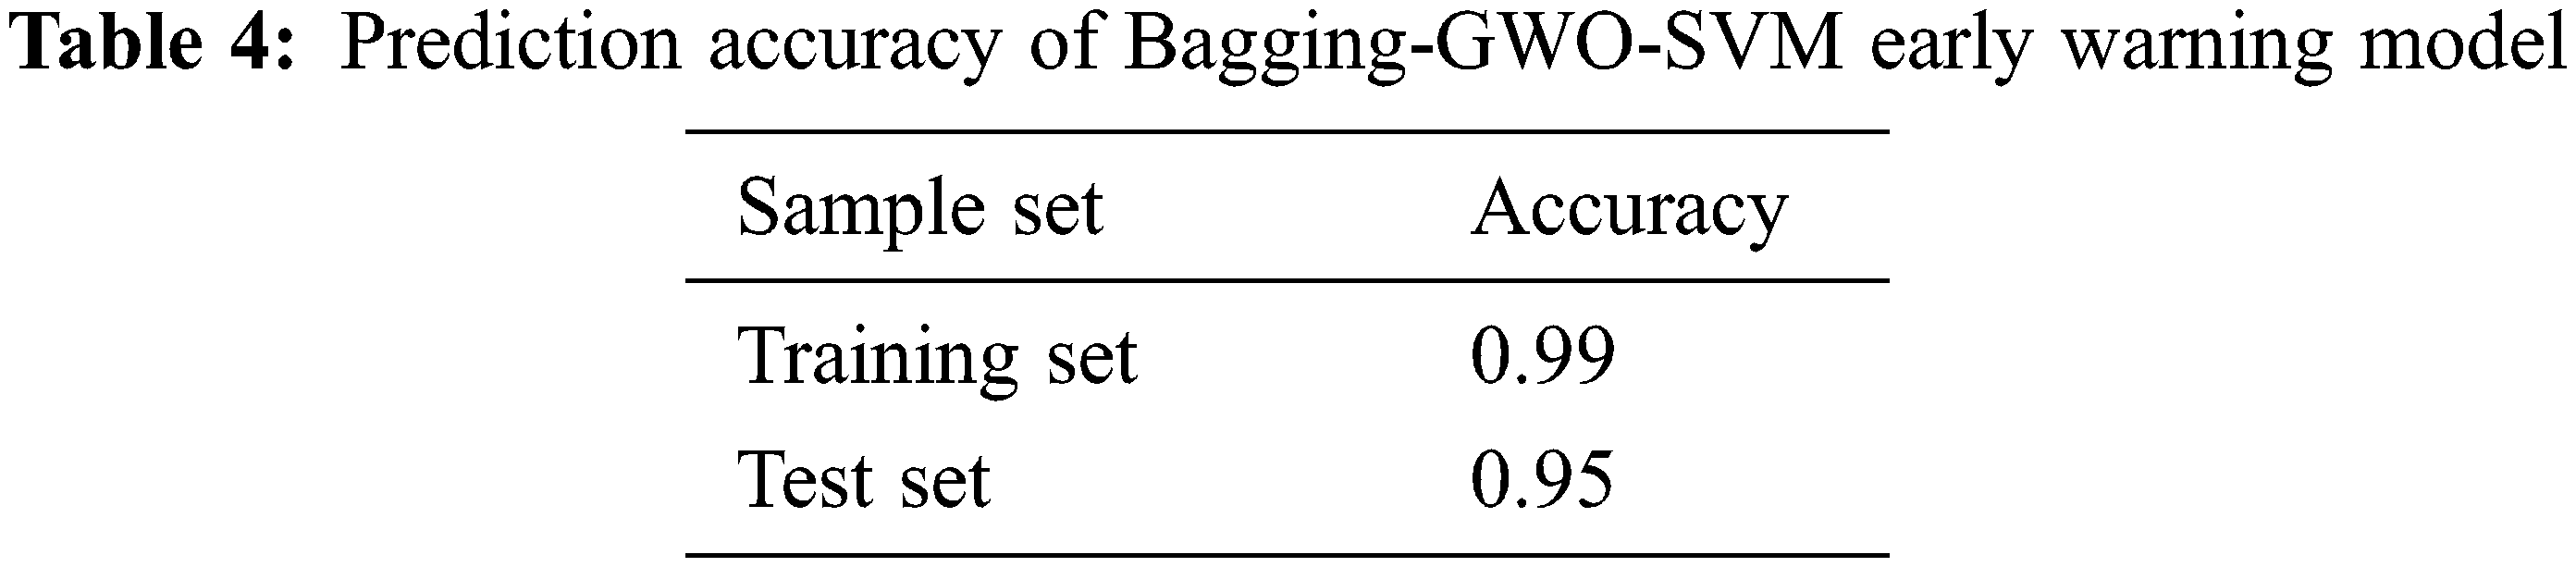
(1)In the prediction of the training set, the accuracy, precision, recall, as well as F1-score of Bagging-GWO-SVM and GWO-SVM are greater than 98%. Meanwhile, the various metrics of Bagging-SVM, NB, and KNN are around 90%, while the various metrics of SVM and LR are below 90%.
(2)For the test set, accuracy, precision, recall, and F1-score for Bagging-GWO-SVM, Bagging-SVM, GWO-SVM, LR, and NB are all greater than 90%, with Bagging-GWO-SVM scoring the highest at 95%; the remaining models do not meet 90% in all metrics.
(3)On the basis of the above analysis, it can be observed that Bagging-GWO-SVM performs extremely well in all comparisons of training and testing sets.
5 Conclusions and Recommendations
Commodity housing market risk has important implications for the real estate industry, governments, and consumers. An index system for determining the risk associated with the commodity housing market is constructed, and a Bagging-GWO-SVM model is developed to highlight early warning signals. The results are as follows.
(1) Eight key factors influencing the risk of commodity housing markets are examined. There are three levels and 12 indicators which constitute its main determinants. By screening 12 indicators using the RF method, eight key influencing factors can be identified. The following factors are considered: population growth rate, growth rate of commodity housing prices/growth rate of disposable income of urban residents, year-over-year growth rate of completed commercial housing area, year-over-year growth rate of sales area of commercial properties, house price to income ratio, growth rate of new construction area of commercial buildings, domestic loans/total investment in real estate development and growth rate of land area for commercial housing acquisition/growth rate of GDP. According to the findings of the empirical study, the selected key factors reflect the current state of the Tianjin real estate market.
(2) A commodity housing market risk index corresponding to the current market condition in Tianjin is formulated. Utilizing the CRITIC method, a commodity housing market risk index is derived based upon eight key influencing factors. Comparing the risk index to actual commodity housing market events in Tianjin, it can be concluded that the index is consistent with the actual market condition in Tianjin, thereby demonstrating its reliability.
(3) A Bagging-GWO-SVM model is developed to offer an early warning of Tianjin’s commodity housing market risk. Comparing the Bagging-GWO-SVM model with SVM, KNN, NB, LR, and Bagging-SVM, it is determined that the Bagging-GWO-SVM model provides higher early warning accuracy and is applicable to the early warning of commodity housing market risk in Tianjin.
This study demonstrates that the risk index provided is comparable to the actual market situation and the Bagging-GWO-SVM early warning model is highly accurate. Consequently, the model may be used as an early warning tool for subsequent commodity housing market risk management. The following recommendations are made regarding the management of commodity housing market risks.
(1) Integrating short-term regulation goals with medium-term and long-term regulatory objectives. A variety of areas, such as finance, taxation, and insurance, are closely linked to real estate. It is necessary to integrate government decision making, construction market and commercial housing transactions in Tianjin’s commercial housing market, which is regulated in macro regulation. Moreover, a great need exists to develop regulation methods that take into account the long cycle and the different phases of market development in order to ensure the health of the market.
(2) The rational planning of urban lands. According to the government, “Houses are for living, not for speculation.” Because the central city of Tianjin is relatively small and has limited land resources, speculation in housing should be explicitly prohibited and land speculation should be strictly prohibited. A project’s general and detailed design must take into account the overarching principle of Tianjin’s planning as well as its specific requirements.
(3) Enhance regional price monitoring. The direction, scope, and duration of price variations in Tianjin’s various regions are interdependent. Tianjin will be able to better gauge price trends by strengthening its monitoring of each region’s price changes and will be able to formulate measures as required.
Funding Statement: This research was funded by the National Natural Science Foundation of China, Grant Number 81973791.
Conflicts of Interest: The authors declare that they have no conflicts of interest to report regarding the present study.
References
1. F. Liu, C. Liu, H. Ren, F. Liu, C. Liu et al., “Urban housing price fluctuations and regional systemic financial risks: Panel spatial economic models in Jiangsu, China,” Sustainability, vol. 10, no. 10, pp. 3452, 2018. [Google Scholar]
2. L. Wang, S. Li, J. Wang, Y. Meng, L. Wang et al., “Real estate bubbles in a bank-real estate loan network model integrating economic cycle and macro-prudential stress testing,” Physica A-Statistical Mechanics and Its Applications, vol. 542, no. 6, pp. 122576, 2020. [Google Scholar]
3. C. Borrero-Dominguez, E. Cordon-Lagares, R. Hernandez-Garrido, C. Borrero-Dominguez, E. Cordon-Lagaresandr. et al., “Sustainability and real estate crowdfunding: Success factors,” Sustainability, vol. 52, no. 12, pp. 462–502, 2020. [Google Scholar]
4. J. Yang, “Design of early warning multimedia computer system for real estate market under PROBIT model,” Multimedia Tools and Applications, vol. 78, no. 5, pp. 3452, 2019. [Google Scholar]
5. X. Wang, S. Gao, S. Zhou, Y. Guo, Y. Duan et al., “Prediction of house price index based on bagging integrated WOA-SVR model,” Mathematical Problems in Engineering, vol. 2021, no. 2058, pp. 3744320, 2021. [Google Scholar]
6. J. Clayton, “Three essays on expectations and housing price volatility,” Ph. D. dissertation, University of British Columbia, Canada, 1993. [Google Scholar]
7. J. Zhang, “Research on risk measurement in Beijing real estate market-An empirical analysis based on markov zone system transfer model,” The World of Survey and Research, vol. 2021, no. 3, pp. 39–48, 2021. [Google Scholar]
8. J. Wu, J. Gyourko and Y. Deng, “Evaluating the risk of Chinese housing markets: What we know and what we need to know,” China Economic Review, vol. 39, pp. 91–114, 2016. [Google Scholar]
9. A. Ustundag, E. Cevikcan, M. Kilinc, A. Ustundag, E. Cevikcan et al., “A hybrid fuzzy risk evaluation model for real estate investments,” Journal of Multiple-Valued Logic and Soft Computing, vol. 17, no. 4, pp. 339–362, 2011. [Google Scholar]
10. E. Zavadskas, Z. Turskis, J. Tamosaitiene,E. K. Zavadskas, Z. Turskis et al., “Risk assessment of construction projects,” Journal of Civil Engineering and Management, vol. 16, no. 1, pp. 33–46, 2010. [Google Scholar]
11. I. Tsai and S. Chiang, “Risk transfer among housing markets in major cities,” Sustainability, vol. 10, no. 7, pp. 2386, 2018. [Google Scholar]
12. C. Amedee-Manesme, F. Barthelemy, C. Amedee-Manesme and F. Barthelemy, “Ex-ante real estate value at risk calculation method,” Annals of Operations Research, vol. 262, no. 2, pp. 257–285, 2018. [Google Scholar]
13. C. Wang, M. Tsai, Y. Huang and T. Hsu, “An evaluation model for deferred project development in real estate investment,” Applied Mathematics & Information Sciences, vol. 7, no. 5, pp. 2001–2010, 2013. [Google Scholar]
14. C. Zhang, M. Li, Y. Li, C. Zhang, M. Li et al., “Financial risk analysis of real estate bubble based on machine learning and factor analysis model,” Journal of Intelligent & Fuzzy Systems, vol. 40, no. 4, pp. 6493–6504, 2021. [Google Scholar]
15. J. D. Sachs, A. Tornell, A. Velasco and C. Cooper, “Financial crises in emerging markets: The lessons from 1995,” Brookings Papers on Economic Activity, vol. 1996, no. 1, pp. 147–215, 1996. [Google Scholar]
16. A. D. Abiad, “Early warning systems: A survey and a regime-switching approach,” Imf Working Papers, vol. 3, no. 32, pp. 993–1052, 2003. [Google Scholar]
17. A. Berg, E. Borensztein and C. Pattillo, “Assessing early warning systems: How have they worked in practice?, ” Imf Staff Papers, vol. 52, no. 3, pp. 462–502, 2005. [Google Scholar]
18. D. Ma, C. Zhang and M. Ma, “Theory of currency crisis early warning model and its application to China,” Shanghai Finance, vol. 2007, no. 12, pp. 10–13, 2007. [Google Scholar]
19. W. Zhou, M. Chen, Z. Yang and X. Song, “Real estate risk measurement and early warning based on PSO-SVM,” Socio-economic Planning Sciences, vol. 77, no. 5, pp. 101001, 2021. [Google Scholar]
20. X. Wang, G. Zeng, K. Zhang, H. Chu and Z. Chen, “Urban real estate market early warning based on support vector machine: A case study of Beijing,” International Journal of Computational Intelligence Systems, vol. 13, no. 1, pp. 153–166, 2020. [Google Scholar]
21. X. Wang, J. Wen, Y. Zhang and Y. Wang, “Real estate price forecasting based on SVM optimized by PSO,” Optik, vol. 125, no. 3, pp. 1439–1443, 2014. [Google Scholar]
22. D. Park, D. Ryu, D. Park and D. Ryu, “A machine learning-based early warning system for the housing and stock markets,” IEEE Access, vol. 9, no. 1, pp. 85566–85572, 2021. [Google Scholar]
23. W. You, K. Shen, N. Yang, Q. Li, Y. Wu et al., “Electricity theft detection based on bagging heterogeneous ensemble learning,” Automation of Electric Power Systems, vol. 45, no. 2, pp. 105–113, 2021. [Google Scholar]
24. Z. Cao, C. Wan, Z. Zhang, F. Li, Y. Song et al., “Hybrid ensemble deep learning for deterministic and probabilistic low-voltage load forecasting,” IEEE Transactions on Power Systems, vol. 35, no. 3, pp. 1881–1897, 2020. [Google Scholar]
25. C. Zhan, Y. Zheng, H. Zhang, Q. Wen, C. Zhan et al., “Random-forest-bagging broad learning system with applications for COVID-19 pandemic,” IEEE Internet of Things Journal, vol. 8, no. 21, pp. 15906–15918, 2021. [Google Scholar]
26. S. Choi, J. Hur, S. Choi and J. Hur, “An ensemble learner-based bagging model using past output data for photovoltaic forecasting,” Energies, vol. 13, no. 6, pp. 1438, 2020. [Google Scholar]
27. A. Sm, B. Smm and A. Al, “Grey wolf optimizer,” Advances in Engineering Software, vol. 69, no. 3, pp. 46–61, 2014. [Google Scholar]
28. Y. Shi and P. Wang, “Real estate early warning index system and comprehensive early warning method research,” Statistical Research, vol. 28, no. 11, pp. 16–21, 2011. [Google Scholar]
29. X. Feng and G. Qu, “Feature selection for high dimensional data based on deep learning and random forest,” Computer Engineering and Design, vol. 40, no. 9, pp. 2494–2501, 2019. [Google Scholar]
30. J. Lai and J. Lu, 2010, “Measurement of financial systemic risk based on financial stress index,” Statistics & Decision, vol. 2010, no. 19, pp. 128–131, pp. 2010. [Google Scholar]
31. R. Cardarelli, S. Elekdag and S. Lall, “Financial stress and economic contractions,” Journal of Financial Stability, vol. 7, no. 2, pp. 78–97, 2011. [Google Scholar]
Cite This Article
 Copyright © 2023 The Author(s). Published by Tech Science Press.
This work is licensed under a Creative Commons Attribution 4.0 International License , which permits unrestricted use, distribution, and reproduction in any medium, provided the original work is properly cited.
 Downloads
 Citation Tools