
 Submit a Paper
 Propose a Special lssue
 Open Access
ARTICLE

EfficientNetV2 Model for Plant Disease Classification and Pest Recognition
1 Department of EEE, Kumaraguru College of Technology, Coimbatore, 641049, India
2 Department of Electronics and Communication Engineering, Anna University Regional Campus, Coimbatore, 641046, India
3 Department of EEE, PSG College of Technology, Coimbatore, 641004, India
* Corresponding Author: R. S. Sandhya Devi. Email:
Computer Systems Science and Engineering 2023, 45(2), 2249-2263. https://doi.org/10.32604/csse.2023.032231
Received 11 May 2022; Accepted 24 June 2022; Issue published 03 November 2022
 View Full Text
 Download PDF
Abstract
Plant disease classification and prevention of spreading of the disease at earlier stages based on visual leaves symptoms and Pest recognition through deep learning-based image classification is in the forefront of research. To perform the investigation on Plant and pest classification, Transfer Learning (TL) approach is used on EfficientNet-V2. TL requires limited labelled data and shorter training time. However, the limitation of TL is the pre-trained model network’s topology is static and the knowledge acquired is detrimentally overwriting the old parameters. EfficientNet-V2 is a Convolutional Neural Network (CNN) model with significant high speed learning rates across variable sized datasets. The model employs a form of progressive learning mechanism which expands the network topology gradually over the course of training process improving the model’s learning capacity. This provides a better interpretability of the model’s understanding on the test domains. With these insights, our work investigates the effectiveness of EfficienetV2 model trained on a class imbalanced dataset for plant disease classification and pest recognition by means of combining TL and progressive learning approach. This Progressive Learning for TL (PL-TL) is used in our work consisting of 38 classes of PlantVillage dataset of crops and fruit species, 5 classes of cassava leaf diseases and another dataset with around 102 classes of crop pest images downloaded from popular dataset platforms, though it is not a benchmark dataset. To test the predictability rate of the model in classifying leaf diseases with similar visual symptoms, Mix-up data augmentation technique is used at the ratio of 1:4 on corn and tomato classes which has high probability of misinterpretation of disease classes. Also, the paper compares the TL approach performed on the above mentioned three types of data set using well established CNN based Inceptionv3, and Vision Transformer a non-CNN model. It clearly depicts that EfficientNetV2 has an outstanding performance of 99.5%, 97.5%, 80.1% on Cassava, PlantVillage and IP102 datasets respectively at a faster rate irrespective of the data size and class distribution as compared to Inception-V3 and ViT models.The performance metrics in terms of accuracy, precision, f1-score is also studied.Keywords
Computer vision system and advancements in deep learning-based modeling methodologies has gained significant attention in its domain variants namely classification, object detection, object tracing in videos etc. The human scale emulation methodologies deployed in the field of remote sensing, medical imagery applications, self-autonomous cars and agriculture is known for its promising and accurate results. Plant disease detection, disease classification, pest recognition at initial stages for sensitive commodities like tomato and potato is highly mandated as the harvest losses have a direct impact on the price fixation of the vegetables. In case of profitable crops like Tomato, Leaf Curl Virus has a dreadful impact [1] and leads to yield losses. With the advent of best image processing solutions and the continuous research in Precision Agriculture, Artificial Intelligence through the concepts of continuous learning paradigms or models based on Convolution Neural Network (CNN) architecture and Vision Transformer has provided improved insights to proceed further.
The concept of Transfer Learning (TL) involves developing a model on relatively larger dataset and apply the knowledge gained during the training process which is relevant to the model that is trained. These speeds up the process of learning and the divergence of the data between Train and Test Set is highly reduced using TL [2]. Also, this learning method uses pre-trained neural network models that can work on less data and images and the training time is also reduced substantially [3]. InceptionV3 is one of the renowned pre-trained CNN based TL model [4,5]. This work focuses on plant disease and pest classification using the Progressive Learning based EfficientNetV2 [6], a recent model (2021) by means of TL and hence the model strategy is known as Progressive Learning-Transfer Learning (PL-TL). Our work claims that EfficientNet-V2 is a more suitable CNN model for TL since the core concept of EfficientNet-V2 includes Progressive Learning. Our proposed study uses variable sized and multi class dataset say cassava, Plant Village and IP102 Pest Control dataset. Sample images from the above dataset are shown in Fig. 1. The same dataset is used to study the performance of TL using Inception V3 and Vision Transformer (ViT) networks.
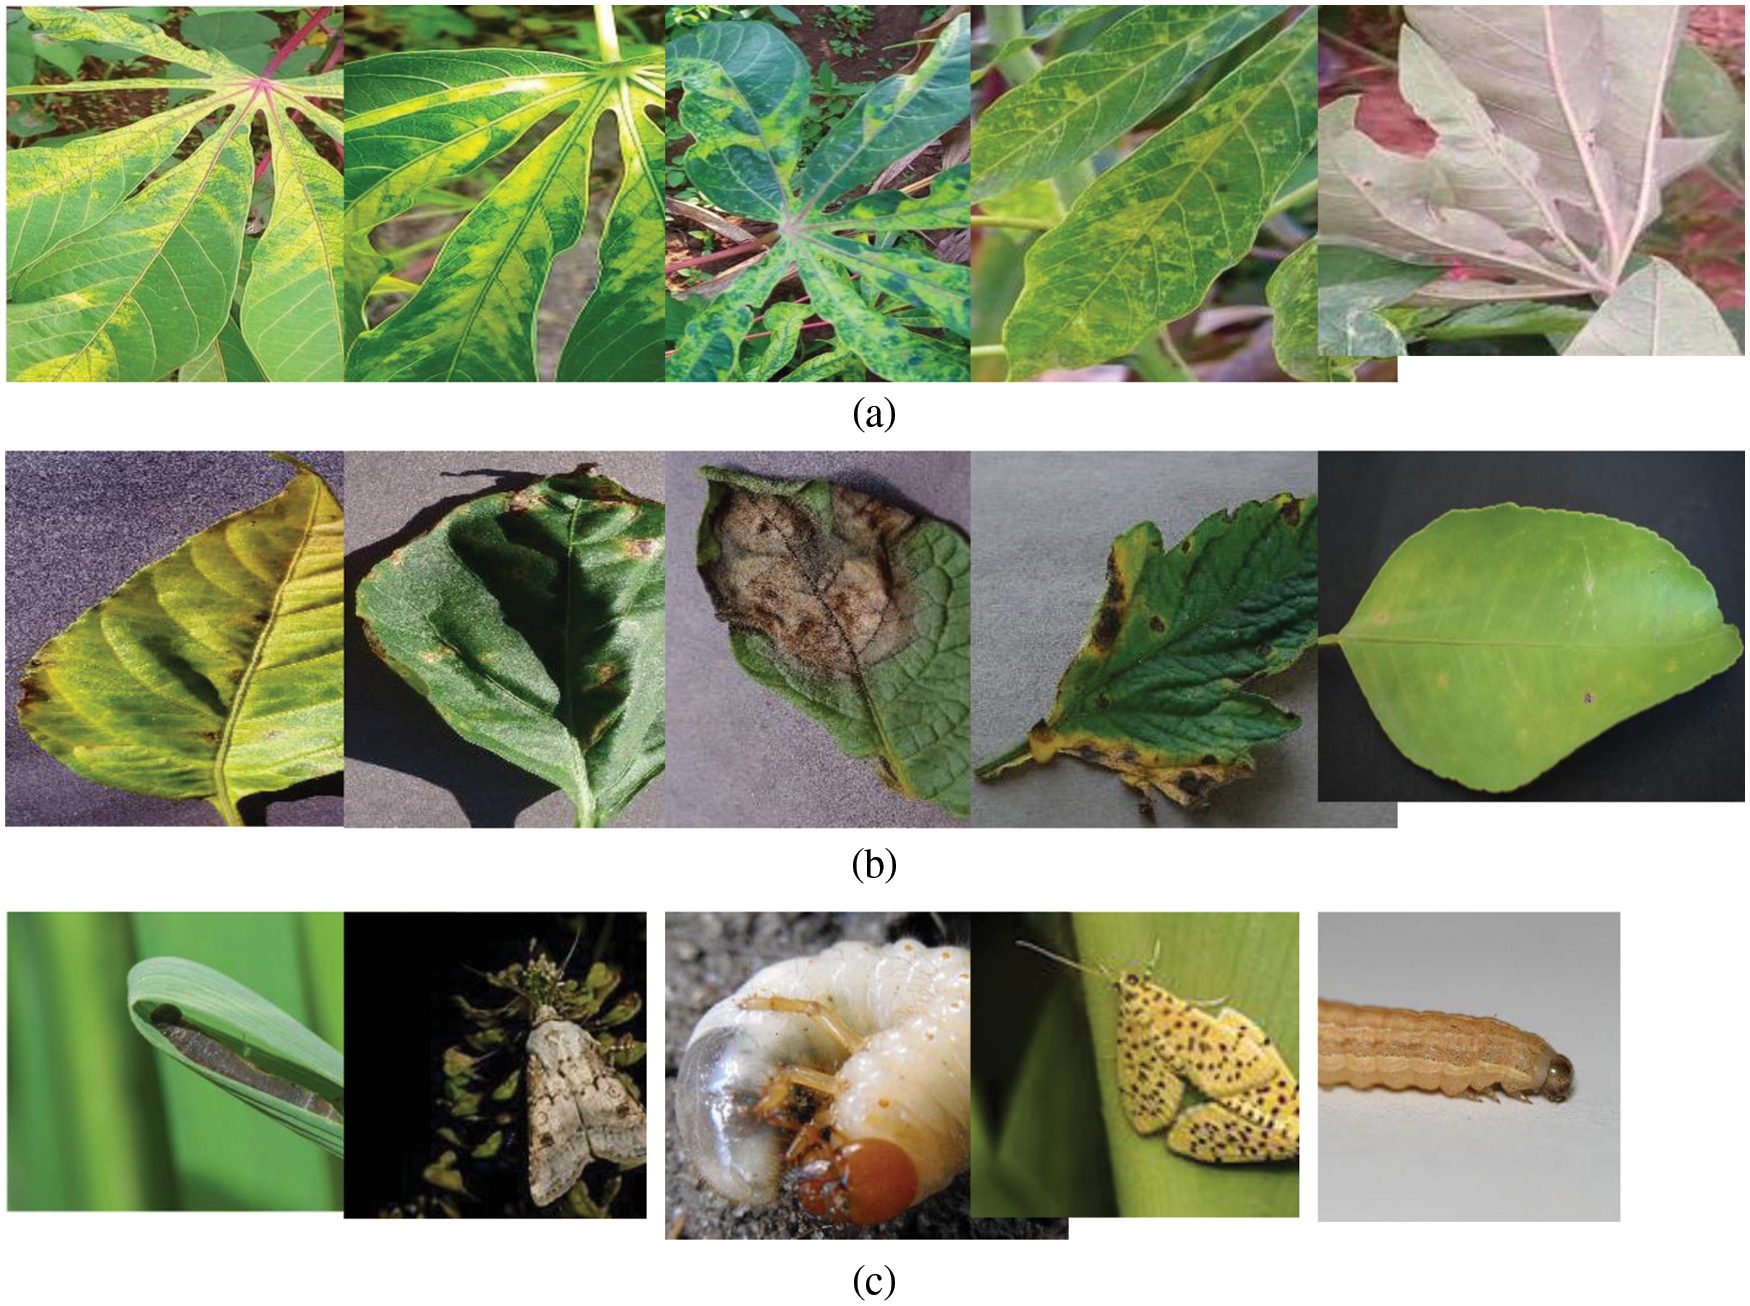
Figure 1: Sample images from (a) Cassava plant disease (b) PlantVillage (c) IP102 pest recognition datasets
The contents covered in this manuscript is as follows: Section 2 provides the recent work carried out in the area of our interest; Section 3 focuses on the core concepts of the materials, models and the methods used in our framework; Further, it elucidates on image dataset, diseased leaves visual symptoms and data augmentation technique such as Mixup Augmentation, Section 4 provides an insight on the evaluation metrics used and elaborates on the EfficientNetV2 classifier results followed by the conclusions in Section 6.
2.1 TL, Plant Disease Classification and CNN Models
The TL approach [7] used on plant disease classification requires additional insights and techniques since the disease visual symptoms is obvious as the lesions size and ratio based on texture manifests more as compared to any other object detection approach [8].The earlier approaches of plant disease detection and classification over a decade ago involves study on small scale images based on techniques like K-Means and Support Vector Machine (SVM), Principal Component Analysis [9] Bayesian Methods [10]. Above models remained as a black-box and model-debugging is highly challenging due to insufficient knowledge on the internal learning process. The research insights provided by the authors [11,12] on early detection of plant diseases have conducted the study on same Plant Village dataset using DL models say VGG, ResNet and DenseNet, Xception-DL and results claim that DenseNet outperforms other models. However, vanishing gradient problem due to DenseNet architecture was reported. Another 2021 work by the authors [13] have conducted an intensive investigation based on re-weighting concept on large scale benchmarking PDD271 dataset WITH 2,20592 images and 271 disease categories. This paper discusses on the dataset construction methods and performance evaluation using ResNet152 and SeNet154 with fine-tuning. The training time of their claimed models on a large-scale dataset is also discussed. With this as base idea and DL-CNN model like EfficientNet-V2 in its preliminary research stage and appealing to have better accuracy at faster rates is used in our study with TL performance metrics as the key focus of this paper. Optimal augmentation technique imposed on only specific crop species and clustering of 3 different datasets is discussed below. Reference [14] has given an insight on cassava leaf disease detection using a hybrid approach of traditional Principal Component Analysis (PCA) with CNN and proves better with smaller data samples and the real-time implementation works better only with proper spectral requirements and reference [15] briefs on tracking of grape clusters which involves detection and segmentation approach and the architectures used are You Only Look Once(YOLO) and Mask Regions with Convolution Neural Network (Mask R-CNN).
2.2 Review of EfficientNetV2, InceptionV3 and ViT as Transfer Learning Model
A CNN based TL model pre-trained on ImageNet dataset has attained 78% accuracy in 170 epochs. This preferred training model has decomposed kernels where feature extraction is performed at every abstract level and is encoded to end layer features. Batch Normalization (BN) is an fine-tuning approach for TL, which lessens the co-variate shift internally and output labels are the same in spite of the input variables spectrum. BN involves zero mean and unit variance and it is given as
where
This non-CNN model decomposes the image into patches, and each small patch is mapped to feature vector known as tokens. Patch embeddings with positional information, use of layer normalization on variable length inputs for every block, Multi-Head Self Attention mechanism and Multi-layer perception head are the highlights of ViT architecture. Observations also include ViTs performance degradation on smaller datasets and longer execution times. Individual heads is assigned on parts of the input sequence and attention is computed on individual sequences followed by concatenating all independent heads over the entirety with the respective Query (Q), Key (K) and Values(V). The MHSA mechanism is given in Eq. (2)
where head1 is given as
EfficientNetV2 is a progressive learning model that adjusts the regularization value based on image size. Regularization is a method to achieve balanced fit and hence a key to reduce the loss function. Parameter regularization achieves better similarity between source and target learninghe ConvNet layers are segmented into stages and all the layers in EfficientNetV1 is given as Eq. (3).
where
The authors [18] in the paper cardamom plant disease detection using EfficientnetV2 have measured the performance based on the image backgrounds. This work has provided favourable observations for a smaller dataset with fewer classes. For our work insights, we have examined the variants of EfficientNetv1 (B0-B7) and EfficientnetV2. MB Conv layers proposed in the former and Fused–MB Conv blocks in the later and its performance impact is studied. Observation of authors of EfficientNetV1 includes equal compound scaling strategy in terms of depth (d), width (w) and resolution (r) yield better performance and speeds up the training convergence. Observation of authors of EfficientNetV2 is optimal utilization of MB Conv layers and Fused-MB Conv blocks during the training course with variable compound scaling strategy along with adaptive regularization results in far more routine improvement at lesser FLOPs. Further, ascending the data size provides higher accuracy. The above two insights with respect to TL for images of variable size, non-uniform distribution of images over the classes and analysis of individual dataset and the clustered dataset package is assessed in following sections,
2.2.4 Training Efficiency on ImageNet Dataset
All the model architectures under study are pre-trained on ImageNet dataset and the TL results in terms of Top-1 accuracy for ImageNet dataset with 1000 classes and 1.3 million images for the models under study are given in Tab. 1

3.1 Progressive Learning for Transfer Learning (TL)
As discussed in Section 2, PL is conducted on unbalanced multi-class datasets individually say Cassava, PlantVillage, IP102 datasets. As discussed by the authors of EficientNet-V2, the study is initiated gradually where image size is directly proportional to regularization strength.

The standard plant disease classification datasets are used as such and the results are studied and further the standard datasets are combined into a single dataset with train and test distribution of 70% and 30% respectively and results are evaluated. The culmination of the distribution is shown in Tab. 2.

3.3 Mixup Data Augmentation–Tomato Disease Classes
The authors [19] in their study have discussed on using pre-trained AlexNet model and have claimed that the accuracy is obtained at reduced training time. They have also discussed due to similarity in visual disease symptom misclassification is highly probable in corn and tomato disease categories. This again is a powerful insight for our work and hence Mixup augmentation is performed only on tomato diseased classes with close similarities in symptoms appearance. Hence, Mixup Augmentation is performed on the disease classes Target Spot, Septoria disease and Spider mites and another group focusing on Bacterial Spot and Tomato Yellow Curl Virus in the ratio of 1: 4 and thereby increasing the number of PlantVillage dataset images close to 55,000. The Mixup Augmentation is performed for different α values between 0.4 to 0.7. Figs. 2a and 2b shows the sample images with Geometrical augmentation (Flip, rotate, zoom), Mixup augmentation and the basic formula for generating the new image set is given below Eqs. (4) and (5).
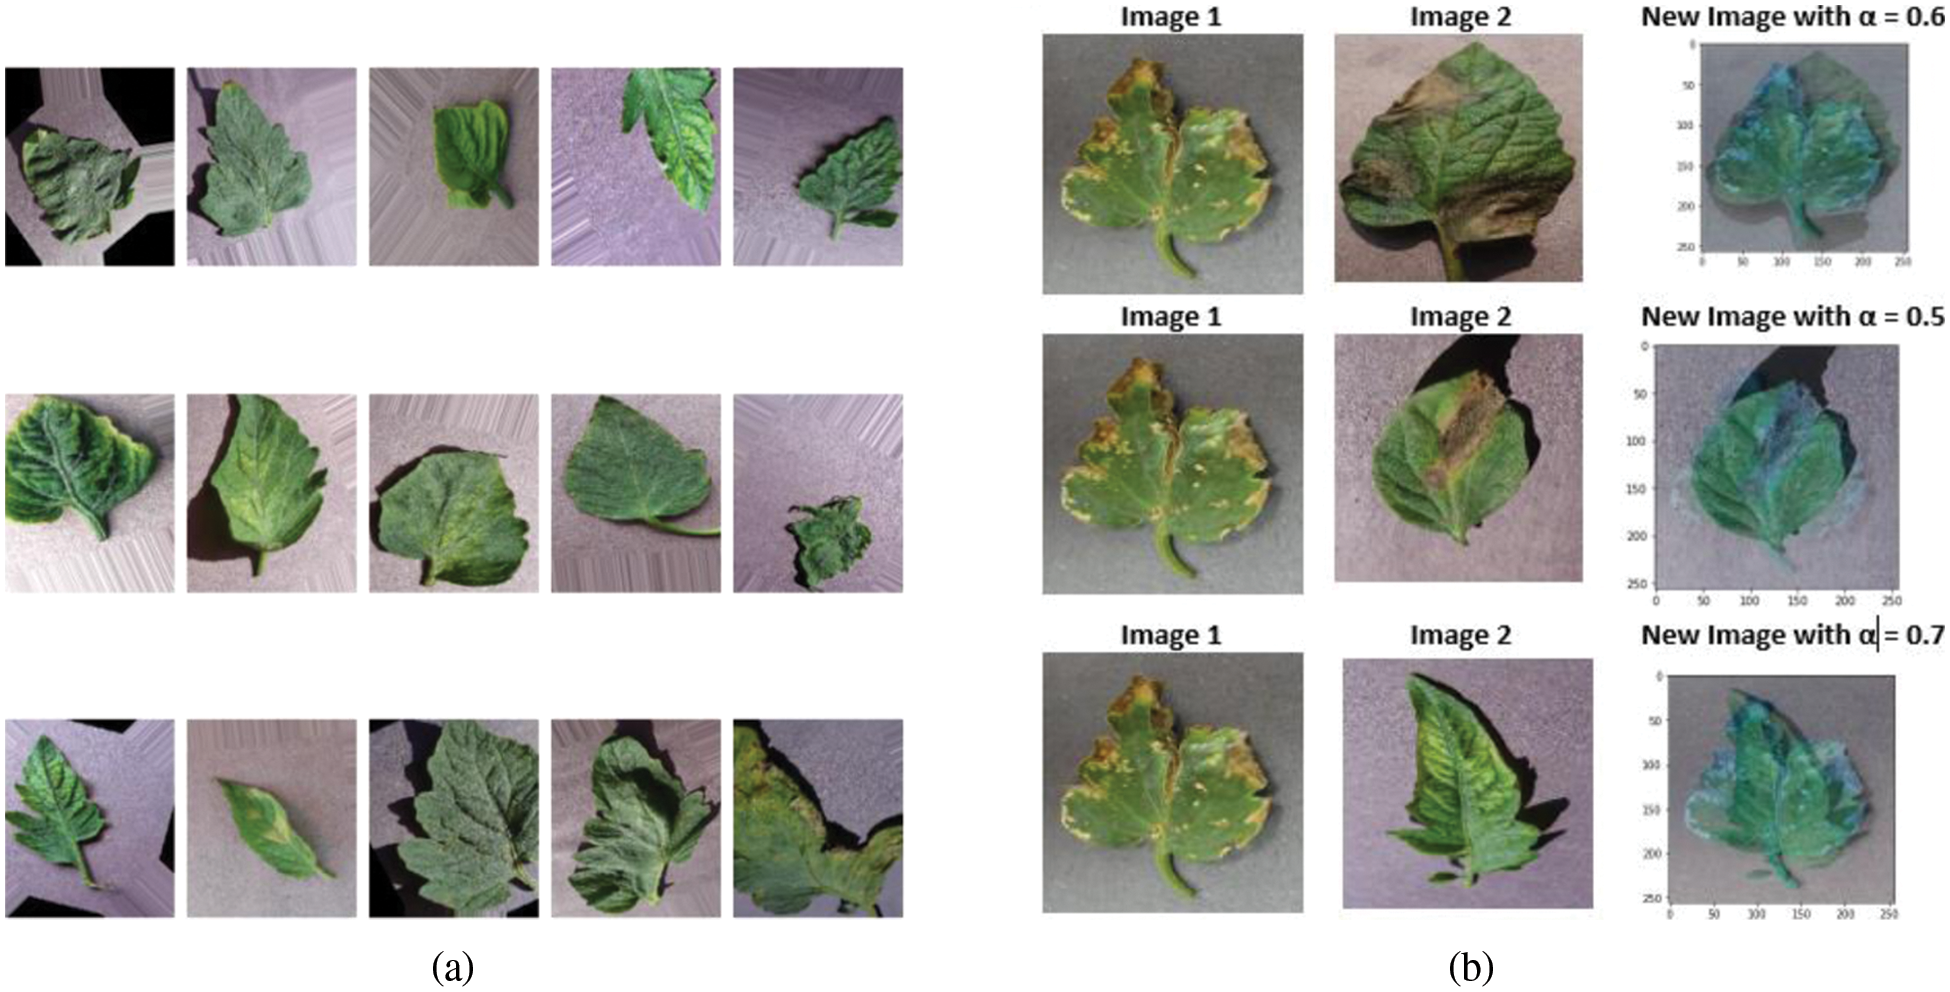
Figure 2: (a) Geometrical augmentation (b) Mixip augmentation
where
where
Classification of tomato diseases by leaf symptoms visualization is performed by using two CNN based Models say EfficientNetV2, InceptionV3, transformer-based model ViT is discussed. The prior work on plant disease classification using TL for CNN model and ViT is performed since both the models possess contradict mechanisms say convolution and batch normalization of InceptionV3 and tokening system of ViT. Both the network’s performance is studied, and the performance metrics are compared with EfficientNet-V2’s progressive learning and optimal regularization methodology. The results of all the three different models are analysed in Section 5.
4.1 InceptionV3 and ViT (Prior Work)
The entire study was performed on TESLA T4 GPU allocated in Google ColabPro. The pre-trained model is used as feature extractor by means of TL. Images are re-sized to (299, 299) and using Keras Image Data Generator geometrical augmentation is performed on Cassava leaf disease dataset, PlantVillage dataset and no augmentation is performed on IP102 dataset. The training duration is calculated for each dataset by summing up the time taken at each step. The methodology used is shown in Fig. 3.
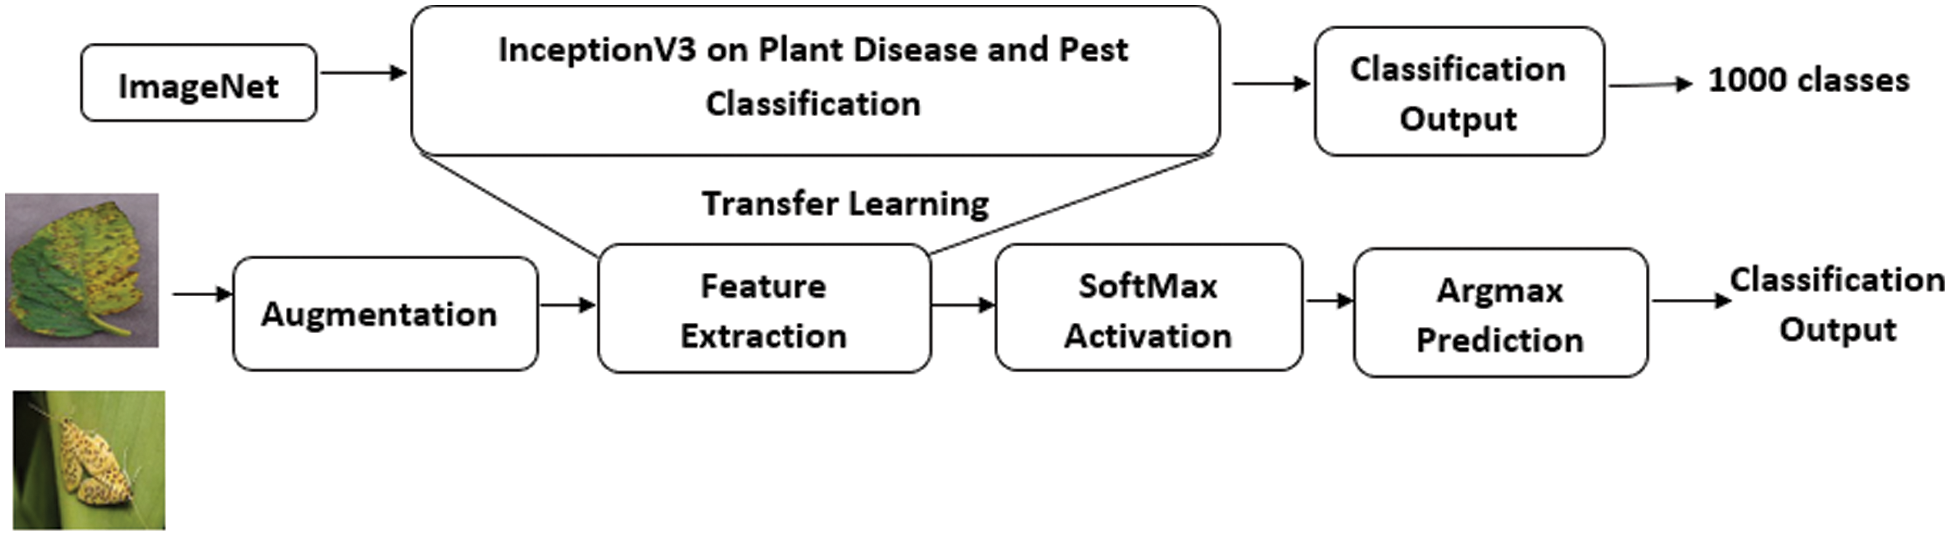
Figure 3: Plant disease classification & pest recognition methodology using inceptionV3
Categorical cross-entropy loss function, RMSprop optimizer and a dropout rate of 0.4 to 0.8 is the training setup for all the datasets under study. Individual performance on the dataset is studied. We have combined the above datasets into a single source and the accuracy metrics is studied. The results are discussed in Section 5.
4.1.2 ViT–Base (ViT-B) Experimental Setup
Cassava and Plant Village dataset was individually trained, and the training accuracy is measured. The methodology used is shown in Fig. 4. Geometrical augmentation was randomly used on PlantVillage dataset (Tomato disease category) in the ratio 1: 4 and the data set size is expanded by 20%. The initial image size considered is 256 and the patch size is 32. The number of patches per image is 64 and elements per patch are 3072. RMS prop optimizer is used with a momentum and decay of 0.9 and 0.9 respectively. The learning rate is set as 1e-5. This training was used to study the ViT-Bs performance inference on very small and smaller datasets.

Figure 4: Plant disease classification & pest recognition methodology-ViT
Though the model comes with self-attention mechanism, the average performance was comparatively poorer than the CNN models on the cassava dataset and training crashes and out of memory was also experienced frequently on combined dataset and IP102. The performance metrics is shown in Section 5.
With the examined conclusions from the prior work above EfficientNetV2 on TL on the same dataset proportions is examined.
EfficientNetV2 is a model belonging to EfficientNet (b0–b7) with compound scaling abilities in terms of width, depth and resolution. Reusing the state-of-art efficient model for classification tasks by updating the weights and adjusting the scaling ratios is proved to provide better accuracy with fewer parameters. The methodology used is shown in Figs. 5a and 5b.

Figure 5: (a) Plant disease classification & pest recognition methodology using EfficientNetV2, (b) Flowchart of overall transfer learning methodology of EfficientNet V2
5 Experimental Setup, Main Results and Discussion
The training on all models were initialized for 100 epochs but aborted earlier for InceptionV3 due to overfitting results and ViT as there was not enough improvement in the test accuracy. Similarly, for EfficientNet V2-the learning rate, training time, infer time was extremely high and the network took fewer epochs as compared to CNN and ViT models.
5.1 EfficientNetV2-s Results-Comparison
Progressive learning and adaptive regularization at initial stages quickly converges the training. With this insight, Stochastic Gradient Descent (SGD) optimization, a simple and an effective method for a faster training is used on smaller and medium datasets. With the learning rate fixed at 0.005, Momentum at 0.9. In initial cycles learning rate elevates to 0.256 and exponential moving average as a stability criterion is fixed at 0.9999. The dropout rate is varied between 0.3 to 0.5 and Mixup α values varied between 0.4 to 0.7 applied only on Plant Village dataset with Tomato Diseased Class. The above experimental set up is common to all the datasets. The evaluation results of EfficientNetV2 and the results of InceptionV3, ViT is shown in Tabs. 3 and 4. The accuracy graphs obtained for InceptionV3 and ViT is shown in Figs. 6 and 7

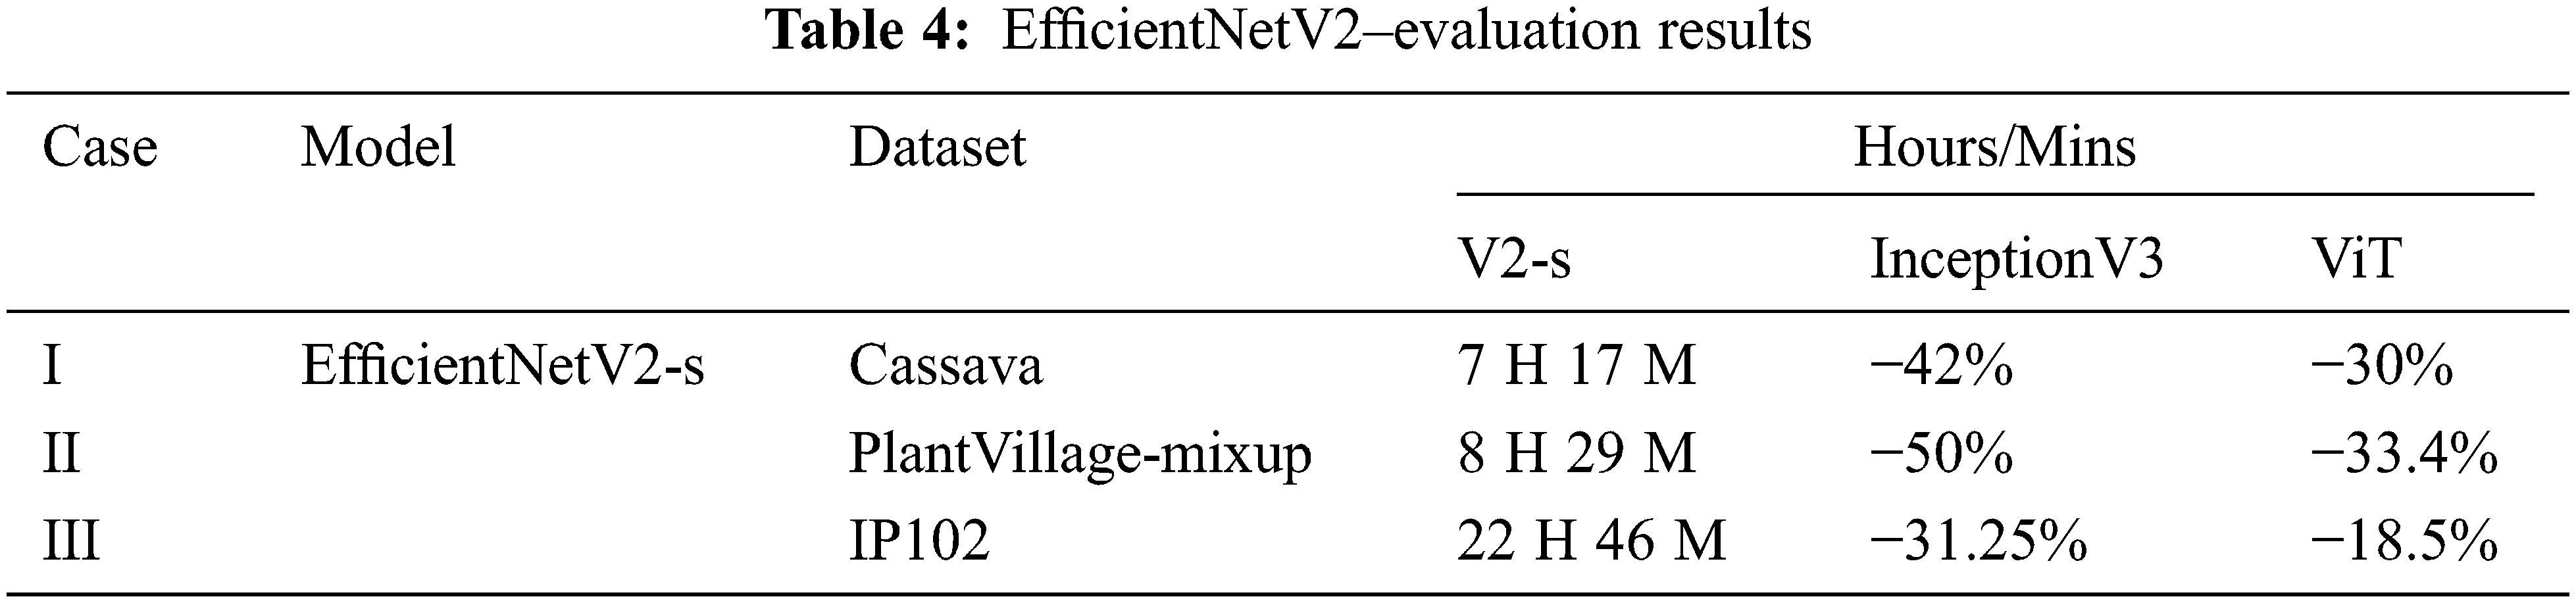

Figure 6: Inception V3-training accuracies of cassava, plant village with geometrical and mix-up augmentation, IP102 pest recognition dataset

Figure 7: ViT–B performance graph (a) Cassava–training vs. validation accuracy (b) Cassava-training vs. validation loss; (c) PlantVillage-training vs. validation accuracy (d) PlantVillage-training vs. validation loss; (e) IP102-training vs. validation accuracy (f) IP102-training vs. validation loss
The confusion matrix generated for tomato disease class of Plant Village dataset obtained for InceptionV3 and EfficientNet-V2 is shown in Figs. 8a and 8b respectively. The matrix clearly depicts the improvement in performance metrics of EfficientNetV2-s when compared to the confusion matrix of InceptionV3. The off-diagonal values, increasingly reported for close similarity classes are greatly reduced.
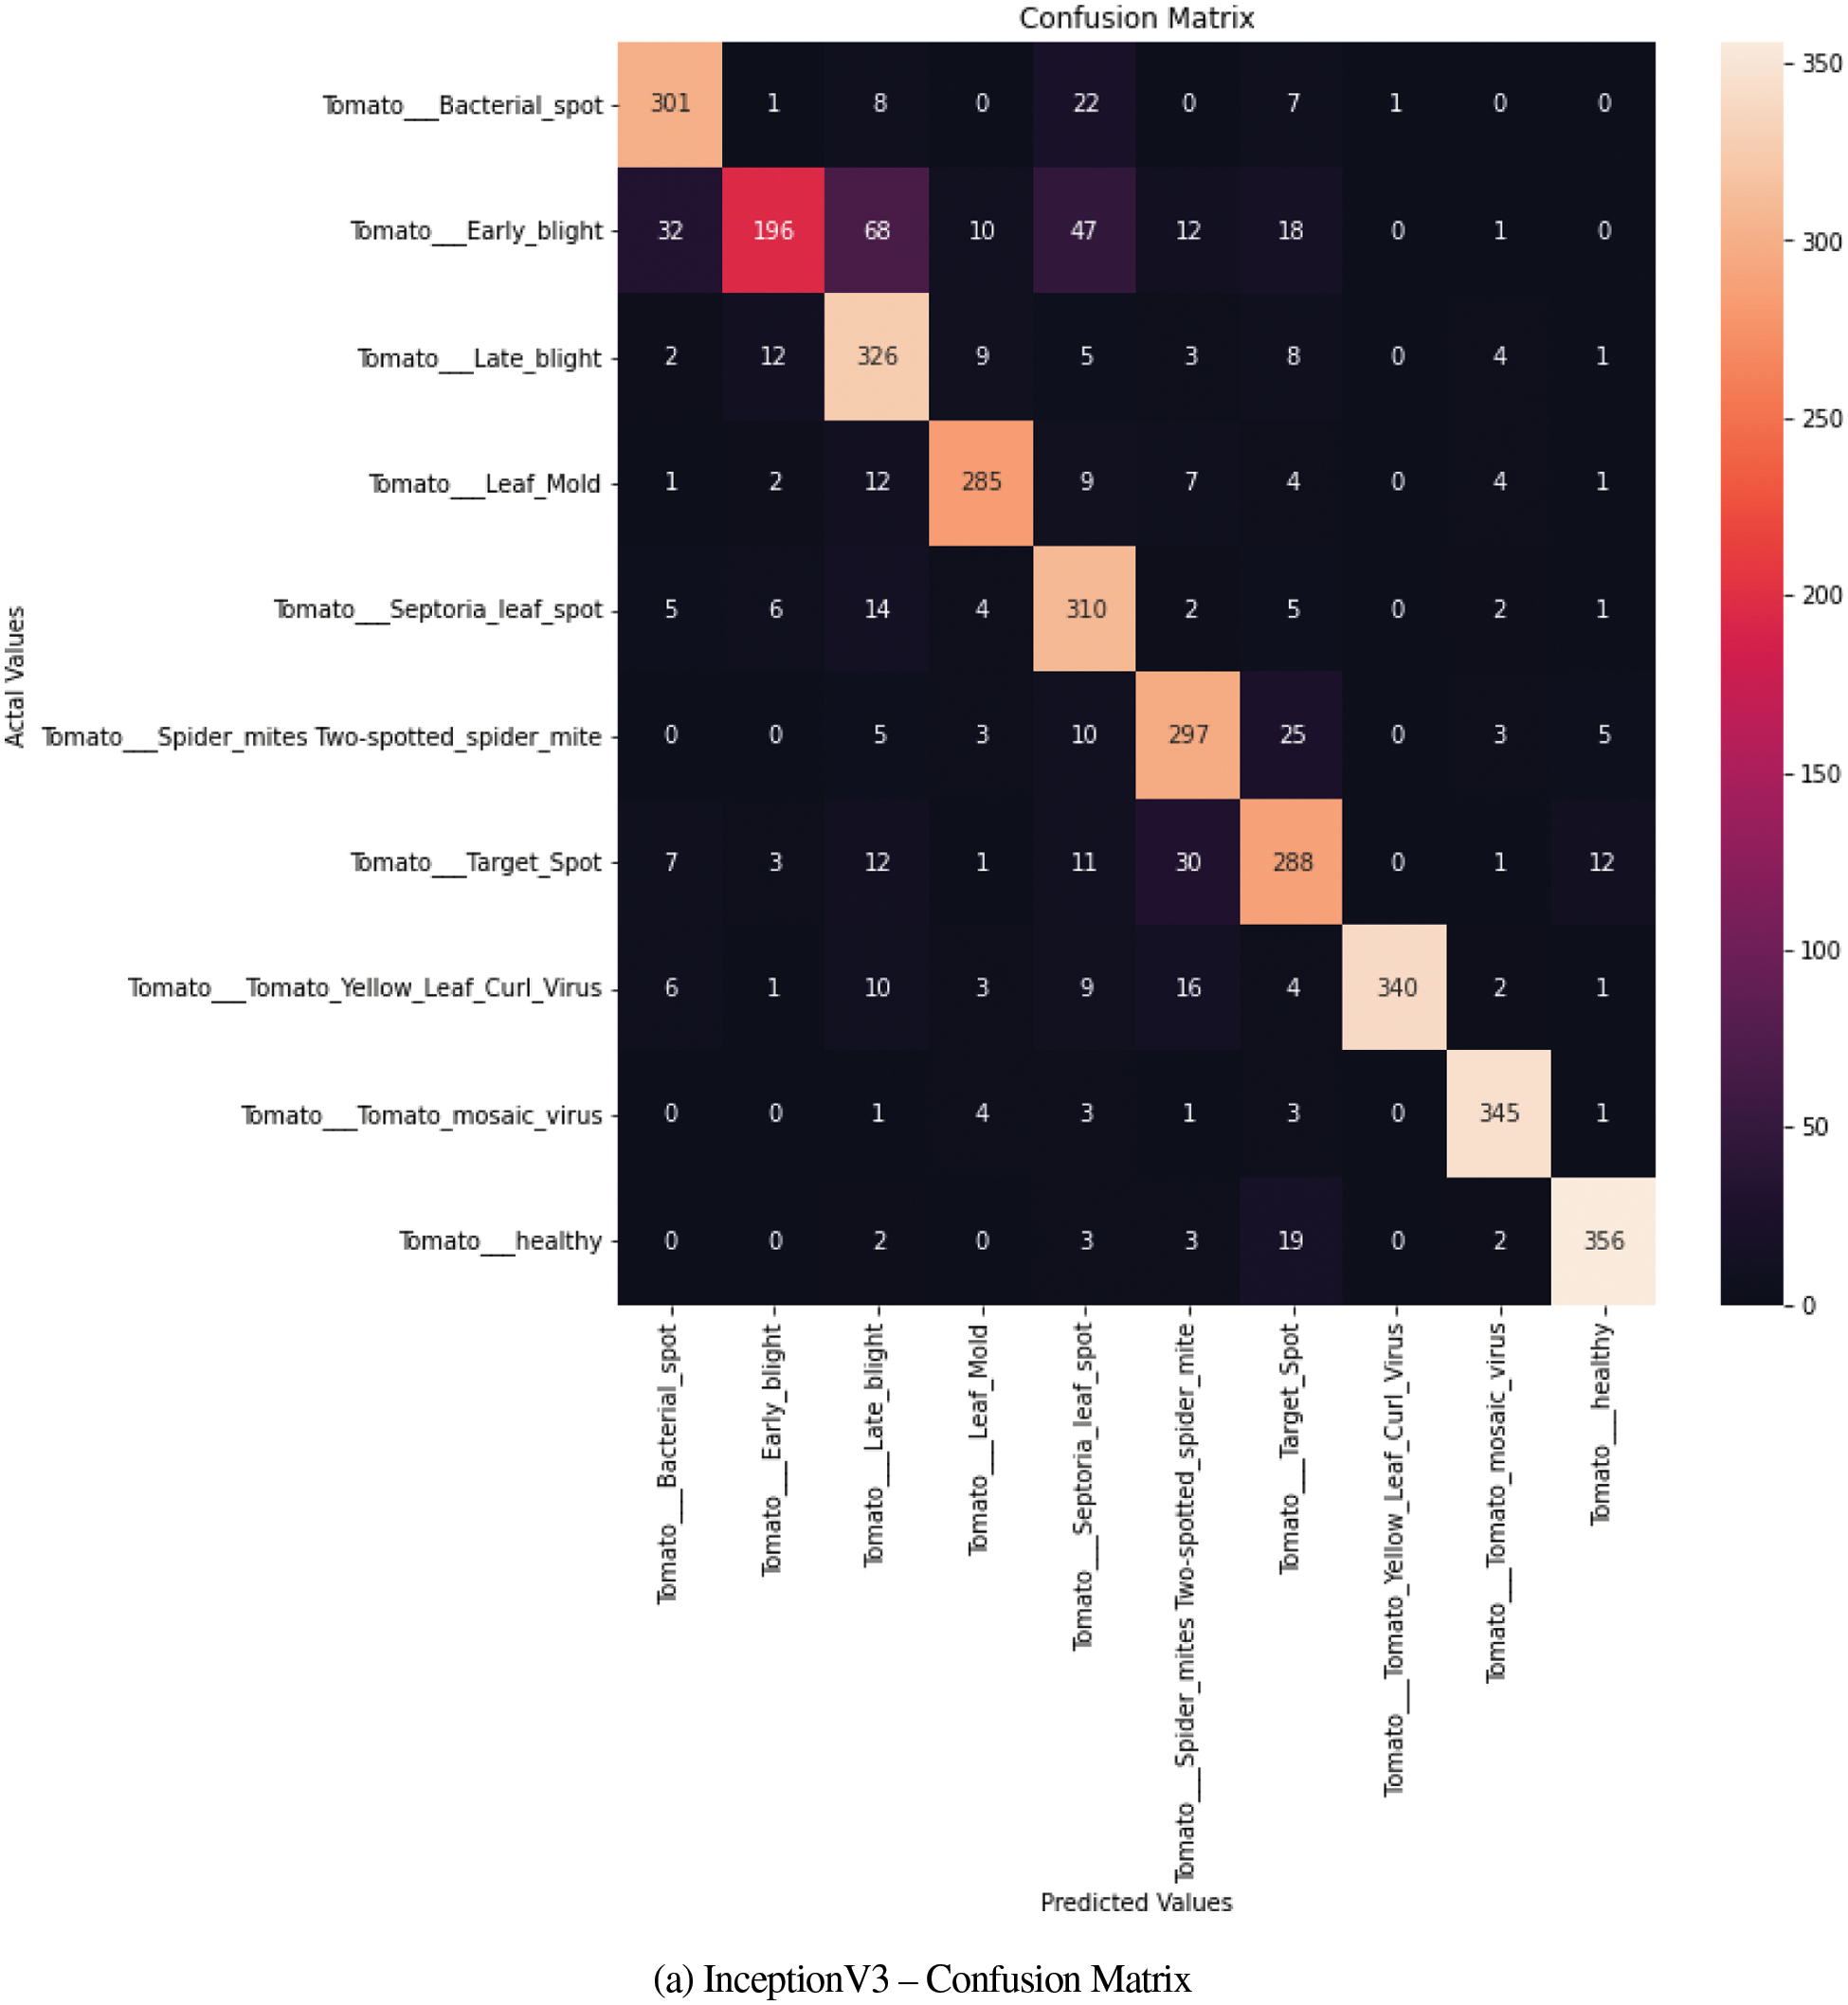
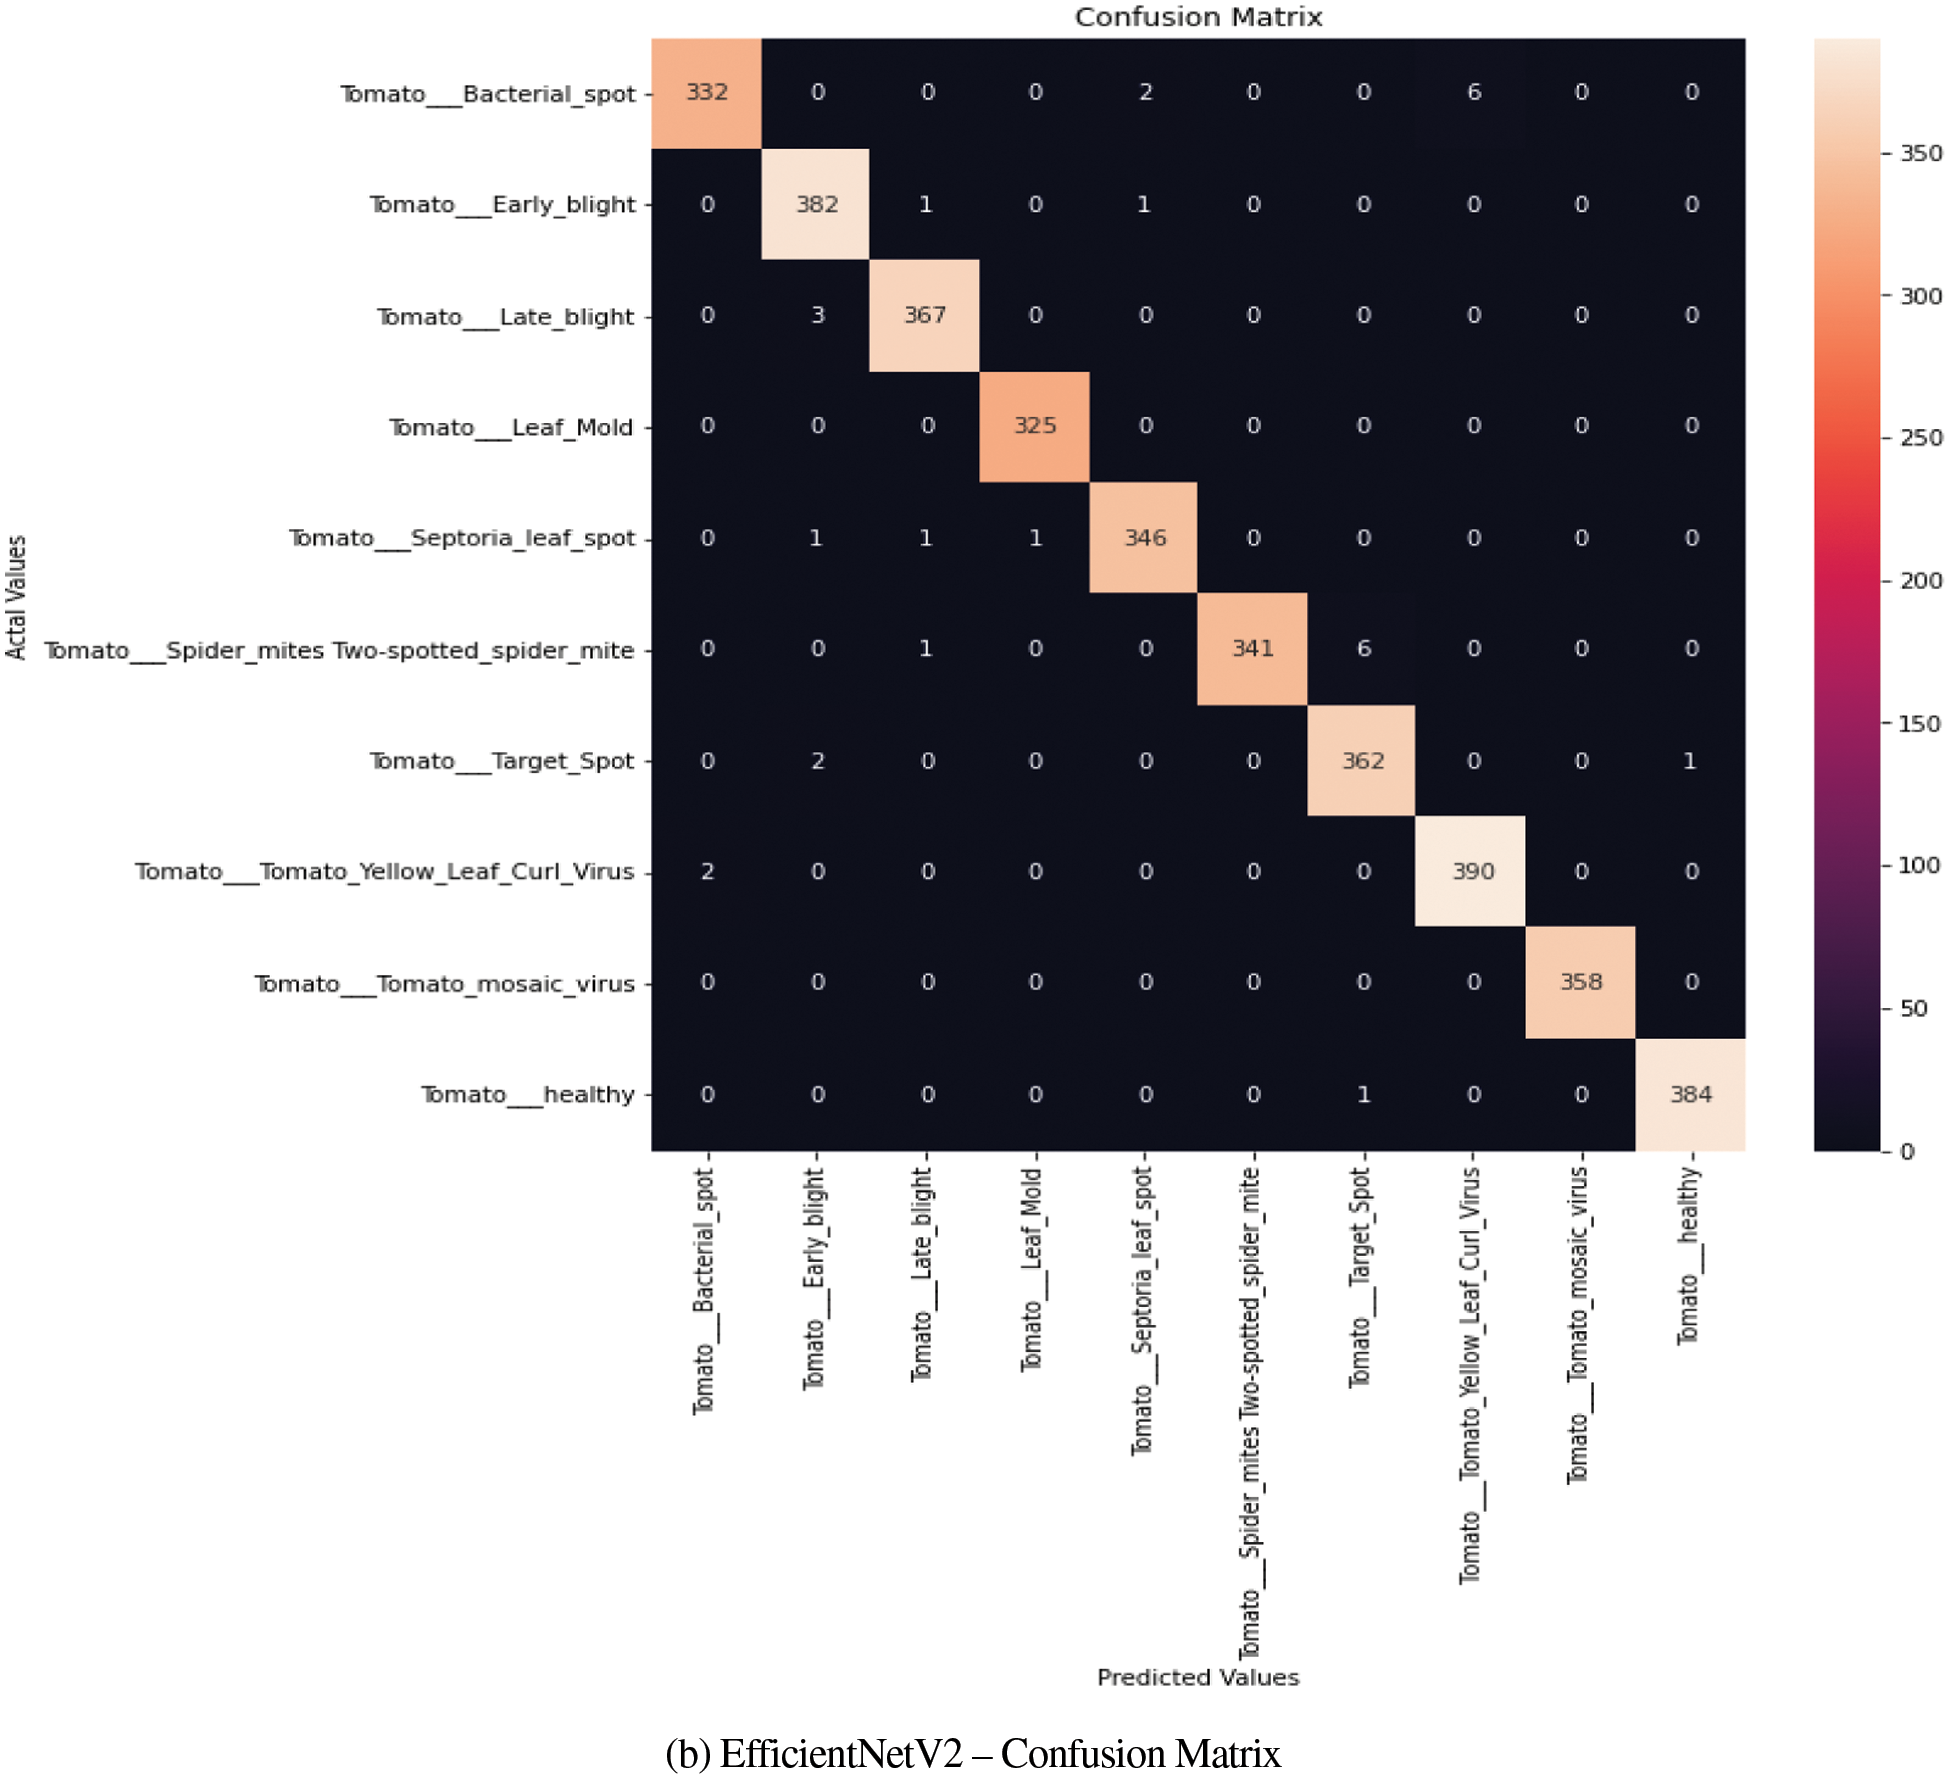
Figure 8: (a) InceptionV3–confusion matrix, (b) EfficientNetV2–confusion matrix
5.2 Observations and Inference
The accuracy metrics and training duration of Plant Village dataset with geometrical and Mix-up augmentation is closer.
a) The confusion matrix results were analyzed only for Tomato Class of PlantVillage dataset to conduct a comparative analysis among the three chosen models and to check the predictability rate. It is observed that the off diagonal-elements reports were low for Tomato Early Blight Class and close mismatch with Late Blight and Septoria Leaf spot was observed. A similarity was also reported between Tomato Target Spot and Spider Mites.
b) Thus, the confusion matrix gave an idea on diseased leaves visual symptoms and its similarity with other classes.
InceptionV3 with no attention mechanism proved to be a better performer than the ViT-B model with self-attention mechanism on classification tasks irrespective of the dataset size.
a) CUDA out of memory was frequently experienced after few epochs initially where the GPU used is the same Tesla T4, Google Colab Pro with High RAM option selected. Training the smaller models with minimal data on ViT-B resulted in over fitting and bigger models on the same was challenging.
b) CNN based Inception V3 outperformed ViT-B in performance. However, the training time of ViT was higher by 1.2 × times.
a) The confusion matrix analysis shows improved disease detection rate and models better performance metrics with faster convergence on multi-class variable sized datasets when compared to InceptionV3.
b) For Pest classification augmentation technique like geometrical and mixup has no significant impact on the end performance.
EfficientNetV2 proves to be the finest Transfer Learning model for multi class dataset of variable sizes as compared to the earlier InceptionV3 based on ConvNets and Transformer based ViTs in terms of training speed on a multi-class dataset with unbalanced data distribution among classes. The results depict that EfficientNet–V2’s transfer learning based on progressive learning strategy with optimal finetuning of regularization parameters for plant disease and pest classification during the training process outstrips the other CNN based model. However, the model resulted in negative transfer learning for bivariate classes i.e on datasets with 2 or minimal categories due to ineffective learning and thus the model is more suitable only for multi-class dataset regardless of the data distribution across the classes. The same is analysed in our next work and further the observations of EfficientNetV2 on IP102 dataset motivates us to proceed with further work on incorporating augmentation technique and attention mechanism with the concept progressive learning for Pest recognition and control applications. The investigated outcomes prove that EfficientNetV2 is a more promising model for many computer vision applications.
Funding Statement: The authors received no specific funding for this study.
Conflicts of Interest: The authors declare that they have no conflicts of interest to report regarding the present study.
References
1. Y. Yang, T. Liu, D. Shen, J. Wang, X. Ling et al., “Tomato yellow leaf curl virus intergenic siRNAs target a host long noncoding RNA to modulate disease symptoms,” PLOS Pathogens, vol. 15, no. 1, pp. e1007534, 2019. [Google Scholar]
2. S. J. Pan and Q. Yang, “A survey on transfer learning,” IEEE Transactions on Knowledge and Data Engineering, vol. 22, no. 10, pp. 1345–1359, 2009. [Google Scholar]
3. M. Hussain, J. J. Bird and D. R. Faria, “A study on cnn transfer learning for image classification,” in UK Workshop on Computational Intelligence, United Kingdom, Springer, Cham, pp. 191–202, 2018. [Google Scholar]
4. L. D. Nguyen, D. Lin, Z. Lin and J. Cao, “Deep CNNs for microscopic image classification by exploiting transfer learning and feature concatenation,” in Proc. IEEE ISCAS, Florence, FLR, Italy, pp. 1–5, 2018. [Google Scholar]
5. K. Zhang, Q. Wu, A. Liu and X. Meng, “Can deep learning identify tomato leaf disease?,” Advances in Multimedia, vol. 2018, no. 3, pp. 1–10, 2018. [Google Scholar]
6. M. Tan and Q. Le, “Efficientnetv2: Smaller models and faster training,” in Proc. ICML, San Diego, SD, CA, pp. 10096–10106, 2021. [Google Scholar]
7. R. S. Sandhya Devi, V. R. Kumar and P. Sivakumar, “A review of image classification and object detection on machine learning and deep learning techniques,” in Proc. ICECA, Coimbatore, CBE, India, pp. 1–8, 2021. [Google Scholar]
8. N. Ganatra and A. Patel, “A survey on diseases detection and classification of agriculture products using image processing and machine learning,” International Journal of Computer Applications, vol. 2180, no. 13, pp. 1–13, 2018. [Google Scholar]
9. A. Chai, B. Li, Y. Shi, Z. Cen, H. Huang et al., “Recognition of tomato foliage disease based on computer vision technology,” Acta Horticulturae Sinica, vol. 237, no. 9, pp. 1423–1430, 2010. [Google Scholar]
10. Z. Guan, J. Tang, B. Yang, Y. Zhou, D. Fan et al., “Study on recognition method of rice disease based on image,” Chinese Journal of Rice Science, vol. 24, no. 5, pp. 497–502, 2010. [Google Scholar]
11. M. H. Saleem, J. Potgieter and K. M. Arif, “Plant disease classification: A comparative evaluation of convolutional neural networks and deep learning optimizers,” Plants, vol. 9, no. 10, pp. 1319, 2020. [Google Scholar]
12. K. P. Akshai and J. Anitha, “Plant disease classification using deep learning,” in Proc. ICSPC’21, Coimbatore, CBE, India, pp. 407–411, 2021. [Google Scholar]
13. X. Liu, W. Min, S. Mei, L. Wang and S. Jiang, “Plant disease recognition: A large-scale benchmark dataset and a visual region and loss reweighting approach,” IEEE Transactions on Image Processing, vol. 30, pp. 2003–2015, 2021. [Google Scholar]
14. G. Owomugisha, F. Melchert, E. Mwebaze, J. A. Quinn and M. Biehl, “Matrix relevance learning from spectral data for diagnosing cassava diseases,” IEEE Access, vol. 9, pp. 83355–83363, 2021. [Google Scholar]
15. T. T. Santos, L. L.de Souza, A. A. dos Santos and S. Avila, “Grape detection, segmentation, and tracking using deep neural networks and three-dimensional association,” Computers and Electronics in Agriculture, vol. 170, no. 105247, pp. 1–17, 2020. [Google Scholar]
16. S. Wu, G. Li, L. Deng, L. Liu, D. Wu et al., “L1-norm batch normalization for efficient training of deep neural networks,” IEEE Transactions on Neural Networks and Learning Systems, vol. 30, no. 7, pp. 2043–2051, 2019. [Google Scholar]
17. Y. Wu and K. He, “Group normalization,” in Proc. ECCV, Munich, Germany, pp. 3–19, 2018. [Google Scholar]
18. C. K. Sunil, C. D. Jaidhar and N. Patil, “Cardamom plant disease detection approach using efficientNetV2,” IEEE Access, vol. 10, pp. 789–804, 2021. [Google Scholar]
19. S. Barburiceanu, S. Meza, B. Orza, R. Malutan and R. Terebes, “Convolutional neural networks for texture feature extraction. applications to leaf disease classification in precision agriculture,” IEEE Access, vol. 9, pp. 160085–160103, 2021. [Google Scholar]
Cite This Article
 Copyright © 2023 The Author(s). Published by Tech Science Press.
This work is licensed under a Creative Commons Attribution 4.0 International License , which permits unrestricted use, distribution, and reproduction in any medium, provided the original work is properly cited.
 Downloads
 Citation Tools