 Open Access
ARTICLE
Hybrid of Distributed Cumulative Histograms and Classification Model for Attack Detection
1 Department of Electronics and Electrical Communications Engineering, Faculty of Electronic Engineering, Menoufia University, Menouf, 32952, Egypt
2 Alexandria Higher Institute of Engineering & Technology (AIET), Alexandria, Egypt
3 Department of Computer Science, Security Engineering Laboratory, Prince Sultan University, Riyadh, 11586, Saudi Arabia
4 Department of Information Technology, College of Computer and Information Sciences, Princess Nourah Bint Abdulrahman University, P.O. Box 84428, Riyadh, 11671, Saudi Arabia
5 Department of Computer Sciences, College of Computer and Information Sciences, Princess Nourah Bint Abdulrahman University, Riyadh, Saudi Arabia
* Corresponding Author: Hussah Nasser AlEisa. Email:
Computer Systems Science and Engineering 2023, 45(2), 2235-2247. https://doi.org/10.32604/csse.2023.032156
Received 09 May 2022; Accepted 10 June 2022; Issue published 03 November 2022
Abstract
Traditional security systems are exposed to many various attacks, which represents a major challenge for the spread of the Internet in the future. Innovative techniques have been suggested for detecting attacks using machine learning and deep learning. The significant advantage of deep learning is that it is highly efficient, but it needs a large training time with a lot of data. Therefore, in this paper, we present a new feature reduction strategy based on Distributed Cumulative Histograms (DCH) to distinguish between dataset features to locate the most effective features. Cumulative histograms assess the dataset instance patterns of the applied features to identify the most effective attributes that can significantly impact the classification results. Three different models for detecting attacks using Convolutional Neural Network (CNN) and Long Short-Term Memory Network (LSTM) are also proposed. The accuracy test of attack detection using the hybrid model was 98.96% on the UNSW-NP15 dataset. The proposed model is compared with wrapper-based and filter-based Feature Selection (FS) models. The proposed model reduced classification time and increased detection accuracy.Keywords
With the tremendous growth and popularity of the Internet, network security has become a focus of recent studies. Many organizations have been subjected to intrusions or attacks aimed at corrupting or destroying their data, stealing personal information, and causing major complications without the owner’s consent or authorization. The intrusion attempts to get beyond network security mechanisms to compromise the confidentiality, integrity, or availability of information. An intrusion detection system (IDS) is a hardware or software program that continuously monitors network or system activity for threat actors or policy deviations and alerts network administrators.
The IDS is categorized into two main detection types, signature-based and anomaly-based IDS. Signature-based intrusion detection, also known as misuse detection, may successfully detect intrusion threats based on known signatures of reported vulnerabilities. As a result, well-known intrusions can be recognized quickly and with a low proportion of false positives. Anomaly-based IDS is a statistical analysis and traffic pattern recognition. It can extract and detect intrusion patterns during the training period. In addition, it can detect zero-day attacks that misuse IDS cannot detect. The system generates models for normal behavior in data traffic and recognizes any deviation from this model as a suspected intrusion attempt. Discovering the threats between normal and deviant behaviors is a fundamental issue in overcoming high false-positive rates due to the rapidly changing nature of network data.
The network dataset is described as a set of instances, and each instance is a set of features captured from network packets describing the security event occurring at the time of capturing. This event can be tagged as normal or attack behavior in the label feature. Choosing a suitable dataset can better indicate IDS evaluation and detection performance. Many types of datasets were presented, such as KDD, NSL-KDD, NGIDS-DS, ADFA-LD, and UNSW-NP15 [1–5]. In our work, we present the UNSW-NP15 dataset because of its attack variety and non-redundant records.
Feature selection is a method that selects a subset from the given input dataset based on certain criteria. Feature selection has two different methods: the filter and wrapper methods. The filter method selects features based on ranking models. The wrapper method is a learning algorithm that uses a classifier algorithm to train itself to evaluate and select the better subset. Moreover, it is also used to simplify the models, acquire less training time, and reduce the over-fitting. Feature selection is a vital point of view in intrusion detection systems for improving the performance of classifiers and reducing the execution time and cost. Moreover, redundant and non-useful features that do not contribute to the decision process in the classification stage must be removed for upgrading to upgrade the detection accuracy and speed up intrusion detection performance [1].
In this paper, we proposed a new hybrid system consisting of feature selection based on cumulative histogram plotting (CHP) and multiple models based on deep learning to optimize its efficiency in threat detection. The CHP method is based on studying and plotting the historical values of the features to generate the relations between them and extract the most strength features that can be influenced by the attack or intrusion [2,3]. Because of the superiority of deep learning models over the rest of the other models in terms of high efficiency and lower computational cost; we present three different models based on deep learning. The first uses a convolutional neural network (CNN) based on a single convolutional dimension (S-CNN), the second is a Long Short-Term Memory Network (LSTM), and the last one is a hybrid model between them (S-CNN + LSTM).
The outline of the paper is organized as follows. Section 2 explains the proposed hybrid system. Section 3 presents the analysis and discussions of the simulation results. Finally, the concluding remarks and future directions are provided in Section 4.
Intrusion and threat detection systems are among the most effective tools in defending against potential attacks. Therefore, in order to build an effective and fast algorithm against attacks, a hybrid model based on feature reduction and deep neural networks is proposed. The proposed hybrid framework is shown in Fig. 1 and it consists of several phases. In the beginning, we discuss the UNSW-NP15 dataset features regarding the number of records and the nature of the extracted features. Then in the first phase, we introduce pre-processing techniques such as normalization, label encoder, and imputer. Then, in the second phase, the techniques for selecting features are discussed, and we present the proposed technique for a distributed cumulative histogram. In the third phase, various models based on deep learning are explained to detect intrusions and threats. Multiple models are also applied to the feature selection techniques. In the last stage, the evaluation of the performance of the multiple detection models is discussed.
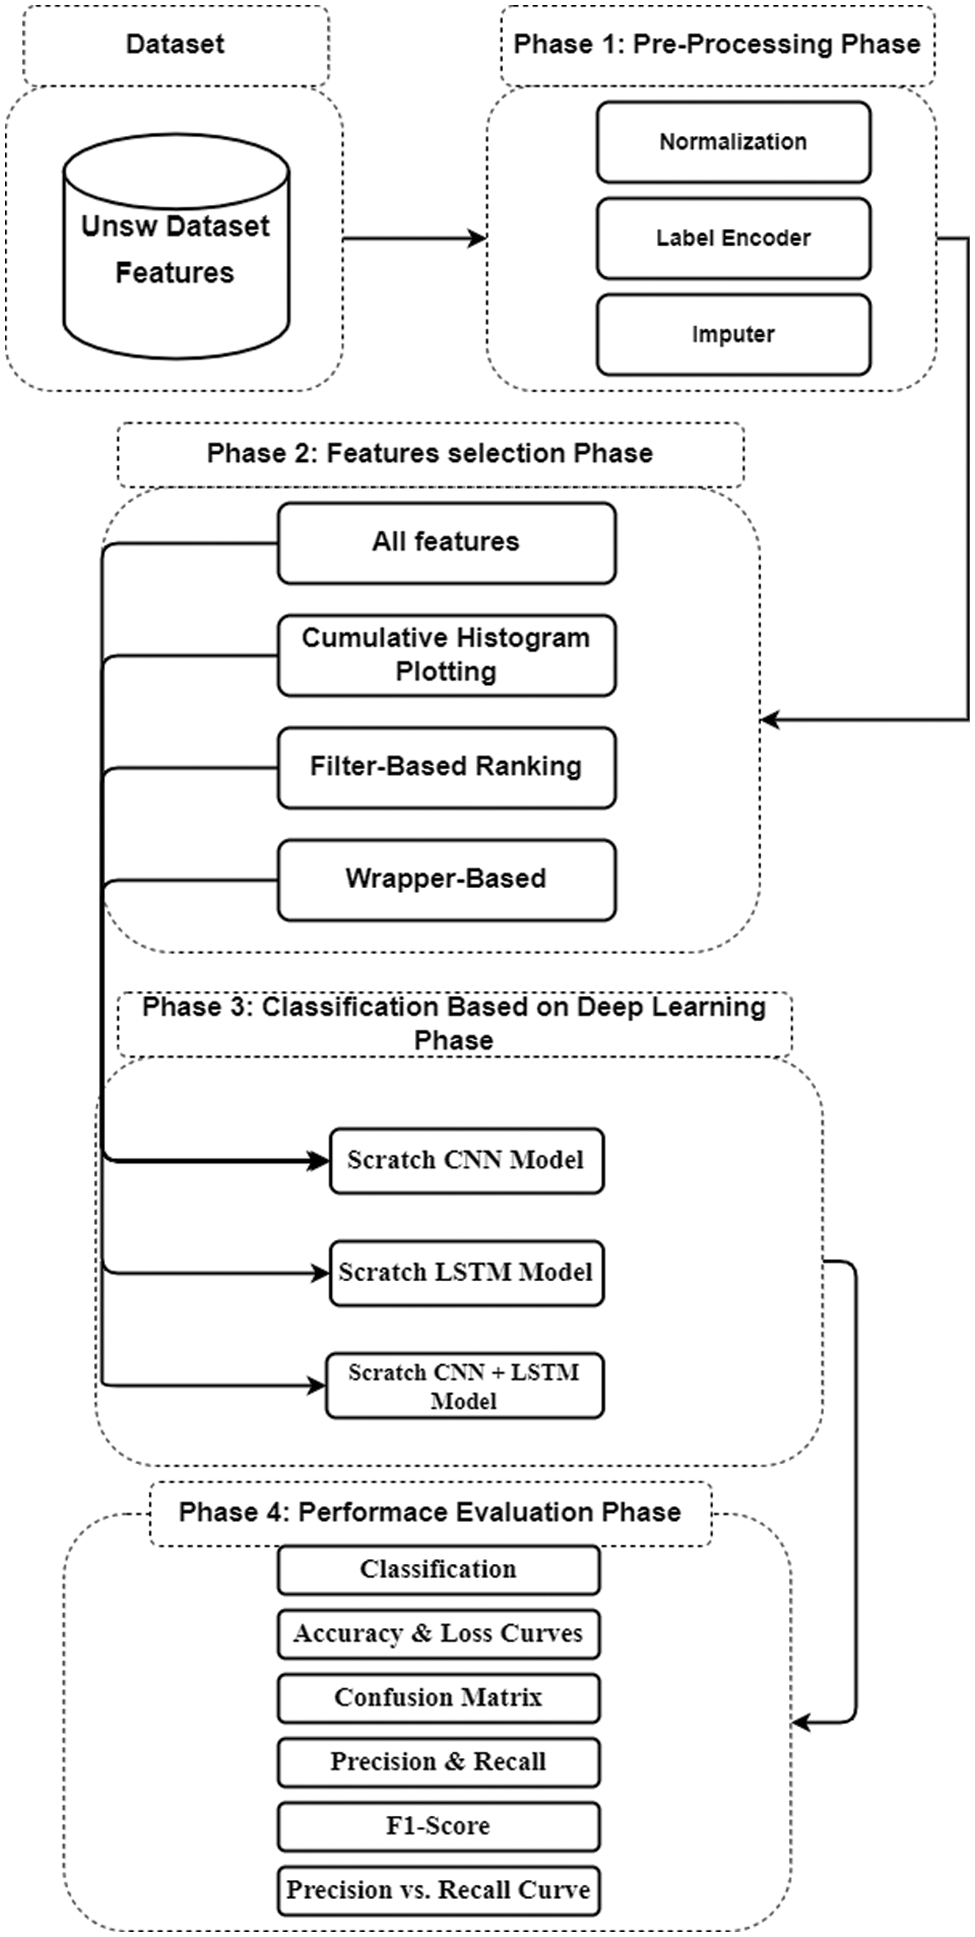
Figure 1: Proposed hybrid features selection and detection system
The UNSW-NP15 dataset is collected by Ixia PerfectStorm and Tcpdumptools to create 2.5 million records constructed from 2218761 normal traffic records emerged with 321283 attack records divided into nine subcategories. Bro-IDS and Argus tools extract 49 features and attributes divided into five groups [flow features, basic features, content features, time features, and additional generated] [4]. We ignored the additional features as they are conditional features based on the previously mentioned four groups. The used features are 35 features with 220000 records, approximately 10% of the whole dataset records.
Most of the existing classification algorithms used in the Artificial Intelligence (AI) technologies are incompatible with the dataset existing structure. The dataset must be transformed to an applicable form to be handled for performance and accuracy enhancement in the classification stage. We divided the pre-processing stage into three sub-stages. Normalization is the process of scaling all the feature values to the range [0, 1] to overcome the significantly varying feature values.
where Xmax and Xmin are the maximum and the minimum values of the feature, respectively. Label encoding is a popular approach to categorical variables. Each label is given a unique integer based on alphabetical order. Imputer means adding (0) to the empty values.
The feature selection phase refers to the methods used to extract the best and the more effective subsets from the original dataset features according to dedicated criteria. Removing redundant features, improving classification performance, and enhancing the algorithm cost and time are the main targets of this phase. There are two main feature selection techniques: filter-based and wrapper-based. The main distinction between them is the utilization of the classifier learning algorithm used in the wrapper-based method.
A filter-based FS technique is a mapping procedure of highly dimensional data into lower dimensional space based on attribute power arrangement and ranking. This method ranks and orders the qualities using the principle of attribute weights goodness evaluation to identify the most weighted attributes. Gain Ratio (GR) is the most widely used ranking method. In the model comparison, we apply (GR) to all the features and chose the highly six ranked attributes, as shown in the Tab. 1.

The wrapper-based FS method utilizes a search engine to sort all the potential features into subsets. A predefined classifier is used to grade features or a set of features, the most appropriate subset being chosen based on the utilized classifier. Utilizing the learning classifier in the subset selection may help in generating a better subset result; however, it increases cost and execution complexity. Wrapper-based FS creates all possible subsets from the feature set. It considers the subset of features with which the classification algorithm best performs. In this paper, we applied wrapper FS with the attached naive bias classifier technique to choose a subset of eight selected attributes, as shown in Tab. 2.

2.2.3 Proposed Cumulative Histogram Technique
We can compare normal and abnormal historical feature values using cumulative histogram charts by using cumulative histograms. The proposed feature selection method is applicable to select the most relevant features in the intrusion detection phase, as shown in Fig. 2.
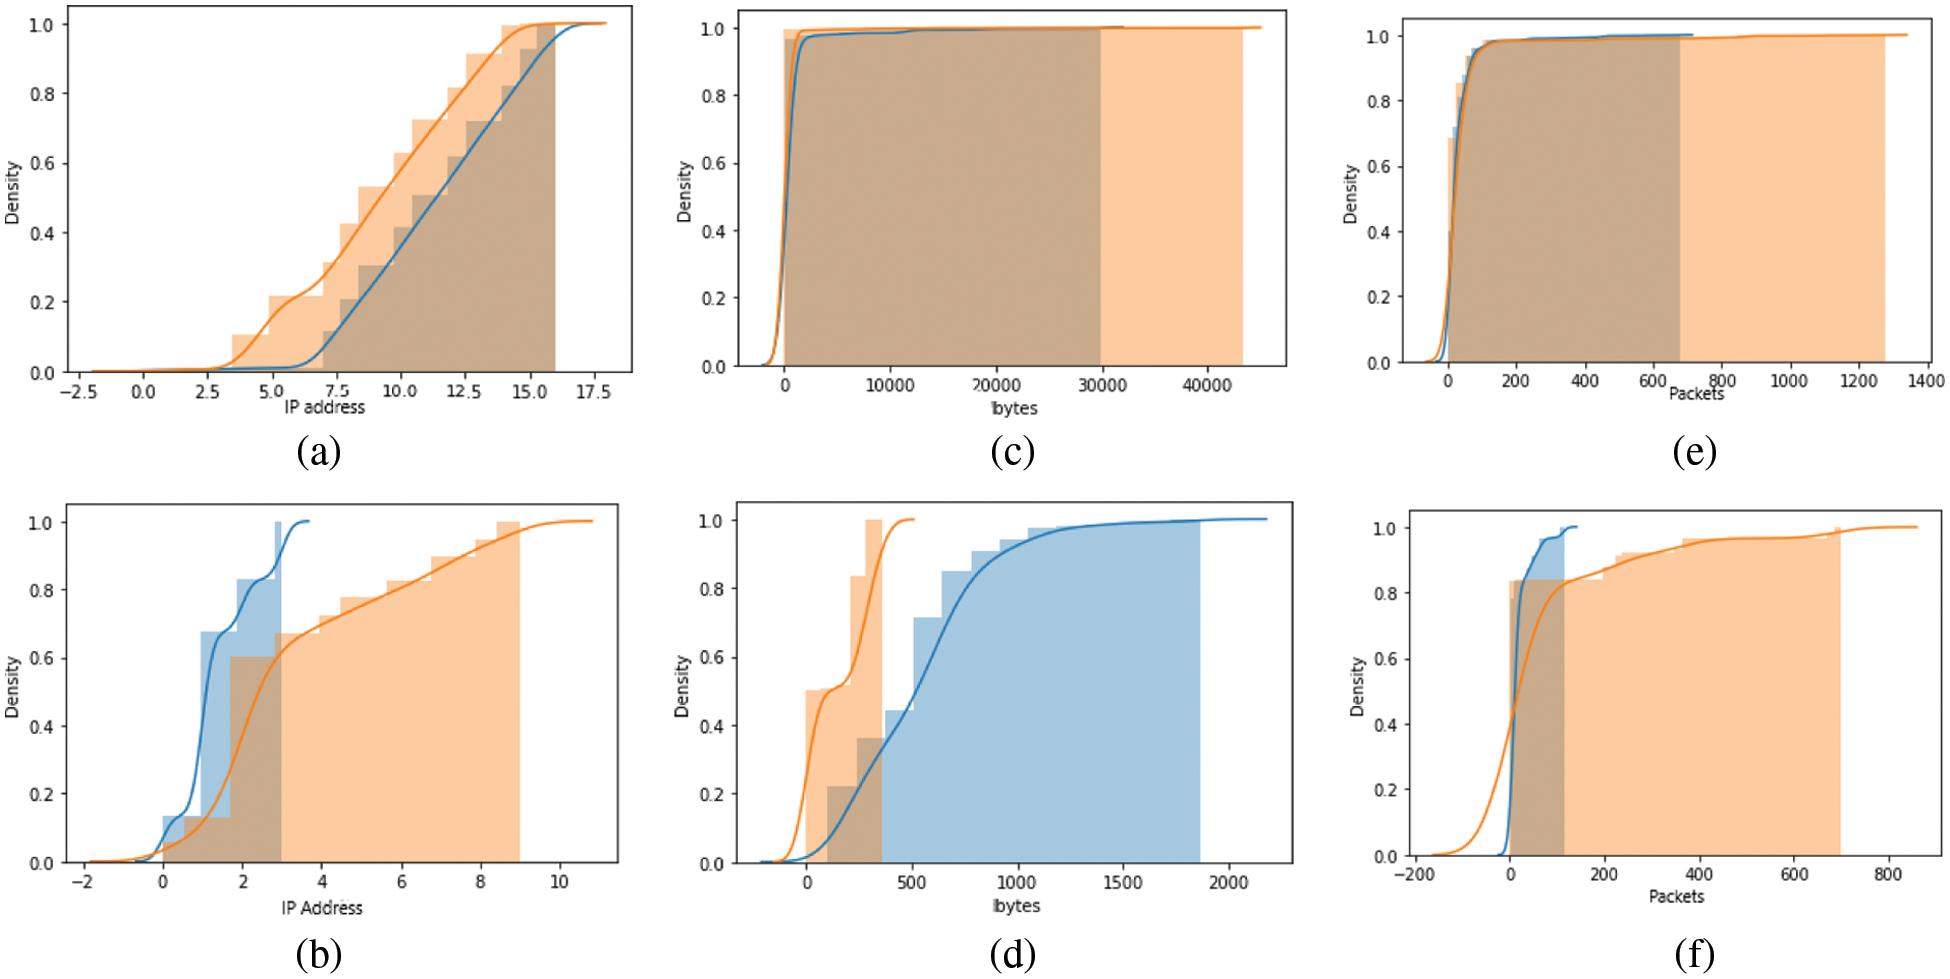
Figure 2: (a) CH of SRCIP and DSTIP features for the normal case. (b) CH of SRCIP and DSTIP features for a DDOS attack. (c) CH of the SBYTES and DBYTES features for the normal case. (d) CH of the SBYTES and DBYTES features for the attack case. (e) CH of the SPKTS and DPKTS features for the normal case. (f) CH of the SPKTS and DPKTS features for the attack case. The blue line is for the source and the orange line is for the destination
Distributed Cumulative Histogram (DCH) is proposed as a feature selection strategy in this paper. We applied DCH to the recorded values of 35 attributes. We noticed that some histogram charts remain unchanged in both the normal and abnormal cases. Fig. 3 shows several examples of DCH curves for unused features. The graph shows that all curves for the same features are very similar, giving no indication of attack impact on those features.
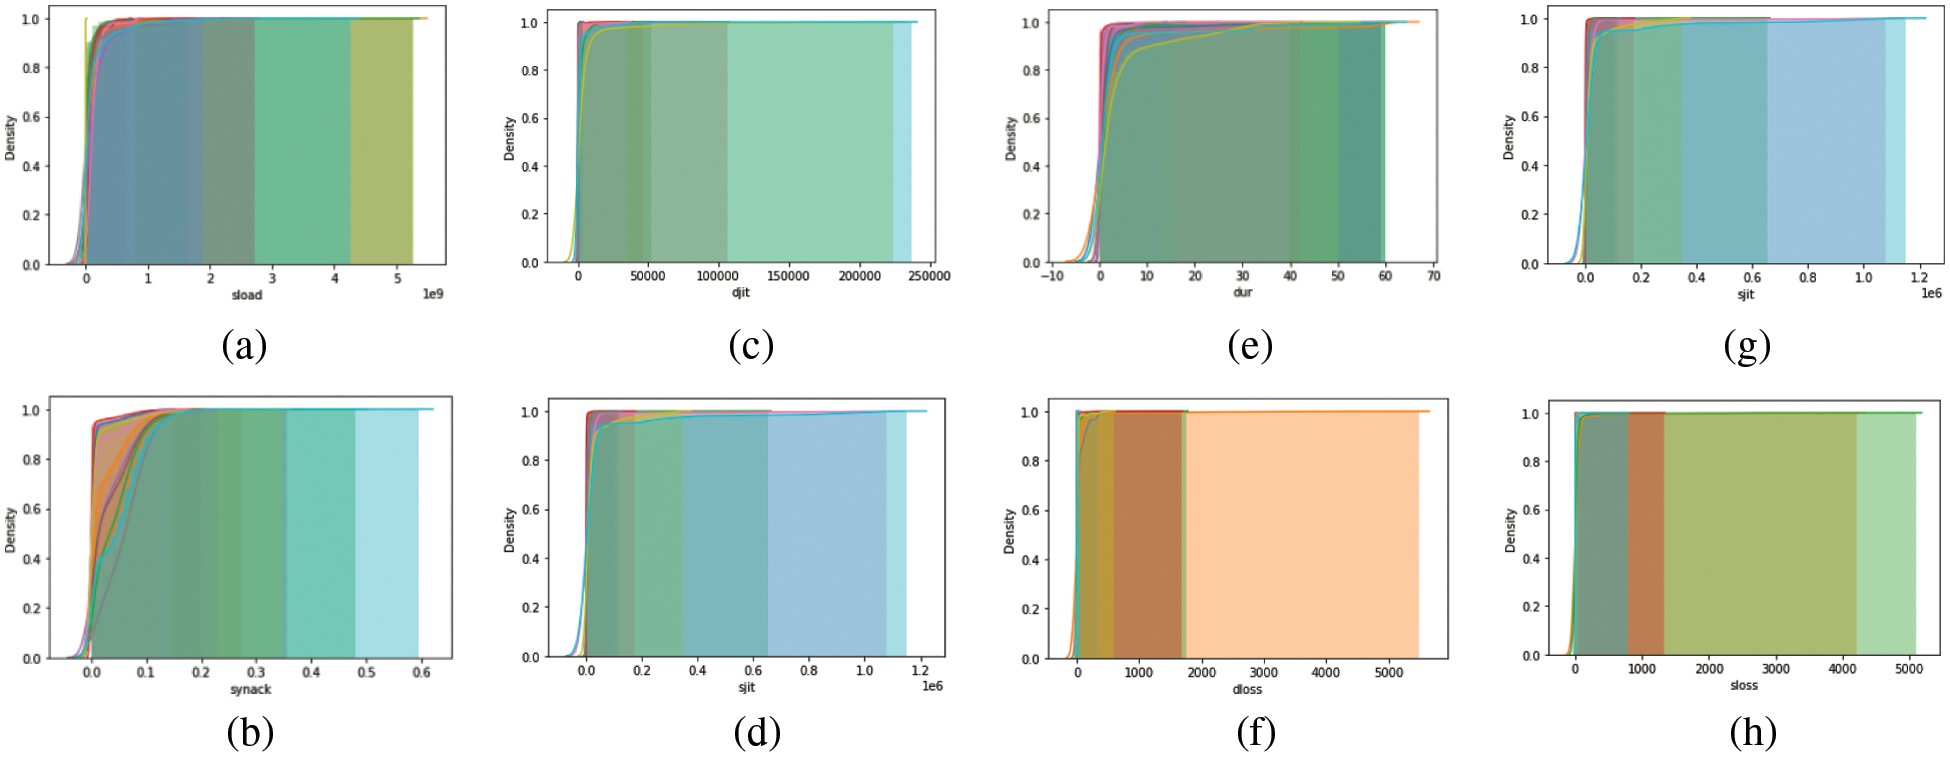
Figure 3: Examples of DCH of unused features. (a) sload, (b) synack, (c) djit, (d) sjit, (e) dur, (f) dloss, (e) sjit, and (h) sloss
Fig. 2 illustrates the DCH of the selected six attributes (SRCIP-DSTIP-SBYTES-DBYTES-SPKTS-DPKTS), which shows a large difference between normal and attack scenarios. Fig. 2a shows the DCH of SRCIP and DSTIP features in the normal case. We can see a big similarity as every source Internet Protocol (IP) communicates directly with the destination IP. This curve describes the normal traffic scenario. However, in Fig. 2b, we can observe a small range of source IP communicating with a large range of destination IPs. Thus, that indicates abnormal behavior of DDOS and EXPLOIT instances, where one or two IP addresses hop to install multiple connections with different destinations indicating a bad intention and abnormal scenario such as scanning or denial of service activities. Fig. 2c illustrates the DCH of SBYTES and DBYTES features for normal instances that show approximately the same number of bytes transmitted from source IP to destination IP and vice versa. Fig. 2d shows DCH of SBYTES and DBYTES features in case of a SHELLCODE attack. The number of SBYTES extends over a big range than DBYTES due to the nature of this attack that needs more actions, commands, and traffic transmitted from the attacker (source IP) side that tries to compromise the victim (Destination IP). Fig. 2e shows the DCH curve of SPKTS and DPKTS features for the normal instances showing approximately the same curve characteristics. Fig. 2f shows the DCH curve of the SPKTS and DPKTS features for the WORM attack that illustrates this attack behavior. The attacker (source IP) sends small payloads containing malicious payload files trying to compromise the victim, open reverse TCP connections, and extract the victim data. So, we observe most of the data generated from the destination IP to the source IP.
2.3 Classification Based on Deep Learning Phase
Deep learning methods have made great progress in many areas in the last ten years. DL falls under machine learning methods but it is more complex. The most successful applications using DL are computer vision, such as natural language translation, speech recognition, and many others [5]. DL has also been used to detect intrusion, and in recent studies, scenarios based on DL have outperformed traditional ML techniques [6].
At this phase, multiple models are proposed to detect threats and intrusions. Multiple suggested models rely on deep learning for their high efficiency with lower computational costs. First, multiple models are applied to the proposed UNSW-NP15 dataset. As shown in Fig. 1, multiple models are applied to all features after the second phase. Then feature selection techniques are applied to reduce the number of features used to apply multiple models based on deep learning.
Fig. 4 shows the proposed CNN model to classify threats and intrusions. The CNN model consists of several stages, starting with the input layer, which has different dimensions depending on the number of features. Then there are three convolutional layers based on one dimension called Conv1D. Each convolution layer contains 64 filters, followed by the ReLU (Rectified Linear Unit) activation function layer. The Conv1D layer is characterized by its ability to preserve different digital data patterns by extracting the features of different samples. The output dimensions are three: the first is the number of samples, the second is the number of features, and the third is the number of filters used. Then we use the flatten layer to convert the extracted features from 3 dimensions to 2 dimensions. The last stage consists of three layers of fully connected neural networks. Finally, the model ends with a Softmax layer to determine if the case is normal or abnormal.
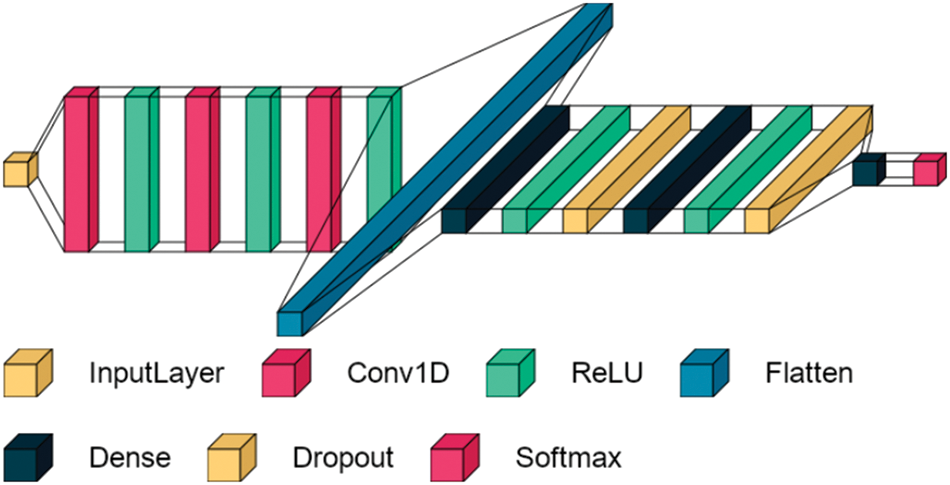
Figure 4: Proposed CNN model
A Recurrent Neural Network (RNN) is characterized by its ability to remember the things it has learned. An LSTM is a specific type of RNN that is used in time series data prediction due to its simplicity. In feed-forward neural networks, the output of any layer depends only on the current input. On the contrary, in RNN networks, the output of any layer depends on the current input with the previous output, and this represents the main problem in RNN that the network weights disappear after a large number of passes, and it is called the gradient fading problem. The weight values of the neural networks are updated during training by means of gradients, as in Eq. (2). The problem of gradient fading means that the weights are updated in a slow or small gradual manner, and this means that the model is unable to learn more. Thus, the model is unable to retain information for long sequences.
LSTM was introduced in [7] to solve the vanishing gradient problem experienced by the RNN. Therefore, LSTM is considered the best model for processing long sequences and many time steps. LSTM has also been developed to deal with the vanishing gradient problem, where the inner loops are used to preserve only the important data and ignore any other data, which is a feature purification. The relative insensitivity to gap length is also a characteristic of LSTM networks. However, LSTM networks partly suffer from vanishing scaling because they suffer from explosive scaling. For more details on the LSTM network calculations, refer to [8]. Fig. 5 shows the configuration of the proposed LSTM model, similar to the CNN model in Fig. 4 in terms of using three layers of fully connected neural networks, including two layers, Dropout, and ending with a SoftMax decision-making layer. The LSTM model has the advantage that it does not contain a large number of layers and is therefore relatively fast. It also uses a single-layer LSTM that preserves only the important features and is selected based on the common features in different samples. The nodes in the LSTM and fully connected layer are 70 and 1,024, respectively.
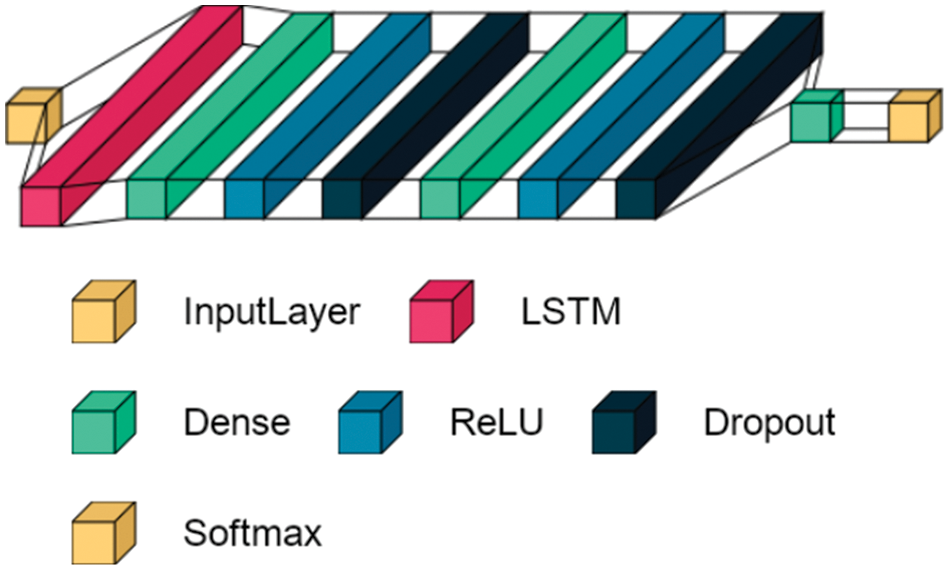
Figure 5: Proposed LSTM model
The CNN model and the LSTM model show different features and strategies in data processing and decision-making in detecting threats and intrusions. Therefore, we made a hybrid model that depends heavily on the CNN model by changing the flattened layer to the LSTM layer containing 70 nodes and using the Maxpooling1D pooling layer after the Conv1D layers, as shown in Fig. 6. In order to speed up the training process and reduce features, a Maxpooling layer was used. We use LSTM in this paper for its ability to deal with the vanishing gradient problem as time-series data are generated [9]. A one-dimensional CNN has also been integrated after the LSTM for its ability to learn the spatial features of the training data. Thus, the use of CNN with LSTM can extract both spatio-temporal features and thus improve the accuracy of intrusion detection. The cross-entropy function calculates the categorical loss that is used in all models. The loss function of the model is determined by computing the following sum:
where

Figure 6: Proposed CNN + LSTM model
2.4 Performance Evaluation Phase
In this phase, a comprehensive performance analysis is presented to evaluate the models that have been tested. The performance of the classification models is evaluated using detection evaluation metrics. The performance metrics are accuracy and loss curves, confusion matrix, precision (PPV) (positive predictive value), recall (TPR) (true positive rate), sensitivity, precision vs. recall curve, and F1 score. These are comprehensively included in the research community to provide comprehensive assessments of classification approaches [10,11]. The mathematical expressions of these evaluation metrics are formulated as follows:
where
3 Experimental Results and Comparisons
This section introduces the results of applying multi-classification models based on DL on imbalanced UNSW-NP15 dataset features.
Choosing a suitable dataset plays a substantial role in the best real attacks simulation. We preferred the UNSW-NP15 dataset over the KDD and modified NSL-KDD datasets because it is a complete captured dataset that penetrates the user application layer privacy information and contains all payload and packet header information distributed over 47 features, whereas the KDD and modified NSL-KDD datasets contain only 41 data features. Furthermore, in comparison to NSL-KDD, which only offers four attack categories, the UNSW-NP15 dataset has nine attack categories that have been expanded to cover modern security scenarios and malware occurrences [12].
3.2 Features Selection Framework
In the FS phase, we used WEKA platform version 3.6 to generate filter-based features and wrapper-based features. WEKA is a simulation machine learning tool that can work with various data sources. It’s a Java-based open-source program that is used for education, research, and projects. It includes a collection of tools for classification, feature evaluation, selection, and pre-processing. WEKA accepted that data arose from wide sources, such as databases, files, and URLs. It offers a graphical user interface that interacts with data files and applies alternative techniques [13]. Python is a programming language based on the scikit-learn toolbox that allows you to test a specific set of machine learning algorithms and feature extractors. We employed this framework as a feature = preliminary analysis and histogram plotting. Python is used to develop the fine-tune machine learning algorithm settings, feature selection, and reduction techniques parameters [14].
3.3 Training Multi-Classification Models
In this phase, we performed the classification utilizing scratch multi-classification models. We have adjusted all models based on a trial-and-error optimization strategy. The data was also divided into a training and test parts by 70% to 30%, respectively. Also, 64 epochs were used in all models for a fair comparison, with the application of cross-entropy loss where our criterion was used to calculate the loss function. We also used the Adam optimizer with an adaptive learning rate that starts at 0.002 and then gradually decreases by 0.001 when the loss function stops decreasing. The Colabetory service (Colab Pro) was also used to sort out multiple classification models. The strength of the Colab Pro is its high-speed Tesla P100 GPUs with 25 GB of RAM. Python also is used with the Tensorflow and Keras libraries for training and testing. To plot the composition of the layers for each model, we used the visual keras library.
This section describes the results of experiments on the UNSW dataset to detect threats and intrusions using the proposed features purification algorithms with classification models. Tab. 3 shows the results of the detection models and features purification algorithms and shows the superiority of the DCH algorithm over the rest of the applied algorithms. Multiple detection models were also applied to the dataset without and with purification algorithms. The superiority of the DCH algorithm is shown in all multiple detection models in terms of training time and accuracy. Multiple detection models were tested on all the features from the dataset, and the proposed CNN + LSTM hybrid model achieved the highest test accuracy of 96.31% but took a large training time of 25 m and 50 s. The proposed models were also tested on more than one features purification algorithm, and the result was superior for the CNN + LSTM hybrid model in terms of accuracy, but it took a large training time. Therefore, in order to build a fast and high-accuracy model, the proposed algorithm for features purification is presented, which is DCH with CNN + LSTM hybrid model. The CNN + LSTM DCH achieved the highest accuracy of 98.96%, with the lowest training time of 20 m 26 s.

In addition, we present the performance of our proposed hybrid model for detecting offensive data and normal data. Fig. 7 shows the superiority of our proposed model confusion matrix (CM) over all features models. It also shows that the dataset is unbalanced in that the normal data is many times more than the attack data. However, Fig. 8 shows that the training and testing curves fit together and do not show signs of overfitting. Fig. 7 shows the Precision vs. Recall curve of the proposed model that indicates that the two classes are close to 1.
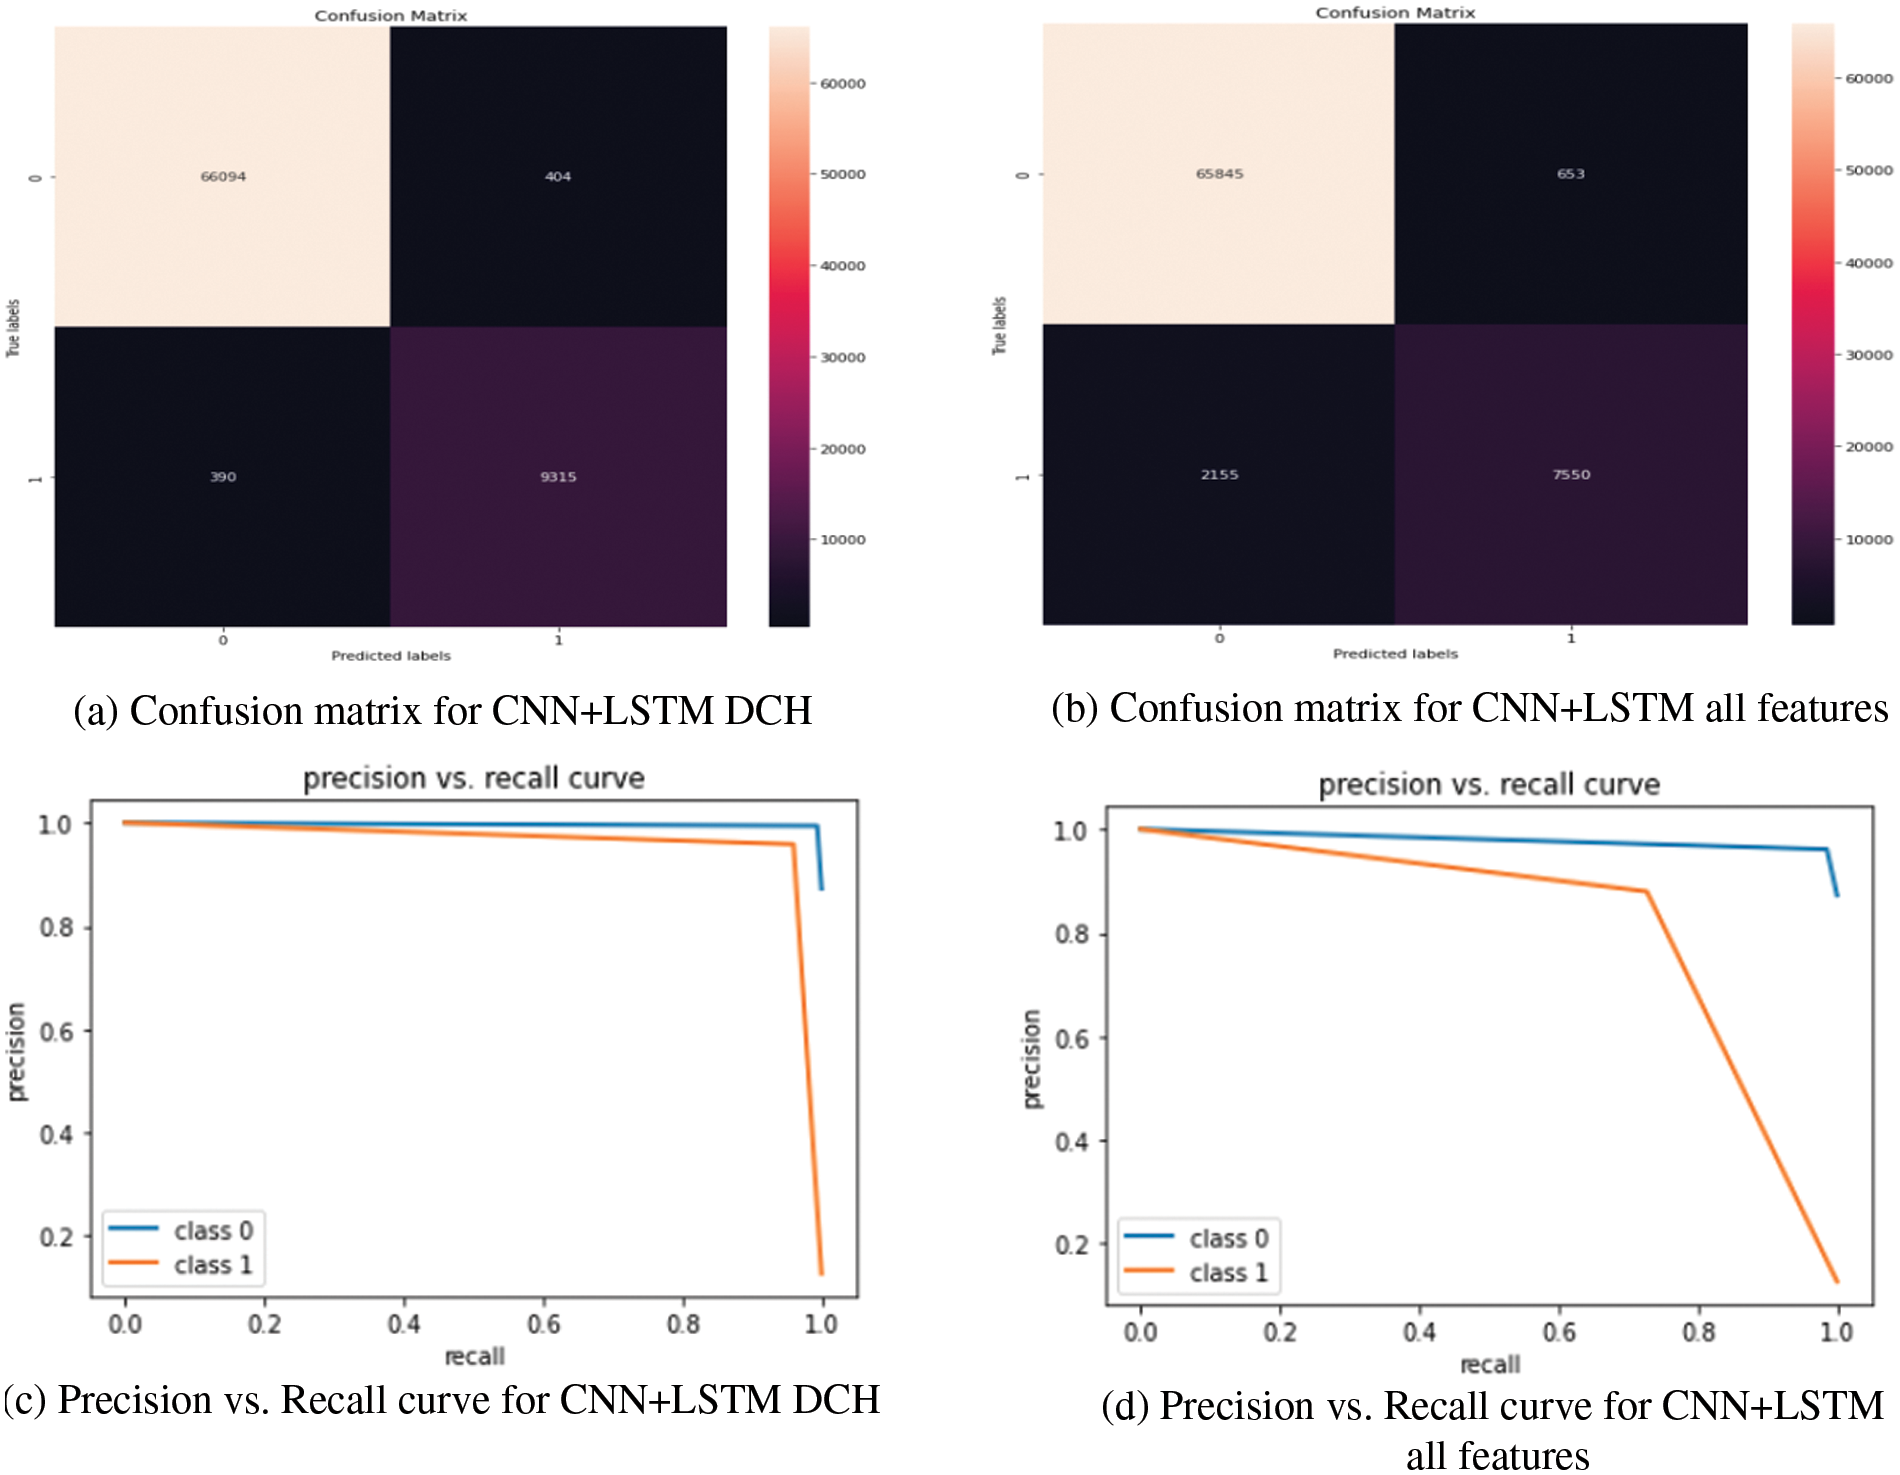
Figure 7: Effect of using the DCH feature purification algorithm with the CNN + LSTM threat detection model. In the confusion matrix, zero indicates normal data, and one indicates attack data

Figure 8: Accuracy and loss curves of the proposed CNN + LSTM DCH hybrid model
Attack detection using deep learning is the best algorithm to protect data security from future attacks. However, deep learning requires a lot of training time with a large number of features and data. This paper presented a new hybrid model that combines a feature reduction strategy with CNN + LSTM. Experiments were conducted using more than one type to reduce the features and more than one classification model on the UNSW-NP15 dataset. Compared to the previously discussed feature selection strategies, we discovered that the proposed DCH with only 6 features improves classification accuracy and model computational, and processing time. We compared the classification results in the hybrid model with those produced using IGR and Wrapper-based methods. Furthermore, a detailed comparison was made on the classification algorithms with the feature reduction strategy. Several scales were used to test the proposed models such as accuracy, precision, recall, f1-score, training time, confusion matrix, and precision & recall curves. The results are confirmed for the superiority of the proposed hybrid model through high accuracy with small training time and few features. In the future, we plan to use cumulative histograms to classify the types of attacks and to try to extract new approaches for anomaly detection and feature reduction.
Acknowledgement: Princess Nourah bint Abdulrahman University Researchers Supporting Project Number (PNURSP2022R66), Princess Nourah bint Abdulrahman University, Riyadh, Saudi Arabia.
Funding Statement: Princess Nourah bint Abdulrahman University Researchers Supporting Project number (PNURSP2022R66), Princess Nourah bint Abdulrahman University, Riyadh, Saudi Arabia.
Conflicts of Interest: The authors declare that they have no conflicts of interest to report regarding the present study.
References
1. M. Alshawabkeh, M. Moffie, F. Azmandian and J. Aslam, “Effective virtual machine monitor intrusion detection using feature selection on highly imbalanced data,” in Proc. of the IEEE Ninth Int. Conf. on Machine Learning and Applications (ICMLA), Washington, USA, pp. 823–827, 2010. [Google Scholar]
2. A. Kind, M. Stoecklin and X. Dimitropoulos, “Histogram-based traffic anomaly detection,” IEEE Transactions on Network and Service Management, vol. 6, no. 2, pp. 110–121, 2009. [Google Scholar]
3. M. Roman and R. Tushnytskyy, “Piece-wise approximation of distributed cumulative histogram features for face classification,” in Proc. of the 3rd IEEE Int. Conf. on Advanced Information and Communications Technologies (AICT), Lviv, Ukraine, pp. 101–109, 2019. [Google Scholar]
4. T. Salman, D. Bhamare, A. Erbad, R. Jain and M. Samaka, “Machine learning for anomaly detection and categorization in multi-cloud environments,” in Proc. of the 4th IEEE Int. Conf. on Cyber Security and Cloud Computing (CSCloud), New York, USA, pp. 97–103. 2017. [Google Scholar]
5. S. Pouyanfar, S. Sadiq, Y. Yan, H. Tian, Y. Tao et al., “A survey on deep learning: Algorithms, techniques, and applications,” ACM Computing Surveys, vol. 51, no. 5, pp. 92–110, 2019. [Google Scholar]
6. Y. Xin, L. Kong, Z. Liu, Y. Chen, Y. Li et al., “Machine learning and deep learning methods for cybersecurity,” IEEE Access, vol. 6, pp. 35365–35381, 2018. [Google Scholar]
7. S. Hochreiter and J. Schmidhuber, “Long short-term memory,” Neural Computation, vol. 9, no. 8, pp. 1735–1780, 1997. [Google Scholar]
8. K. Zhengmin, Y. Cui, Z. Xia and H. Lv, “Convolution and long short-term memory hybrid deep neural networks for remaining useful life prognostics,” Applied Sciences, vol. 3, no. 19, pp. 41–56, 2019. [Google Scholar]
9. T. Tang, L. Mhamdi, D. McLernon and S. Zaidi, “Deep recurrent neural network for intrusion detection in SDN-based networks,” in Proc. of the 4th IEEE Conf. on Network Softwarization and Workshops (NetSoft), Montreal, Canada, pp. 202–206, 2018. [Google Scholar]
10. A. Razan, H. Musafer, A. Alessa, M. Faezipour and A. Abuzneid, “Features dimensionality reduction approaches for machine learning based network intrusion detection,” Electronics, vol. 5, no. 3, pp. 301–322, 2019. [Google Scholar]
11. R. Hwang, M. Peng, C. Huang and P. Lin, “An unsupervised deep learning model for early network traffic anomaly detection,” IEEE Access, vol. 8, pp. 30387–30399, 2020.. [Google Scholar]
12. B. Patel, Z. Somani, S. Ajila and C. Lung, “Hybrid relabeled model for network intrusion detection,” in Proc. of IEEE Int. Conf. on Internet of Things (iThings) and IEEE Green Computing and Communications (GreenCom) and IEEE Cyber, Physical and Social Computing (CPSCom) and IEEE Smart Data (SmartData), Halifax, Canada, pp. 872–877, 2018. [Google Scholar]
13. S. Sen, “A survey of intrusion detection systems using evolutionary computation,” Bio-Inspired Computation in Telecommunications, vol. 4, no. 10, pp. 73–94, 2015. [Google Scholar]
14. A. Nagpal and G. Gabrani, “Python for data analytics, scientific and technical applications,” in Proc. of IEEE Amity Int. Conf. on Artificial Intelligence (AICAIDubai, United Arab Emirates, pp. 140–145, 2019. [Google Scholar]
Cite This Article
 Copyright © 2023 The Author(s). Published by Tech Science Press.
This work is licensed under a Creative Commons Attribution 4.0 International License , which permits unrestricted use, distribution, and reproduction in any medium, provided the original work is properly cited.


 Submit a Paper
 Propose a Special lssue
 View Full Text
 Download PDF
 Downloads
 Citation Tools