 Open Access
ARTICLE
Hybrid Metaheuristics Feature Selection with Stacked Deep Learning-Enabled Cyber-Attack Detection Model
1 Department of Computer Science, College of Science & Art at Mahayil, King Khalid University, Muhayel Aseer, 62529, Saudi Arabia
2 Department of Electrical Engineering, College of Engineering, Princess Nourah bint Abdulrahman University, P.O. Box 84428, Riyadh, 11671, Saudi Arabia
3 Department of Computer Sciences, College of Computing and Information System, Umm Al-Qura University, Saudi Arabia
4 Department of Computer Science, College of Sciences and Humanities- Aflaj, Prince Sattam bin Abdulaziz University, Saudi Arabia
5 Department of Digital Media, Faculty of Computers and Information Technology, Future University in Egypt, New Cairo, 11835, Egypt
6 Department of Computer and Self Development, Preparatory Year Deanship, Prince Sattam bin Abdulaziz University, Al-Kharj, 16278, Saudi Arabia
7 Department of Information System, College of Computer Engineering and Sciences, Prince Sattam bin Abdulaziz University, AlKharj, Saudi Arabia
* Corresponding Author: Mesfer Al Duhayyim. Email:
Computer Systems Science and Engineering 2023, 45(2), 1679-1694. https://doi.org/10.32604/csse.2023.031063
Received 09 April 2022; Accepted 08 June 2022; Issue published 03 November 2022
Abstract
Due to exponential increase in smart resource limited devices and high speed communication technologies, Internet of Things (IoT) have received significant attention in different application areas. However, IoT environment is highly susceptible to cyber-attacks because of memory, processing, and communication restrictions. Since traditional models are not adequate for accomplishing security in the IoT environment, the recent developments of deep learning (DL) models find beneficial. This study introduces novel hybrid metaheuristics feature selection with stacked deep learning enabled cyber-attack detection (HMFS-SDLCAD) model. The major intention of the HMFS-SDLCAD model is to recognize the occurrence of cyberattacks in the IoT environment. At the preliminary stage, data pre-processing is carried out to transform the input data into useful format. In addition, salp swarm optimization based on particle swarm optimization (SSOPSO) algorithm is used for feature selection process. Besides, stacked bidirectional gated recurrent unit (SBiGRU) model is utilized for the identification and classification of cyberattacks. Finally, whale optimization algorithm (WOA) is employed for optimal hyperparameter optimization process. The experimental analysis of the HMFS-SDLCAD model is validated using benchmark dataset and the results are assessed under several aspects. The simulation outcomes pointed out the improvements of the HMFS-SDLCAD model over recent approaches.Keywords
The Internet of things (IoT) consists of a compilation of heterogeneous resource-restrained objects interlinked through distinct network frameworks, namely wireless sensor networks (WSNs) [1]. These “things” or objects are generally made up of processors, sensors, and actuators with the capability to interact with one another for achieving a common objective or applications by unique identifiers in relation to the Internet protocol (IP) [2]. Recent IoT applications involve smart buildings, agriculture, industrial and manufacturing processes, aerospace and aviation, telecommunications, medical and pharmaceutical, and environmental phenomenon monitoring [3]. The fundamental IoT layered structure consists of 3 layers firstly the perception layer (comprising edge devices which interact with the environment for identifying specific external elements or other smart objects in the environment), secondly the network layer (made up of number of networking devices which finds and links devices beyond the IoT network for sending and receiving the sensed data), and lastly the application layer (made up of several IoT services or applications which is accountable for storage and data processing). Many cyber-attacks focus on the network and application layers of the IoT system [4]. After the IoT architecture is breached, attackers have the capability for sharing the IoT data with unapproved crews and may control consistency and preciseness of the IoT data over its whole life cycle [5]. Thus, these cyber-attacks must be addressed for utilization of safe IoT. Fig. 1 depicts the role of machine learning (ML) in cybersecurity.
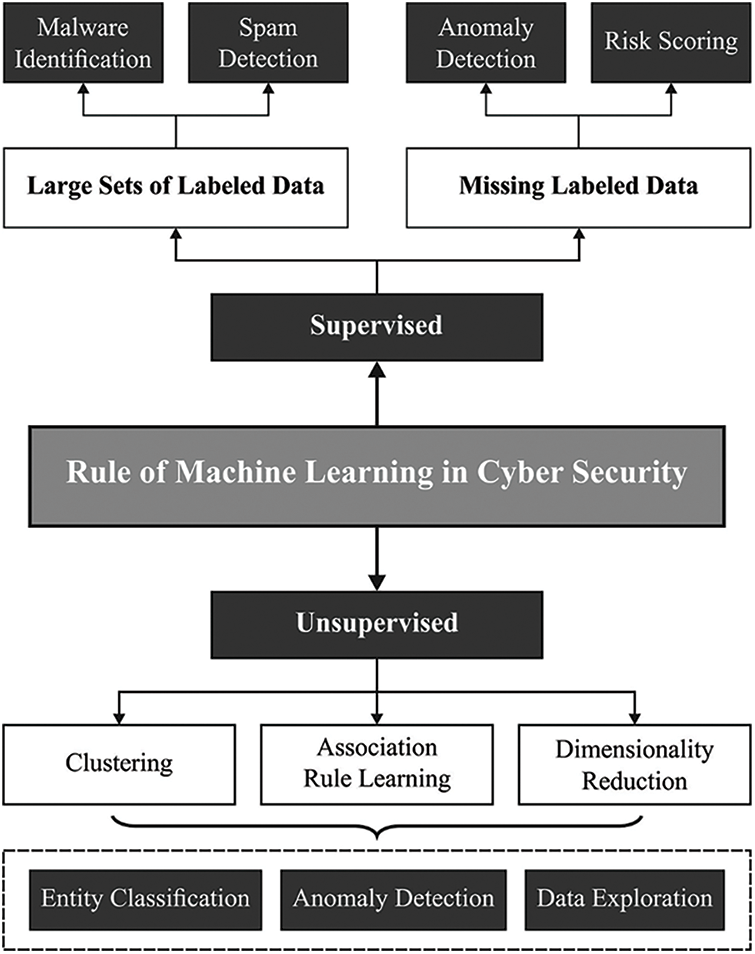
Figure 1: Role of ML in cybersecurity
Network intrusion identification approaches achieve progression from mechanisms lying on port inspection to methods making complete use of ML [6]. The normal port-related approaches are outdated since recent applications majorly depend on dynamic port allotment instead of registered port numbers [7]. The rise in the proportion of encrypted traffic drives the failure of payload-related methodologies. This guides the cybersecurity experts in the direction of using ML and network flow features. Current developments in ML methodologies for network anomaly identification were most welcomed [8,9]. Owing to the diverse and heterogeneous nature of cloud environments, ML offers responses to the difficulties impelled because of the availability of virtualized environments with its vast range of application workloads [10].
Panda et al. [11] utilized the University of New South Wales (UNSW)-NB15, a novel IoT-Botnet data (imbalanced and noisy dataset) to categorize cyberattacks. Scatter search-based feature engineering and K-Medoid sampling methods are utilized for obtaining representation data with optimum feature sets. Al-Haija [12] proposed an effectual and generic top-down structure for intrusion classification, along with recognition in IoT networks through non-conventional ML technique is presented. The presented method is personalized and utilized for intrusion classification/detection integrating IoT cyber-attack data, namely MeSSOge Queuing Telemetry Transport (MQTT) dataset, CICIDS Dataset, etc. Especially, the presented method is comprised of detection and classification (DC) subsystems, feature engineering (FE) subsystems, and feature learning (FL) subsystems. In [13], a hybrid deep random neural network (HDRaNN) for detecting cyber-attack in the IIoT is proposed. The presented method integrates a multilayer perceptron with dropout regularization and deep random neural network.
Amma [14] proposed a Vector Convolution Deep Autonomous Learning (VCDAL) classification for detecting cyberattacks in the network traffic dataset. The presented method classification extracts the feature through vector convolution neural network (CNN), automatically learns the feature via increment learning using distilled cross entropy, as well as classifies the developing network traffic dataset via softmax function. The presented classification has been by implementing experiments on standard network traffic data sets and it is clear that the presented classification could probably identify known and unknown cyberattacks. An et al. [15–18] presented an unsupervised ensemble autoencoder (AE) interconnected with the Gaussian mixture method (GMM) for adapting various fields nevertheless of the skewness of all the domains. In the hidden region of the ensemble AE, the attention-based latent representation and recreated feature of the minimal error are employed.
This study introduces novel hybrid metaheuristics feature selection with stacked deep learning enabled cyber-attack detection (HMFS-SDLCAD) model. The major intention of the HMFS-SDLCAD model is to design salp swarm optimization based on particle swarm optimization (SSOPSO) algorithm for feature selection process. Moreover, stacked bidirectional gated recurrent unit (SBiGRU) model is utilized for the identification and classification of cyberattacks. At last, whale optimization algorithm (WOA) is employed for optimal hyperparameter optimization process. The experimental analysis of the HMFS-SDLCAD model is validated using benchmark dataset and the results are assessed under several aspects.
2 The Proposed Cyber-Attack Detection Model
In this study, a new HMFS-SDLCAD model has been developed to recognize the occurrence of cyberattacks in the IoT environment. At the preliminary stage, data pre-processing is carried out to transform the input data into useful format. Then, the SSOPSO algorithm is utilized to elect features. In addition, the WOA with SBiGRU model is utilized for the identification and classification of cyberattacks. Fig. 2 demonstrates the block diagram of HMFS-SDLCAD technique.
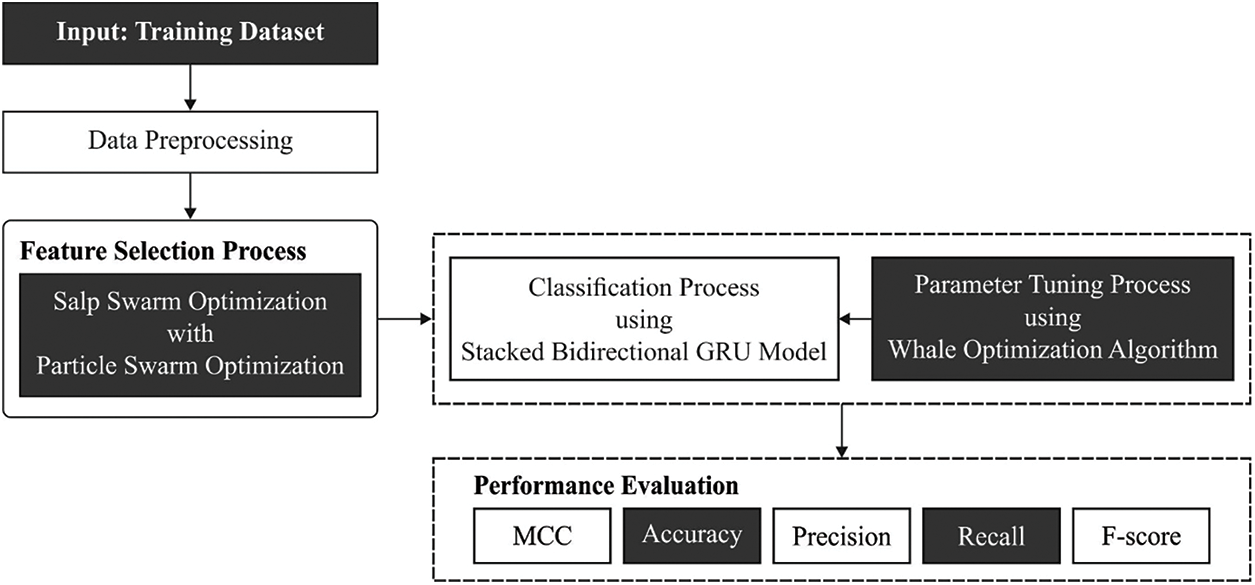
Figure 2: Block diagram of HMFS-SDLCAD technique
2.1 Process Involved in SSOPSO Based FS Model
In this work, the SSOPSO algorithm is employed to choose an optimal subset of features from the preprocessed data. The framework of the presented technique is explained. It is named SSOPSO that integrates the SSO and PSO approaches. The fundamental infrastructure of SSO technique was improved by enhancing the upgrade step of population place. This alteration merges the upgrade process of PSO as to important infrastructure of SSO. This combination adds further flexibility to SSO in exploring the population and makes sure its diversity of it and attains the optimum value rapidly.
In the primary stage, the presented SSOPSO is used for determining the parameter and creating the population that signifies the group of solutions to offered problem (feature selection) [19]. Next, the performance of all the solutions is measured by calculating the fitness function (FF) for everyone and defining the optimum of them. The next stage from the presented SSOPSO technique is for updating the existing population by utilizing also the SSO or PSO technique that depends upon the quality of FF (evaluated by their probability). When the probability of FF, to the present solution, is superior to 0.5 then SSO, else, the PSO was utilized. Next, the FF to all the solutions was calculated and optimum solution was defined then upgrades the population. The next stage is for checking when the end criteria are fulfilled before returning by optimum solution, then, repeating the preceding stages in calculating the probability to end.
The SSOPSO technique begins with determining the primary value of SSO and PSO techniques, next the SSO creates an arbitrary population X of size N in dimensional D, next SSO computes the food fitness to all the solutions
Thus, only the
whereas
Based on the
2.2 SBiGRU Based Classification
Once the feature subsets are chosen, the next step is to identify the cyberattacks using the SBiGRU model. The SBiGRU is comprised of forwarding and backwarding layers stacked on top of the other. The input dataset is given to the initial forward and backward layers. The output is a sequence of latter forward and backward layers [20]. For time series t, the input series
In the next forward layer, the hidden layer
In the initial backward layer, hidden layer
In the next backward layer, the hidden layer
The output of next forward and backward layers is given in the following:
2.3 WOA Based Hyperparameter Optimization
Finally, the WOA is utilized for optimal hyperparameter optimization process. Mirjalili et al. [21] presented the WOA stimulated by the whale behavior. The foraging behavior is named bubble-net feeding technique. But, in WOA, the existing optimal candidate solution is to set the target prey or closer to the optimal. The other tries to upgrade the location towards the optimal one. Arithmetically, it can be expressed in the following:
whereas t indicates the existing iteration, X denotes the location vector,
whereas r is positioned arbitrarily within
Spiral updating location: This technique estimates the distance among the whale and the prey. A spiral formula is utilized for mimicking the helix-shaped movement:
whereas 1 denotes an arbitrary value within [1,1] and b denotes a constant. A possibility of 50% to choose among the shrinking encircling model or the spiral model. Therefore, the arithmetical method is expressed in the following:
In which p denotes an arbitrary value in a uniform distribution. The exploration stage:
While, in the exploration stage, A has utilized arbitrary value in
In this section, the experimental validation of the HMFS-SDLCAD model is tested using a benchmark dataset, available at https://dataset.litnet.lt/. The dataset holds samples under 12 class labels and 84 features. The proposed model has chosen a set of 47 features. Tab. 1 provides the details related to the dataset.

Fig. 3 indicates the confusion matrix created by the HMFS-SDLCAD model on the classification of cyberattacks under entire dataset. The figure indicated that the HMFS-SDLCAD model has identified all the 12 classes effectively.
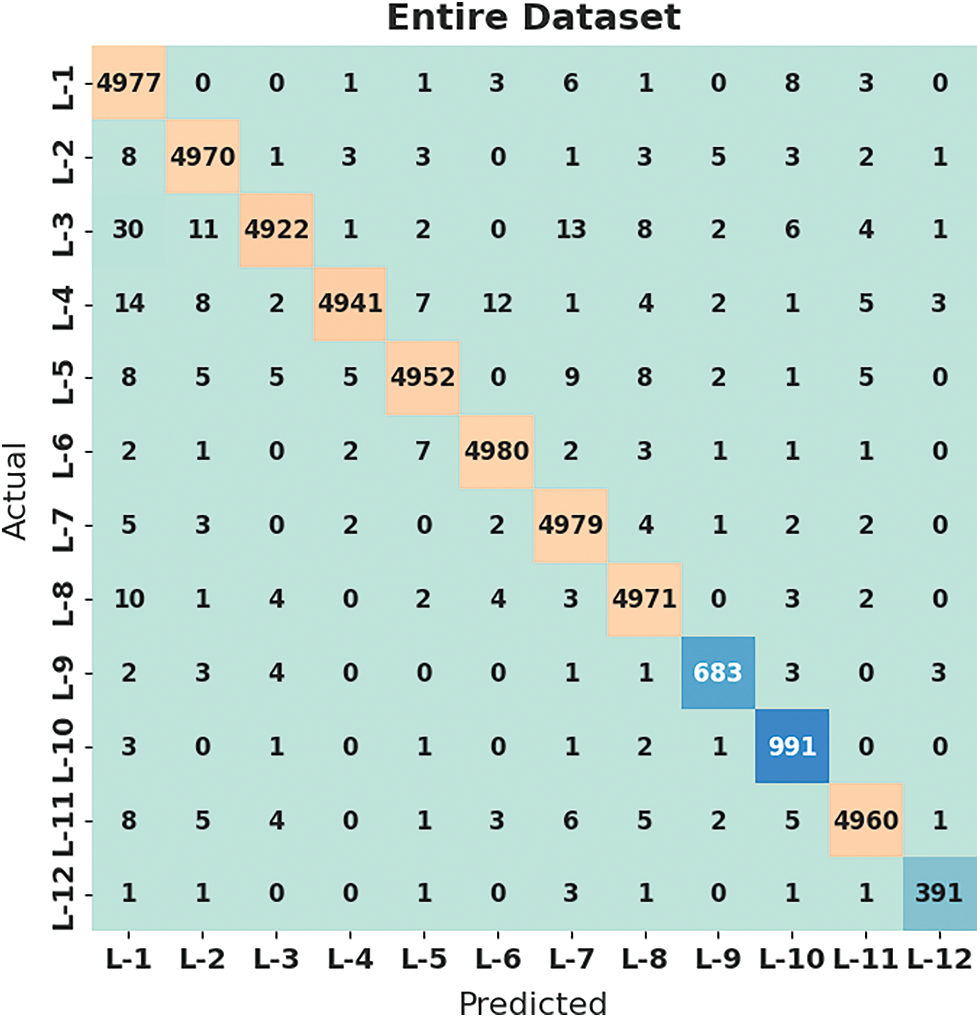
Figure 3: Confusion matrix of HMFS-SDLCAD technique under entire dataset
Tab. 2 and Fig. 4 highlight the overall classification outcomes of the HMFS-SDLCAD model on entire dataset. The experimental values indicated that the HMFS-SDLCAD model has gained maximum classifier results under all class labels. For instance, with label-1, the HMFS-SDLCAD model has offered

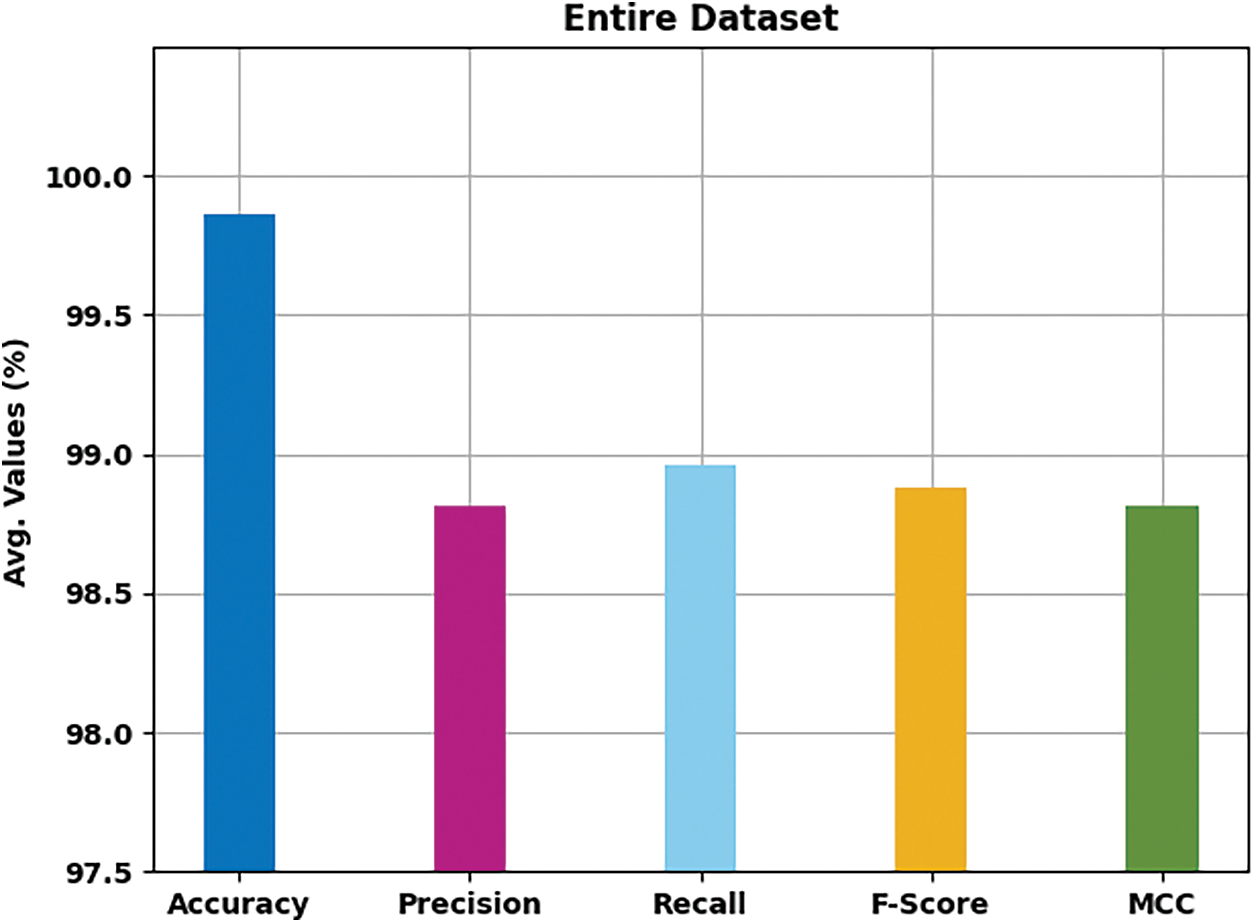
Figure 4: Result analysis of HMFS-SDLCAD technique on entire dataset
Fig. 5 designates the confusion matrix created by the HMFS-SDLCAD approach on the classification of cyberattacks under 70% of training set (TRS) dataset. The figure represented that the HMFS-SDLCAD methodology has identified all the 12 classes effectively.
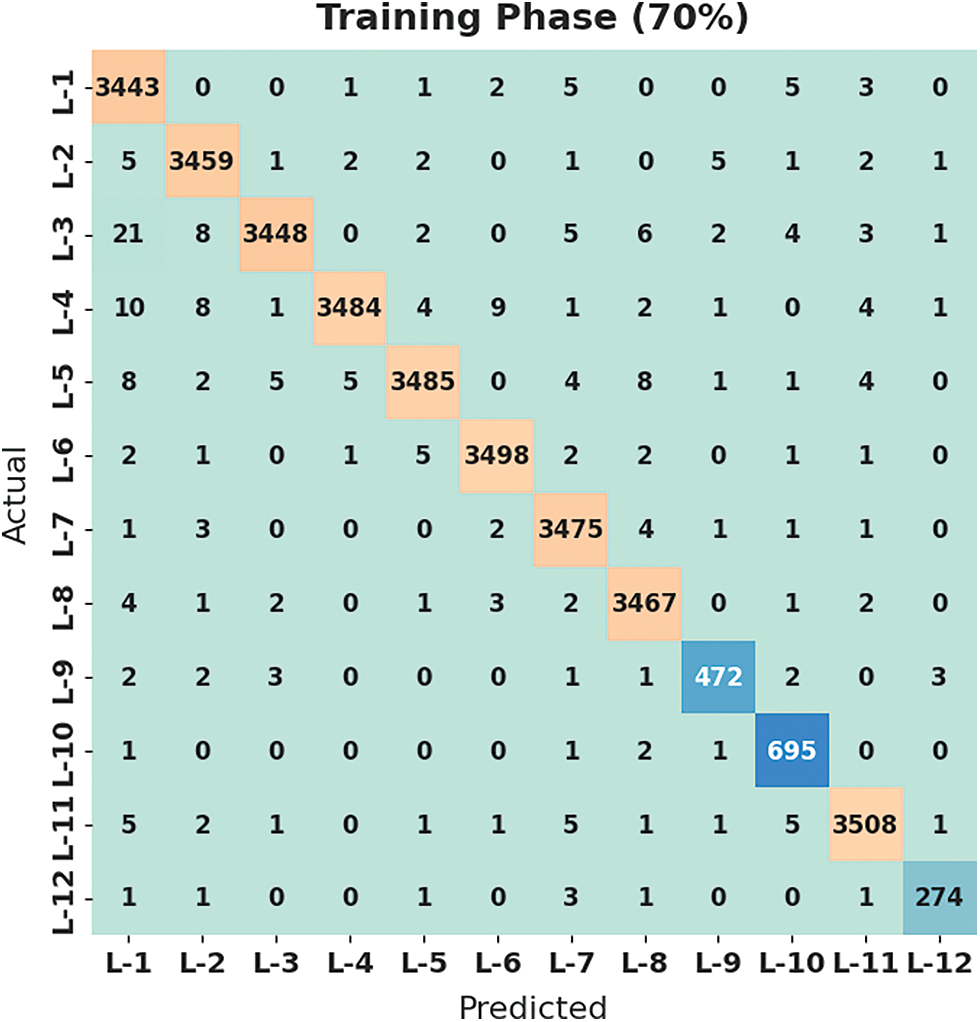
Figure 5: Confusion matrix of HMFS-SDLCAD technique under 70% of TRS dataset
Tab. 3 and Fig. 6 demonstrate the overall classification outcome of the HMFS-SDLCAD technique on 70% of TRS dataset. The experimental values represented that the HMFS-SDLCAD approach has reached maximum classifier results under all class labels. For instance, with label-1, the HMFS-SDLCAD approach has offered

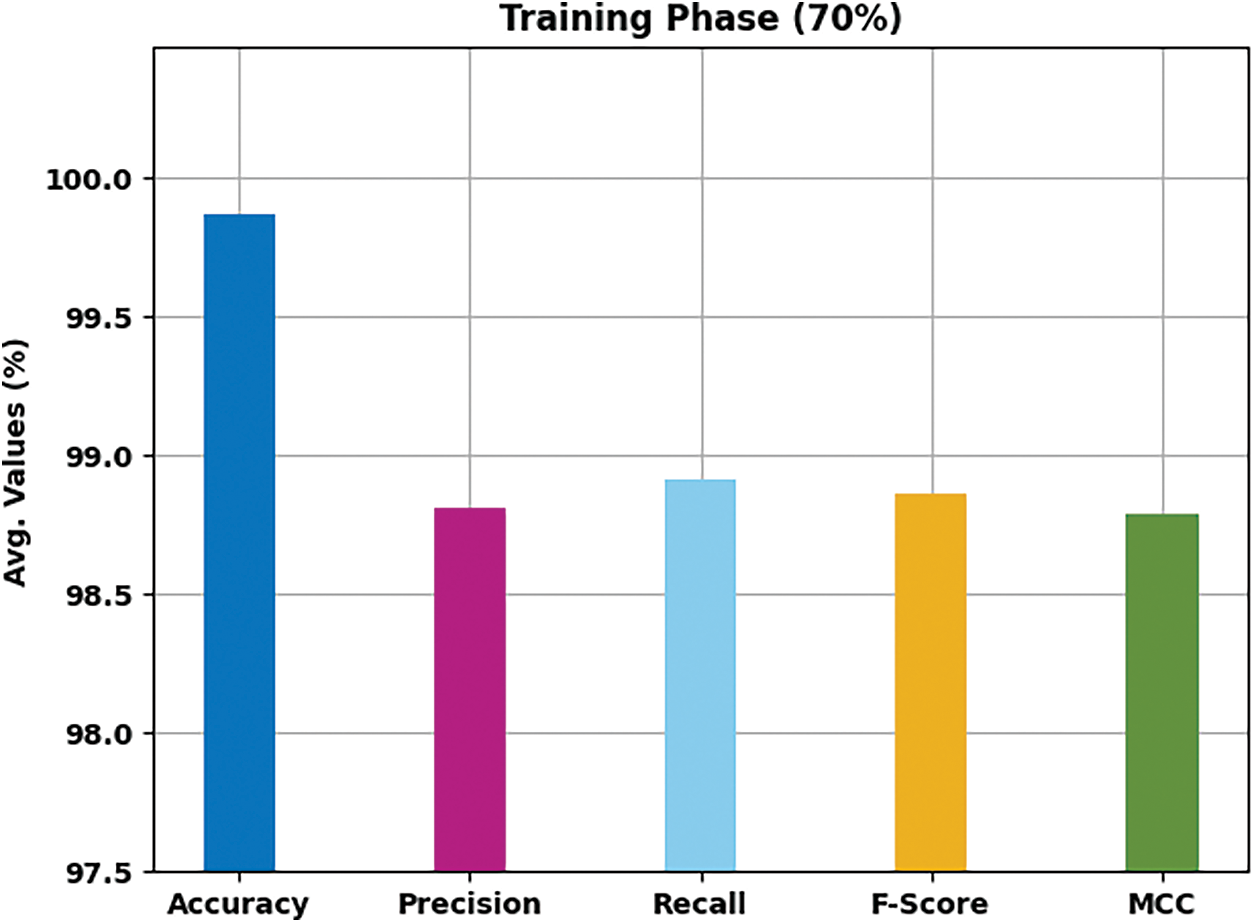
Figure 6: Result analysis of HMFS-SDLCAD technique on 70% of TRS dataset
Fig. 7 demonstrates the confusion matrix created by the HMFS-SDLCAD algorithm on the classification of cyberattacks under 30% of testing set (TSS) dataset. The figure outperformed that the HMFS-SDLCAD approach has identified all the 12 classes effectively.
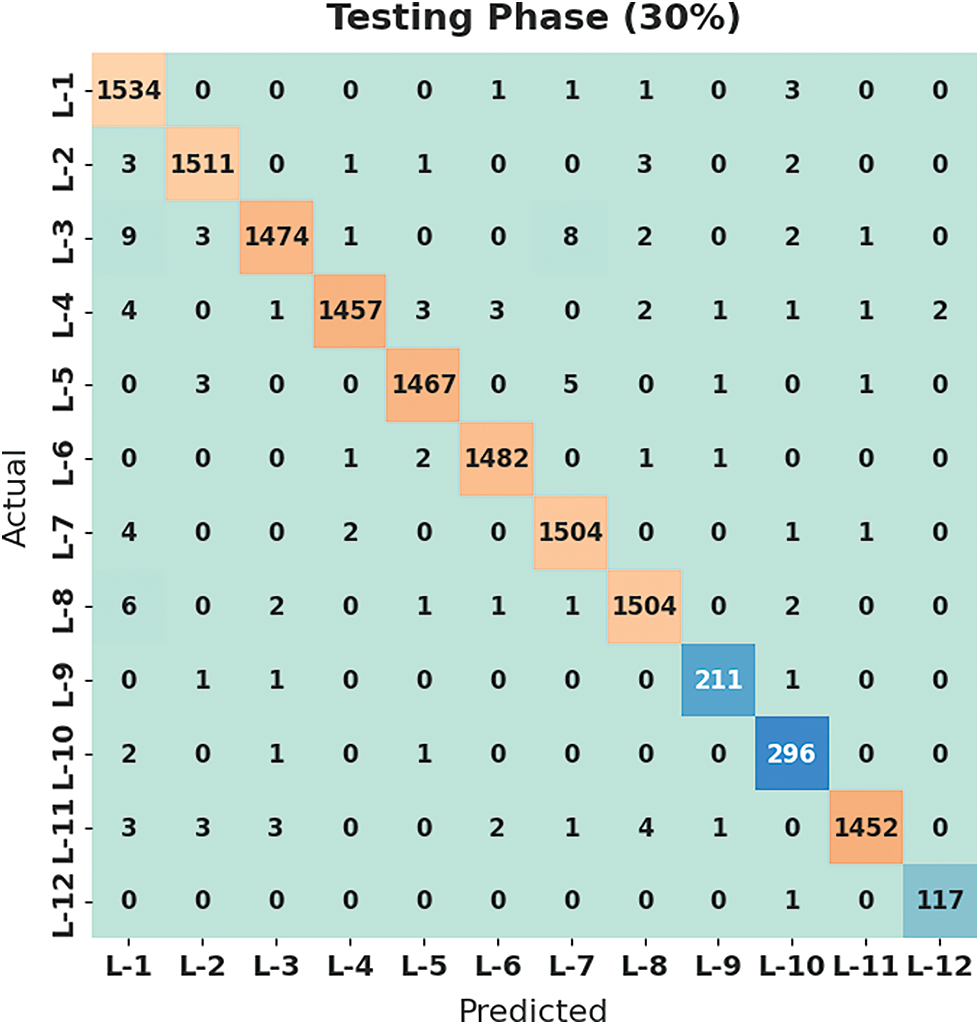
Figure 7: Confusion matrix of HMFS-SDLCAD technique under 30% of TSS dataset
Tab. 4 and Fig. 8 examine the overall classification outcome of the HMFS-SDLCAD technique on 30% of TSS dataset. The experimental values revealed that the HMFS-SDLCAD algorithm has gained maximal classifier results under all class labels. For instance, with label-1, the HMFS-SDLCAD model has offered

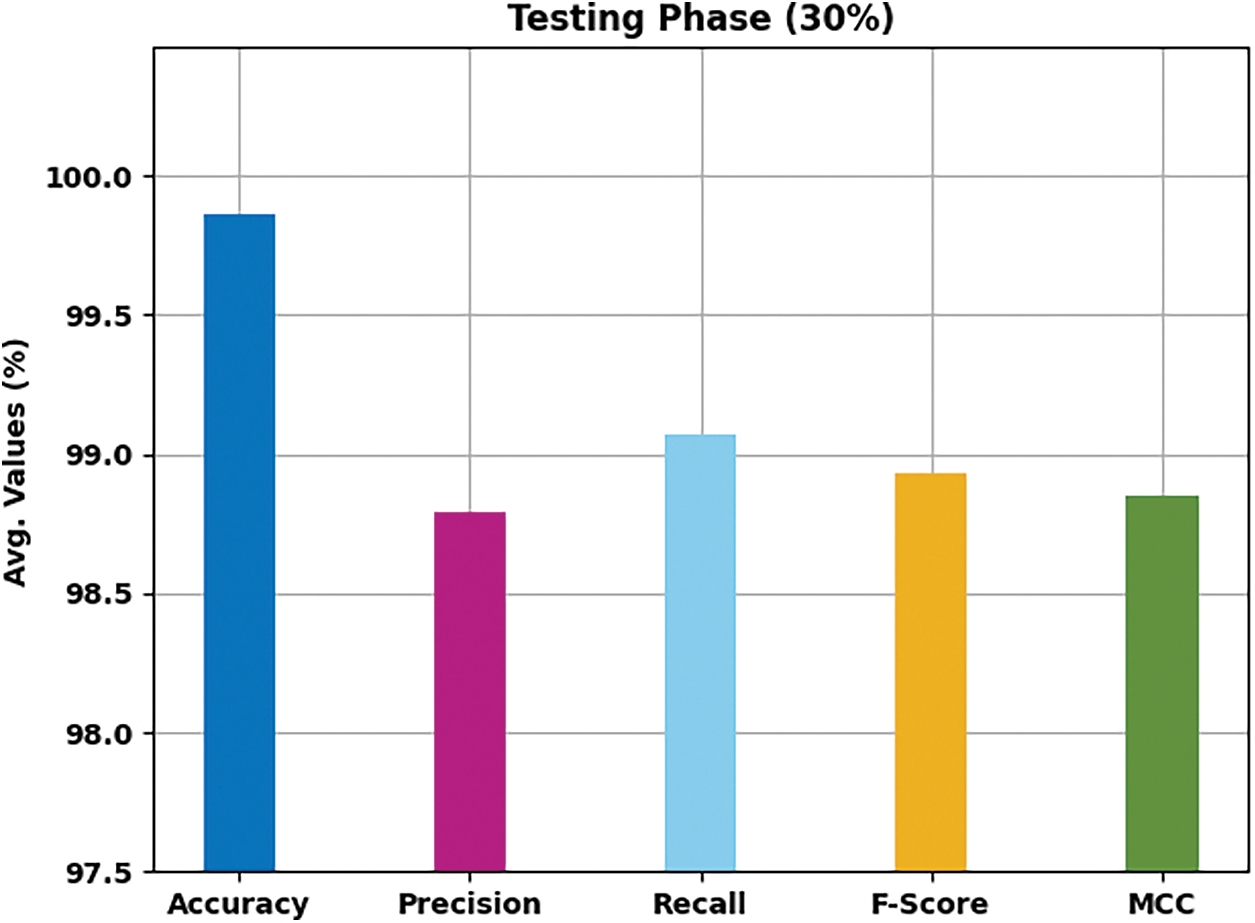
Figure 8: Result analysis of HMFS-SDLCAD technique on 30% of TSS dataset
The training accuracy (TA) and validation accuracy (VA) attained by the HMFS-SDLCAD method on test dataset is demonstrated in Fig. 9. The experimental outcome implied that the HMFS-SDLCAD model has gained maximum values of TA and VA. In specific, the VA seemed that superior to TA.
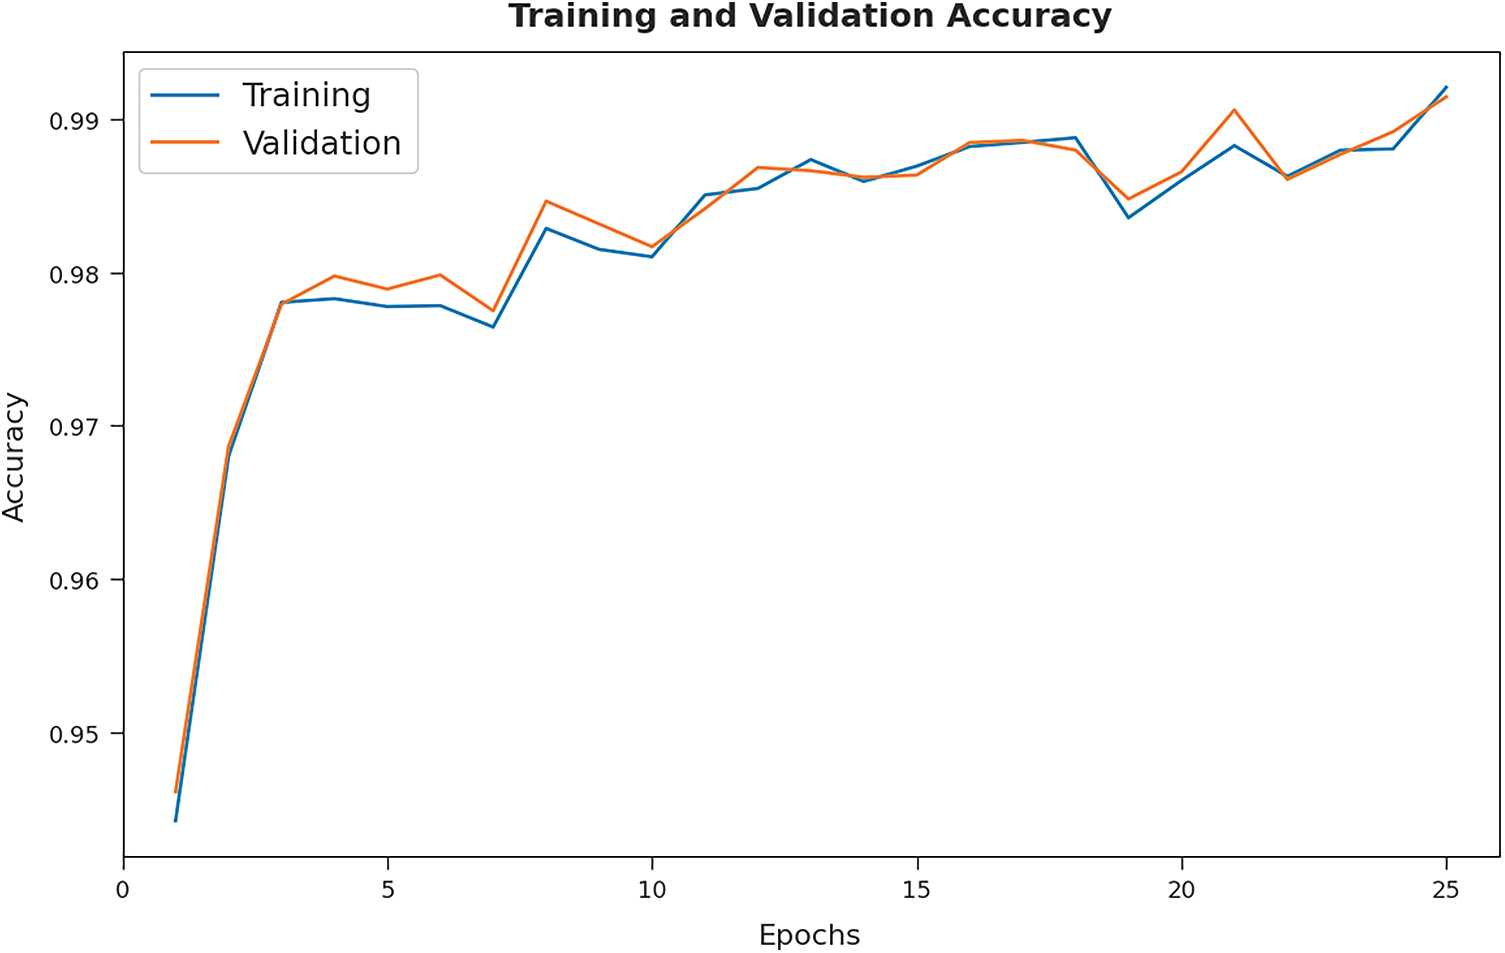
Figure 9: TA and VA analysis of HMFS-SDLCAD technique
The training loss (TL) and validation loss (VL) achieved by the HMFS-SDLCAD system on test dataset are established in Fig. 10. The experimental outcomes inferred that the HMFS-SDLCAD approach has able least values of TL and VL. In specific, the VL appeared to be lower than TL.
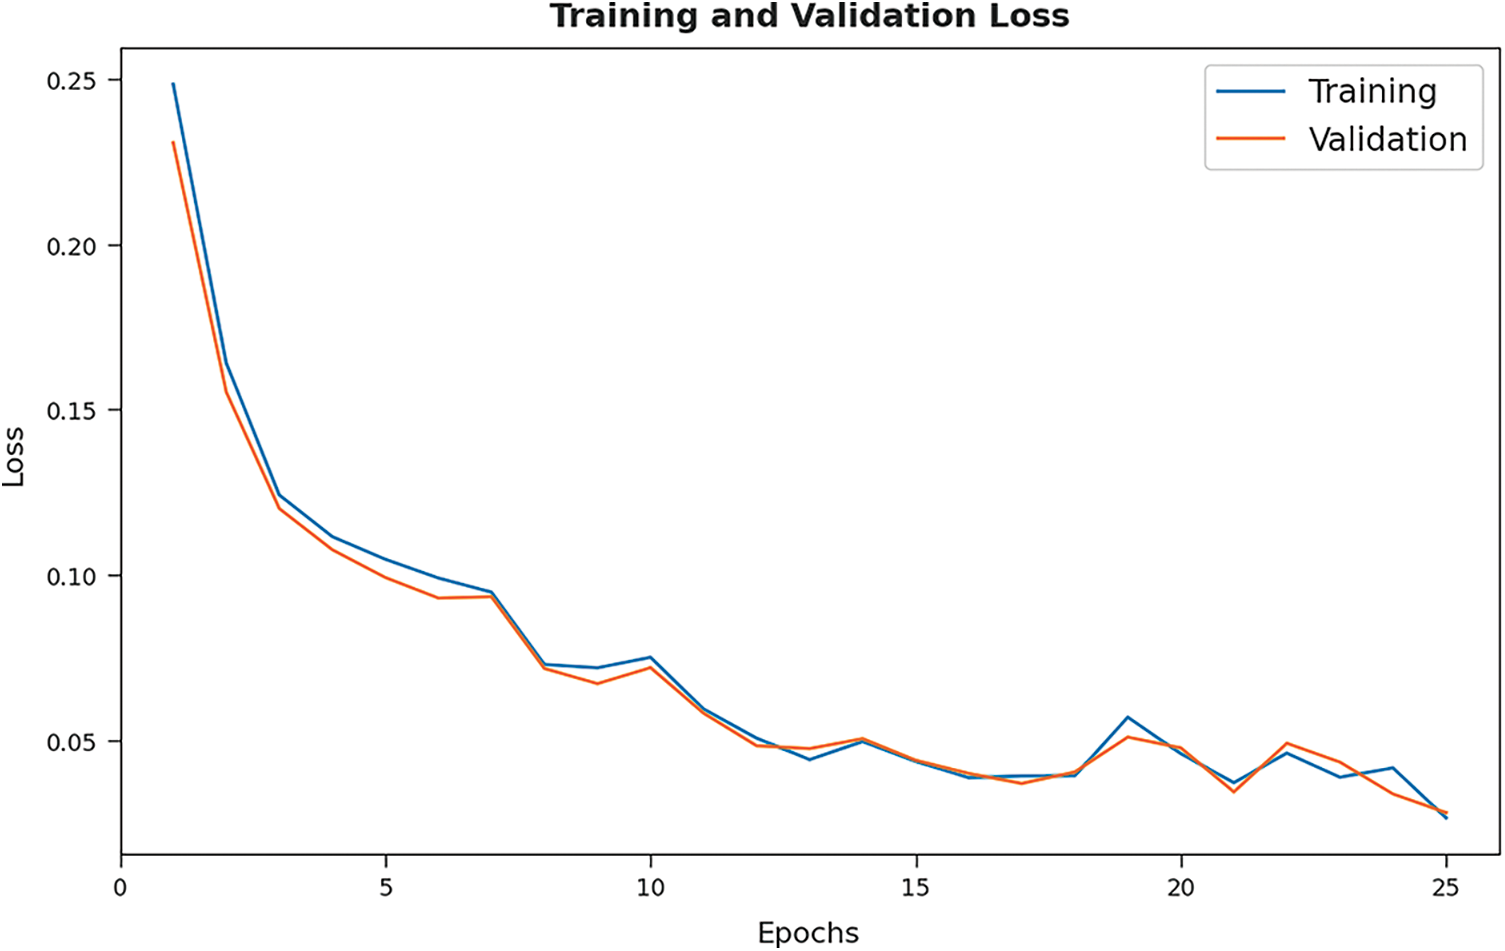
Figure 10: TL and VL analysis of HMFS-SDLCAD technique
A detailed precision-recall examination of the HMFS-SDLCAD approach on test dataset is exhibited in Fig. 11. By observing the figure, it can be noticed that the HMFS-SDLCAD model has accomplished maximal precision-recall performance under all labels.
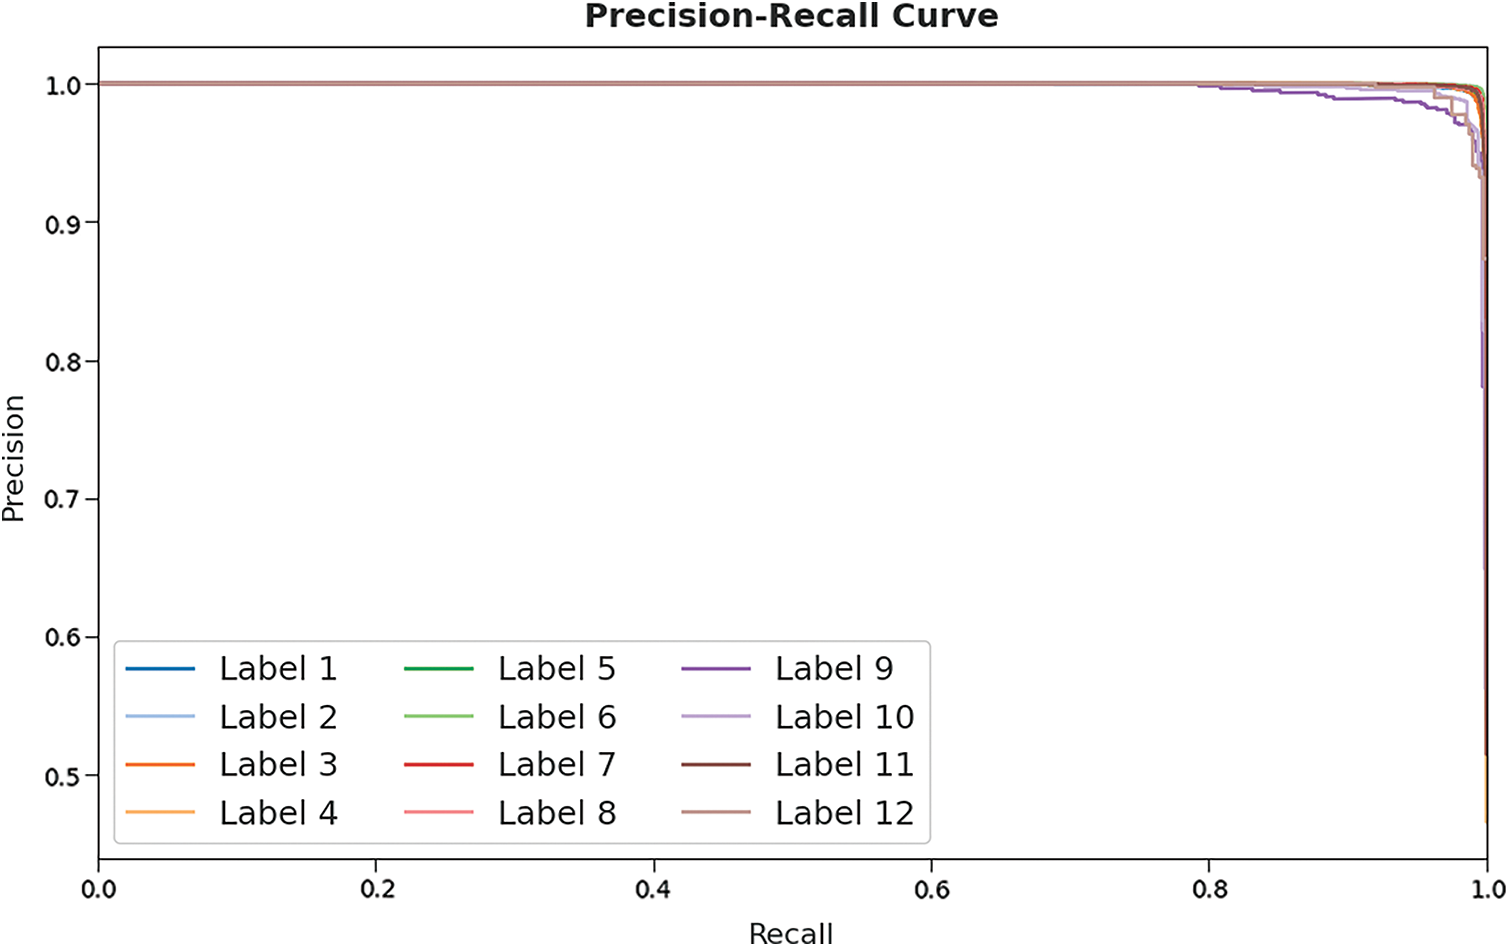
Figure 11: Precision-recall curve analysis of HMFS-SDLCAD technique
Fig. 12 depicts the comparative
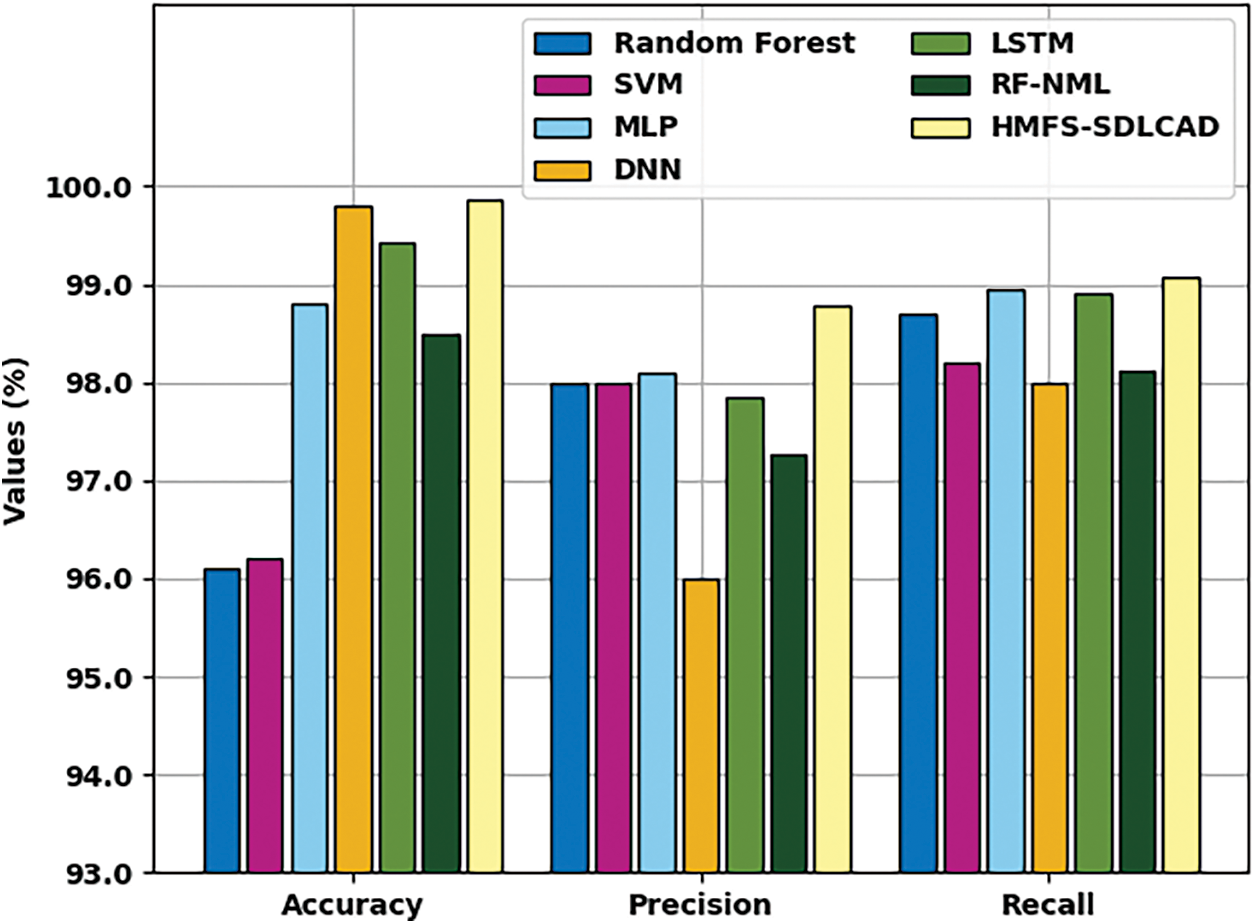
Figure 12:
Fig. 13 demonstrates a comparative
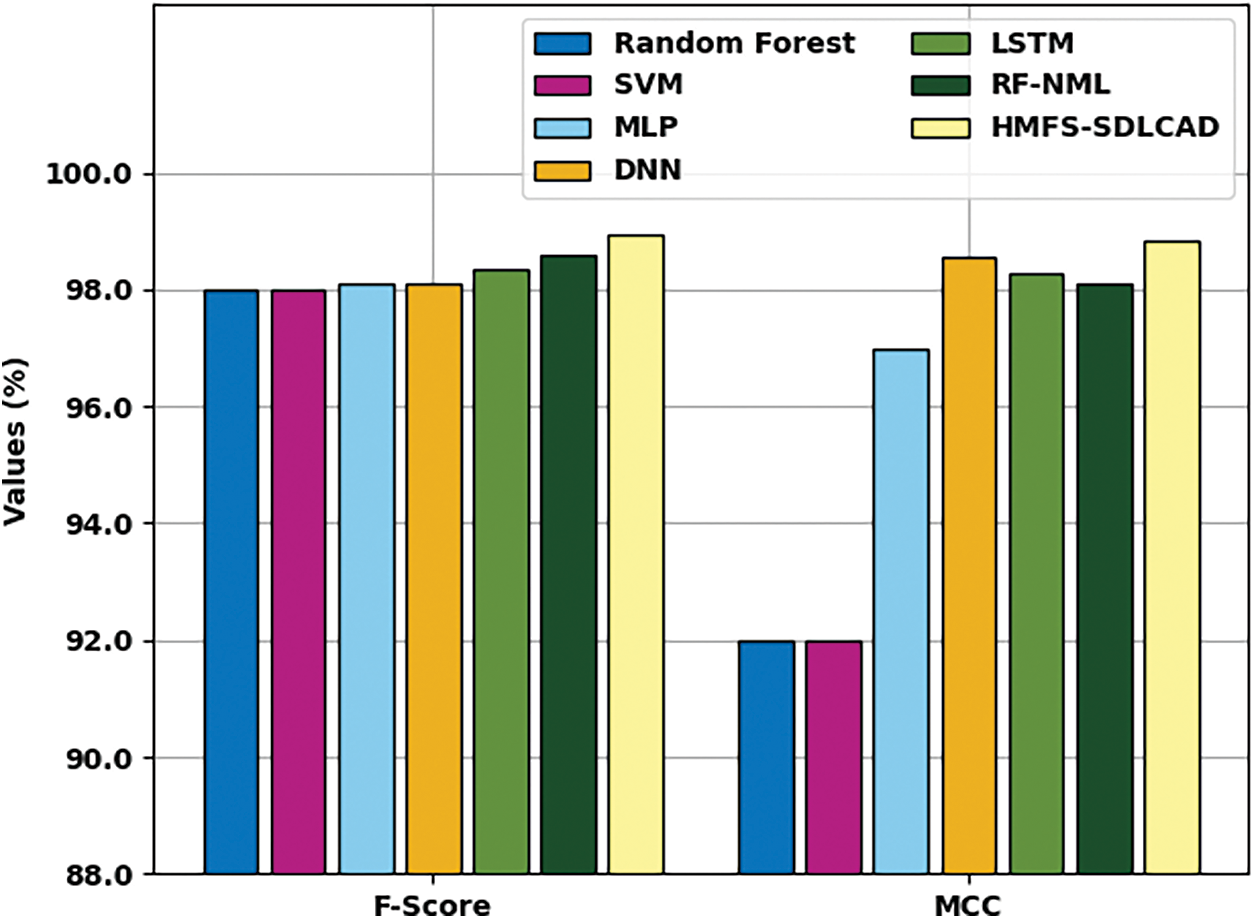
Figure 13:
In this study, a new HMFS-SDLCAD model has been developed to recognize the occurrence of cyberattacks in the IoT environment. At the preliminary stage, data pre-processing is carried out to transform the input data into useful format. Then, the SSOPSO algorithm is utilized to elect features. In addition, the WOA with SBiGRU model is utilized for the identification and classification of cyberattacks. The experimental analysis of the HMFS-SDLCAD model is validated using benchmark dataset and the results are assessed under several aspects. The simulation outcomes pointed out the improvements of the HMFS-SDLCAD model over recent approaches. Thus, the HMFS-SDLCAD model can be employed for effectual identification of cyberattacks in the IoT environment. In future, feature reduction and outlier removal approaches can be included to enhance the classifier outcomes.
Funding Statement: The authors extend their appreciation to the Deanship of Scientific Research at King Khalid University for funding this work through Large Groups Project under grant number (45/43). Princess Nourah bint Abdulrahman University Researchers Supporting Project number (PNURSP2022R140), Princess Nourah bint Abdulrahman University, Riyadh, Saudi Arabia. The authors would like to thank the Deanship of Scientific Research at Umm Al-Qura University for supporting this work by Grant Code: (22UQU4310373DSR16).
Conflicts of Interest: The authors declare that they have no conflicts of interest to report regarding the present study.
References
1. I. Ullah and Q. H. Mahmoud, “Design and development of a deep learning-based model for anomaly detection in IoT networks,” IEEE Access, vol. 9, pp. 103906–103926, 2021. [Google Scholar]
2. M. Wazid, A. K. Das, V. Bhat K and A. V. Vasilakos, “LAM-CIoT: Lightweight authentication mechanism in cloud-based IoT environment,” Journal of Network and Computer Applications, vol. 150, pp. 102496, 2020. [Google Scholar]
3. X. Gao, C. Shan, C. Hu, Z. Niu and Z. Liu, “An adaptive ensemble machine learning model for intrusion detection,” IEEE Access, vol. 7, pp. 82512–82521, 2019. [Google Scholar]
4. S. Sapre, P. Ahmadi and K. Islam, “A robust comparison of the kddcup99 and nsl-kdd iot network intrusion detection datasets through various machine learning algorithms,” arXiv preprint, arXiv:1912.13204, 2019. [Google Scholar]
5. S. U. Jan, S. Ahmed, V. Shakhov and I. Koo, “Toward a lightweight intrusion detection system for the internet of things,” IEEE Access, vol. 7, pp. 42450–42471, 2019. [Google Scholar]
6. O. Brun, Y. Yin and E. Gelenbe, “Deep learning with dense random neural network for detecting attacks against iot-connected home environments,” Procedia Computer Science, vol. 134, pp. 458–463, 2018. [Google Scholar]
7. R. Damasevicius, A. Venckauskas, S. Grigaliunas, J. Toldinas, N. Morkevicius et al., “LITNET- 2020: “An annotated real-world network flow dataset for network intrusion detection,” Electronics, vol. 9, no. 5, pp. 800, 2020. [Google Scholar]
8. S. Garg, K. Kaur, N. Kumar, G. Kaddoum, A. Y. Zomaya et al., “A hybrid deep learning-based model for anomaly detection in cloud datacenter networks,” IEEE Transactions on Network and Service Management, vol. 16, no. 3, pp. 924–935, 2019. [Google Scholar]
9. M. Pawlicki, M. Choraś and R. Kozik, “Defending network intrusion detection systems against adversarial evasion attacks,” Future Generation Computer Systems, vol. 110, pp. 148–154, 2020. [Google Scholar]
10. D. Tiwari, B. S. Bhati, B. Nagpal, S. Sankhwar and F. Al-Turjman, “An enhanced intelligent model: To protect marine IoT sensor environment using ensemble machine learning approach,” Ocean Engineering, vol. 242, pp. 110180, 2021. [Google Scholar]
11. M. Panda, A. A. A. Mousa and A. E. HaSSOnien, “Developing an efficient feature engineering and machine learning model for detecting iot-botnet cyber attacks,” IEEE Access, vol. 9, pp. 91038–91052, 2021. [Google Scholar]
12. Q. A. A. Haija, “Top-down machine learning-based architecture for cyberattacks identification and classification in iot communication networks,” Frontiers in Big Data, vol. 4, pp. 782902, 2022. [Google Scholar]
13. Z. E. Huma, S. Latif, J. Ahmad, Z. Idrees, A. Ibrar et al., “A hybrid deep random neural network for cyberattack detection in the industrial internet of things,” IEEE Access, vol. 9, pp. 55595–55605, 2021. [Google Scholar]
14. N. Amma, “A vector convolutional deep autonomous learning classifier for detection of cyber attacks,” Cluster Computing, 2022, https://doi.org/10.1007/s10586-022-03577-4. [Google Scholar]
15. P. An, Z. Wang and C. Zhang, “Ensemble unsupervised autoencoders and Gaussian mixture model for cyberattack detection,” Information Processing & Management, vol. 59, no. 2, pp. 102844, 2022. [Google Scholar]
16. M. A. Hamza, S. B. Haj Hassine, I. Abunadi, F. N. Al-Wesabi, H. Alsolai et al., “Feature selection with optimal stacked sparse autoencoder for data mining,” Computers,” Materials & Continua, vol. 72, no. 2, pp. 2581–2596, 2022. [Google Scholar]
17. A. A. Albraikan, S. B. Haj Hassine, S. M. Fati, F. N. Al-Wesabi, A. M. Hilal et al., “Optimal deep learning-based cyberattack detection and classification technique on social networks,” Computers, Materials & Continua, vol. 72, no. 1, pp. 907–923, 2022. [Google Scholar]
18. A. M. Hilal, J. S. Alzahrani, I. Abunadi, N. Nemri, F. N. Al-Wesabi et al., “Intelligent deep learning model for privacy preserving IIoT on 6 g environment,” Computers, Materials & Continua, vol. 72, no. 1, pp. 333–348, 2022. [Google Scholar]
19. R. A. Ibrahim, A. A. Ewees, D. Oliva, M. A. Elaziz and S. Lu, “Improved salp swarm algorithm based on particle swarm optimization for feature selection,” Journal of Ambient Intelligence and Humanized Computing, vol. 10, no. 8, pp. 3155–3169, 2019. [Google Scholar]
20. A. A. Wazrah and S. Alhumoud, “Sentiment analysis using stacked gated recurrent unit for arabic tweets,” IEEE Access, vol. 9, pp. 137176–137187, 2021. [Google Scholar]
21. S. Mirjalili and A. Lewis, “The whale optimization algorithm,” Advances in Engineering Software, vol. 95, pp. 51–67, 2015. [Google Scholar]
22. V. Dutta, M. Choraś, M. Pawlicki and R. Kozik, “A deep learning ensemble for network anomaly and cyber-attack detection,” Sensors, vol. 20, no. 16, pp. 4583, 2020. [Google Scholar]
23. T. Gopalakrishnan, D. Ruby, F. A. Turjman, D. Gupta, I. V. Pustokhina et al., “Deep learning enabled data offloading with cyber attack detection model in mobile edge computing systems,” IEEE Access, vol. 8, pp. 185938–185949, 2020. [Google Scholar]
24. M. H. Saracevic, S. Z. Adamović, V. A. Miškovic, M. Elhoseny, N. D. Maček et al., “Data encryption for internet of things applications based on Catalan objects and two combinatorial structures,” IEEE Transactions on Reliability, vol. 70, no. 2, pp. 819–830, 2021. [Google Scholar]
Cite This Article
 Copyright © 2023 The Author(s). Published by Tech Science Press.
This work is licensed under a Creative Commons Attribution 4.0 International License , which permits unrestricted use, distribution, and reproduction in any medium, provided the original work is properly cited.


 Submit a Paper
 Propose a Special lssue
 View Full Text
 Download PDF
 Downloads
 Citation Tools