
 Submit a Paper
 Propose a Special lssue
 Open Access
ARTICLE

Large Scale Fish Images Classification and Localization using Transfer Learning and Localization Aware CNN Architecture
1 Bahria University, Islamabad, 45550, Pakistan
2 COMSATS University Islamabad, Islamabad, 45550, Pakistan
3 University of Central Punjab, Lahore, 54000, Pakistan
4 College of Computing, Khon Kaen University, Khon Kaen, 40000, Thailand
5 COMSATS University Islamabad, Vehari, 61170, Pakistan
6 Department of Computer Science, College of Computer and Information Sciences, Majmaah University, Al-Majmaah, 11952, Saudi Arabia
7 Department of Mathematics, College of Science Al-Zulfi, Majmaah University, Al-Majmaah, 11952, Saudi Arabia
8 Department of Computer Engineering, College of Computer and Information Sciences, Majmaah University, Al-Majmaah, 11952, Saudi Arabia
* Corresponding Author: Mohd Anul Haq. Email:
Computer Systems Science and Engineering 2023, 45(2), 2125-2140. https://doi.org/10.32604/csse.2023.031008
Received 08 April 2022; Accepted 25 May 2022; Issue published 03 November 2022
 View Full Text
 Download PDF
Abstract
Building an automatic fish recognition and detection system for large-scale fish classes is helpful for marine researchers and marine scientists because there are large numbers of fish species. However, it is quite difficult to build such systems owing to the lack of data imbalance problems and large number of classes. To solve these issues, we propose a transfer learning-based technique in which we use Efficient-Net, which is pre-trained on ImageNet dataset and fine-tuned on QuT Fish Database, which is a large scale dataset. Furthermore, prior to the activation layer, we use Global Average Pooling (GAP) instead of dense layer with the aim of averaging the results of predictions along with having more information compared to the dense layer. To check the validity of our model, we validate our model on the validation set which achieves satisfactory results. Also, for the localization task, we propose an architecture that consists of localization aware block, which captures localization information for better prediction and residual connections to handle the over-fitting problem. Actually, the residual connections help the layer to combine missing information with the relevant one. In addition, we use class weights and Focal Loss (FL) to handle class imbalance problems along with reducing false predictions. Actually, class weights assign less weights to classes having fewer instances and large weights to classes having more number of instances. During the localization, the qualitative assessment shows that we achieve 57% Mean Intersection Over Union (IoU) on testing data, and the classification results show 75% precision, 70% recall, 78% accuracy and 74% F1-Score for 468 fish species.Keywords
In marine life, marine ecology is a scientific study of marine habitats and life, which involves the interaction of marine organisms with other organisms and the environment. In order to get insights about the marine Eco-system, it is important to monitor the behavior of marine organisms, such as fishes, in order to get the information about the health of marine Ecosystem distribution along with counting different species of fishes. These insights can be used as key parameters to monitor environmental changes in the marine system. Also, the deeper knowledge can be obtained about marine species as a whole by tracing their trends during their regular activities along with their movements, which can also be achieved with the help of visual classification [1]. Automatic systems can be used to study the behavior of fish species by obtaining visual data from multiple locations, which can be used for the visual classification of several species along with pattern recognition [2].
Actually, there are many methods for the identification and classification of fish species. In the past, researchers were considering structural, color and texture features to identify and classify fish species. With the evolution of wirless [3–7] and electronic technologies [8,9], several automated methods were developed to visualize and identify fish species and place them in various classes. In these methods, it was easy to identify and extract information from the images having simple white and black background, but recognizing the fish species was challenging for underwater conditions [10].
Recently, deep learning is widely being used to various applications. Actually, deep learning is the area of machine learning based on the working of Artificial Neural Networks (ANN) [11,12], which mimics the communication systems of nodes within the brain in biological systems. It consists of multiple layers to extract features at different levels. Initial layers extract high-level features from input, whereas proceeding layers extract low level and middle-level features. For example, in the case of image processing, the first layer extract shapes like human faces or objects, while lower layers’ extract edges and corners [13].
One of the main benefits of deep learning is its ability to automatically extract features and discriminating ability especially in Convolutional Neural Networks (CNN) which extract features from images with the help of learn-able kernel weights to save the pre-processing hand-crafted features extraction time [14,15]. An input layer, output layer and hidden layers are the main components of the CNN. Moreover, in CNN, fully connected layers, pooling layers and convolution layers are combined to form hidden layers. In fact, CNN is a type of multi-layer perceptron, which are fully connected networks. The major advantage of CNN over traditional machine learning techniques is the independence from the human effort in terms of feature designing and prior knowledge.
Moreover, ImageNet is an annual challenge that consists of 15 million images with over 22,000 categories. The winners of this challenge had been using classical image processing and machine learning-based techniques till 2012, but in 2012, techniques, such as Alexnet, ResNet, and GoogleNet, etc., which are deep learning-based architecture, significantly reduced the error rates, and it was considered a breakthrough in the field of computer vision and machine learning. In terms of architectures, they consist of five convolution layers and three fully connected layers [16]. Recently, in most computer vision applications tasks, techniques such as segmentation, classification, localization etc., are also widely adopted. In [17–24], the authors discuss the recent work on image processing using transfer functions.
In this paper, we propose transfer learning based approach for the classification of large scale fish species and the Localization-aware CNN architecture for localization. Contrary to the existing researchers, our data set consists of 3950 fish images. As the localization of such images is a challenging task because these images are not taken in any controlled environment, the pictures are divided into three categories: in-situ, outside and controlled environment. Also, we resolved the problems of class imbalance by using class weights and focal loss function. For training the network, we used focal loss, which is an extension of cross-entropy for large-scale classification, and class weights equally assigned weights to all the labels. For the Localization problem, we proposed a CNN based architecture which consisted of location aware block that captured the context and location features, which helped in localization. During the localization, the qualitative assessment shows that we achieve 57% Mean Intersection Over Union (IoU) on testing data, and the classification results show 75% precision, 70% recall, 78% accuracy and 74% F1-Score for 468 fish species.
The novelties and main contributions of this research are summarized as follows:
• Handling the imbalance classification of fish species.
• Transfer learning based approach for the classification of large scale dataset.
• Proposed localization aware architecture for the localization of fish species.
• Perform various experiments to validate our proposed methodology.
The rest of the paper is structured as follows: In Section 2, related work is discussed, and in Section 3, we discuss the proposed methodology. The results are discussed in Section 4, and we conclude the research in Section 5.
For the implementation of marine Eco study, Eco-system observation, fish counting and fish classification, researchers have been proposing various models, classifiers and algorithms since 1990s. Moreover, with the advancement of computer hardware, computational power and electronics, researchers experience favorable conditions to implement sophisticated and complicated models compared to the researchers in the past.
In [25], the authors have proposed a neural network fish species recognition system. Actually, several features are measured to recognize fishes. Actually, the authors use various parameters such as higher learning rate to reduce the training time along with increasing the recognition rate. The simulation results show that more than 95% fishes are correctly recognized by using the proposed system.
In [26], the authors test the models on two real-world marine animal data sets and results come out to be satisfactory. In the first step of the proposed methodology, various fish species are detected and tracked by using combined and trained models. Also, several features are detected and some extracted particular features are carried out in the next step. In the third step, based on these extracted features, the fishes are classified depending on their different features.
In [27], the authors use a reject option in classification to detect and remove untrained classes or to filter less confident decisions of no classes. Also, for the fish recognition, a hierarchical method based on a novel rejection system is also proposed. Actually, the samples from new classes are tested by a prob test, and a Gaussian Model Model (GMM) is used to evaluate the posterior probability of testing samples. From different parts of the fish body, several features, such as texture properties and shape, are considered in the study and from which 26 dimensions of features are selected with the help Support Vector Machine (SVM) and Forward sequential (FS) feature selection techniques. In [28], the authors use the discriminant analysis and Kernal Grassmallian distances for the recognition of faces from image sets. Instead of image vectors, they use subject-specific sub-spaces for the detection and recognition with the help of non-linearity parameters.
In [29], the authors propose a methodology based on the migration monitoring system by using an automated fish species classification. Also, from 9 targeted species, 22 images were recorded. To form a close curve for shape analysis, the counter of each image is extracted. Moreover, to remove edge noise and redundant data points, a new shape analysis algorithm is developed. Accurate pattern matching is achieved by comparing the individual counter segment to the curve in the database. In [30], the authors propose a method for automated fish sorting and counting based on the artificial intelligence system. Counting fish by species is performed in this work for surveying and monitoring fishes. Actually, this system is used in underwater environments without the requirement of having any special installations. To acquire the fish silhouettes, an infrared fish silhouette is used, and these silhouettes are processed on a personal computer for the purpose of counting and classification. They created an expandable recognition, modular and robust system with the use of these specialized classifiers of different types.
In [31], the authors propose a fish classification mechanism to overcome several problems associated with fish recognition and classification, such as segmentation error, noise, distortion and occlusion. To resolve these challenges, they propose several techniques such as neural network, K-Mean clustering and K-Nearest Neighbor (KNN). They also studied SVM based techniques for the elimination of these limitations to improve the recognition and classification of underwater bodies such as fishes. This proposed method is based on shape features of fishes. Among the collected images, they prepare two data sets containing 76 fishes as a training set and 74 fishes as a testing set. The simulation results show 78.59% accuracy by using the SVM based technique.
In [32], the authors use photographic images for the recognition of fish species. Also, to extract the texture morphology and geometry of the images, various image processing tools are integrated in the automatic classification system, and the pattern recognition is carried out by using artificial neural networks. They achieve accuracy up to 91.65%. In [33], the authors propose a system of recognizing fish images based on computer. This system, which is also called fish and texture-based Fish Image Recognition System (FIRS), uses 30 fish species for the experiment. Out of these species, 600 images are used for training, whereas 300 fish images are considered for testing. All the 30 species and their images are recognized with the precision of up to 81.67% for the Educational Data Mining (EDM) technique and 99% for the ANN technique.
In [34], the authors use a deep convolutional activation feature for the general visual recognition by comparing the efficiency of relying on various network levels. In [35], to check the presence of some particular fish species, artificial neural network (ANN) and Discriminant Factorial Analysis (DFA) methods are used. Firstly, the models are trained by using the images of these particular fishes. Over 60% detection accuracy is achieved by (ANN) models and over 80% detection accuracy is achieved by (DFA) analysis.
In [36], a proposed model by modifying standard Alexnet architecture is proposed. Their proposed architecture is simple and achieves good results, but they perform experiments on only 6 classes along with selecting the classes having maximum number of instances. In [37], a transfer learning and Squeeze and Excitation (SE) based approach is used for the fish classification task in. They used QUT and CROATIAN fish datasets. These datasets consist of low-quality images. Their proposed methods used image reconstruction to rebuild the images to high quality and then data augmentation is performed as the number of images are less for the classification task. First, they used a transfer learning approach to fine-train the model on the pre-trained fish dataset and SE blocks to extract fine-grained information. They achieved 58.56% validation accuracy on QUT fish datasets.
In [38], the authors use a feature points based technique is used by including 129 species having 2580 images. They classify images having complicated background and regions. The extracted different Local Binary Patterns (LBP), Gray Level Co-occurrence Matrix (GLCM) and geometric features are further given to Bag of Visual Words (BoVW) model to classify the species. The proposed methodology achieves competitive performance, and they use different combination of features for results. They achieve the highest accuracy of 93%. Similarly, in [39], a Transfer learning-based approach using pre-trained AlexNet with modification, which is called as FishNet is used. They use only 3 types of fishes by achieving 99.63% accuracy. Their method is quite straight forward having no complications, but they experiment on only three classes, which is very less [39].
Our proposed method does not use any super-resolution of image processing based technique. Instead, it only fine-tunes on pre-trained efficient-net on ImageNet dataset. Moreover, our approach to handle class imbalance problem by using class weights and focal-loss function outperforms methods having the same number of classes along with giving good assessment results. As the dataset is of low quality and contains a different type of abnormalities, it shows satisfactory results on validation dataset with the Mean IoU of 57%, which is quite good. The classification approach achieves 78% validation accuracy, which is quite good compared to other systems.
The Fig. 1 shows the system model of the whole methodology. Initially, the input fish images are read and pre-processed. The pre-processing stage includes the resizing of all images with the aim of having the same size and normalization. For normalization, we use Z-Score normalization, and it is defined as:
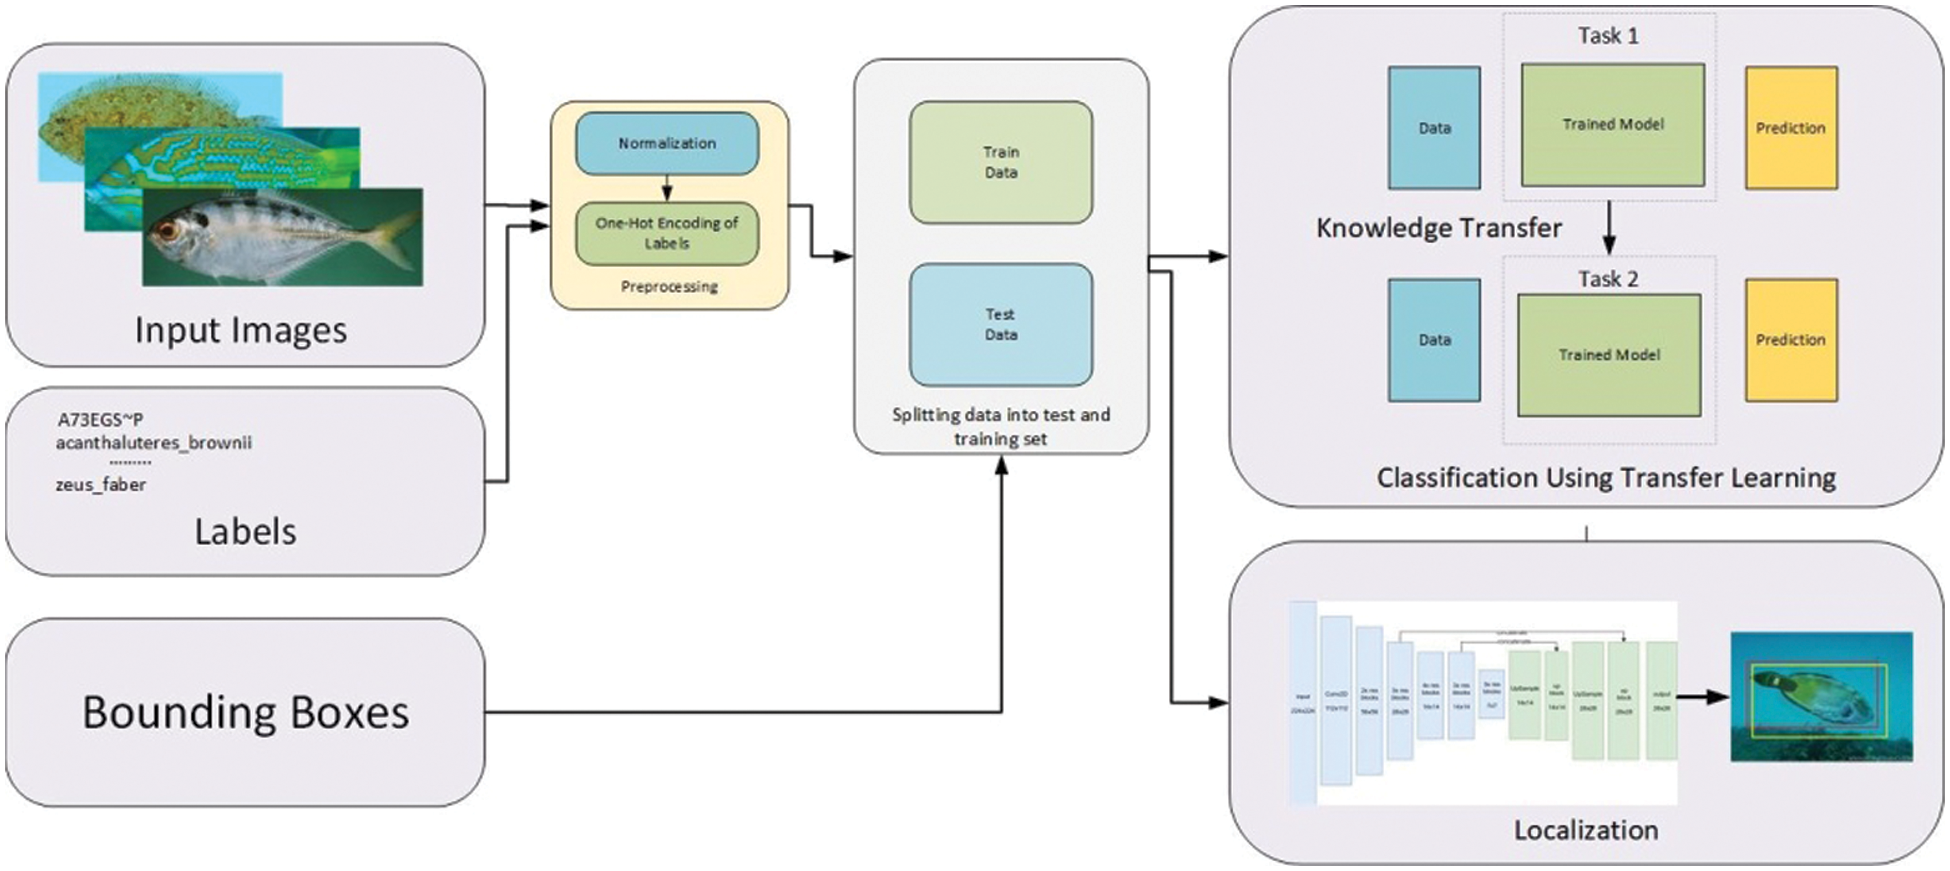
Figure 1: System model
Moreover, the labels are also converted to one-hot representation. In one-hot encoding, the label is converted from categorical with the aim of having a better prediction for the Machine Learning algorithm. The categorical values represent the numerical values. In the second step, the data is split into training and testing sets, where the train set is used to train the model and test set is used to validate the model performance. The data is then passed to the localization and classification tasks. In the localization task, the bounding boxes and images are passed to the model for the localization task.
For the classification task, we use transfer learning because the numbers of images are less, and fine-tuning our data set on pre-trained image-net model gives better results compared to other models. Moreover, the convolution operation extracts the features by convolving a filter or kernel on the image matrix. It consists of an image matrix of (h × d × c) dimensions, where h, w, c is the height width and channels and a filter.
The fish dataset used in the research work is taken from the QUT fish dataset. It is first used for the comparison among various deep learning structures by using the method entitled local Inter Session Variability (ISV). Actually, local ISV is a classification method, which helps in the extraction of features.
The training and testing is performed on different classes of data. It is impossible to compare 3960 images directly in different environments. Therefore, the images are divided into three categories: “controlled”, “out-of-water” and “in-situ”.The images contained in the “controlled” environment are of several types of fish species taken with a constant background. The images contained in “out-of-the-water” category are captured out of the water without any background changes, and the illumination conditions are also very limited. The images contained in “in situ” category are captured underwater in its natural environment. Furthermore, the QUIT Fish data-set used in this research is challenging in different ways due to some limitations that are faced during the execution of the classification and localization.
The Fig. 2 shows the flow diagram of the proposed methodology by unveiling all the steps involved in the study. In the first stage, the input images are resized to a single scale of 224 × 224 as the size of fish images varies. The images are then normalized between the desired ranges to have a better prediction. The labels of the dataset are also converted to one-hot-encoding to make one-hot vectors. The labels and images are then split into test and train sets along with training the model. Following the training, the predictions are made from the model.
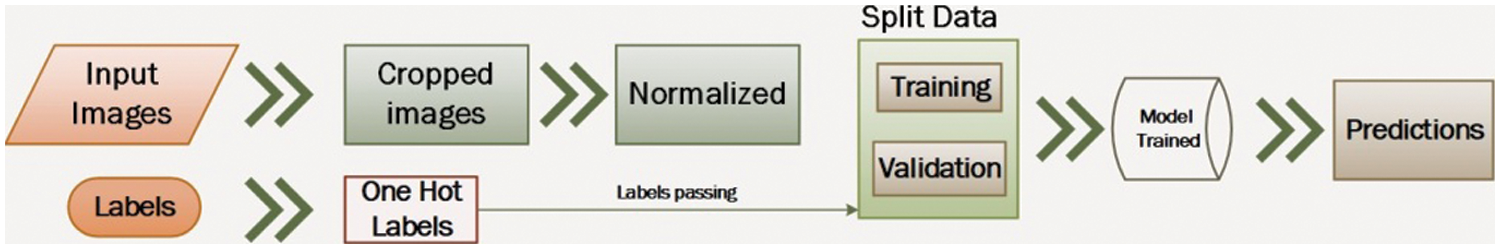
Figure 2: Flow diagram of proposed methodology
The sample number of training and testing data is shown in Tab. 1, and the sample figures from QUT dataset are shown in Fig. 3. This data is challenging in terms of different aspects:
• A class imbalance between different classes. For example, if one class has five fish images, then others have 20 to 30 images.
• Limited amount of data, while deep learning architecture’s require a huge amount of data.
• To solve this issue we have performed the following techniques:
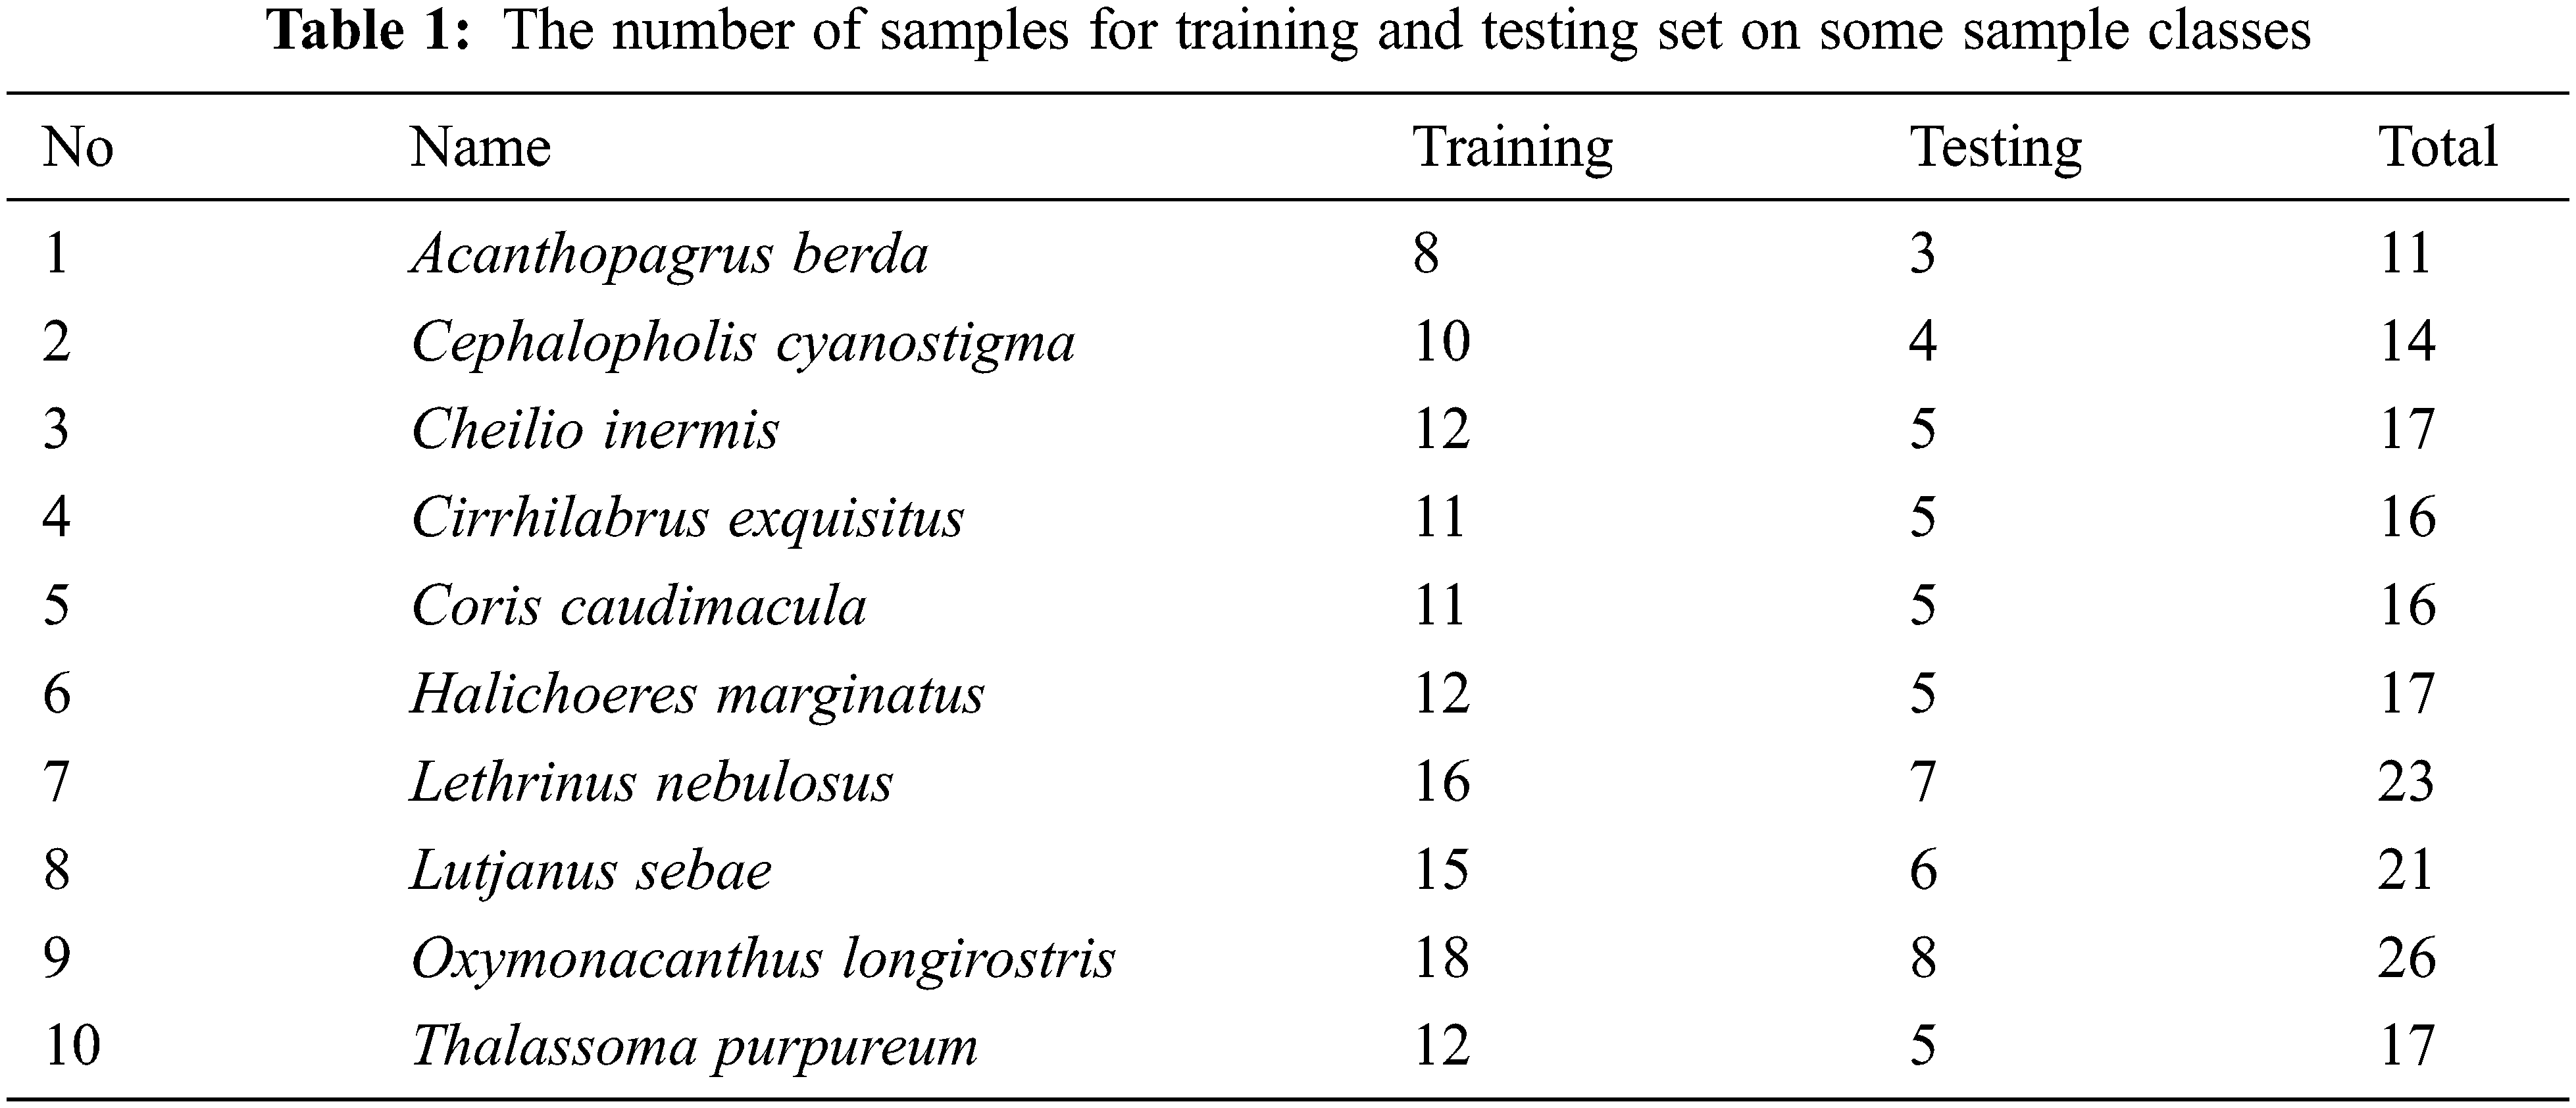
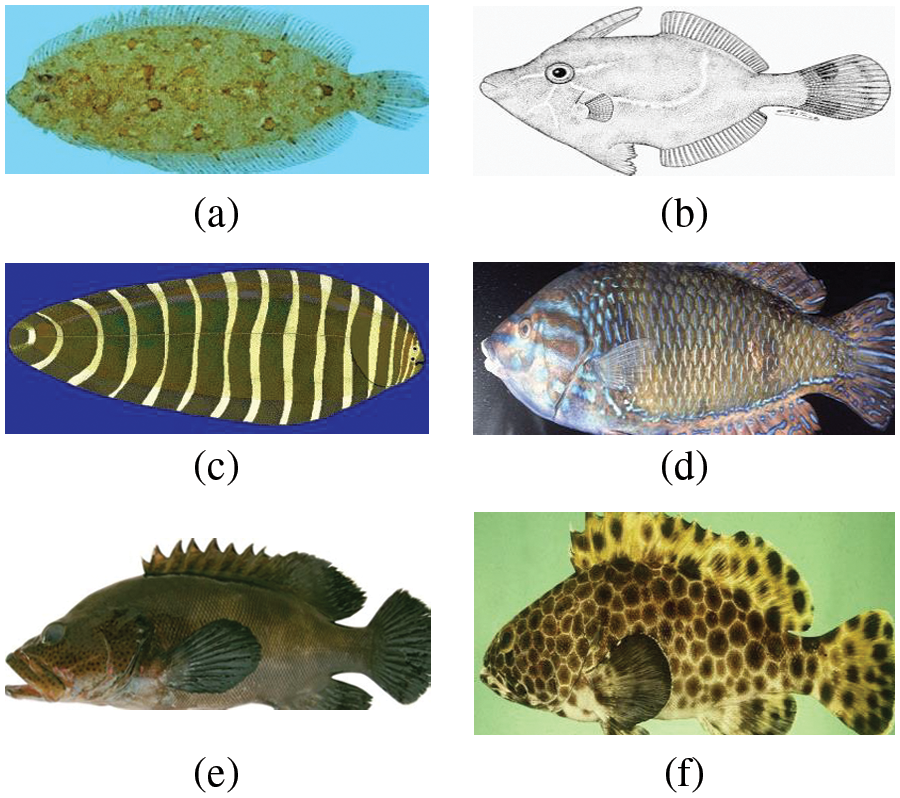
Figure 3: (a-f): Sample images from QUT fish dataset
3.1 Focal Loss for Imbalance Classes
Various loss functions are used to handle different deep learning-based issues, such as class imbalance, boundary refinement and the reduction of False Positives (FP). Actually, focal loss is used in the scenarios where we have extreme imbalance classes [20]. For example, in the case of object detection where the imbalance between foreground and background is 1:500, class imbalance is necessary to handle because it causes:
• Training gets biased as most of the instances contribute less on training, while others contribute more.
• The issues of over-learning which leads to being biased.
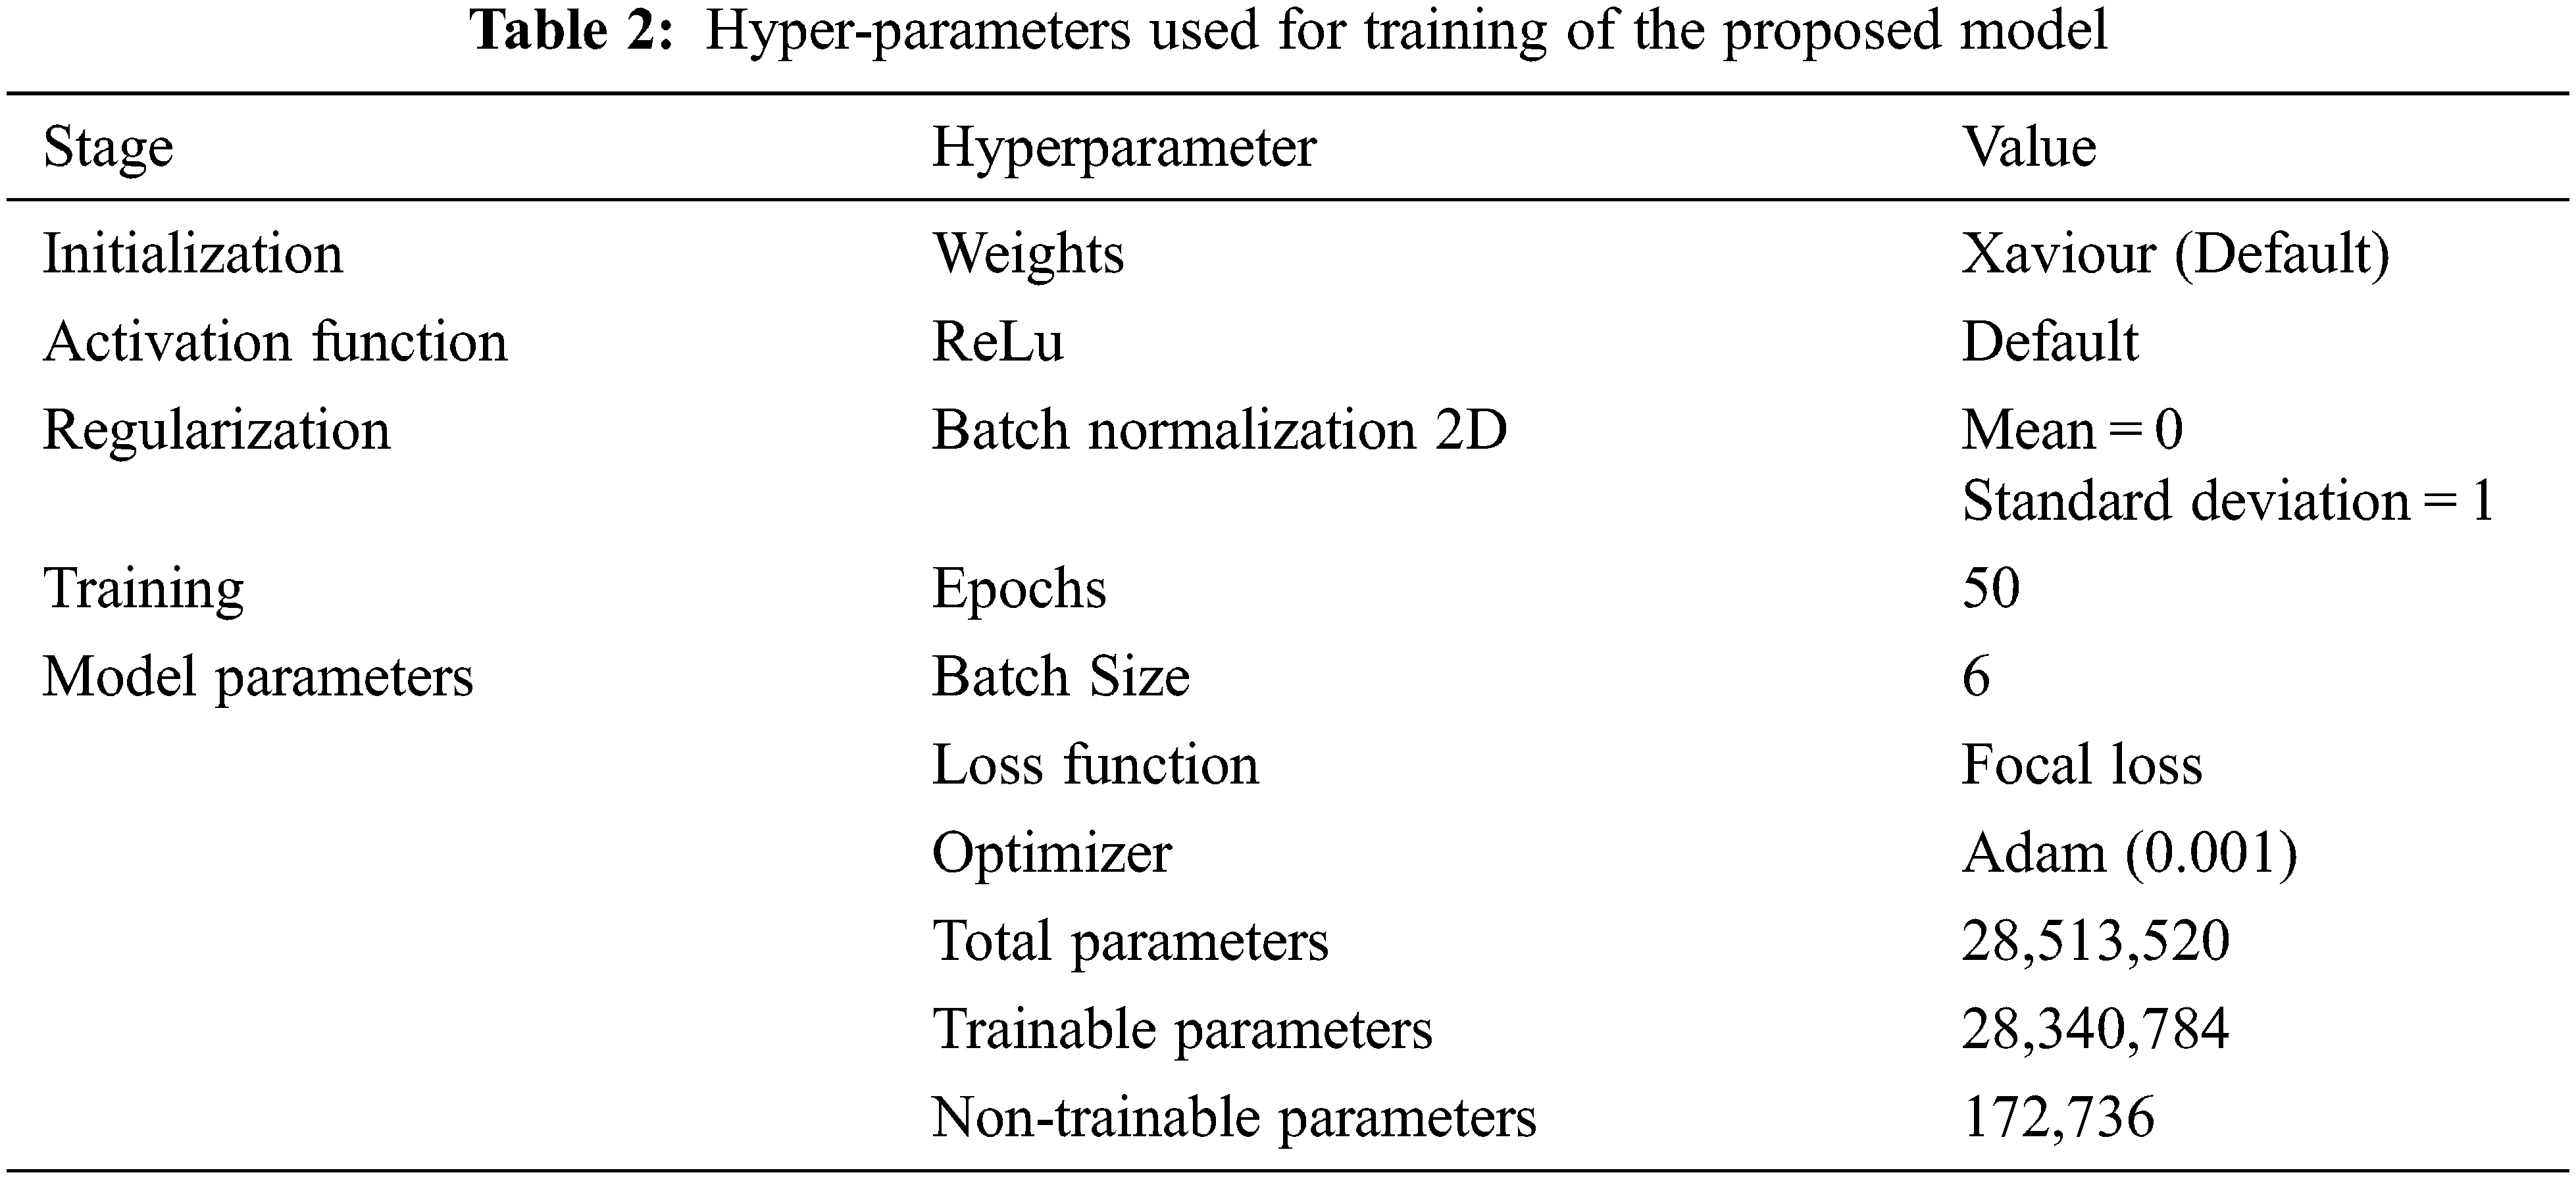
The following setting will be used for training of model training as illustrated in Tab. 2.
3.3 Class Balance Using Weights
Weight balancing is also a technique to handle the class imbalance problem. Sometimes, we want to give some classes more importance than others, as some classes contain fewer instances compared to others, instead of generating more elements for these classes, which is time taking process and requires extra resources.
As we have discussed the problems of having less data in the above mentioned sections, in transfer learning, we can transfer knowledge (Features, weights etc.) from previously trained model to a new model. This saves both time and efforts to train a model from scratch along with tackling the problems of limited data.
As most of the deep learning algorithms based on CNN require more data to generalize well, we need to do data augmentation task to make model being easily converged along with overcoming the problems of limited data, which eventually assists in reducing the over-fitting issue during the training stage. For the augmentation task, we duplicate the images by:
• Randomly shifting images horizontally
• Randomly shift images vertically
• Horizontally flip
• Vertically flip
• Rotating images by 90 degrees
• Adding noise in images
In addition, we use Z-Score normalization in each color channel for red, green and blue channels. Focal loss is a variant of the cross-entropy loss function to handle the class imbalance problem. In our problem domain, we have an imbalance between classes and it gives fewer weights to easy samples and concentrates more on hard samples. Also, y parameter is used to give fewer weights to easy samples. The y is usually from 1 to 5. In our case, we have set y = 1.
Different performance measures are used in this study for the assessment. For the localization task, we use precision, recall, accuracy and f1-score. Accuracy is defined as the measure of finding the predictions in a correct way, and it can be written as:
where
TP = True Positive (Set of examples that belongs to true class and predicted as true)
TN = True Negative (Set of examples that belongs to negative class and predicted as negative)
FP = False Positive (Set of examples that belongs to true class and predicted as negative)
FN = False Negatives (Set of examples that belongs to negative class and predicted as true)
Whereas, for the localization, Mean IoU is used, this tells us how far two regions match with each other. It is defined as:
where A and B are two bounding boxes, A is the actual bounding box and B is the predicted one.
In this section, we have presented the results along with the discussions.
We have used EfficientNet pre-trained on ImageNet for effective training, and fine tuned with Global Average Pooling (GAP) for the effective prediction. In addition, different parameters are adjusted to have a better prediction. The learning of model on different epochs having varying accuracy will lead to a suitable learning rate, which helps to build a good model. Moreover, to improve the model performance, we alter the last layers with fully-connected and global average pooling layers. The GAP layer helps to aggregate global level information, and averaged information contains all the information. It helps the model to decrease the loss along with being converged quickly. The results show that training the model on 50 epochs with a reduced learning rate of 0.001 shows good performance. The Tab. 4 shows the comparison of classification results using various techniques with our proposed architecture. Most of these architectures do not use all classes. In [36], a proposed model by modifying standard Alexnet architecture is proposed. Their proposed architecture is simple and achieves good results, but they perform experiments on only 6 classes along with selecting the classes having maximum number of instances Tab. 3.
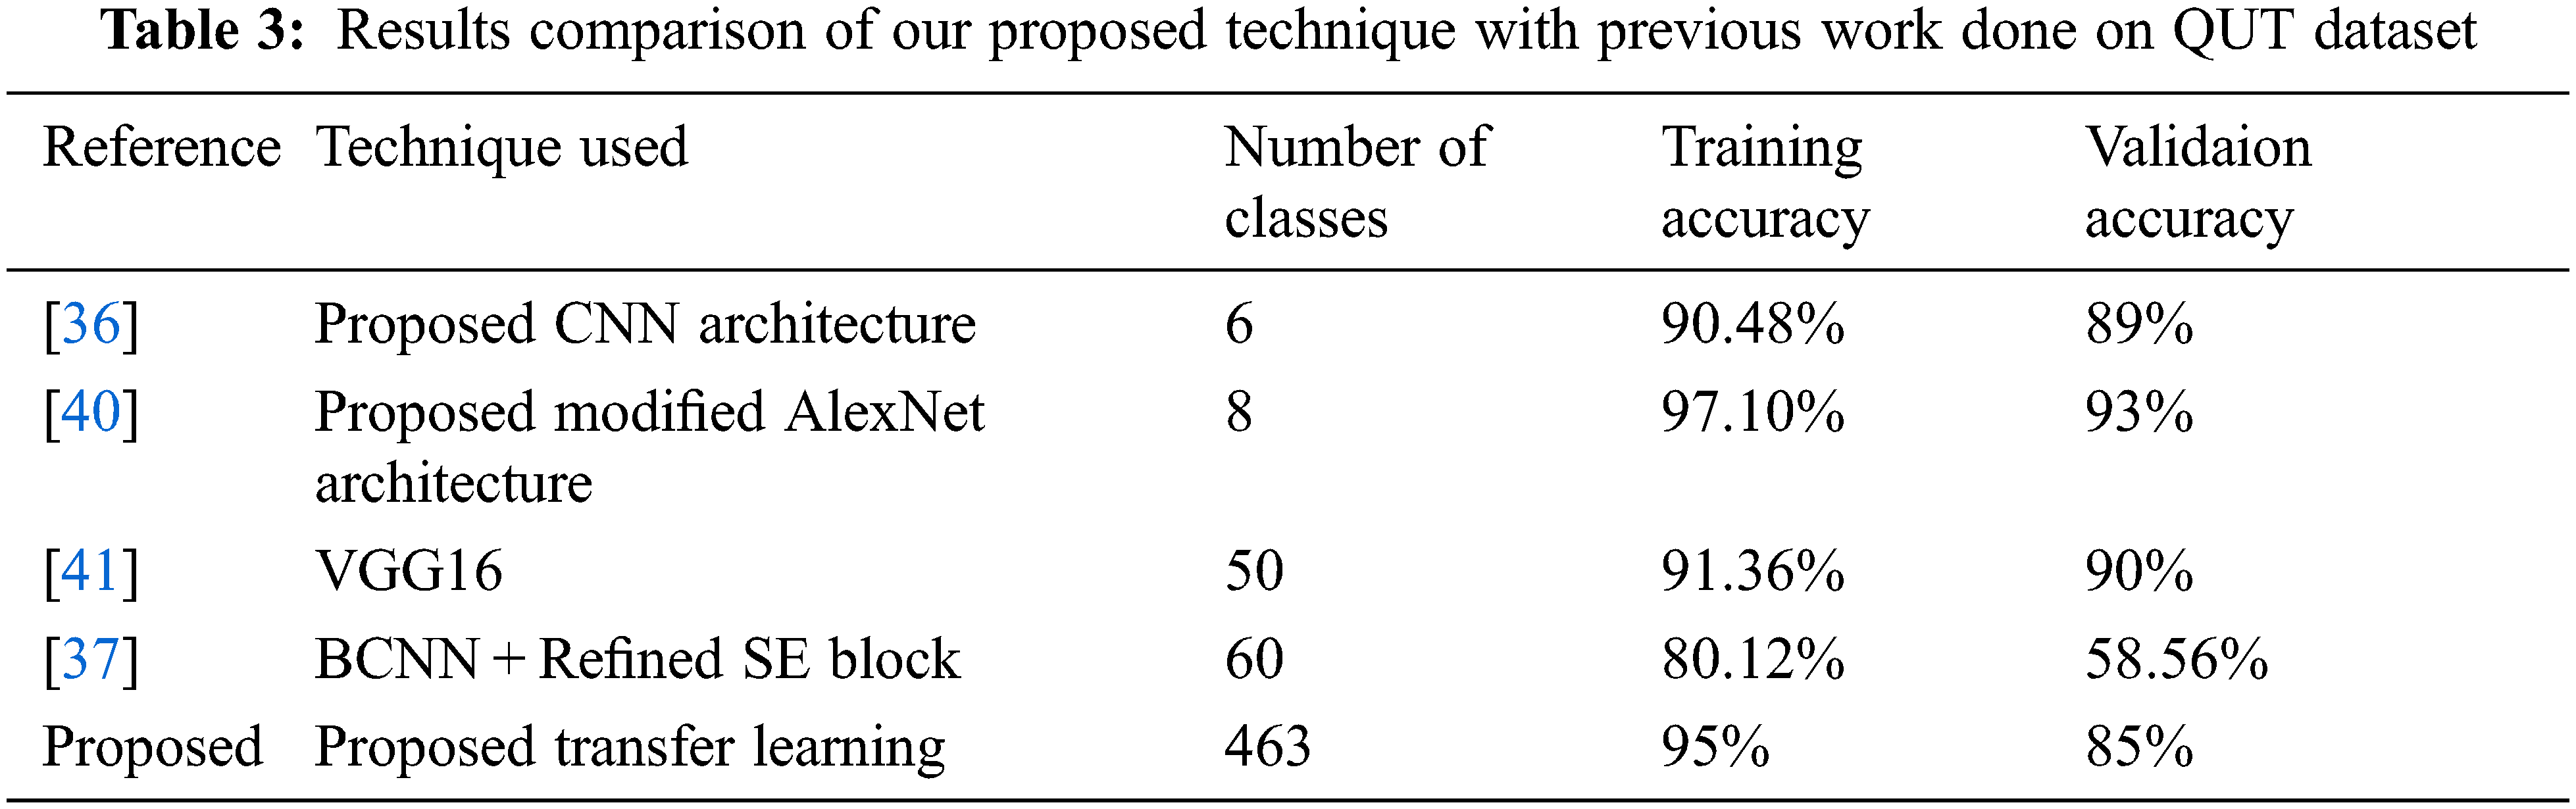
Similarly, in [37], they use VGG16 model and train the network on 50 classes. Also, they achieve training and validation accuracy of 91.36% of training and 90% of validation accuracy. Transfer learning solutions have been also proposed for classification of fish species by [37]. They use 60 classes and achieve 58.56% validation accuracy. Moreover, our proposed technique achieve 78% validation accuracy on all classes Tab. 5
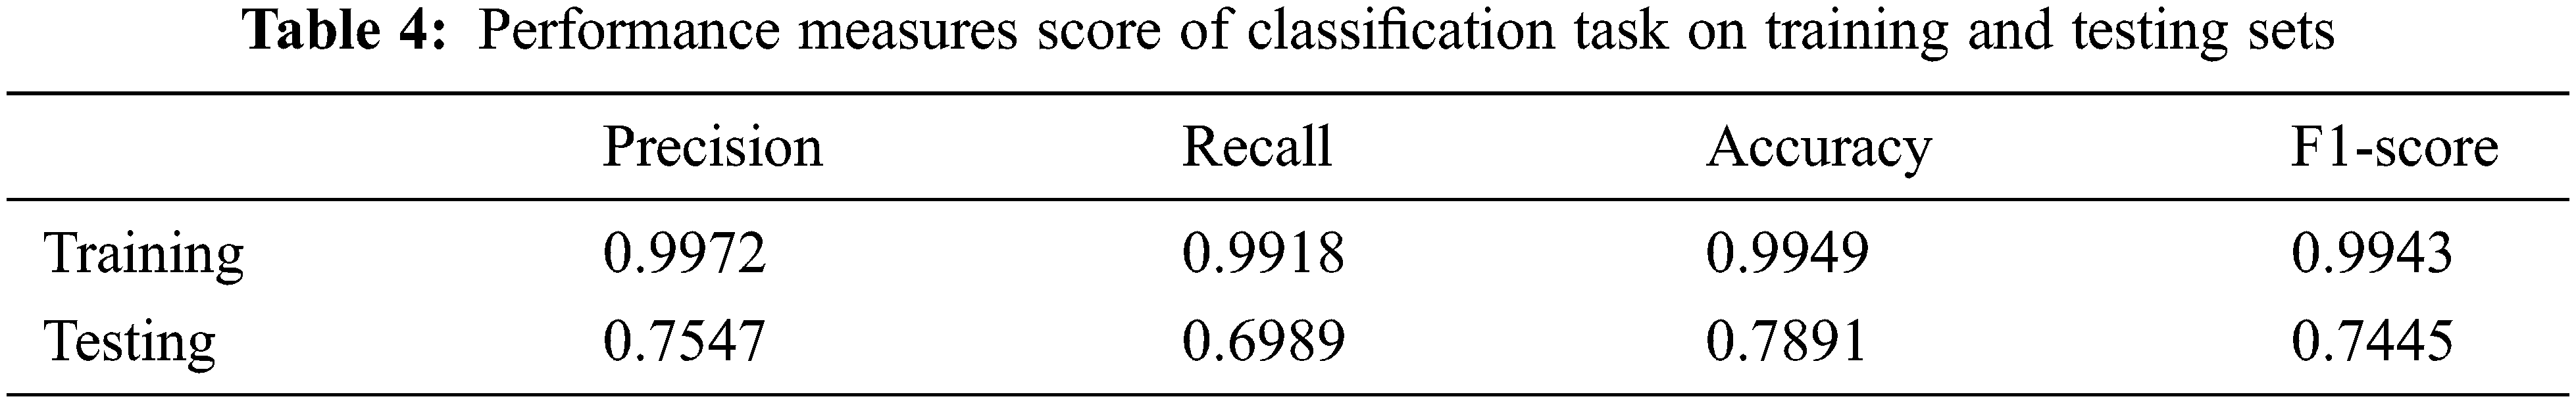
In addition, we train the model on 100 epochs and use patience parameter to stop training until the network stops learning. Our networks achieve 99% precision, 99% recall, 99% accuracy and 99% F1-score on training data and 75% precision, 70% recall, 78% accuracy and 74% F1-score on testing data.
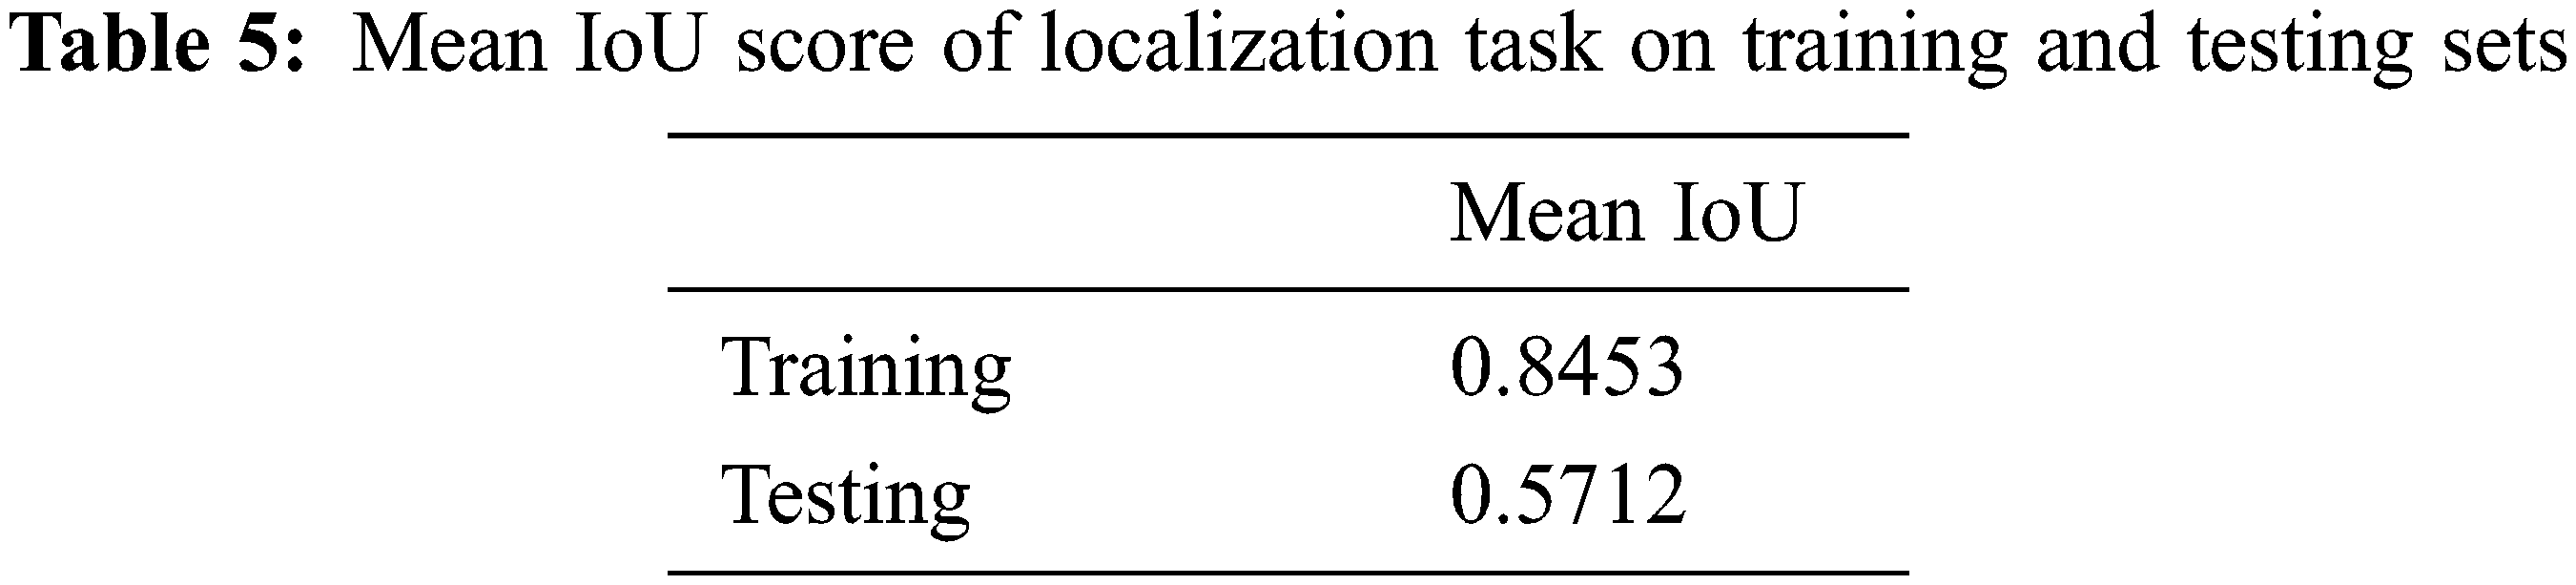
For focalization, we have proposed an architecture that preserves the location information effectively. We train the network for 50 epochs and it achieves 84% Mean IoU on the training data and 57% Mean IoU on the testing data.
Also, for localization, we have used smooth L1-loss function that calculates the L1 distance between all 8 coordinate values and mean IoU as a performance measure that calculate how two images overlap with each other. As it can be seen in Figs. 6 and 7, the network converges fast, and the converge becomes slow after the five epochs. The loss reaches to 0.2 after the 20 epochs, and accuracy reaches 0.6. In Fig. 10, the network loss decreases fast to 1, and the loss reaches 0.5 after 20 epochs. Similarly, the convergence graph of mean IoU in localization task, as shown in Fig. 11, fluctuates a lot till 50 epochs and converges till 0.45, and the convergence becomes smooth after 0.5. The Fig. 4 clearly shows that the network starts learning and converges to optimal points after the number of epochs.
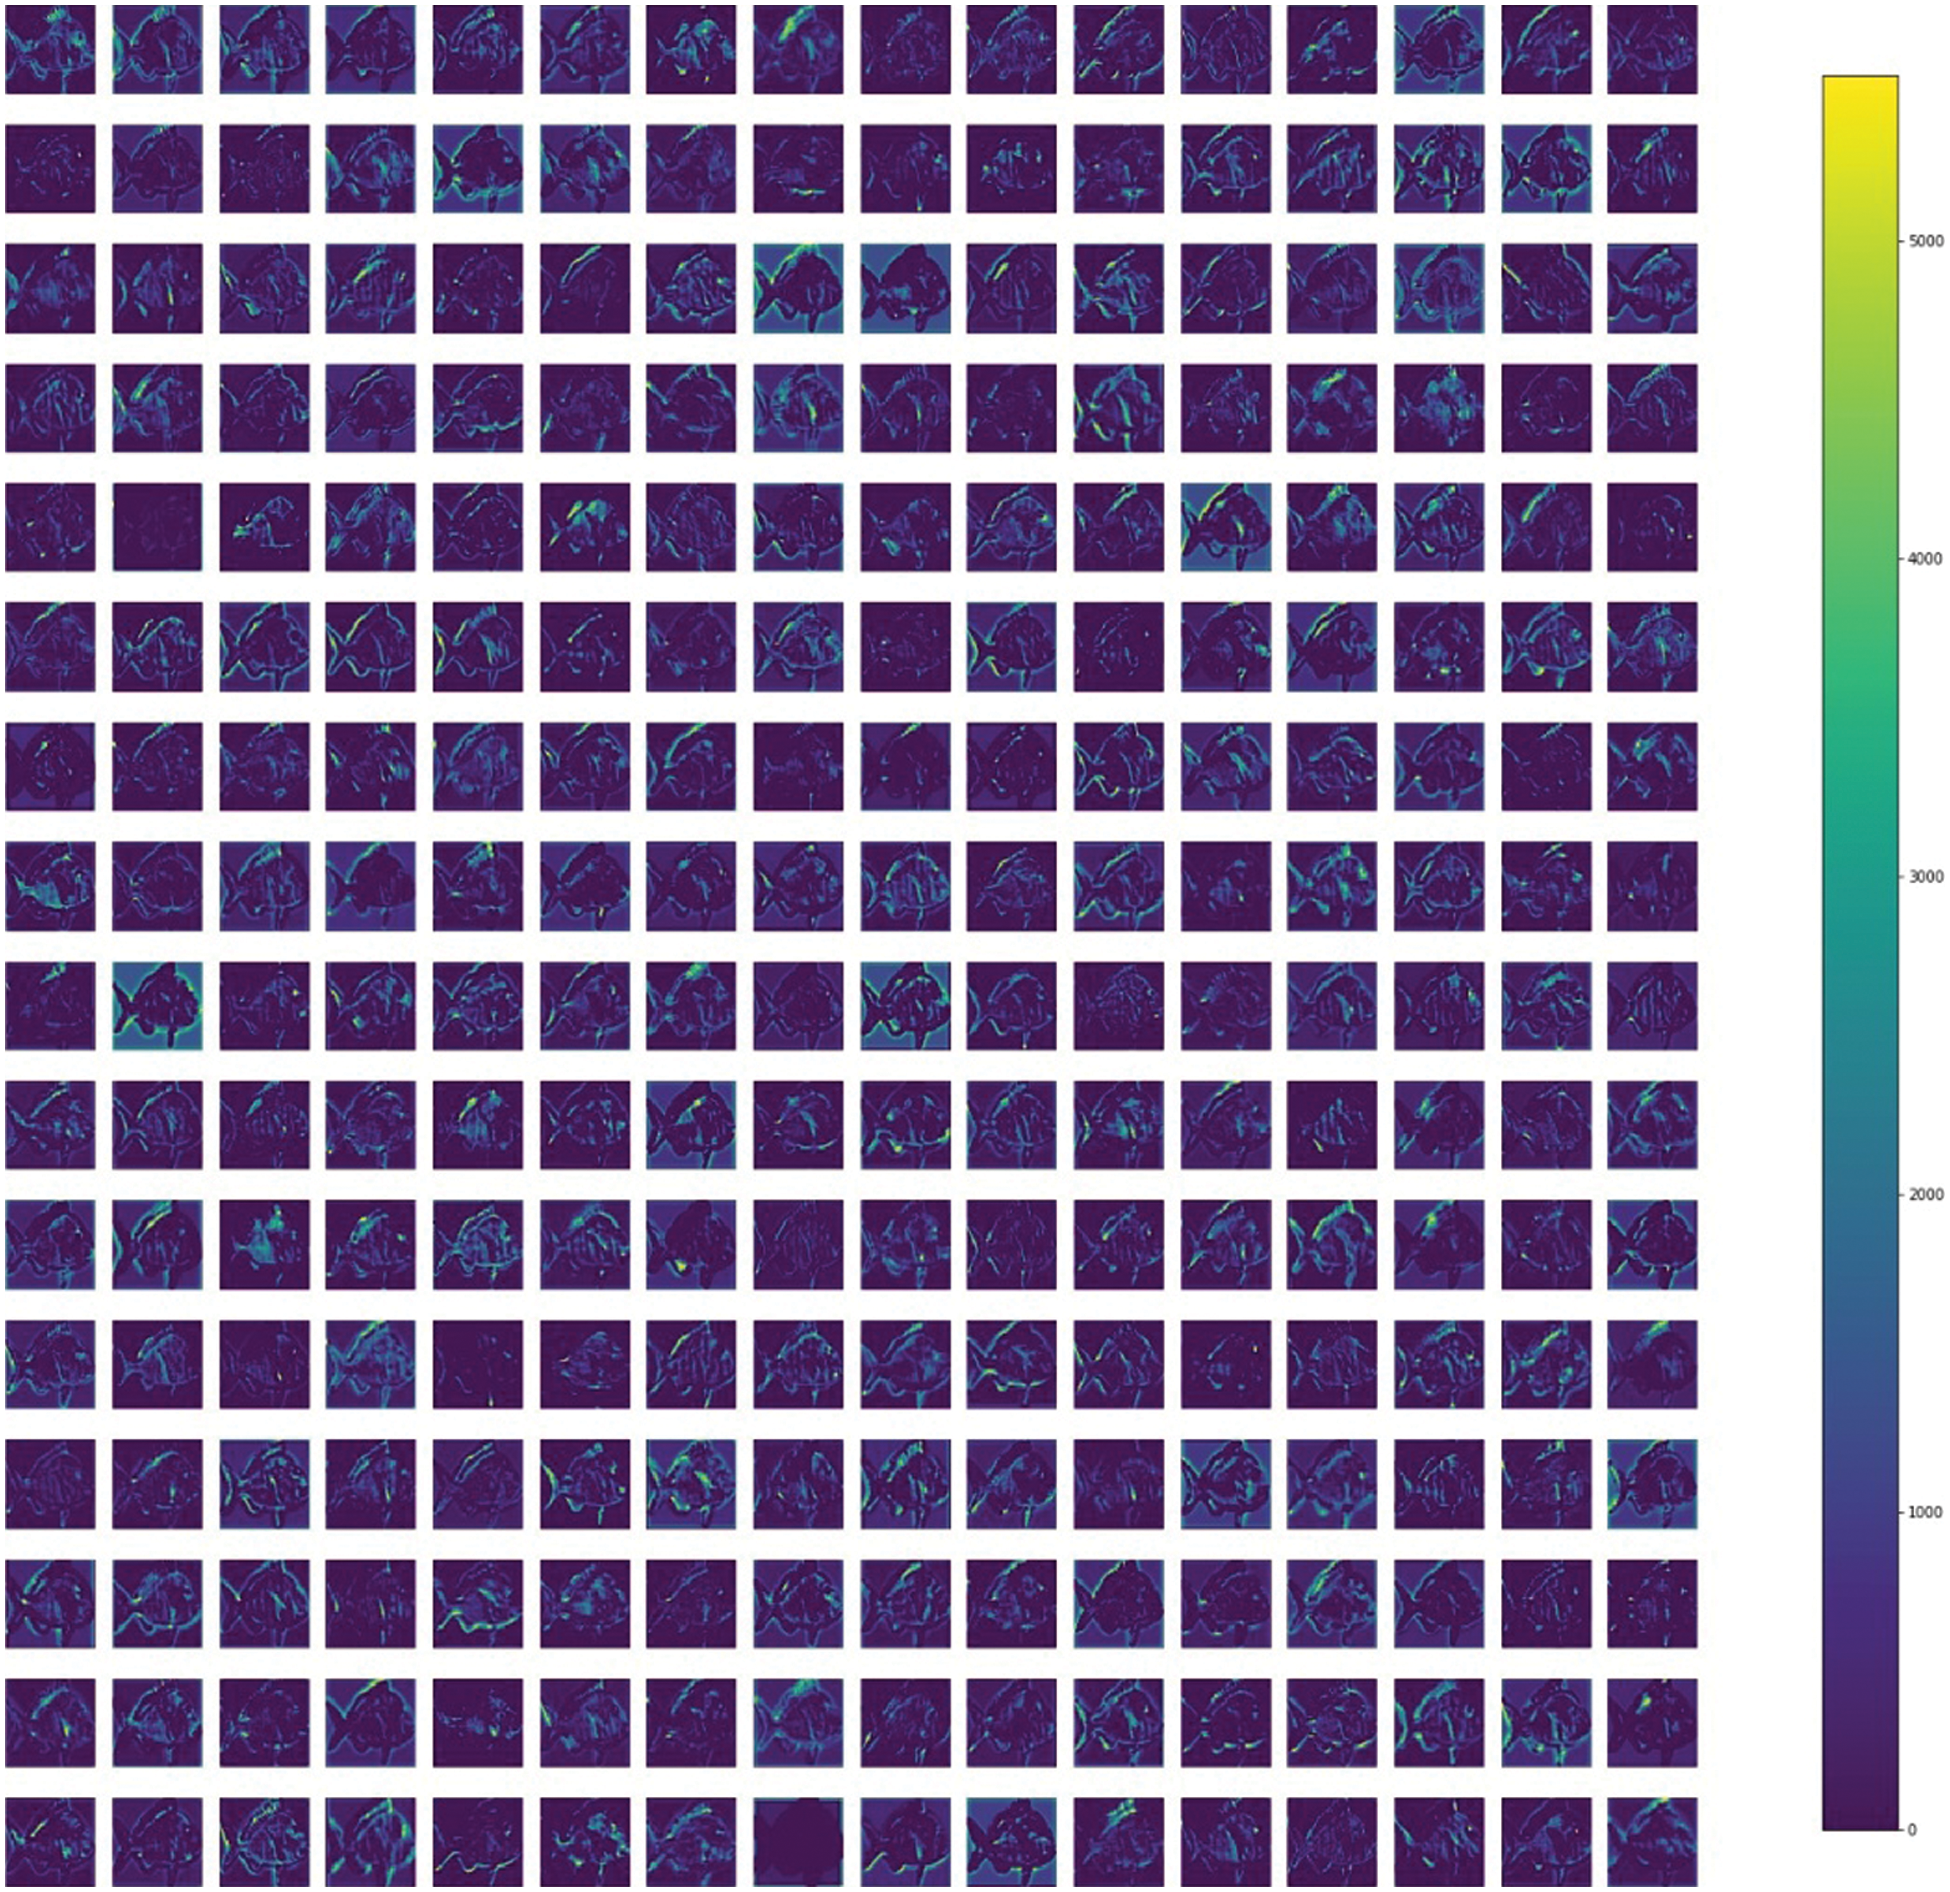
Figure 4: Feature maps from intermediate layers of efficientnet
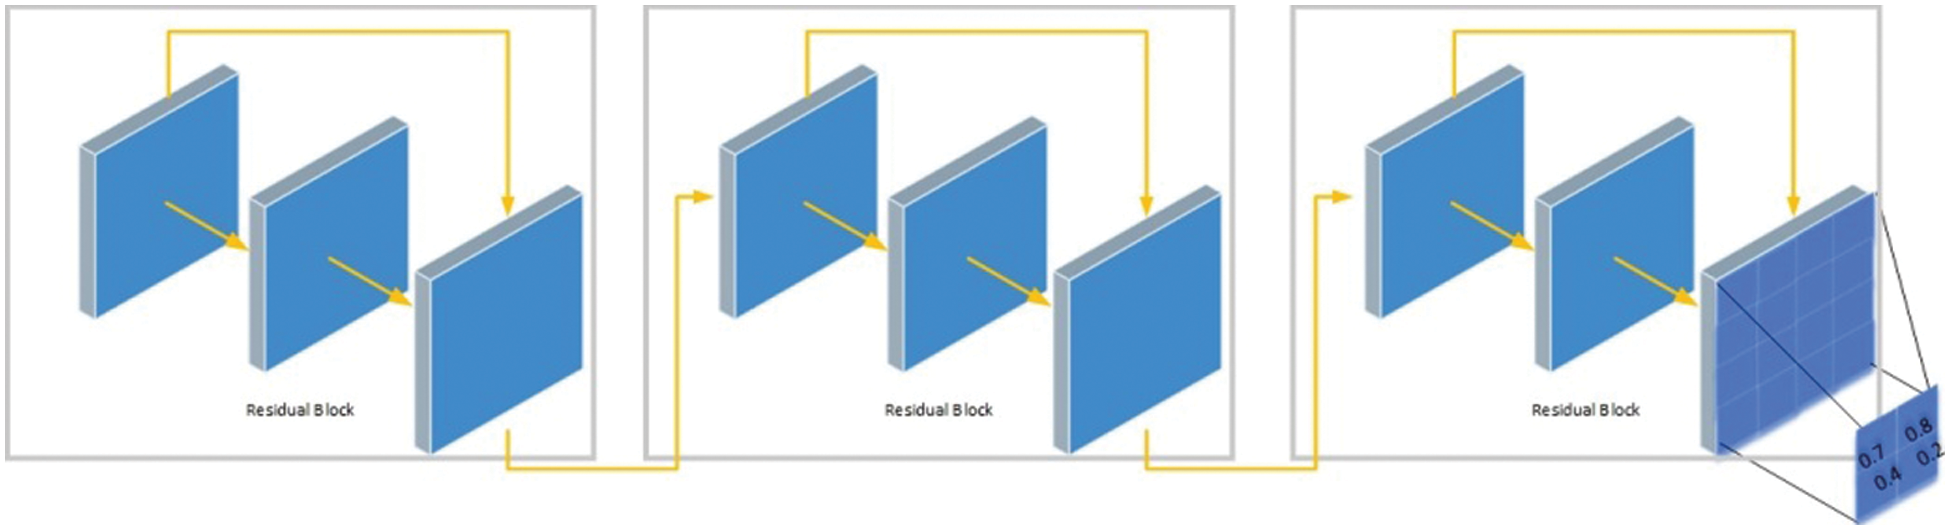
Figure 5: Proposed localization aware (L-Aware) architecture for localization
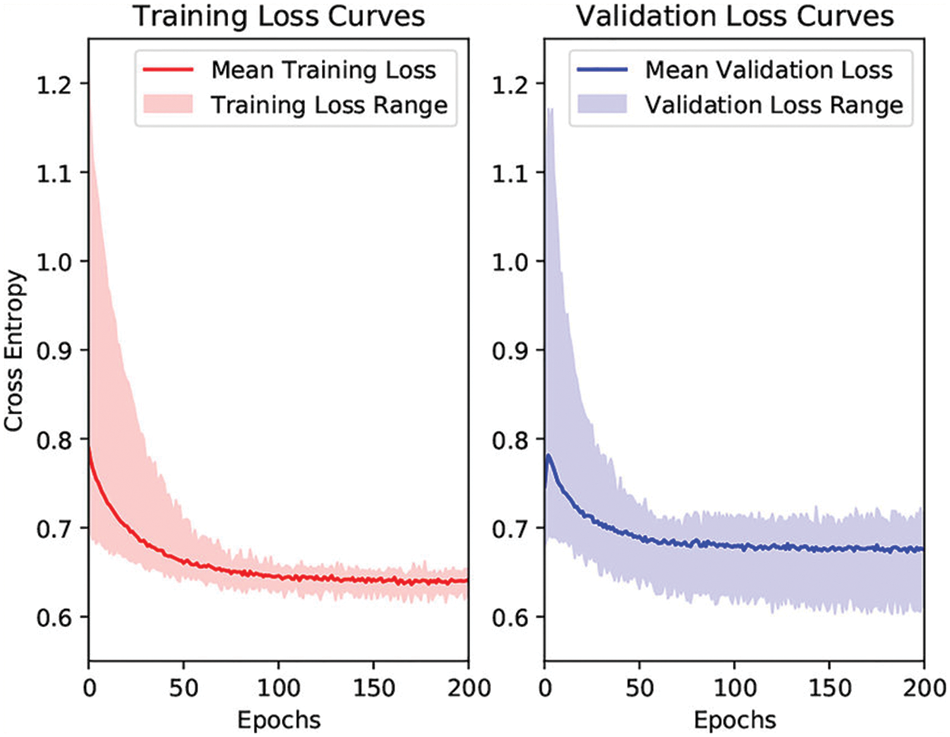
Figure 6: Taining and validation loss curves
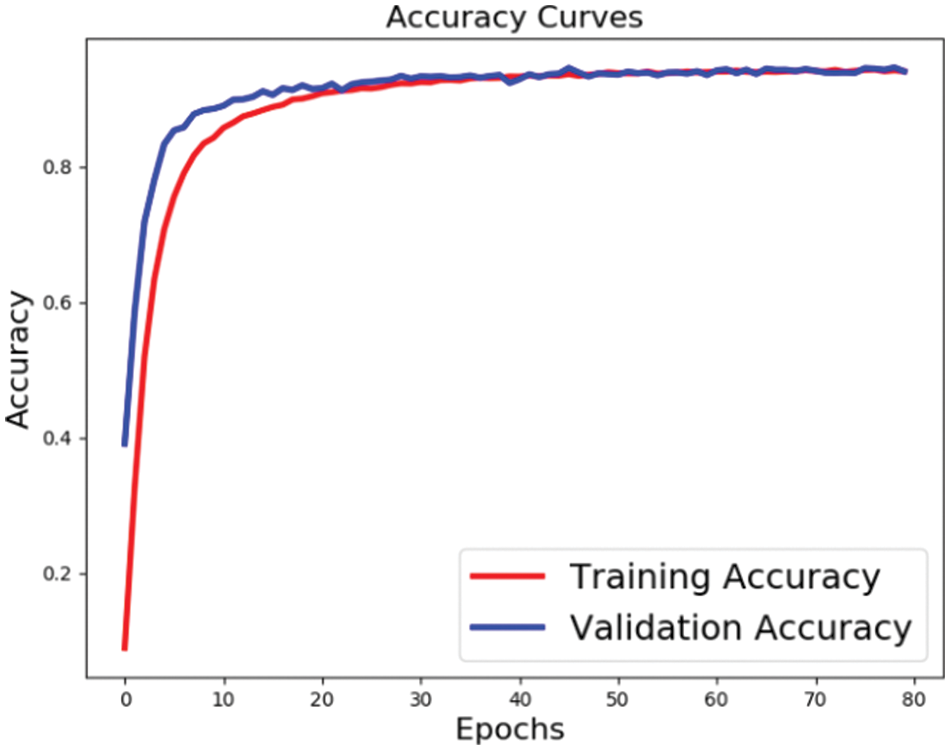
Figure 7: Taining and validation accuracy curve
The Fig. 4 shows the feature maps taken from intermediate layers of the network. The predicted probability values are shown from green to yellow colors. The yellow color represents large probability values, and blue color presents small probability values. The regions in the feature maps having green to yellow pixels show that the probability values are high. Visualizing these features maps helps to identify the working of deep learning-based models easily. The training and validation curves on different performance measures are shown in. Fig. 6. The network converges fast till 10 epochs and the convergence then becomes smooth and network converges smoothly. In Fig. 7, the learning curve of accuracy is shown. The network converges fast till 10 epochs and the convergence then becomes slow. Also, the learning curve becomes smooth after 30 epochs. The Fig. 8 shows a learning curve of recall, and it can be seen that the recall score converges fast to 0.5 after 10 epochs, and the recall increases to 0.8 from 0.6 after 20 epochs, and then the convergence become slow and network converges to 0.9 till 50 epochs.The Fig. 8 shows the F1-score curve of both training and validation set. The convergence of F1-score is quite slow and smooth as compared to other measures. The network converges slowly to 0.8 from 0.0 till 5 epochs, and the convergence then becomes slower, and finally it converges to 0.8 till 50 epochs. These learning curves are on 50 epochs. These curves show that the loss decreases significantly, while other performance measures get increased. We can note that the performance measures converge fast till 10 to 15 epochs, and the convergence then becomes slow. The proposed architecture for the localization is shown visually in Fig. 5 in which the architecture consists of 15 layers with residual blocks having skip connections between them.
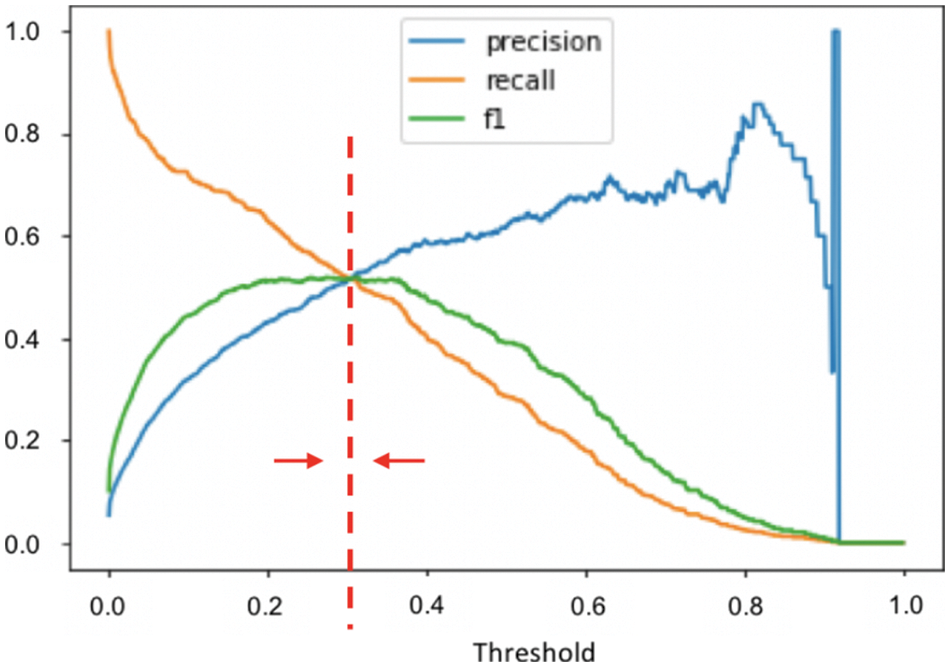
Figure 8: Taining and validation loss F1, recall, and precision score curves
The Figs. 9 and 10 show the training and loss curves of the localization task on both the training and validation set. The Fig. 9 shows the loss curve, and Fig. 10 shows the training curve. In Fig. 9, the network loss decreases to 0.5 after 5 epochs and then it becomes straight. Moreover, the score of confusion matrix is unveiled in Fig. 10.

Figure 9: Taining and validation smooth losses
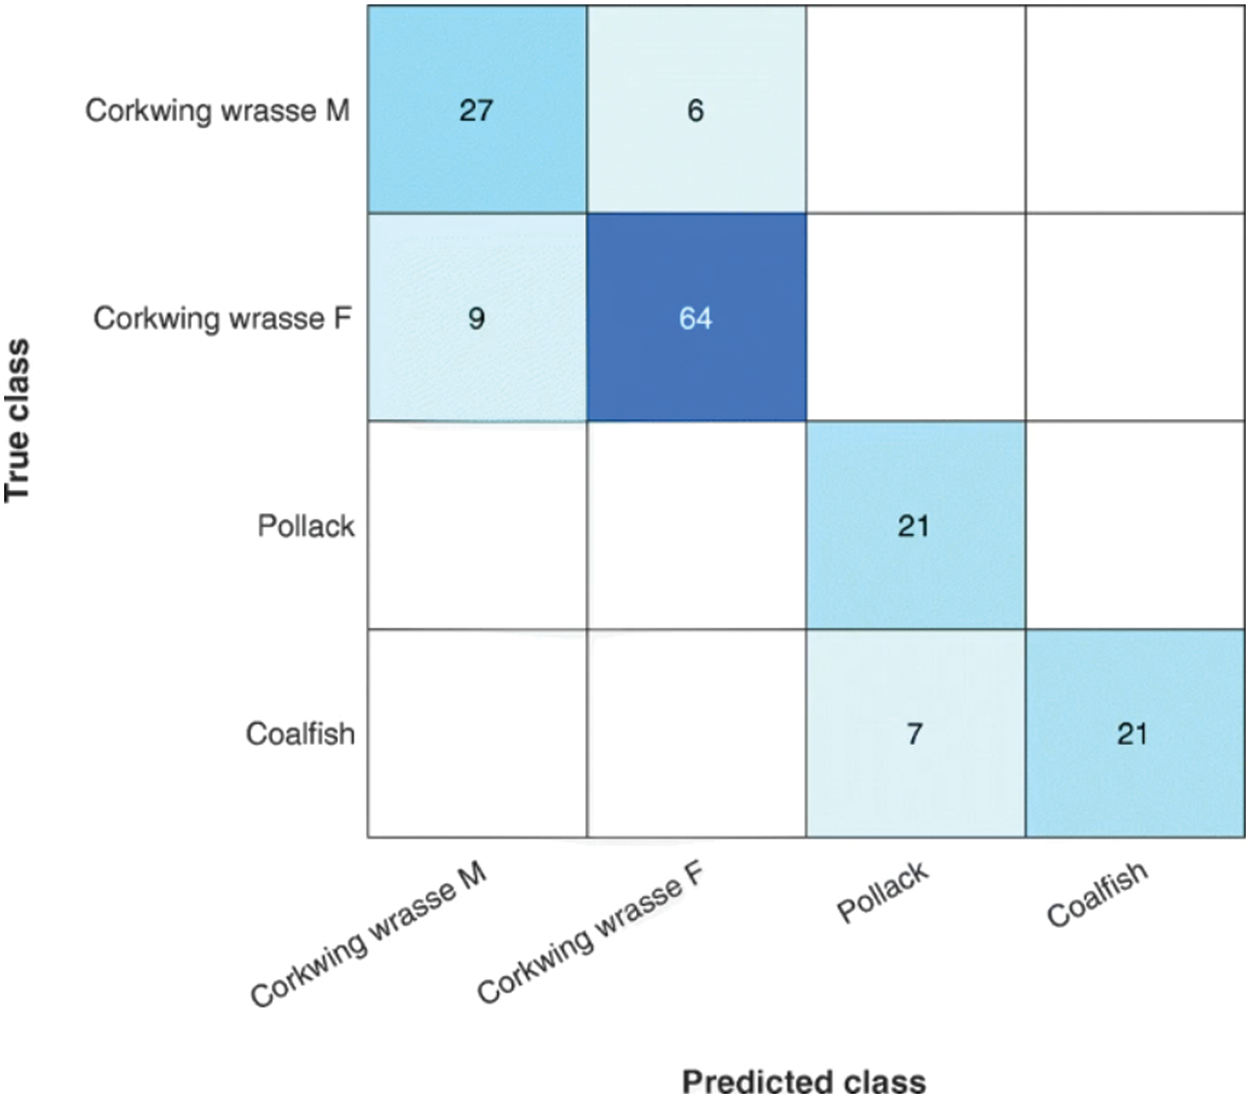
Figure 10: Confusion matrix
5 Conclusions and the Future Work
We have proposed a transfer learning-based approach to classify large scale fish species. In addition, the literature shows that a limited amount of work has been done on large fish species classification. Our dataset consisted of 3950 fish images, and the localization of such images was also a challenging task because these images were not taken in any controlled environment. The pictures were divided into three categories: in-situ, outside and controlled environment.
Moreover, we have performed extensive experiments on datasets for results evaluation. Also, we handled the class imbalance issues by using class weights and focal loss function. In addition, we used transfer learning-based pre-trained model on ImageNet for the classification that improves the classification performance. The task of Large scale fish prediction and detection is important as it leads to build a system that helps the marine scientists and people in terms of detection. Building such system is quite difficult due to data imbalance, large number of classes and less data. To solve these problems we adopted transfer learning based technique to fine-tune our model along with pre-training on ImageNet weights. For training the network, we used focal loss, which is an extension of cross-entropy for large-scale classification, and class weights equally assigned weights to all the labels. For the Localization problem, we proposed a CNN based architecture which consisted of location aware block that captured the context and location features, which helped in localization. In the future, with the ongoing developments in technologies, the performance of the system will be further improved with the less complexity [42–49].
Acknowledgement: Zamil S. Alzamil would like to thank Deanship of Scientific Research at Majmaah University for supporting this work under Project No. R-2022-172.
Funding Statement: Zamil S. Alzamil would like to thank Deanship of Scientific Research at Majmaah University for supporting this work under Project No. R-2022-172.
Conflicts of Interest: The authors declare that they have no conflicts of interest to report regarding the present study.
References
1. D. Rathi, S. Jain and S. Indu, “Underwater fish species classification using convolutional neural network and deep learning,” in Proc. of ICAPR, Bangalore, Inida, pp. 1–6, 2017. [Google Scholar]
2. D. J. White, C. Svellingen and N. J. Strachan, “Automated measurement of species and length of fish by computer vision,” Fisheries Research, vol. 80, no. 2–3, pp. 203–210, 2006. [Google Scholar]
3. A. A. Khan, P. Uthansakul, P. Duangmanee and M. Uthansakul, “Energy efficient design of massive MIMO by considering the effects of nonlinear amplifiers,” Energies, vol. 11, pp. 1045, 2018. [Google Scholar]
4. P. Uthansakul and A. A. Khan, “Enhancing the energy efficiency of mmWave massive MIMO by modifying the RF circuit configuration,” Energies, vol. 12, pp. 4356, 2019. [Google Scholar]
5. P. Uthansakul and A. A. Khan, “On the energy efficiency of millimeter wave massive MIMO based on hybrid architecture,” Energies, vol. 12, pp. 2227, 2019. [Google Scholar]
6. A. A. Khan, P. Uthansakul and M. Uthansakul, “Energy efficient design of massive MIMO by incorporating with mutual coupling,” International Journal on Communication Antenna and Propagation, vol. 7, pp. 198–207, 2017. [Google Scholar]
7. P. Uthansakul, A. A. Khan, M. Uthansakul and M. Duangmanee, “Energy efficient design of massive MIMO based on closely spaced antennas: Mutual coupling effect,” Energies, vol. 11, pp. 2029, 2018. [Google Scholar]
8. A. A. Khan, C. Wechtaisong, F. A. Khan and N. Ahmad, “A cost-efficient environment monitoring robotic vehicle for smart industries,” Computers, Materials & Continua, vol. 71, pp. 473–487, 2022. [Google Scholar]
9. A. A. Khan and F. A. Khan, “A cost-efficient radiation monitoring system for nuclear sites: Designing and implementation,” Intelligent Automation & Soft Computing, vol. 32, pp. 1357–1367, 2022. [Google Scholar]
10. T. Saitoh, T. Shibata and T. Miyazono, “Feature points based fish image recognition,” International Journal of Computer Information Systems and Industrial Management Applications, vol. 8, pp. 012–022, 2016. [Google Scholar]
11. P. Uthansakul, P. Anchuen, M. Uthansakul and A. A. Khan, “QoE-Aware self-tuning of service priority factor for resource allocation optimization in LTE network,” IEEE Transactions on Vehicular Technology, vol. 69, pp. 887–900, 2020. [Google Scholar]
12. P. Uthansakul, P. Anchuen, M. Uthansakul and A. A. Khan, “Estimating and synthesizing QoE based on QoS measurement for improving multimedia services on cellular networks using ANN method,” IEEE Transactions on Network and Service Management, vol. 17, pp. 389–402, 2020. [Google Scholar]
13. A. Krizhevsky, I. Sutskever and G. E. Hinton, “Imagenet classification with deep convolutional neural networks,” Advances in Neural Information Processing Systems, vol. 12, pp. 1097–1105, 2012. [Google Scholar]
14. J. Schmidhuber, “Deep learning in neural networks: An overview,” Neural Networks, vol. 61, pp. 85–117, 2015. [Google Scholar]
15. Y. LeCun, Y. Bengio and G. Hinton, “Deep learning,” Nature, vol. 521, no. 7553, pp. 436–444, 2015. [Google Scholar]
16. A. Salman, A. Jalal, F. Shafait, A. Mian, M. Shortis et al., “Fish species classification in unconstrained underwater environments based on deep learning,” Limnology and Oceanography: Methods, vol. 14, no. 9, pp. 570–585, 2016. [Google Scholar]
17. W. Wang, X. Huang, J. Li, P. Zhang and X. Wang, “Detecting COVID-19 patients in X-ray images based on MAI-nets,” International Journal of Computational Intelligence Systems, vol. 14, no. 1, pp. 1607–1616, 2021. [Google Scholar]
18. Y. Gui and G. Zeng, “Joint learning of visual and spatial features for edit propagation from a single image,” The Visual Computer, vol. 36, no. 3, pp. 469–482, 2020. [Google Scholar]
19. M. Anul Haq, “Cdlstm: a novel model for climate change forecasting,” Computers, Materials & Continua, vol. 71, no. 2, pp. 2363–2381, 2022. [Google Scholar]
20. S. R. Zhou, J. P. Yin and J. M. Zhang, “Local binary pattern (LBP) and local phase quantization (LBQ) based on gabor filter for face representation,” Neurocomputing, vol. 116, pp. 260–264, 2013. [Google Scholar]
21. Y. Song, D. Zhang, Q. Tang, S. Tang and K. Yang, “Local and nonlocal constraints for compressed sensing video and multi-view image recovery,” Neurocomputing, vol. 406, pp. 34–48, 2020. [Google Scholar]
22. M. Anul Haq, “Smotednn: a novel model for air pollution forecasting and aqi classification,” Computers, Materials & Continua, vol. 71, no. 1, pp. 1403–1425, 2022. [Google Scholar]
23. F. Li, C. Ou, Y. Gui and L. Xiang, “Instant edit propagation on images based on bilateral grid,” Computers, Materials & Continua, vol. 61, no. 2, pp. 643–656, 2019. [Google Scholar]
24. Y. Song, Y. Zeng, X. Y. Li, B. Y. Cai and G. B. Yang, “Fast CU size decision and mode decision algorithm for intra prediction in HEVC,” Multimedia Tools and Applications, vol. 76, no. 2, pp. 2001–2017, 2017. [Google Scholar]
25. A. A. Khan, “Energy efficient design of 5G massive mimo,” Ph.D. dissertation, Suranaree University of Technology, Thailand, 2018. [Google Scholar]
26. F. Storbeck and B. Daan, “Fish species recognition using computer vision and a neural network,” Fisheries Research, vol. 51, no. 1, pp. 11–15, 2001. [Google Scholar]
27. Z. Cao, J. C. Principe, B. Ouyang, F. Dalgleish and A. Vuorenkoski, “Marine animal classification using combined cnn and hand-designed image features,” in Proc. of OCEANS 2015MTS, Washington, USA, pp. 1–6, 2015. [Google Scholar]
28. P. X. Huang, B. J. Boom and R. B. Fisher, “GMM improves the reject option in hierarchical classification for fish recognition,” in IEEE Winter Conf. on Applications of Computer Vision, CO, USA, pp. 371–376, 2014. [Google Scholar]
29. T. Wang and P. Shi, “Kernel grassmannian distances and discriminant analysis for face recognition from image sets,” Pattern Recognition Letters, vol. 30, no. 13, pp. 1161–1165, 2009. [Google Scholar]
30. D. Lee, S. Redd, R. Schoenberger, X. Xu and P. Zhan, “An automated fish species classification and migration monitoring system,” in 29th Annual Conf. of the IEEE Industrial Electronics Society, VA, USA, pp. 1080–1085, 2003. [Google Scholar]
31. S. Cadieux, F. Michaud and F. Lalonde, “Intelligent system for automated fish sorting and counting,” in Proc. of 2000 IEEE/RSJ Int. Conf. on Intelligent Robots and Systems, Takamatsu, Japan, pp. 1279–1284, 2000. [Google Scholar]
32. S. Ogunlana, O. Olabode, S. Oluwadare and G. Iwasokun, “Fish classification using support vector machine,” African Journal of Computing & ICT, vol. 8, no. 2, pp. 75–82, 2015. [Google Scholar]
33. A. Hernández-Serna and L. F. Jiménez-Segura, “Automatic identification of species with neural networks,” PeerJ, vol. 2, pp. 563, 2014. [Google Scholar]
34. C. Pornpanomchai, B. Lurstwut, P. Leerasakultham and W. Kitiyanan, “Shape and texture based fish image recognition system,” Kasetsart Journal-Natural Science, vol. 47, no. 4, pp. 624–634, 2013. [Google Scholar]
35. J. Donahue, Y. Jia, O. Vinyals, J. Hoffman, N. Zhang et al., “Decaf: A deep convolutional activation feature for generic visual recognition,” in Int. Conf. on Machine Learning, Beijing, China, pp. 647–655, 2014. [Google Scholar]
36. S. Mastrorillo, S. Lek, F. Dauba and A. Belaud, “The use of artificial neural networks to predict the presence of small-bodied fish in a river,” Freshwater Biology, vol. 38, no. 2, pp. 237–246, 1997. [Google Scholar]
37. T. -Y. Lin, P. Goyal, R. Girshick, K. He and P. Dollar, “Focal loss for dense object detection,” in Proc. of the IEEE Int. Conf. on Computer Vision, Venice, Italy, pp. 2980–2988, 2017. [Google Scholar]
38. M. A. Iqbal, Z. Wang, Z. A. Ali and S. Riaz, “Automatic fish species classification using deep convolutional neural networks,” Wireless Personal Communications, vol. 12, pp. 1–11, 2019. [Google Scholar]
39. C. Qiu, S. Zhang, C. Wang, Z. Yu, H. Zheng et al., “Improving transfer learning and squeeze-and-excitation networks for small-scale fine-grained fish image classification,” IEEE Access, vol. 6, pp. 78503–78512, 2018. [Google Scholar]
40. N. E. M. Khalifa, M. H. N. Taha and A. E. Hassanien, “Aquarium family fish species identification system using deep neural networks,” in Int. Conf. on Advanced Intelligent Systems and Informatics, Cairo, Egypt, pp. 347–356, 2018. [Google Scholar]
41. S. A. Siddiqui, A. Salman, M. I. Malik, F. Shafait, A. Mian et al., “Automatic fish species classification in underwater videos: Exploiting pre-trained deep neural network models to compensate for limited labelled data,” ICES Journal of Marine Science, vol. 75, no. 1, pp. 374–389, 2018. [Google Scholar]
42. S. Vinson Joshua, A. Selwin Mich Priyadharson, R. Kannadasan, A. A. Khan, W. Lawanont et al., “Crop yield prediction using machine learning approaches on a wide spectrum,” Computers, Materials & Continua, vol. 72, no. 3, pp. 5663–5679, 2022. [Google Scholar]
43. M. B. Kamal, A. A. Khan, F. A. Khan, M. M. Ali Shahid, C. Wechtaisong et al., “An innovative approach utilizing binary-view transformer for speech recognition task,” Computers, Materials & Continua, vol. 72, no. 3, pp. 5547–5562, 2022. [Google Scholar]
44. N. Mushtaq, A. A. Khan, F. A. Khan, M. J. Ali, M. M. Ali Shahid et al., “Brain tumor segmentation using multi-view attention based ensemble network,” Computers, Materials & Continua, vol. 72, no. 3, pp. 5793–5806, 2022. [Google Scholar]
45. S. Prajam, C. Wechtaisong and A. A. Khan, “Applying machine learning approaches for network traffic forecasting,” Indian Journal of Computer Science and Engineering, vol. 13, no. 2, pp. 324–335, 2022. [Google Scholar]
46. W. Sun, X. Chen, X. R. Zhang, G. Z. Dai, P. S. Chang et al., “A multi-feature learning model with enhanced local attention for vehicle re-identification,” Computers, Materials & Continua, vol. 69, no. 3, pp. 3549–3560, 2021. [Google Scholar]
47. W. Sun, G. C. Zhang, X. R. Zhang, X. Zhang and N. N. Ge, “Fine-grained vehicle type classification using lightweight convolutional neural network with feature optimization and joint learning strategy,” Multimedia Tools and Applications, vol. 80, no. 20, pp. 30803–30816, 2021. [Google Scholar]
48. Y. Hsiao, C. Chen, S. Lin and F. Lin, “Real-world underwater fish recognition and identification using sparse representation,” Ecological Informatics, vol. 23, pp. 13–21, 2014. [Google Scholar]
49. K. Lakshmanna, R. Kaluri, N. Gundluru, Z. S. Alzamil, D. S. Rajput et al., “A review on deep learning techniques for IoT data,” Electronics, vol. 11, no. 10, pp. 1604, 2022. [Google Scholar]
Cite This Article
 Copyright © 2023 The Author(s). Published by Tech Science Press.
This work is licensed under a Creative Commons Attribution 4.0 International License , which permits unrestricted use, distribution, and reproduction in any medium, provided the original work is properly cited.
 Downloads
 Citation Tools