
 Submit a Paper
 Propose a Special lssue
 Open Access
ARTICLE

Cross-Validation Convolution Neural Network-Based Algorithm for Automated Detection of Diabetic Retinopathy
Department of ECE, SRC, SASTRA Deemed University, Kumbakonam, 612001, Tamilnadu, India
* Corresponding Author: S. Sudha. Email:
Computer Systems Science and Engineering 2023, 45(2), 1985-2000. https://doi.org/10.32604/csse.2023.030960
Received 07 April 2022; Accepted 08 June 2022; Issue published 03 November 2022
 View Full Text
 Download PDF
Abstract
The substantial vision loss due to Diabetic Retinopathy (DR) mainly damages the blood vessels of the retina. These feature changes in the blood vessels fail to exist any manifestation in the eye at its initial stage, if this problem doesn’t exhibit initially, that leads to permanent blindness. So, this type of disorder can be only screened and identified through the processing of fundus images. The different stages in DR are Micro aneurysms (Ma), Hemorrhages (HE), and Exudates, and the stages in lesion show the chance of DR. For the advancement of early detection of DR in the eye we have developed the CNN-based identification approach on the fundus blood lesion image. The CNN-based automated detection of DR proposes the novel Graph cutter-built background and foreground superpixel segmentation technique and the foremost classification of fundus images feature was done through hybrid classifiers as K-Nearest Neighbor (KNN) classifier, Support Vector Machine (SVM) classifier, and Cascaded Rotation Forest (CRF) classifier. Over this classifier, the feature cross-validation made the classification more accurate and the comparison is made with the previous works of parameters such as specificity, sensitivity, and accuracy shows that the hybrid classifier attains excellent performance and achieves an overall accuracy of 98%. Among these Cascaded Rotation Forest (CRF) classifier has more accuracy than others.Keywords
Retinopathy is a chronic visual impairment [1] due to an abnormal blood flow throughout the retinal sensitive vascular tissue in the eye. This type of retinopathy mainly affects a person who is already impacted by diabetes. The first and the foremost reason for Diabetic Retinopathy [2] is the reduced glucose or sugar level of the eye and also the blood pressure, and cholesterol levels of the body. It intently affects the very sensible back part of the eye called Diabetic Retinopathy. At first, the infection does not expose any symptoms in the eye, but at the final stage only the eye blood vessels become weakened, bulge, or leak into the retina thereafter only the severity of the disease was diagnosed by a Physician. So, early sensing [3] of Diabetic Retinopathy (DR) is the way to lessen the immature age person’s visual impairment. Diabetic Retinopathy also increases the chance of having glaucoma, cataracts, and other eye problems worldwide [4].
Micro aneurysms (Ma) [5], Hemorrhages (HE) [6], and Exudates [7] are the primary stages of DR. These utter issues in the blood vessel of an eye can be identified and classified automatically using the proposed method. The lack of experienced clinicians, the delayed time of taking manual work for sensing disease, and delayed decision making, the overall manipulations [8] drive the person’s life so sophisticated. For effective time consuming and the concern for human life supervised learning-based Convolutional Neural Networking (CNN) has been proposed for the classification and detection of initial stage Diabetic Retinopathy which is mostly focused on younger age people. By the way, 75% of diabetic patients in India experienced an eye complication resulting in blindness in the 20–64 age group [9]. Generally, there are various pathways for the examination of normal and distinctive DR. The reports in the year 2000 expressed a lot of data and surveys about DR, by which the survey from the World Health Organization demonstrated that nearly 347. 50 million people were affected by DR, along with these 366 adults were affected by diabetes through International Diabetes Federation. This stat predicted that 533 million people would be affected in the year 2030. The detection of DR by the physician is correct and accurate but it takes a long time for decision making, so in this lack of time consistency for spotting abnormality in the retina can be rectified and corrected by CNN-based segmentation and classification for early detection of DR which reduces 50% of eye problems. CNN is the advanced and most prominent networking in the image processing [10,11] field.
Through fundus imaging [12], the data set is taken and earlier days segmentation is done by optic disc segmentation method, and robust vessel segmentation [13]. These methods only segment [14] the specified dilemmas such as glaucoma, but our proposed segmentation uses vessel extraction [15] and a Graph cut segmentation algorithm. Through this graph theory, input fundus images are graph cut segmented which is shown in Fig. 1, it detects a specified portion of DR, through the line that is to be drawn in the fundus image. The background and the foreground superpixel differentiation make the segmentation easier by the Graph Cut algorithm, the MATLAB® toolstrip is an automatic segmenter that accesses the fundus image and segments automatically by the proposed algorithm.
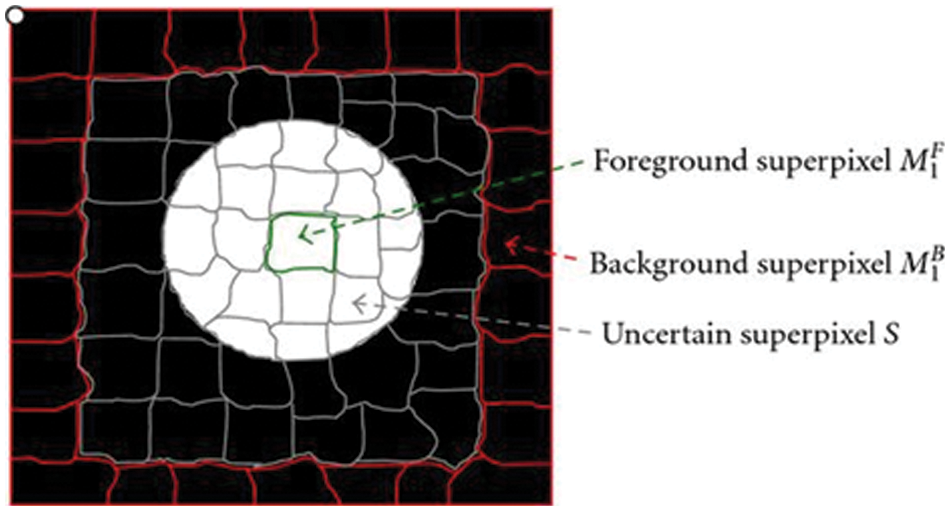
Figure 1: Graph cut segmented fundus image
The classification is done by our proposed hybrid classification method as K-NN, SVM with PCA, and Cascaded Rotation Forest. These methods were separately used for classification but in this developed approach all three classifiers were hybridized and proceeded for classification and yielding high accuracy of 98%. Thus, we can detect all DR-related visual impairments more accurately and with no delay time.
This research paper is then followed by: (related studies) literature on the existing works about the detection of diabetic retinopathy and its drawbacks, then the followed segment 3 made suggested research on the detection of diabetic retinopathy, and part 4 narrates the experimental analysis and outcomes of the suggested detection method and last but not least the last segment holds the conclusion part of this paper.
In 2017, Ghosh, R et al. proposed the automatic detection and classification technique for different stages of Diabetic Retinopathy using CNN networking, the input color fundus retinal image is denoised by CNN’s six networking layers with this Micro-aneurysm hemorrhage stages of DR are classified and identified [16]. This paper exists an accuracy of 95% for the above two classifications. The experimental errors in the time of capturing images need more care for further accuracy in the classification layer of networks.
In 2020, Shaban, M et al., developed the specified CNN for the screening and staging of DR [17]. Different stages of DR such as the absence of DR, moderate and severe was classified. This paper used a Deep learning network with 18 convolutional layers and 3 connected layers for the sake of detection, classification, and staging of the input data set. The specific class data augmentation approach to train and test the network by using 5-fold and 10-fold cross-checking datasets adopted for the performance of an unbalanced dataset, at last, it achieved a validation accuracy of 89%. But other different networking models, don’t have the same accuracy.
In 2017, Soomro, et al. proposed an extraction method for the analysis of DR using Basic Filtering Schemes from the retinal blood vessel [18]. The segmentation of blood vessels is the basic analysis for the identification of DR. In this segmentation, the background noise and uneven illumination occurred at the time of input acquisition, and this type of noise is filtered by modifying each pixel value of the input image through Adaptive Wiener morphological filtering. It attains up to 94% of accuracy.
In 2021, Gayathri, S et al. proposed a research paper on the classification of Diabetic Retinopathy using both Multipath CNN and the machine learning classifiers [19]. This method extracts the features from fundus images and classifies them using the machine learning classifiers. The response outcome is obtained using the M-CNN network with the J48 classifier. The detection of the disease is found by using the classifiers which shows the low accuracy rate in early disease detection. Its accuracy rate is less than 98%.
In 2022 Jaichandran, R et al. proposed a paper to detect diabetic retinopathy using a CNN in computer vision-based technique [20]. This may analyze and predict the diabetics in retinal input images. The training set is done with CNN-SVM in diabetic and non-diabetic retinal images which shows the minimum accuracy rate.
In 2021, Yadav, et al. developed the Color locus detection approach that employs networking such as ANN, CNN, and AI to identify early microaneurysms in DR patients [21]. The initial stage of DR is Microaneurysm, and the labeled dataset is Healthy (0) and MA (1). The input is processed and segmented using shape, statistical, and Gray-Level Co-occurrence Matrix (GLCM) features of the locus detection algorithm, and it achieves an accuracy of 83 percent. However, it only detects Microaneurysms and has no idea about hemorrhages or exudates stages of DR.
The interior part of an eye is imaged through a fundus camera and this image is taken as an input image. The pre-processing is done from the acquired input image [22, 23], which means the input image is read and resized by the system, then the readable image data is gone for the removal of different types of noise such as internal noises, external noises, environmental noises, and then it goes for the image smoothing, subsequently the blood vessels are extracted. Based on the developed Graph cut theory, the segmentation of Microaneurysms, Hemorrhages, and Exudates stages of DR is performed after the extraction of blood vessels. Hybrid features such as statistics (Mean
The functional pattern of the developed Graph theory-based segmentation is depicted in Fig. 2, in which the Weiner filtering method is used for initial blood vessel extraction. The pixel identification is achieved based on backward and forward superpixel cutting segmentation; therefore, the distinct features are tested and identified.
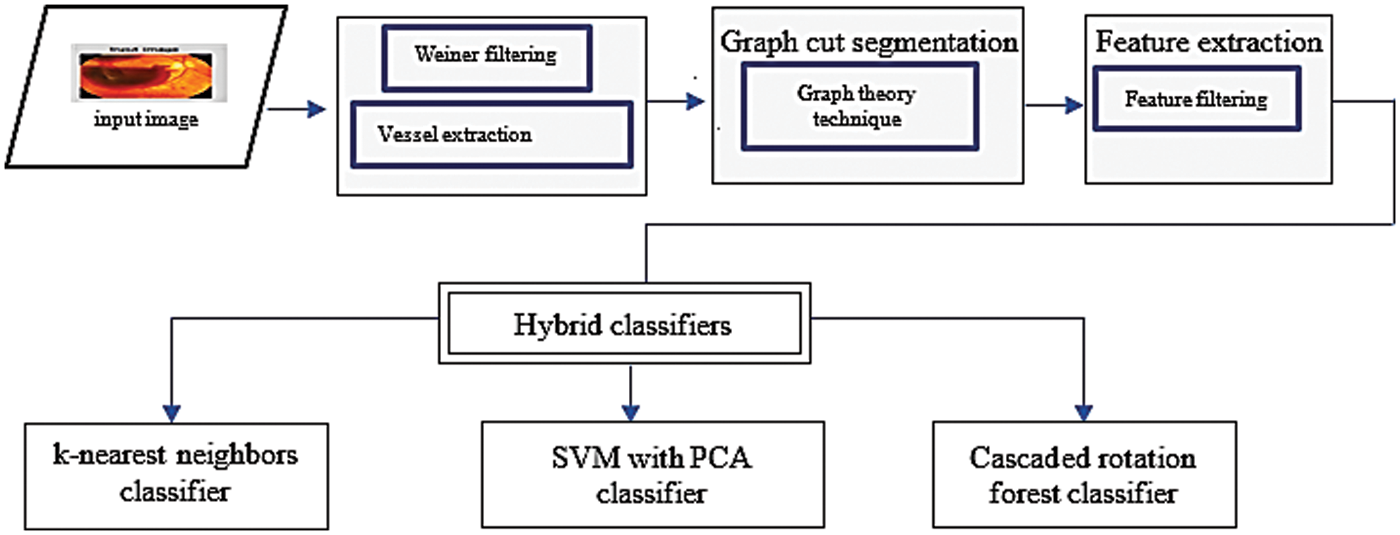
Figure 2: Proposed hybrid classifier block diagram
Initially, preprocessing [24] prefers an input obtained from ocular fundus photography, which allows for the collection of the fundus image. In some cases, the input fundus image is polluted by some other noises, which causes the input image to become blurry. So, the filters should be used to eliminate all kinds of noises, Here Wiener filter W (u, v) is utilized more effectively in this situation, and it recreates the originality of the image by deblurring. The stochastic Wiener filter lowers the total mean square error while reducing additive noise. Fig. 3 depicts the Wiener filtering block diagram.
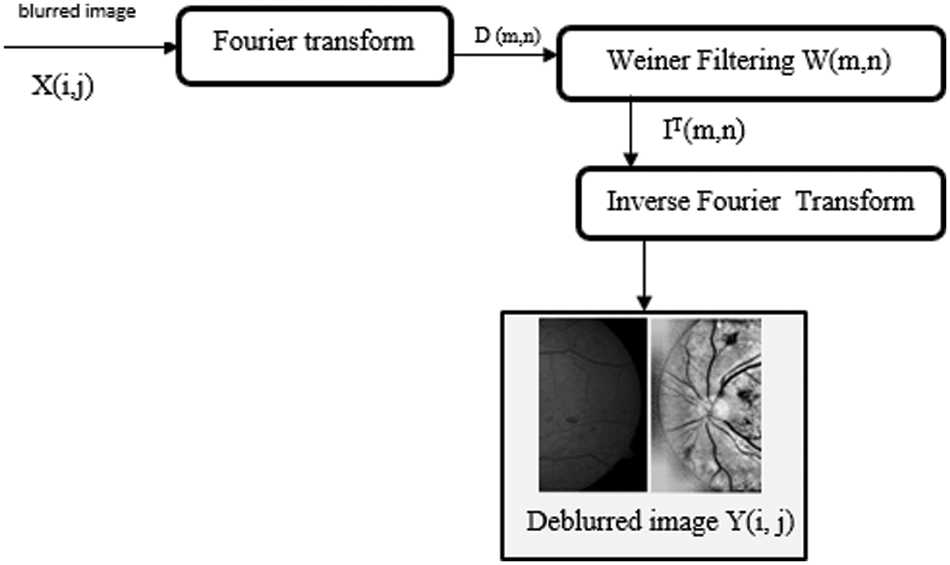
Figure 3: Deblurring image processing using wiener filtering
Steps of Wiener filtering:
1. Taking Fourier transformations for the blurred low quality input image.
2. Determination of output function from the product of Wiener filtering and Fourier transform.
D (m,n)–Applying Fourier transform to a blurred image.
IT (m,n)–Output of inverse Fourier transform image achieved from Wiener filtering.
3. After Weiner Filtering, Inverse Fourier transform is taken to transform to produce a deblurred image Y(i, j).
The image processing stages are as follows, 1) Image sizing, 2) Green channel extraction, 3) Image contrast enhancement by Histogram Equalization, and 4) Extraction of the blood vessel is the most significant for pre-processing the image. Fig. 4 shows the green channel extraction output from the input fundus image.

Figure 4: Extracted fundus image after green channel extraction
Enhancement Using Adaptive Histogram Equalization (AHE)
The input fundus image is resized. Red, green, and blue are the three primary channels for extraction [25,26]. Among the three-channel, the green channel is selected because it captures more information and is less sensitive to noise. Then the image is set for enhancement processing using an AHE and then the contrast of an image is enhanced.
For each distinct part of the image, several histograms are computed and these are used to modify the contrast adjusting the pixel brightness value. The sectioned image is enhanced depending on the boundary of each section and the contrast-enhanced image which is shown in Fig. 5.
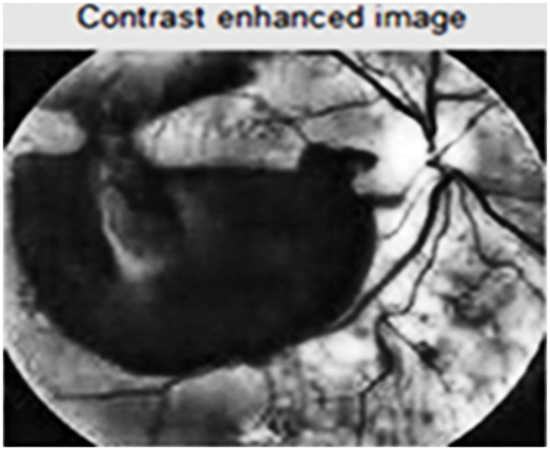
Figure 5: Enhanced contrast image
The same featured elements are grouped, and this similar Structuring element (S) is used for different processing such as dilating, eroding, and closing the image (IC) and the above processing-related function called morphological closing.
In Eq. (2), where ⊕ and ⊖ are dilation and erosion respectively.
3.2 Pixel Graph Theory Segmentation
Graph cut segmentation is a recurrent technique for extracting the specific areas of an image that represent diabetic retinopathy lesions and the segmented image using the graph cut technique is shown in Fig. 6. When graph cut segmentation is applied, each pixel is regarded as a node. The nodes are then connected by edges. Weights are computed and distributed between pixels, as well as between the source and the sink. We classified the pixels 1 and 0 as foreground and background respectively and then identified them using the energy function. Images can be segmented at a reasonable cost by partitioning graphs in the same way. During graph theory of segmentation, the same featured pixels will be in the same segment, whereas dissimilar featured pixels will be in separate segments. Cutting a graph into disjoint subsets is called graph cutting. In a superpixel graph cut segmentation method fundus image is segmented into multiple sets of the segmented image as pixels or superpixels. It represents the contrasted fundus image. Superpixels align the segmented image with better edges and patches. In image segmentation, superpixels may take more image information than the pixels.
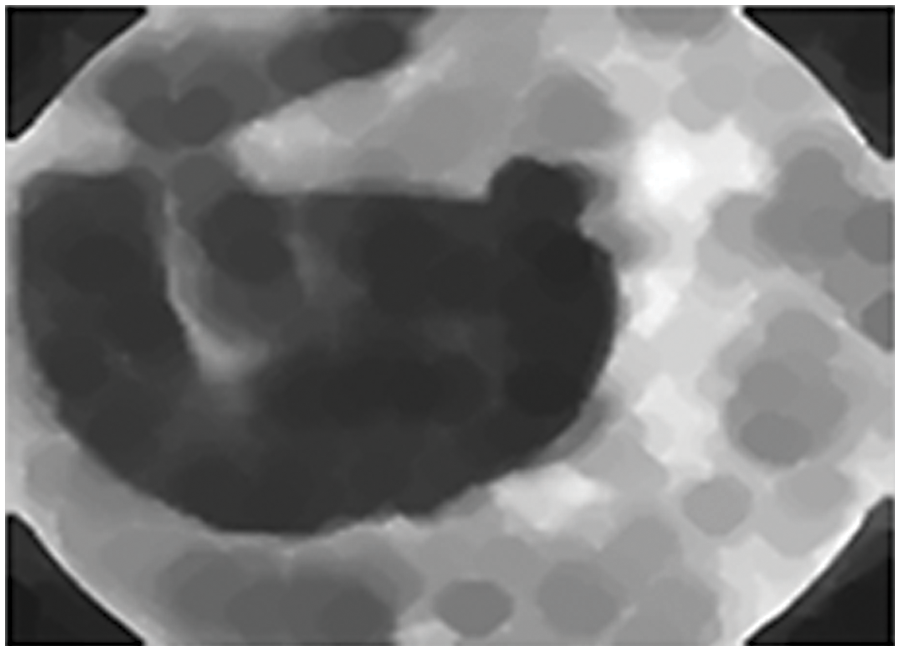
Figure 6: Segmentation using graph cut technique
In Graph cut segmentation-based approaches, each pixel is treated as a node in the segmented graph, and superpixels are formed and specified across the graph by the cost function reduction. In the graph, we removed the minimum sum of edge weights to divide it into two groups, U and V. Similarly, we determine the minimum cut, which is a maximum flow.
Steps:
1) Differentiating the image’s cluster points.
2) Evaluating the length of distinct Unique feature.
3) Identifying the index for each distinct feature.
4) Clusters are divided into groups depending upon their distance from each other.
5) The image is clustered depending on the maximum flow cut.
Graph segmentation produces Volume (U) and Volume (V), which represent the sums of costs of edges connected to U and V, respectively.
3.3 Feature Based Extraction of Fundus Image
From feature extraction, some of the features like statistical, texture, HOG & SIFT are extracted, [27] among this the statistical features are
Mean: In image processing, the pixel value in the image is the prime factor, in which the overall add of pixel value or brightness value (B) in a segmented image per total count of pixel (C) is called as mean (μ) of the sliced image.
Variance: The measurement of differences from the pixel’s mean value is called the variance of the segmented image, this is mentioned as (X). Its square root (X2) is defined by standard deviation
Steps:
1. Calculate the average value of the specific segmented image.
2. Finding the difference of segmented image mean value from every pixel in an image.
3. Calculate the squaring of every deviation away from the mean of the segmented image.
4. Find the total addition of each one squaring value.
5. Divide the entire number of pixels by the addition of squares.
Probability Density Functions (PDF) are used to extract the texture characteristics. The Probability density is computed using GLDM from different images [28] rather than the original image.
The following are the steps involved in GLDM feature extraction:
1. Accessing the image that has been segmented [29] for feature extraction.
2. Calculating image dissimilarity.
I–is the input images
Δi, Δj–spotted position of image while incrementation.
3. The probability density function of d (m, n) is used to extract the texture characteristics in four different directions such as (0°, 45°, 90° and 135°).
4. Creating a feature vector by joining the derived characteristics such as difference, average, and variance.
3.3.3 Histogram of Oriented Gradients (HOG) Features
The characteristics of the lesion play a key role in proper disease prediction of DR, and this may be handled via HOG feature extraction. The HOG feature descriptor involves the following steps: 1) Image is separated into blocks 2) Using the mask for both longitudinal and transverse directions and calculating the gradation level 3) Measuring the number of times gradient direction appears. 4) The final values are standardized. 5) PCA is taken to reduce the number of features.
3.3.4 Scale Invariant Feature Transforms (SIFT)
SIFT is a seven-stage procedure that results in a huge number of properties such as illumination constant, scaling constant, and rotation constant in the brightness of the segmented image. As a result, this might work for a wide range of image resolutions [30], and the classifier output will be more accurate. The difference between Gaussians is used to discover the location of solid important things in this image processing. 1) Scale-space is defined by performing a convolution method on the input image and the variable of the Gaussian mixture. 2) Calculating the variation among Gaussians. 3) Determining localized maximum and minimum values. 4) Using the Laplacian algorithm, eliminate unnecessary key points. 5) An orientation histogram is created by assigning important locations orientation according to magnitudes and angles of the gradient. 6) Creating the new feature-based vector. 7) Standardising the feature-based vector.
3.4 Classification of Fundus Image
After the feature extraction, the fundus images are processed into a classification using different Machine Learning classifiers such as the K-NN classifier, SVM with PCA, and CRF hybrid classifiers. The classifiers are trained and validated using the extracted features. About 500 fundus image data sets are taken for training and 600 fundus data sets for testing the lesions.
Once the images are acquired and stored for the training process and then the images are classified into various categories which must be identical to the acquired image. Calculating the image pixel’s neighborhood relationship and similarity from each K-NN, Euclidean, and Manhattan distance. This finding plays a typical role, but it’s a large scale for finding the nearest neighbor distances.
3.4.2 Cascaded Rotation Forest
We adopted a rotating forest classifier because of the benefits of integrating the overall prediction of numerous base classifiers, lowering variance and error in the end. The following are the steps involved in creating a CRF classifier:
N: It is the numerical value of how many classifiers are used in classification (C1, C2,… ,CN)
T: It is the training fundus data set.
L: It represents the label of class.
d: The classifiers provide a probability per each data set.
for i = 1: N
o Assigning base classifiers as decision trees: Ci
o Build training data for the decision tree-based classifiers
- The separate feature set S into M subsets: Sij
for j = 1:M
for the features in Si,j
Discard random subsets and select bootstrap sample from Ti,j to get T’i,j
Apply PCA to T’i,j and extract principle components
end for
construct the rotation matrix Ri,
– Build classifiers Ci, using (TRi, L)
end for
Output
Based on the largest confidence level for an input x, assign it to a class,
Statistical learning is a theory that analyses the law of machine learning in the context of a minimal training sample. It introduces the Support Vector Machine, a novel classification approach with maximal hyper-plane edge separation. This section delves into the statistical analysis approach known as Principal Component Analysis (PCA). This strategy is utilized to master the principal contradiction of things. It may extract the main components from a variety of sources and show their essence. Fig. 7 shows the fundus image classification diagram.
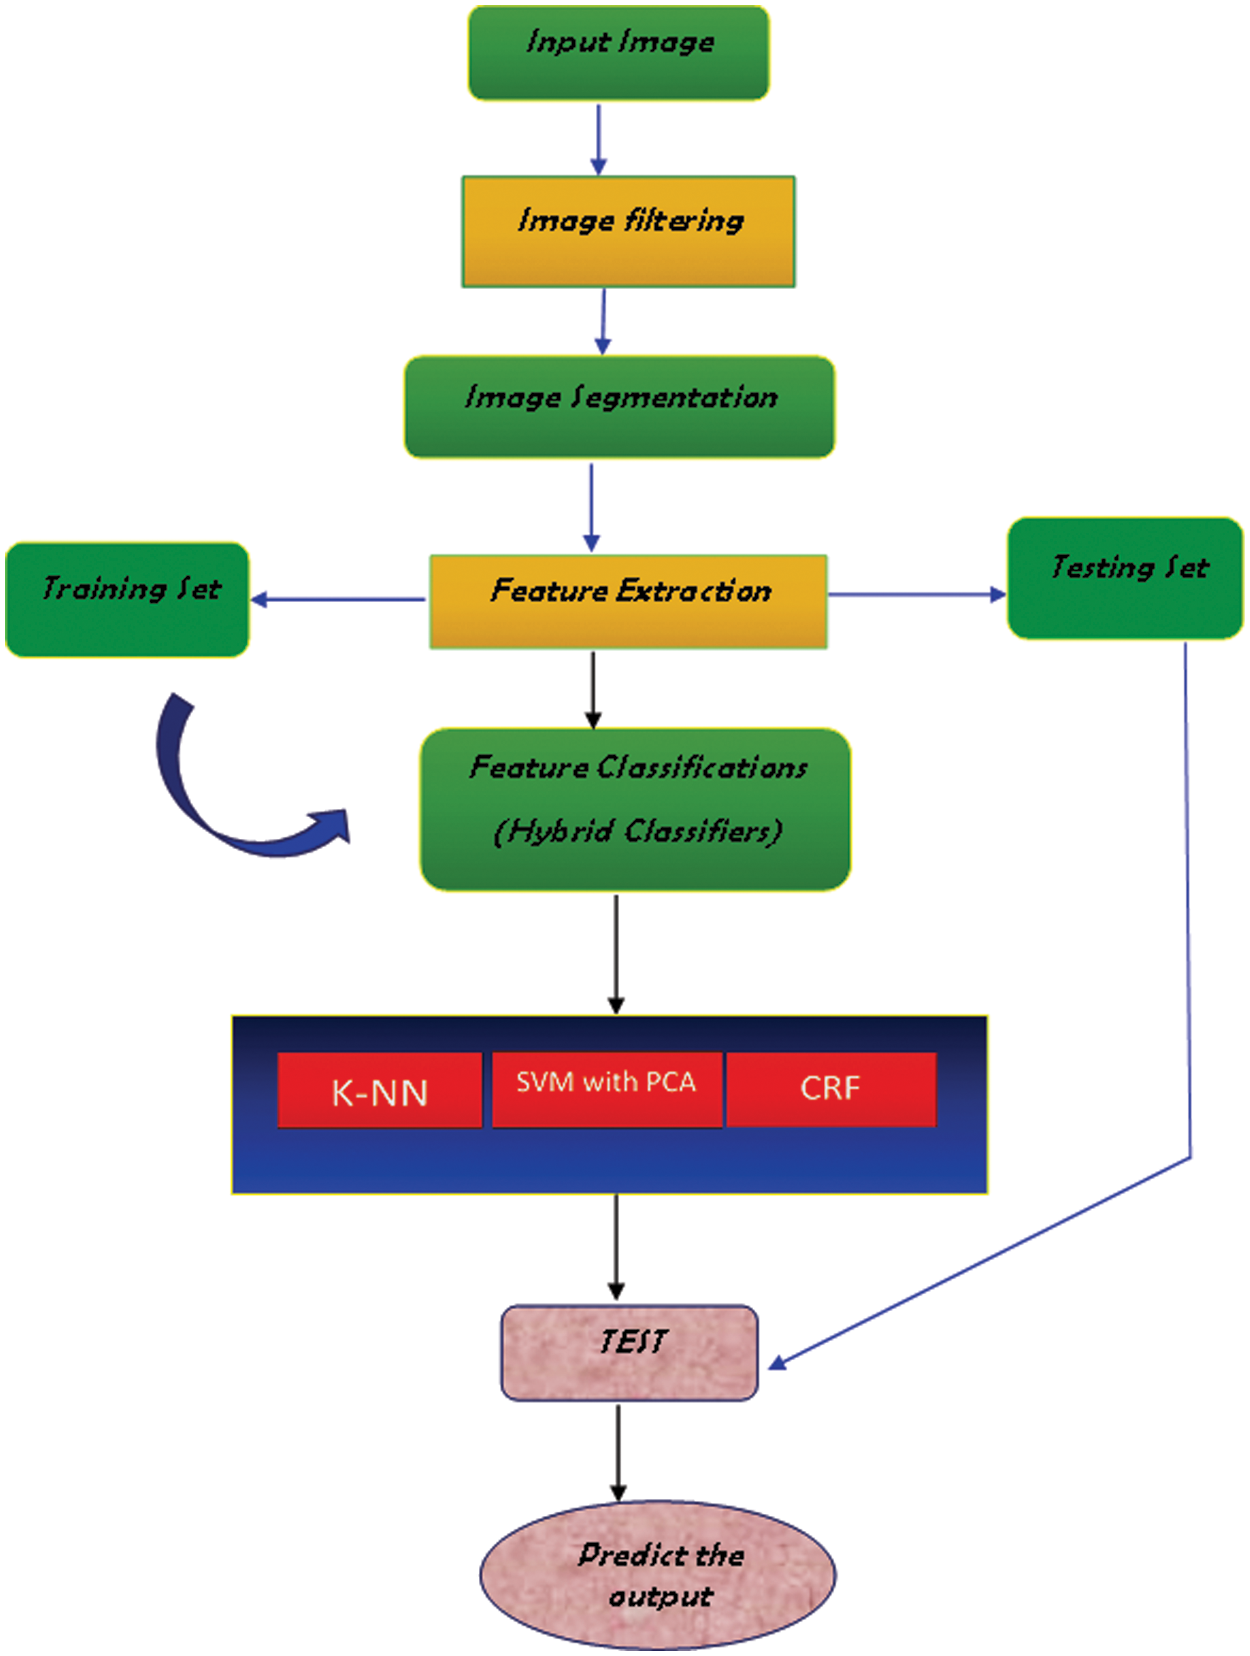
Figure 7: Block diagram of the fundus image classification
The proposed research work is to detect the stages of Microaneurysms, Hemorrhages, and Exudates of lesions by which the DR is diagnosed. The methodology used here is to expand the blood vessels and conduct Graph cut segmentation to the background and foreground pixel placement. The performance of the segmentation is measured by the accuracy rate. It shows a solution to the binary problem in which the segmentation of graph cuts is used to detect exudates regions. Fig. 8 shows the outcome of the segmented images using the graph cut algorithm
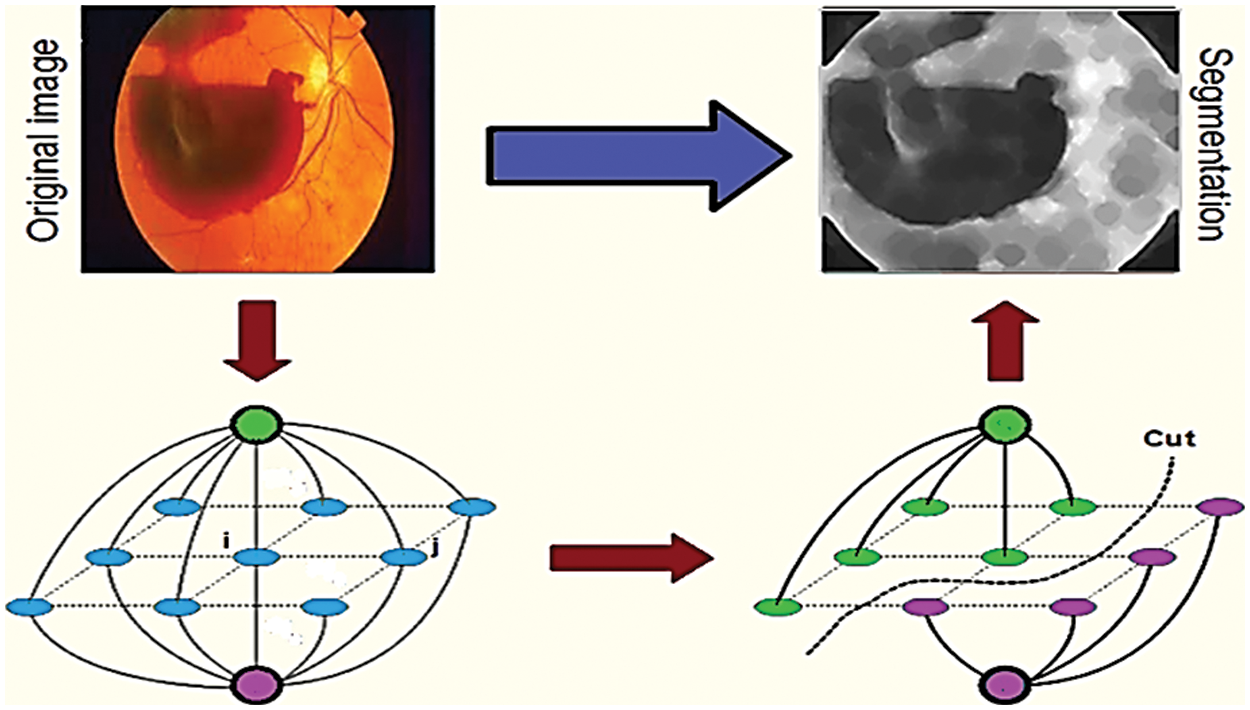
Figure 8: Segmented images using graph cut algorithm
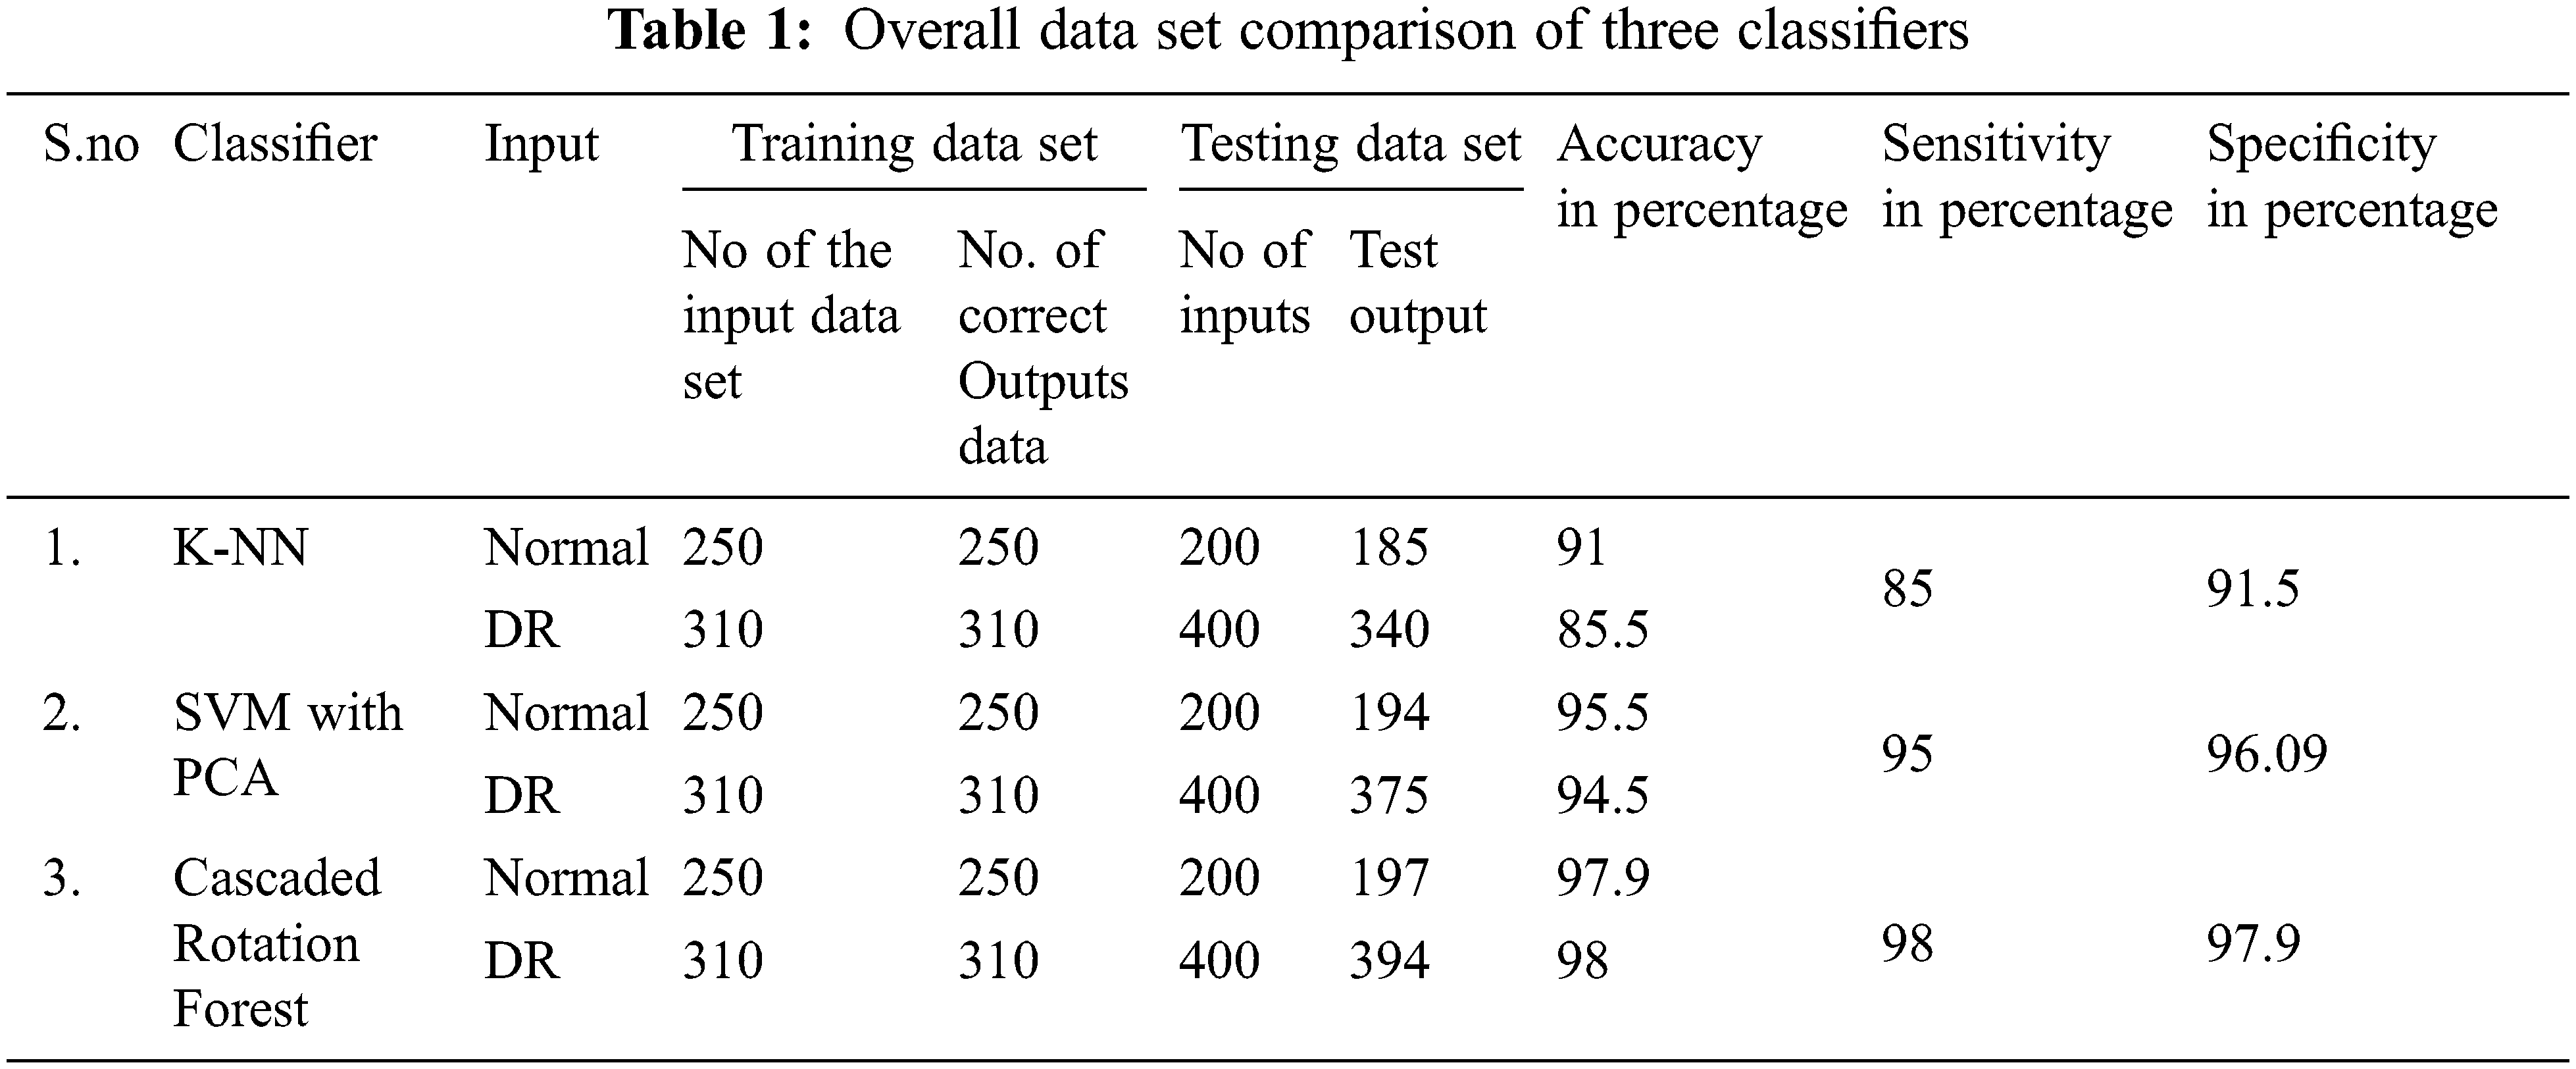
Fig. 9 represents the performance analysis of accuracy rate with different algorithms. In the segmentation of images, a graph-cut-based segmented algorithm is improved by 6.81% in its performance when compared with the existing algorithm as edge detection, DNN, and marker-controlled watershed. To determine the Diabetic Retinopathy’s severity and normality three classifier models are used: K-NN, SVM with PCA, and Cascaded Rotation Forest, which uses a hybrid feature set for all these classifiers to train. Due to these hybrid feature sets the classifier’s accuracy level is greatly increased. The following parameters as sensitivity, specificity, and accuracy of each of the three classifiers are compared which results in a good performance. Among this cascaded rotation, the forest classifier has more accountability for correctly categorizing the majority of the input image with excellent accuracy and sensitivity, and graphical representation of normal and abnormal DR cells through the proposed method which is shown in Fig. 10. Tab. 1, shows the number of normal and DR images that were used to train and evaluate the three classifiers.
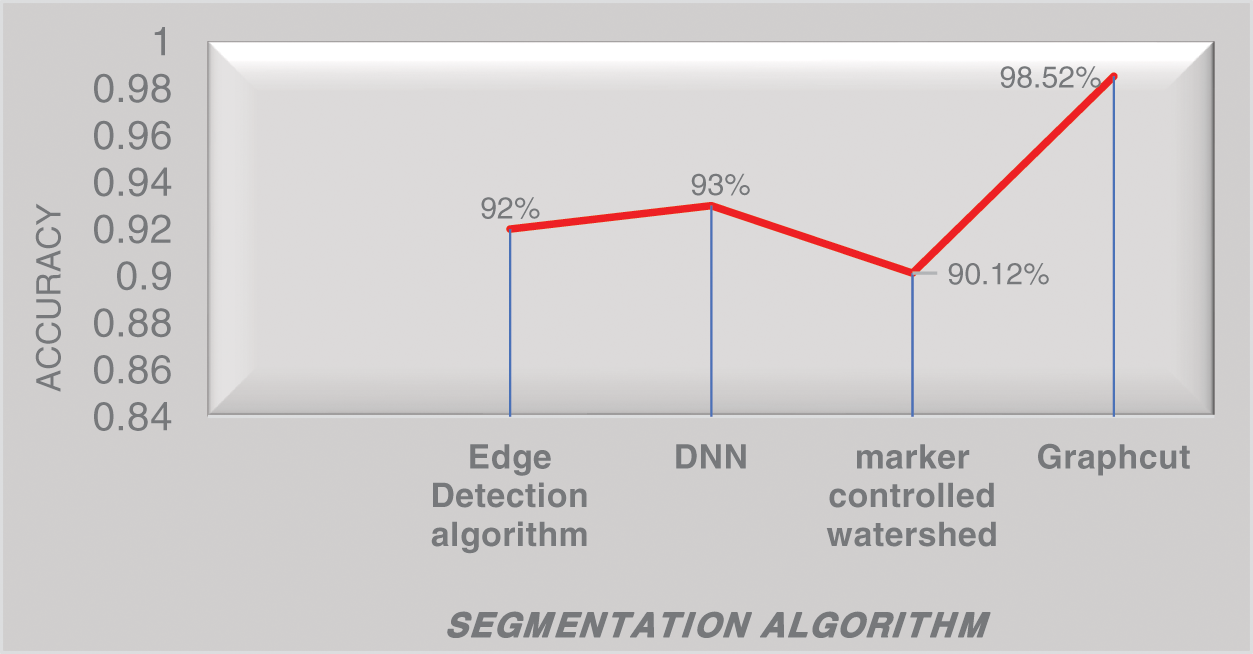
Figure 9: Performance analysis of accuracy rate with different algorithms
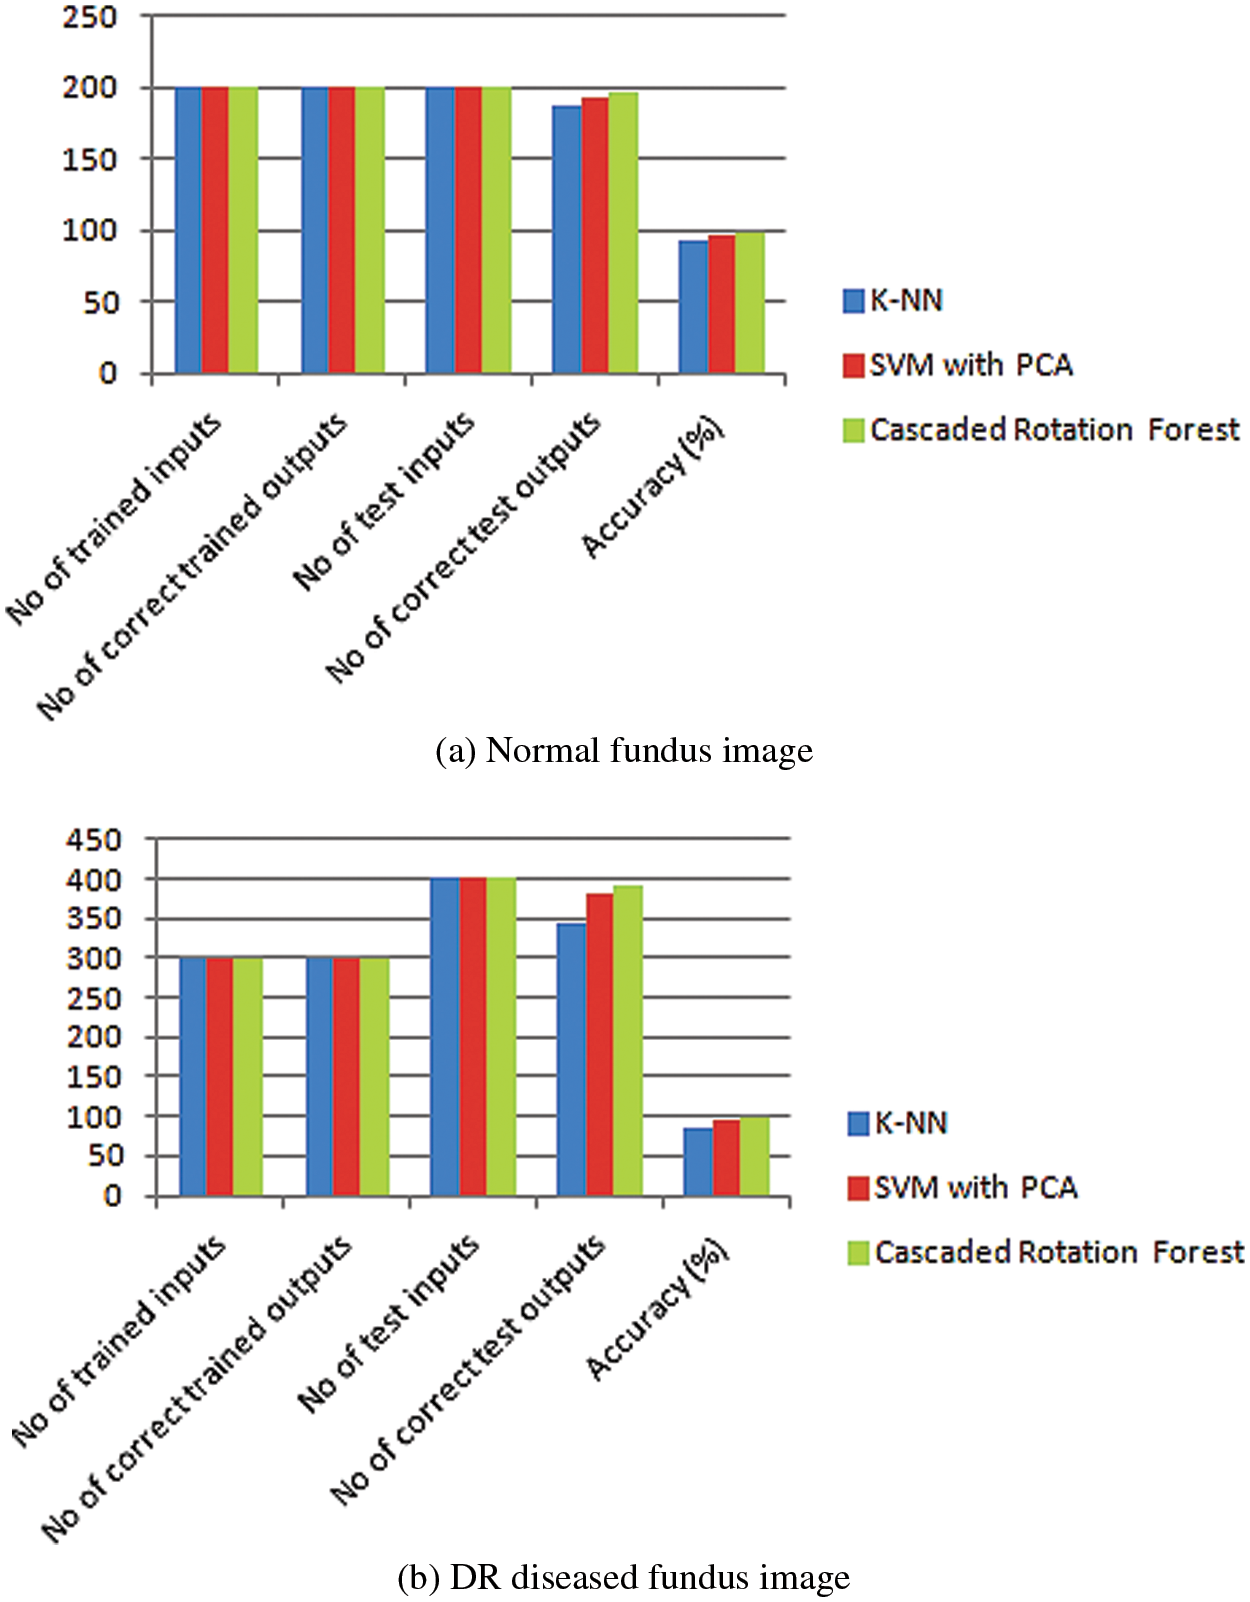
Figure 10: Graphical representation of normal vs. abnormal DR
The graphical representation of both the normal and the disease-funded image is given by training the input images and then testing them using a trained data with a better accuracy rate. The normal fundus image is tested with 98% accuracy and the DR disease funded image is tested with an average of 98% accuracy.
Based on the following KNN classifier, Support Vector Machine (SVM) with PCA and Cascaded Rotation Forest classifiers, the performance parameters like sensitivity and specificity are graphically figured out in Fig. 11. The graphical representation of the sensitivity for K-NN is 86%, which is improved by 95% and 98% in SVM with PCA and CRF classifiers. As the performance of the specificity for the K-NN, SVM with PCA, and CRF hybrid classifiers is 92%, 96%, and 98%. The analysis is made with different detection algorithms with their performance parameters given in the table below.
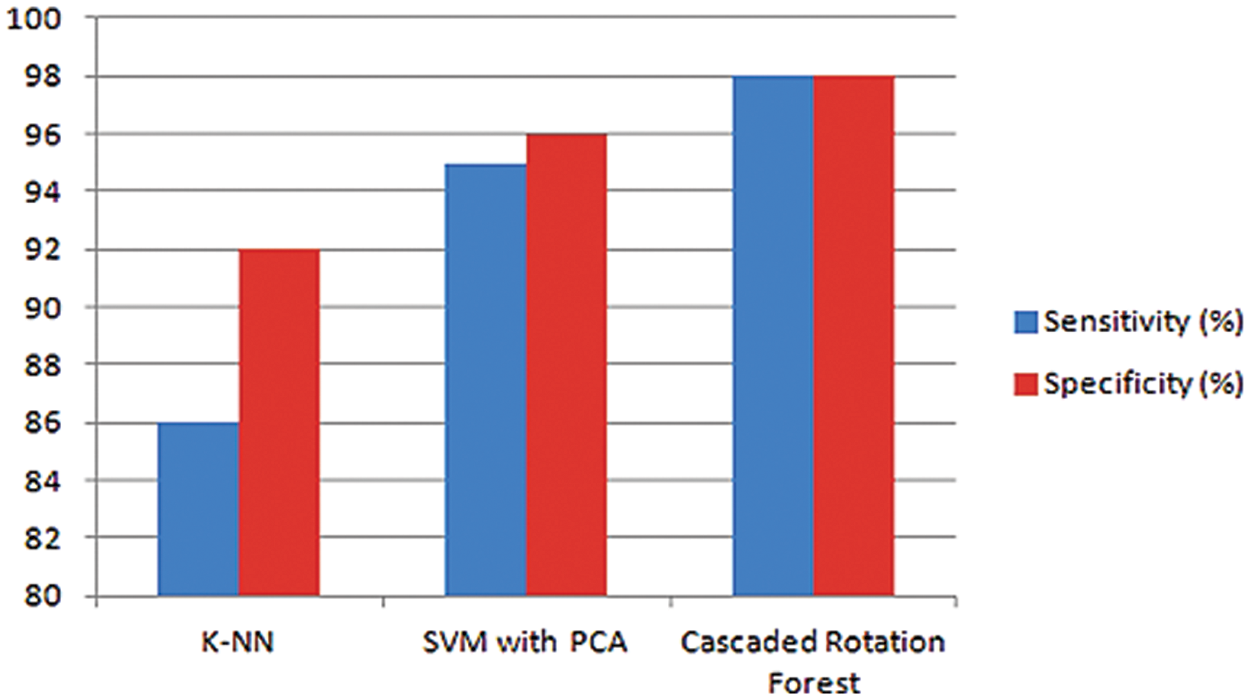
Figure 11: Graphical depiction of sensitivity and specificity for three classifiers
Through the analysis of three classifiers, the spotting and categorization of Microaneurysms, Hemorrhages, and Exudates stages in DR were identified inevitably and its final resultant comparison is depicted in Fig. 12.
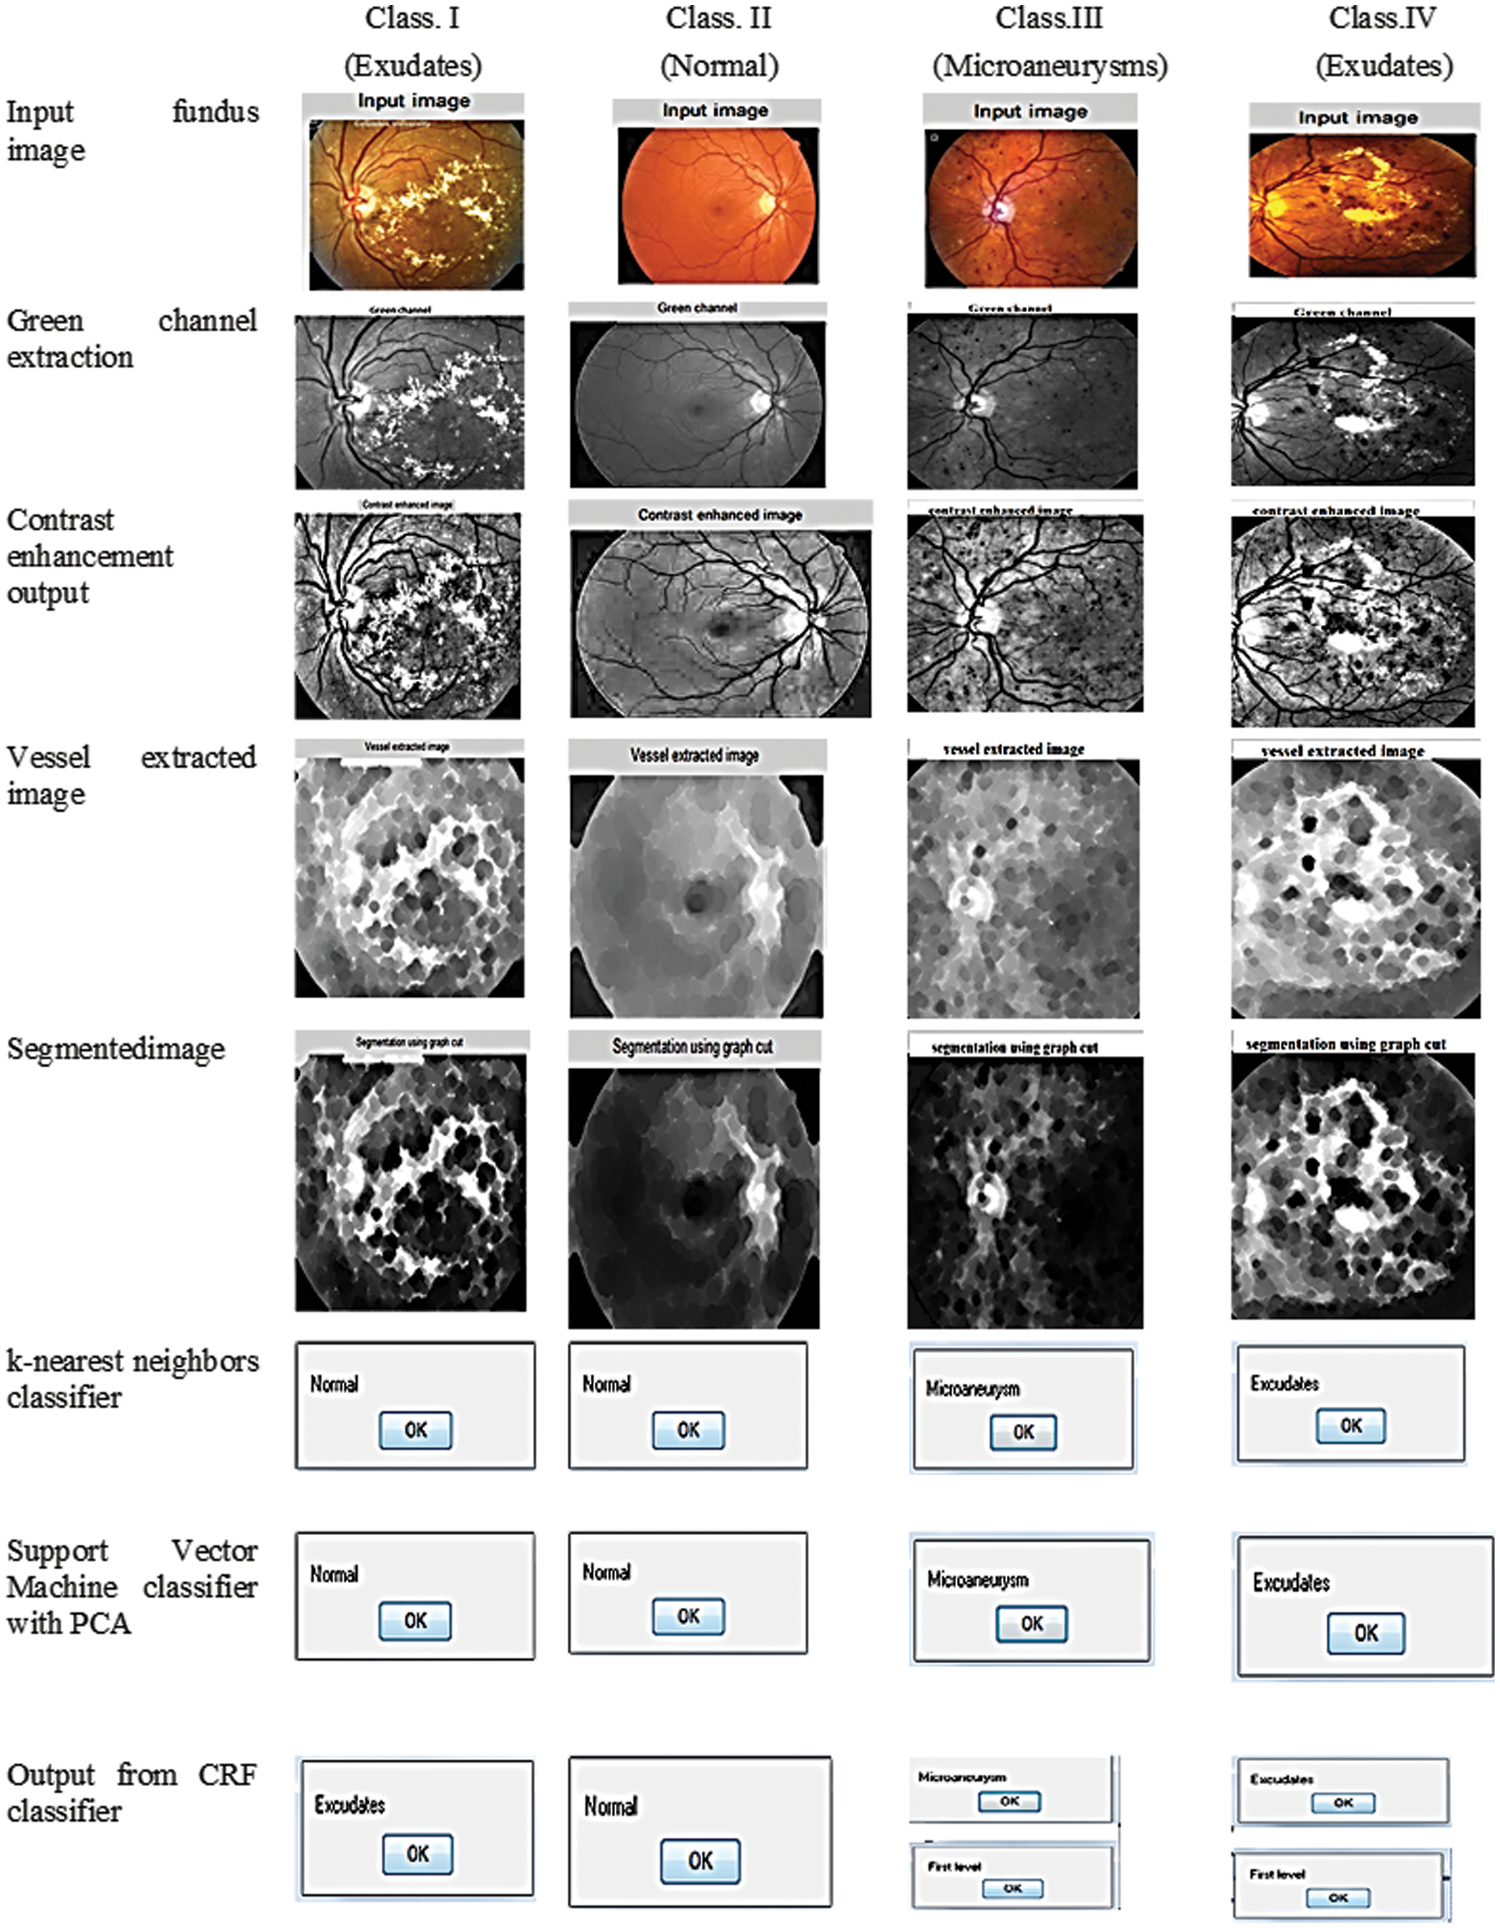
Figure 12: Detection resultant of the fundus image
From the KNN and SVM approach along with PCA classifier analysis, it identifies exudates condition is normal, but in CRF classifier output is positive for exudates, and this CRF classifier rectification is accurate while comparing with other classifiers which are demonstrated in Class I of Fig. 12, At the same time other identification of normal fault less fundus image is correctly identified in Class II of Fig. 12, similarly, Class III and Class IV correctly identified microaneurysms as microaneurysms and exudates. Above all these comparisons and decisions of the classifier evidence that our proposed system had outperformed the previous research work and this successful outcome is explicit from the adequate progress of sensitivity, specificity, and accuracy, which is tabulated in Tab. 2.
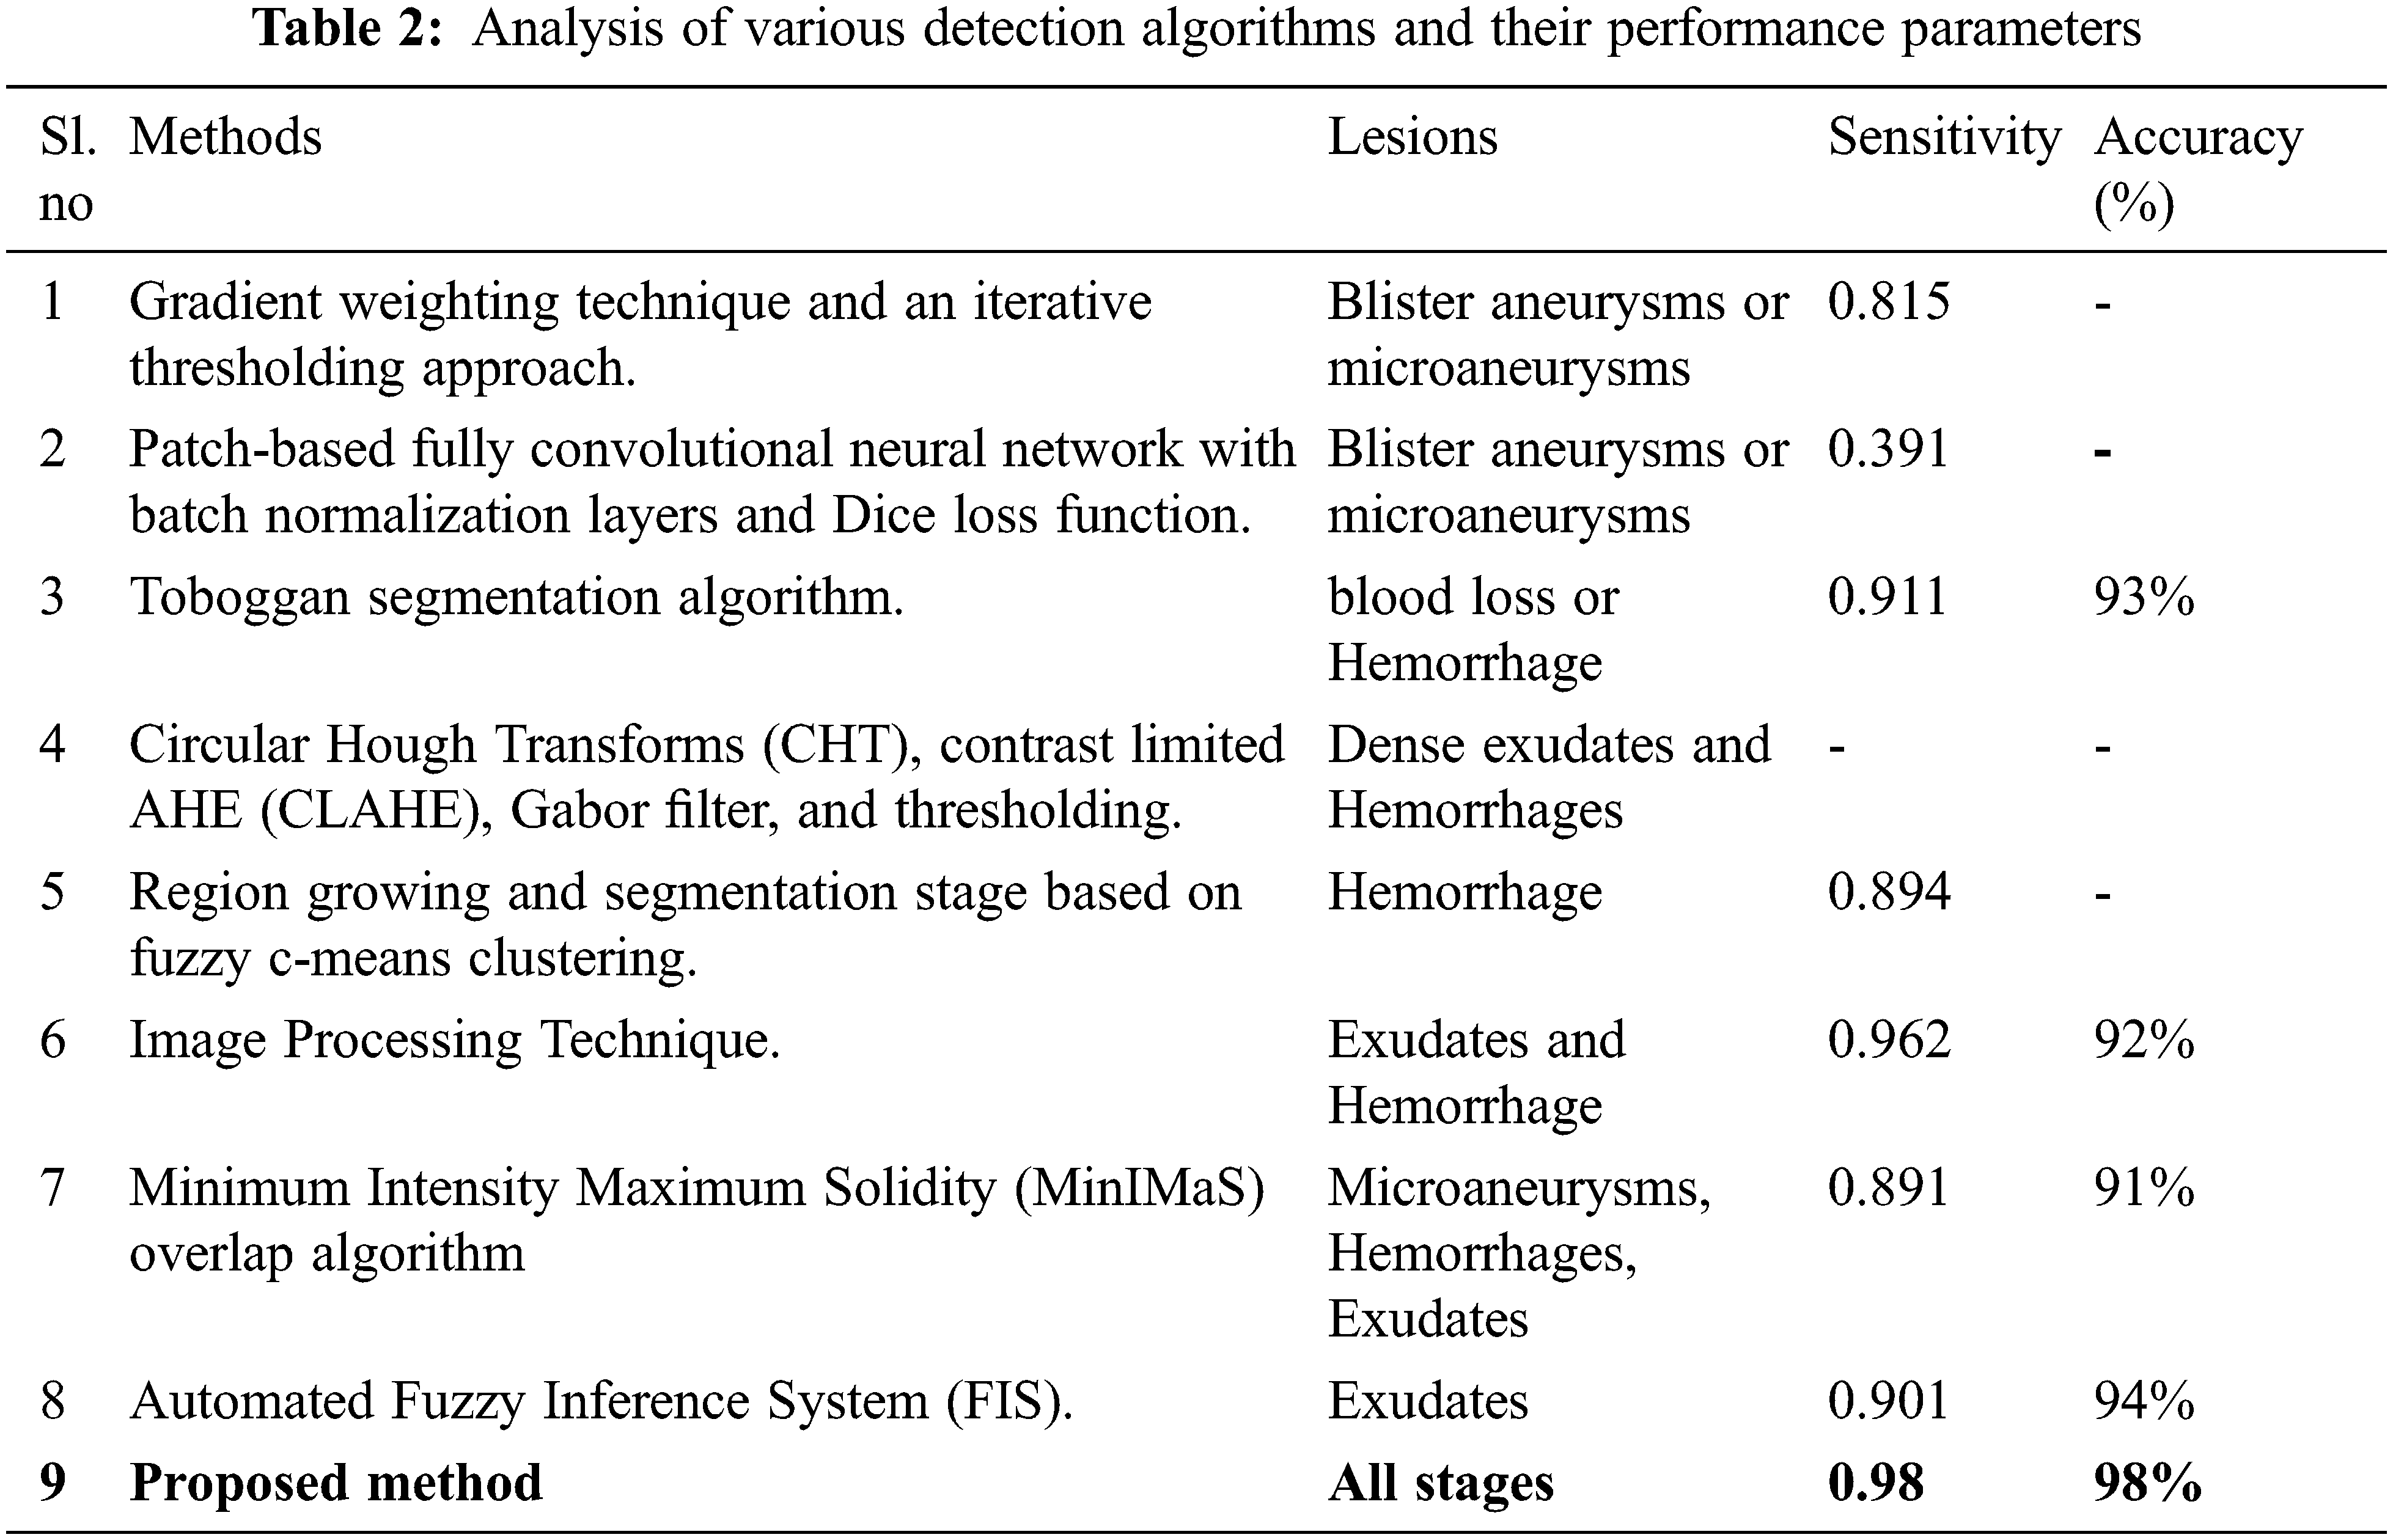
In this research paper, the implemented hybrid classifier of accurate cross-validation has the capability of detecting the DR at its initial level of abnormality through the identification of Microaneurysms, Hemorrhages, and Exudates in the fundus image lesion. In this, the hybrid classifiers were used to examine the intense level of DR from the performance parameters carried out through a comparison with different classifier methodologies. Based on the previous research works justification of all stages, severity, and detection of DR from the lesion is not possible for all the methodologies. The proposed algorithm of specific Graph theory segmentation and hybrid classification processing mainly focuses on detecting the DR of all lesion stages through the identification of Microaneurysms, Hemorrhages, and Exudates. Therefore, the hybrid K-NN, SVM, and Cascaded Rotation Forest classifiers enact comparison and achieve the accuracy of 98%. Among these Cascaded Rotation Forest classifier plays a vital role in terms of accuracy as it is a perfect automated DR classifier for a distinct stage of lesions. This work may have a future extension in the area of the proliferative stage of DR while detecting the DR stages of the lesion and the detection of DR in an early stage may be carried out by modern OCT scan methods based on hybrid deep learning methods.
Acknowledgement: We would like to thank the supervisors and the anonymous referees for their kind help in this research.
Funding Statement: The authors received no specific funding for this study.
Conflicts of Interest: The authors declare that they have no conflicts of interest to report regarding the present study.
References
1. B. Dashtbozorg, J. Zhang, F. Huang and B. M. T. H. Romeny, “Retinal microaneurysms detection using local convergence index features,” IEEE Transactions on Image Processing, vol. 27, no. 7, pp. 3300–3315, 2018. [Google Scholar]
2. P. Chudzik, S. Majumdar, F. Calivá, B. A. Diri and A. Hunter, “Microaneurysm detection using fully convolutional neural networks,” Computer Methods and Programs in Biomedicine, vol. 158, pp. 185–192, 2018. [Google Scholar]
3. A. P. Bhatkar and G. U. Kharat, “Detection of diabetic retinopathy in retinal images using MLP classifier,” in Proc. Int. Symp. on Nano Electronic and Information Systems, Indore, India, pp. 331–335, 2015. [Google Scholar]
4. A. Biran, P. S. Bidari and K. Raahemifar, “Automatic method for exudates and hemorrhages detection from fundus retinal images,” International Journal of Computer and Information Engineering, vol. 10, no. 9, pp. 1599–1602, 2016. [Google Scholar]
5. M. Jahiruzzaman and A. A. Hossain, “Detection and classification of diabetic retinopathy using k-means clustering and fuzzy logic,” in Proc. 18th Int. Conf. on Computer and Information Technology (ICCIT), Dhaka, Bangladesh, pp. 534–538, 2015. [Google Scholar]
6. S. Karkuzhali and D. Manimegalai, “Retinal haemorrhages segmentation using improved toboggan segmentation algorithm in diabetic retinopathy images,” Biomedical Research, vol. 1, no. 1, pp. 23–30, 2018. [Google Scholar]
7. D. Sahu and S. Meshram, “Automatic detection of hemorrhages using image processing technique,” International Journal of Engineering Sciences & Research Technology, vol. 5, no. 6, pp. 853–857, 2016. [Google Scholar]
8. K. S. Argade, K. A. Deshmukh, M. M. Narkhede, N. N. Sonawane and S. Jore, “Automatic detection of diabetic retinopathy using image processing and data mining techniques,” in Proc. Int. Conf. on Green Computing and Internet of Things (ICGCIoT), Greater Noida, India, pp. 517–521, 2015. [Google Scholar]
9. A. Ahmad, A. B. Mansoor, R. Mumtaz, M. Khan and S. H. Mirza, “Image processing and classification in diabetic retinopathy: A review,” in Proc. 5th European Workshop on Visual Information Processing (EUVIP), Paris, France, pp. 1–6, 2014. [Google Scholar]
10. W. Sun, W. Zhang, G. Zhang, X. Zhang and N. Ge, “Fine-grained vehicle type classification using lightweight convolutional neural network with feature optimization and joint learning strategy,” Multimedia Tools and Applications, vol. 80, no. 20, pp. 30803–30816, 2021. [Google Scholar]
11. W. Sun, X. Chen, X. Zhang, G. Dai, P. Chang et al., “A Multi-feature learning model with enhanced local attention for vehicle re-identification,” CMC-Computers Materials & Continua, vol. 69, no. 3, pp. 3549–3561, 2021. [Google Scholar]
12. C. Valverde, M. Garcia, R. Hornero and M. I. L. Galvez, “Automated detection of diabetic retinopathy in retinal images,” Indian Journal of Ophthalmology, vol. 64, no. 1, pp. 26, 2016. [Google Scholar]
13. K. Somasundaram and P. A. Rajendran, “Diagnosing and ranking retinopathy disease level using diabetic fundus image recuperation approach,” The Scientific World Journal, vol. 2015, pp. 1–8, 2015. [Google Scholar]
14. A. Sopharak, B. Uyyanonvara and S. Barman, “Simple hybrid method for fine microaneurysm detection from non-dilated diabetic retinopathy retinal images,” Computerized Medical Imaging and Graphics, vol. 37, no. 5–6, pp. 394–402, 2013. [Google Scholar]
15. R. Ghosh, K. Ghosh and S. Maitra, “Automatic detection and classification of diabetic retinopathy stages using CNN,” in Proc. Int. Conf. on Signal Processing and Integrated Networks (SPIN), Noida, India, pp. 550–554, 2017. [Google Scholar]
16. M. Shaban, Z. Ogur, A. Mahmoud, A. Switala, A. Shalaby et al., “A convolutional neural network for the screening and staging of diabetic retinopathy,” Plos One, vol. 15, no. 6, pp. 0233514, 2020. [Google Scholar]
17. T. A. Soomro, M. Paul, J. Gao and L. Zheng, “Retinal blood vessel extraction method based on basic filtering schemes,” in Proc. 2017 IEEE Int. Conf. on Image Processing (ICIP), Beijing, China, pp. 4422–4426, 2017. [Google Scholar]
18. S. Gayathri, V. P. Gopi, and P. Palanisamy, “Diabetic retinopathy classification based on multipath CNN and machine learning classifiers,” Physical and Engineering Sciences in Medicine, vol. 44, no. 3, pp. 639–653, 2021. [Google Scholar]
19. R. Jaichandran, V. Sivasubramanian, J. Prakash and M. Varshni, “Detection of diabetic retinopathy using convolutional neural networks,” ECS Transactions, vol. 107, no. 1, pp. 13321, 2022. [Google Scholar]
20. D. Yadav, A. K. Karn, A. Giddalur, A. Dhiman, S. Sharma et al., “Microaneurysm detection using color locus detection method,” Measurement, vol. 176, pp. 109084, 2021. [Google Scholar]
21. D. R. Ramji, C. A. Palagan, A. Nithya, A. Appathurai and E. J. Alex, “Soft computing based color image demosaicing for medical image processing,” Multimedia Tools and Applications, vol. 79, no. 15, pp. 10047–10063, 2020. [Google Scholar]
22. S. Morales, K. Engan, V. Naranjo and A. Colomer, “Retinal disease screening through local binary patterns,” IEEE Journal of Biomedical and Health Informatics, vol. 21, no. 1, pp. 184–192, 2015. [Google Scholar]
23. S. N. Kumar, A. Ahilan, A. K. Haridhas and J. Sebastian, “Gaussian hermite polynomial based lossless medical image compression,” Multimedia Systems, vol. 27, no. 1, pp. 15–31. 2021. [Google Scholar]
24. S. Sudha and A. Srinivasan, “Unravelling diabetic retinopathy through image processing, neural networks, and fuzzy logic: A review,” Asian Journal of Pharmaceutical and Clinical Research, vol. 10, pp. 32–37, 2017. [Google Scholar]
25. A. Ahilan, G. Manogaran, C. Raja, S. Kadry, S. N. Kumar et al., “Segmentation by fractional order darwinian particle swarm optimization based multilevel thresholding and improved lossless prediction based compression algorithm for medical images,” IEEE Access, vol. 7, pp. 89570–89580, 2019. [Google Scholar]
26. G. R. Sreekanth, R. S. Latha, R. C. Suganthe, S. Sivakumar, N. Swathi et al., “Automated detection and classification of diabetic retinopathy and diabetic macular edema in retinal fundus images using deep learning approach,” NVEO-Natural Volatiles & Essential Oils Journal| NVEO, vol. 8, no. 5, pp. 61–70, 2021. [Google Scholar]
27. S. Kumar, A. Adarsh, B. Kumar and A. K. Singh, “An automated early diabetic retinopathy detection through improved blood vessel and optic disc segmentation,” Optics & Laser Technology, vol. 121, pp. 105815, 2020. [Google Scholar]
28. P. Joshi, K. S. Raj and J. Alike, “Optic disc localization using interference map and localized segmentation using grab cut,” Automatika, vol. 62, no. 2, pp. 187–196, 2021. [Google Scholar]
29. W. Kusakunniran, Q. Wu, P. Ritthipravat and J. Zhang, “Hard exudates segmentation based on learned initial seeds and iterative graph cut,” Computer Methods and Programs in Biomedicine, vol. 158, pp. 173–183, 2018. [Google Scholar]
30. S. Ramkumar and G. Sasi, “Detection of diabetic retinopathy using OCT image,” Materials Today: Proceedings, vol. 47, pp. 185–190, 2021. [Google Scholar]
Cite This Article
 Copyright © 2023 The Author(s). Published by Tech Science Press.
This work is licensed under a Creative Commons Attribution 4.0 International License , which permits unrestricted use, distribution, and reproduction in any medium, provided the original work is properly cited.
 Downloads
 Citation Tools