
 Submit a Paper
 Propose a Special lssue
 Open Access
ARTICLE

DERNNet: Dual Encoding Recurrent Neural Network Based Secure Optimal Routing in WSN
1 School of Computer Science and Engineering, Vellore Institute of Technology, Chennai, India
2 Centre for Cyber Physical Systems & School of Computer Science and Engineering, Vellore Institute of Technology, Chennai, India
* Corresponding Author: S. Asha. Email:
Computer Systems Science and Engineering 2023, 45(2), 1375-1392. https://doi.org/10.32604/csse.2023.030944
Received 06 April 2022; Accepted 26 May 2022; Issue published 03 November 2022
 View Full Text
 Download PDF
Abstract
A Wireless Sensor Network (WSN) is constructed with numerous sensors over geographical regions. The basic challenge experienced while designing WSN is in increasing the network lifetime and use of low energy. As sensor nodes are resource constrained in nature, novel techniques are essential to improve lifetime of nodes in WSN. Nodes energy is considered as an important resource for sensor node which are battery powered based. In WSN, energy is consumed mainly while data is being transferred among nodes in the network. Several research works are carried out focusing on preserving energy of nodes in the network and made network to live longer. Moreover, this network is threatened by attacks like vampire attack where the network is loaded by fake traffic. Here, Dual Encoding Recurrent Neural network (DERNNet) is proposed for classifying the vampire nodes s node in the network. Moreover, the Grey Wolf Optimization (GWO) algorithm helps for transferring the data by determining best solutions to optimally select the aggregation points; thereby maximizing battery/lifetime of the network nodes. The proposed method is evaluated with three standard approaches namely Knowledge and Intrusion Detection based Secure Atom Search Routing (KIDSASR), Risk-aware Reputation-based Trust (RaRTrust) model and Activation Function-based Trusted Neighbor Selection (AF-TNS) in terms of various parameters. These existing methods may lead to wastage of energy due to vampire attack, which further reduce the lifetime and increase average energy consumed in the network. Hence, the proposed DERNNet method achieves 31.4% of routing overhead, 23% of end-to-end delay, 78.6% of energy efficiency, 94.8% of throughput, 28.2% of average latency, 92.4% of packet delivery ratio, 85.2% of network lifetime, and 94.3% of classification accuracy.Keywords
Network is a collection of interconnected nodes developed for a special purpose. Based on the medium used for communication, network is categorized as either wired or wireless. A wireless sensor network (WSN) is a successor of wireless network emerged with different kinds of interconnected sensors [1]. These sensor nodes are related to each other using peer to peer or clustering structure. The former provides equal rights for every network node with open connection priority. The latter provides well planned interconnectivity and assigns a node specifically for controlling nodes in specific area [2]. This specific node is termed as base station (BS).
The nodes in the network are generally strong and have the ability to combine data and route the data back to BS [3]. Mostly, sensors contain four components namely a sensing, processing, power and transceiver units. Moreover, based on the application few additional components like a system to find the location, mobilize and power generator are used. Military applications motivated to develop a WSN for battlefield surveillance; but nowadays these networks are employed in different consumer and industrial applications [4]. These monitor the conditions of the environment, performance of the industry, and troop deployment particularly for naming some applications. WSN plays a crucial role in people lives today and even in organizations; thus faults are less.
A critical property of these networks is high availability which must be efficient even under malicious situation [5]. In particular, WSN is vulnerable to denial of service (DoS) attacks and thus several researches are carried out to improve survivability [6]. In the network, attacks are prevented on short term availability but not with long-term availability. Battery of the nodes gets exhausted completely due to DoS attack [7]. When considering battery a resource, this is the resource depletion attack. Even though protocols are designed to provide security, they are weak to provide protection against Vampire attacks [8]. Those assaults are not unique to any routing protocol and hence are not based on standard design concepts or execution flaws, but rather on common protocol aspects such as link-state, distance vector, source routing, geographic and beacon routing [9]. Those assaults do not rely on flooding a wide network; instead, they send only a small amount of data, resulting in the greatest energy loss, preventing a rate controlling approach [10]. As Vampire attacks utilize protocol-compliant messages, detecting and preventing these attacks are difficult. This paper focuses on contributing the following,
• The malicious activity in the network is detected by using Dual Crypto Recurrent Neural network, that is adapted to transformation of data and obtain a relatively reliable trust value irrespective of the data exchange.
• Selection of optimal route using Grey wolf optimization algorithm with the formation of maximization fitness function with objectives like node energy, distance, density and delay within the cluster.
This paper is presented as: Section 1 describes the background of vampire attacks in WSNs and the role of optimization algorithms for conserving energy. In Section 2, the literature for securable and optimal routing in WSN is explained. Section 3 explains the proposed neural network for classifying the vampire nodes and optimal path construction using Grey Wolf Optimization algorithm. In Section 4, the experimental analysis is given with graphs by comparing with three standard methods. Finally, the paper ends with Section 5 presenting conclusion and future enhancing work.
In [11], fault tolerance was integrated with secured routing mechanism which was termed as fault tolerant secured routing. FASRI, an integrated approach established secured routes from source to destination even when node conditions are faulty. Battery power and interference models helped in identifying the faulty nodes. Non-compromised trustworthy nodes are identified from fault-free nodes using agent-based trust model. At last, through non-compromised fault-free nodes, data are routed securely. In [12], Secure Atom Search Routing (SASR) method was introduced which is based on the KIDSASR (Knowledge and Intrusion Detection based Secure Atom Search Routing) protocol. This protocol offered best solutions for global optimization problems based on the interaction force and constraints of atoms. By balancing exploitation and exploration properly, the performance of SASR was enhanced. Moreover, there was a reduction in computational complexity and improvement in network lifetime.
In [13], an energy-efficient multipath routing (EEMR) protocol was developed which determined the optimum path using multi-objective lion optimization algorithm and the energy consumed was very less. The main focus was on satisfying the quality requirements like throughput, delay, packet loss and delivery ratio, energy consumption and latency. In [14], multidimensional scaling-map (MDS-MAP) optimal routing approach measured the trust model through fuzzy logic. In [15], energy aware trust based secure routing protocol was designed where the evaluated trust score was used for effectively identifying the malicious users and spatio-temporal constraints along with decision tree approach was used to select the optimal route. In [16], a novel Risk-aware Reputation-based Trust (RaRTrust) framework was developed which used reputation and risk for estimating the reliability of a network node. Risk evaluation dealt with spoiling of nodes making RaRTrust model robust to on-off attack while the other trust models focused on reputation alone. In [17], an activation function-based trusted neighbor selection (AF-TNS) was introduced to improve the security for resource-constrained WSNs. This operates under two phases namely trust evaluation with energy constraint and node evaluation based on additive metrics for maintaining the reliability of the neighboring nodes. The complex process of decision-making was simplified by using random transigmoid function and trusted and un-trusted node was distinguished to maintain the performance of the network. In [18,19] suggested a bio-inspired and trust-oriented cluster head selection strategy for WSN. The Bat Optimization Algorithm (BOA) is being used to pick the cluster heads depending on 3 variables: transmission power, reference value, and the number of clusters. A trust model is developed and then used to calculate a degree of trust for every node. The suggested framework is energy saving, according to numerical simulations.
In [20] a Semi-Markov method is adopted by combined energy and trust evaluation prediction scheme dubbed high fractal durability criterion cluster formation for improved lifespan. It outperforms the cluster head election methods by increasing network lifetime and lowering energy usage by 28% and 34%, respectively. In [21], a layer-by-layer taxonomy of security attacks is explored, as well as possible mitigation strategies were comprehended about the assaults and their severity.
By analyzing the above literatures, some of the problems are identified. The multi attribute algorithm is based on the instances where any node may belong to any instance providing it seems or forward instance associated with traffic. Thus, the nodes must be active when assigned to traffic and to the other participating instances. In particular, the first one reduces the overall network performance as node density is reduced. Moreover, it may leads to wastage of energy due to vampire attack, which further reduce the lifetime and increase average energy consumed in the network. The aforementioned shortcomings of the literature motivated the formulation of the proposed DERNNet method discussed in the forthcoming section.
The wireless sensor network is constructed in adhoc, manner where the cluster is formed and the cluster head is selected. Fig. 1 shows the system model for secure and optimal data transmission in WSNs where the vampire activity in the network is detected by assigning trust value. Then, DERNNet is constructed for classifying the vampire nodes in the network. Then, the optimal route is selected using Grey Wolf optimization algorithm. As a result, the data is transmitted using to base station in a secured way.

Figure 1: System model for secure and optimal data transmission in wireless sensor networks
3.1 Cluster Formation and Cluster Head Selection
Cluster head selection is a tentative process with Energy Based Timer (EBT) and Trust Value (TV) as shown in Fig. 2. Tentative Cluster Heads are randomly selected based on their residual energy using with Energy Based Timer (EBT) and Trust Value (TV). A node is assigned a timer for selecting Tentative Cluster Head (TCH) and TV is calculated based on the overall TV of the node. Energy of nodes are termed as the timer for the cluster heads. Node with highest TV and energy is selected as TCH. Moreover, finally CH selection depends on competition range, headcount and node degree.

Figure 2: Block diagram for cluster head selection
3.2 TCH Selection Based on EBT
Based on the energy of nodes, a timer is assigned to the nodes. The assigned waiting time is based on the node’s energy which follows two conditions namely less waiting time is assigned to the highest energy node and vice voce. The node whose timer value expires first is chosen as TCH. The node with higher energy is the next TCH as time assigned to it is less. Highest energy helps for better lifetime. Hence, the node having highest energy for transmission becomes CH. This timer based on energy is described as follows: Assume that there exists
TCH is selected using Energy based timer [23]. For any node with ID
It is evident from Eq. (2) that waiting time decreases with increase in node energy. The highest energy node is said to be TCH which forwards message in its range and other nodes get rids from CH selection process once this message is arrived. TCH is chosen based on distance, total energy (Etotal) and TV. Based on the parameters of TCH selection process, the maximal and minimal node distance is determined in every round. Due to malicious activity in network we need to change the CH. Hence, it is a tentative process. The maximum wait time is 10 s in this case.
3.3 Trust Value Based TCH Selection
Trust Value (TV) helps is detecting the behavior of node, its quality as well as services. Moreover, it is involved in data aggregation, reconfiguration and routing as well as supports in evaluating the reliability of nodes. TV plays a role in collecting data and monitoring various node events. TV along with EBT is used select TCH for optimizing the efficiency of best CH selection. Trust value of nodes is computed using Eq. (3) [24]. In this case, approximately 20 packets are considered for calculating the thrust value.
where NFD and NREC denote the number of packets forwarded and received respectively. TV for an individual node is calculated and the highest TV node is chosen as TCH which is followed by final CH selection process. Finally, TV and EBT provides the outcome of TCH selection process. The threshold value for the thrust Value is 35 s. As energy efficiency is important for selecting better cluster head TCH is selected based on EBT.
3.4 Detection of Vampire Attack
The vampire attack in a network is detected by fixing trust value among cluster head nodes. The trust value is updated as shown in Fig. 3.

Figure 3: Block diagram for trust value based vampire attack detection
With the degree of the direct interaction of the current node with sink node, sink is considered as the base station of opportunistic network model. The communication range for a sink is the entire network. The node forwards messages to the sink. When the direct interaction between node and sink is more, the contact value is high as shown in Eq. (4):
Here VC is contact value,
where VL is the Location value, Cp is the number of packages transferred by node, Rp indicates the packets received by the node from other nodes
3.5 Classification of Vampire Nodes Using Dual Crypto Recurrent Neural Network
DERNNet incorporates the concept of the weighted-importance of incoming significant sequence to the single attention encryption-decryption architecture, as shown in Fig. 4. The inputting attention technique is utilized in the encryption phase to recursively determine the significance for each component

Figure 4: Vampire node classification with enhancing encryption/decryption using, DERNNet
Thus illustrated in Eq. (7), every original element is changed into a weighted one:
In all time steps, the attention weight akt is defined by the hidden state ht−1 and then the whole kth relevant series
and
where in
N is the final fully connected layer’s index,
With variables
The main benefit of utilising a Long Short Term Memory unit is that one can avoid diminishing inequalities and better capture long-term time series dependencies. Because lengthy time delays are common when thickening systems change, this benefit is especially valuable for thickener system prediction. Ultimately, encryption and decryption mechanisms convert the original y and x input sequence into high-dimensional data. As stated in Eq. (15), the feature visualization in the last time step T [28] and generate a positive yT+1:
To create a final prediction result, a single hidden layer neural network with trainable input neurons
3.6 Securable Data Preparation
Only one person has access to the private key, but the public key is shared with all participants in the operation. The mathematical model can be provided as follows,
In Which,
Here
Elliptic Curve Key Pair Generation uses regional variables
1. Assume that a node “R1” sends an encrypted REQ_MESSAGE to the certifying authority for a private key. The REQ_MESSAGE is encrypted using the certifying authority’s public key, and then it comprises the ID of “C,” the ID of the node (R1), region variables for the Elliptic Curve (EC), as well as a time and date.
2. The CA transmit private key (PRC) to the node ‘R1’ in encryption form with its proper ID
3. The node “R1” sends a REQ_MESSAGE to the certifying authority for the generator (GEN), which includes the ID of “C” as well as a time stamp that is encrypted with “C’s” private key.
4. The CA will now transmit the Generator (GEN) to node “R1” along with C’s ID and a time stamped encrypted with C’s private key.
5. Node “R1” now has both a private key (dA) and a generator (GEN) to generate his own public key (QA).
Likewise, node “R2” receives its public and private keys from the Certifying Authority, resulting in both nodes “R1” and “R2” having a private and public key at the completion of the registration stage.
3.7 Selection of Optimal Route Using Grey Wolf Optimization (GWO) Algorithm
A nomenclature of symbols with the definitions used in Grey wolf optimization algorithm is presented in Tab. 1.

GWO starts to search using a group of wolves which are scattered randomly in search space finding prey [27]. Location of every grey wolf is represented as a vector as given in Eq. (24) where n denotes search space size.
During GWO (hunting), iteration of every wolf is determined. Wolf with top 3 fitness values are termed as α, β, and δ while the position of other wolves (ω) is updated based on α, β, and δ. In order to search for optimal solution (prey), the operation performed by GWO falls under two steps namely encircling and hunting the prey.
a) Encircling: From the numerous path the selection has to be done by proper fitness function of humpback whale. This is followed by updating the operator at each location using below Eqs. (25) and (26)
where t is the reputation state, A is the coordination vector, d is the position of each packet and its vector is w. The convolutional vector is calibration is given as U’ = 2u.r’ − b and V’ = 2.r’ where, u is the repeated sequence and a is the linear product
b) Hunting: once the encircling is done, hunting start with the coordination of location factor with manipulation range. As a result, the searching is done; the globalized search factor has to be found with the notation of numerical factor. Thus, the updated positions of α, β, and δ namely Dα, Dβ, and Dδ are calculated and saved as given in Eqs. (27)–(29):
Here XWi,Xα,Xβ andXδ are the position of wolves Wi, α, β, and δ respectively. The final positions of a wolf (X1’, X2’, X3’) for the current iterations are computed as shown in Eqs. (30)–(32):
X (t + 1)is computed as per Eq. (33). Finally, the position of wolf is updated based on the optimal solutions of α, β and δ
3.8 Multi-Objective Fitness Function
Multi-objective Fitness function is given as shown in Eq. (34):
Here D(t) and
Delay: The whole time required by the network to send data is referred to as latency. The component chosen as CH must have a shorter latency. Latency is determined by the network node Expected Transmission Count (ETC), propagation delay, and internet backbone transmission. In WSN, delay is estimated as shown in Eq. (35):
Here Li(t) stands for ETC at time t for node i, α is the transmission delay in the network and βi propagation delay of node i. ETC depends on the packet transmitted and received at time for node i denoted as Fi(t) and Ri(t). ETC for node I is given as in Eq. (36):
Distance is the space between nodes which must be very less for effective communication. The node distance is given as shown in Eq. (37):
Energy: Node having the highest energy is chosen as CH. Energy is computed as in Eq. (38):
Ct+1(Hj) denotes the current energy of CH, which is calculated as
The power consumed by the sensor nodes varies with the environment placed. During route construction phase, the optimal shortest route is determined which is used for data transmission [28]. For transmitting every data bit, network is aware of the energy level. Every network node receives D_REQ (data request) from base station and then respond with data reply D_REP. Once D_REQ is received, some procedures are followed. The message is authorized by the node with a unique shared key and when matched the packet is accepted. This key is used by the node throughout for connecting with base station. When the source and destination is same node, then data is not transmitted. The message is rebroadcasted to neighboring list when the source and destination are not identical. Based on the previous stage, once data are collected from every network node, optimum path is chosen by the base station and then the route request is sent. This message is then acknowledged by the node and while data reply when the security key does not match, Error Packet (E_RRP) is sent [29].
The experimental result is carried out using the parameters such as, Packet delivery ratio, Network lifetime, Routing overhead, End to end delay, Energy efficiency, Throughput, Average latency and Classification accuracy. These parameters are compared with three standard approaches namely Knowledge and Intrusion Detection based Secure Atom Search Routing (KIDSASR), Risk-aware Reputation-based Trust (RaRTrust) model and Activation Function-based Trusted Neighbor Selection (AF-TNS) with the proposed Dual Encoding Recurrent Neural network (DERNNet). The simulation setup is shown in Tab. 2.

• Packet Delivery Ratio (PDR)-As indicated in Eq. (39), it should be the maximum ratio of total packets successfully retrieved (R) to total packets actually sent (S):
Fig. 5 illustrates the comparison of packet delivery ratio between existing KIDSASR, RaR Trust, AF-TNS methods and proposed DERNNet method where the number of vampire nodes used for analysis are plotted in X axis and the packet delivery ratio values obtained in percentage are plotted in Y axis. When compared, existing KIDSASR, RaR Trust, AF-TNS methods achieve 81%, 85.2% and 89.4% while the proposed DERNNet method achieves 92.4% which is 11.4% better than KIDSASR, 7.2% better than RaR Trust and 3% better than AF-TNS.

Figure 5: Comparison of packet delivery ratio
• Network lifetime (NL) is the highest time of all network nodes remaining alive till the energy of one or more nodes gets drained. The formula is given as shown in Eq. (40):
where,
Fig. 6 illustrates the comparison of network lifetime between existing KIDSASR, RaRTrust, AF-TNS methods and proposed DERNNet method where the number of vampire nodes used for analysis are plotted in X axis and the network lifetime values obtained in percentage are plotted in Y axis. When compared, existing KIDSASR, RaRTrust, AF-TNS methods achieve 75%, 78.4% and 82% while the proposed DERNNet method achieves 85.2% which is 10.2% better than KIDSASR, 6.8% better than RaRTrust and 3.2% better than AF-TNS. The number of vampire nodes is limited to 100 because the expected results may slow down due to less computational speed. In future if the computational speed is improved it may be scaled up for better results.

Figure 6: Comparison of network lifetime
• Routing overhead (RO) may be considered as the quantity of routing packets sent for maintenance and also for route discovery which is given as shown in Eq. (41).
where, H is counted once per hop and P is total number of routing packets. Fig. 7 shows the comparison of routing overhead between existing KIDSASR, RaRTrust, AF-TNS methods and proposed DERNNet method where the number of vampire nodes used for analysis are plotted in X axis and the routing overhead values obtained in percentage are plotted in Y axis. When compared, existing KIDSASR, RaRTrust, AF-TNS methods achieve 45.2%, 40.2% and 35.4% while the proposed DERNNet method achieves 31.4% which is 13.8% better than KIDSASR, 8.8% better than RaRTrust and 4% better than AF-TNS.

Figure 7: Comparison of routing overhead
• End-to end delay is the time taken for packet transmission from source to sink in a network.
Fig. 8 illustrates the comparison of end to end delay for existing KIDSASR, RaRTrust, AF-TNS methods and proposed DERNNet method where the number of vampire nodes used for analysis are plotted in X axis and theend to end delay values obtained in percentage are plotted in Y axis. When compared, existing KIDSASR, RaRTrust, AF-TNSmethodsachieve 45.2%, 38.8% and 32% while the proposed DERNNet method achieves 23% which is 22.2% better than KIDSASR, 15.8% better than RaRTrust and 9% better than AF-TNS.
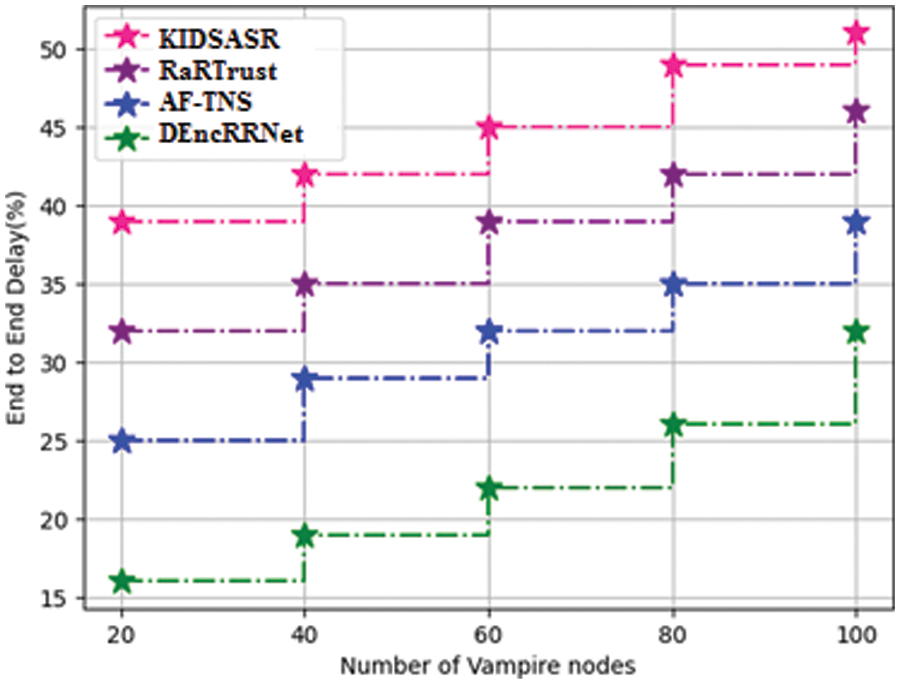
Figure 8: Comparison of end to end delay
• Energy efficiency is the ration of energy obtained to the initial energy i.e ratio of output and input energy, which is given as shown in Eq. (42):
Fig. 9 shows the comparison of energy efficiency between existing KIDSASR, RaRTrust, AF-TNS methods and proposed DERNNet method where the number of vampire nodes used for analysis are plotted in X axis and the energy efficiency values obtained in percentage are plotted in Y axis. When compared, existing KIDSASR, RaRTrust, AF-TNS methods achieve 70%, 72.8% and 74.2% while the proposed DERNNet method achieves 78.6% which is 8.6% better than KIDSASR, 6.2% better than RaRTrust and 4.2% better than AF-TNS.

Figure 9: Comparison of energy efficiency
• Throughput is the rate of data flow through a channel used for communication, i.e., bits or packets delivered successfully over a channel in the network.
where, n = number of successful packets, Avg = average packet size, T = Total time spent in delivering the data. Fig. 10 illustrates the comparison of throughput for existing KIDSASR, RaRTrust, AF-TNS methods and proposed DERNNet method where the number of vampire nodes used for analysis are plotted in X axis and the throughput values obtained in percentage are plotted in Y axis. When compared, existing KIDSASR, RaRTrust, AF-TNS methods achieve 86.2%, 88.2% and 92.6% while the proposed DERNNet method achieves 94.8% which is 8.6% better than KIDSASR, 6.6% better than RaRTrust and 2.2% better than AF-TNS.

Figure 10: Comparison of throughput
• Average latency can be calculated between the packets depends on current location as to sink. For a packet during transmission, the expected latency of delivering packet through allocated path Pmn is given as shown in Eq. (44),
where, Pmn is data delivery delay, Pnj is probability that packet is forwarded through allocated path, N(n) is number of neighbor channel, Dnj is distance between two path. Fig. 11 shows the comparison of average latency between existing KIDSASR, RaRTrust, AF-TNS methods and proposed DERNNet method where the number of vampire nodes used for analysis are plotted in X axis and theaverage latency values obtained in percentage are plotted in Y axis. When compared, existing KIDSASR, RaRTrust, AF-TNS methods achieve 44.4%, 39% and 36.4% while the proposed DERNNet method achieves 28.2% which is 16.2% better than KIDSASR, 10.8% better than RaRTrust and 8.2% better than AF-TNS.

Figure 11: Comparison of average latency
Tab. 3 shows the comparison of classification accuracy between existing KIDSASR, RaRTrust, AF-TNS methods and proposed DERNNet method.

Fig. 12 shows the comparison of classification accuracy between existing existing KIDSASR, RaRTrust, AF-TNS methods and proposed DERNNet method where X-axis indicates the number of epochs, Y-axis indicates the number vampire nodes, and Z-axis shows classification accuracy values obtained in percentage. As shown in Tab. 3, existing KIDSASR, RaRTrust, AF-TNS methods achieves 80.82%, 88.38% and 85.22%, while the proposed DERNNet method achieves 95.34%, which is 15.52% better KIDSASR, 7.04% better than RaRTrust and 10.12% better than AF-TNS. Tab. 4 shows the overall comparative analysis between existing KIDSASR, RaRTrust, AF-TNS methods and proposed DERNNet method. The lifetime of the network is 85.2% which is given in the following Tab. 4.

Figure 12: Analysis of classification accuracy

Wireless sensor networks quickly respond to malicious attacks particularly in military and defence which are very sensitive area. Therefore, this work introduced a novel routing approach called DERNNet: Dual Encoding Recurrent Neural network to secure from vampire attack and also provided shortest path to transmit packets using Grey Wolf Optimization algorithms. From the results achieved, it is proved that DERNNet method ensures 31.4% of routing overhead, 23% of end to end delay, 78.6% of energy efficiency, 94.8% of throughput, 28.2% of average latency, 92.4% of packet delivery ratio, 85.2% of network lifetime, and 94.3% of classification accuracy. Thus, the result reveals that the proposed model is more efficient and highly reliable when compared to the existing approaches. In future, this method can be enhanced and depth analysis can be made using different attacks like sleep deprivation and directional antenna which offers denial of service.
Funding Statement: The authors received no specific funding for this study.
Conflicts of Interest: The authors declare that they have no conflicts of interest to report regarding the present study.
References
1. E. Y. Vasserman and N. Hopper, “Vampire attacks: Draining life from wireless ad hoc sensor networks,” IEEE Transactions on Mobile Computing, vol. 12, no. 2, pp. 318–332, 2011. [Google Scholar]
2. B. Umakanth, J. Damodhar and K. Dt, “Detection of energy draining attack using ewma in wireless ad hoc sensor networks,” International Journal of Engineering Trends and Technology, vol. 4, no. 8, pp. 3691–3695, 2013. [Google Scholar]
3. V. Subha and P. Selvi, “Defending against vampire attacks in wireless sensor networks,” International Journal of Computer Science and Mobile Computing, vol. 3, no. 11, pp. 668–679, 2014. [Google Scholar]
4. S. Yan, S. Liu and X. Liu, “Dynamic grey target decision making method with three-parameter grey numbers,” Grey Systems: Theory and Application, vol. 6, no. 2, pp. 169–179, 2016. [Google Scholar]
5. V. Kaur, P. Rani and S. Singh, “Vampire attacks: Exploration & consequences,” International Journal of Scientific & Engineering Research, vol. 7, no. 4, pp. 1203–1207, 2016. [Google Scholar]
6. D. D. Pawar and M. Singh, “Prevention of vampire attacks in wireless sensor network,” International Journal of Computer Applications, vol. 154, no. 9, pp. 19–20, 2016. [Google Scholar]
7. S. Murugan, S. Jeyalaksshmi, B. Mahalakshmi, G. Suseendran, T. N. Jabeen et al., “Comparison of ACO and PSO algorithm using energy consumption and load balancing in emerging MANET and VANET infrastructure,” Journal of Critical Reviews, vol. 7, no. 9, pp. 1197– 1204, 2020. [Google Scholar]
8. M. A. Akhtar and G. Sahoo, “Humanistic approach in mobile ad hoc network: HAMANET,” Third International Conference on Computer Science & Information Technology, vol. 1, no. 2, pp. 45–52, 2013. [Google Scholar]
9. R. Balakrishna, U. Rajeshwar Rao and N. Geetahanjali, “Performance issues on AODV and AOMDV for MANETs,” International Journal of Computer Science and Information, vol. 1, no. 2, pp. 38–43, 2010. [Google Scholar]
10. A. Sangwan, D. Sindhu and K. Singh, “A review of various security protocols in wireless sensor network,” International Journal of Computer Technology and Applications, vol. 2, no. 4, pp. 790–797, 2011. [Google Scholar]
11. G. D. Devanagavi, N. Nalini and R. C. Biradar, “Secured routing in wireless sensor networks using fault free and trusted nodes,” International Journal of Communication Systems, vol. 29, no. 1, pp. 170–193, 2016. [Google Scholar]
12. R. Isaac Sajan and J. Jasper, “Trust based secure routing and the prevention of vampire attack in wireless ad hoc sensor network,” International Journal of Communication Systems, vol. 33, no. 8, pp. 1–22, 2020. [Google Scholar]
13. O. Singh, V. Rishiwal and M. Yadav, “Multi objective lion optimization for energy efficient multi path routing protocol for wireless sensor networks,” International Journal of Communication Systems, vol. 34, no. 17, pp. 1–14, 2021. [Google Scholar]
14. A. Beheshtiasl and A. Ghaffari, “Secure and trust-aware routing scheme in wireless sensor networks,” Wireless Personal Communications, vol. 107, no. 4, pp. 1799–1814, 2019. [Google Scholar]
15. M. Selvi, K. Thangaramya, S. Ganapathy, K. Kulothungan, H. K. Nehemiah et al., “An energy aware trust based secure routing algorithm for effective communication in wireless sensor networks,” Wireless Personal Communications, vol. 105, no. 4, pp. 1475–1490, 2019. [Google Scholar]
16. N. Labraoui, M. Gueroui and L. Sekhri, “A risk-aware reputation-based trust management in wireless sensor networks,” Wireless Personal Communications, vol. 87, no. 3, pp. 1037–1055, 2016. [Google Scholar]
17. O. AlFarraj, A. AlZubi and A. Tolba, “Trust-based neighbor selection using activation function for secure routing in wireless sensor networks,” Journal of Ambient Intelligence and Humanized Computing, vol. 15, no. 12, pp. 1–11, 2018. [Google Scholar]
18. M. A. Simplicio Jr, P. S. Barreto, C. B. Margi and T. C. Carvalho, “A survey on key management mechanisms for distributed wireless sensor networks,” Computer Networks, vol. 54, no. 15, pp. 2591–2612, 2010. [Google Scholar]
19. G. K. C. Thevar and G. Rohini, “Energy efficient geographical key management scheme for authentication in mobile wireless sensor networks,” Wireless Networks, vol. 23, no. 5, pp. 1479–1489, 2017. [Google Scholar]
20. R. De Blasis, G. B. Masala and F. Petroni, “A multivariate high-order markov model for the income estimation of a wind farm,” Energies, vol. 14, no. 2, pp. 388–397, 2021. [Google Scholar]
21. M. Luqman and A. R. Faridi, “Security in wireless sensor network: A current look,” in 9th Int. Conf. on Computing for Sustainable Global Development, New Delhi, India, pp. 385–391, 2022. [Google Scholar]
22. S. K. Gupta, N. Jain and P. Sinha, “Node degree based clustering for WSN,” International Journal of Computer Applications, vol. 40, no. 16, pp. 49–55, 2012. [Google Scholar]
23. X. Liu, H. Zhao, X. Yang and X. Li, “SinkTrail: A proactive data reporting protocol for wireless sensor networks,” IEEE Transactions on Computers, vol. 62, no. 1, pp. 151–162, 2013. [Google Scholar]
24. E. Pei, H. Han, Z. Sun, B. Shen and T. Zhang, “LEAUCH: Low-energy adaptive uneven clustering hierarchy for cognitive radio sensor network,” EURASIP Journal on Wireless Communications and Networking, vol. 2015, no. 1, pp. 1–8, 2015. [Google Scholar]
25. V. Kaur, P. Rani and D. S. Singh, “Vampire attacks: Exploration & consequences,” International Journal of Scientific & Engineering Research, vol. 7, no. 4, pp. 1203–1207, 2016. [Google Scholar]
26. D. D. Pawar and M. Singh, “Prevention of vampire attacks in wireless sensor network,” International Journal of Computer Applications, vol. 154, no. 9, pp. 19–20, 2016. [Google Scholar]
27. I. Ullah and H. Y. Youn, “Statistical multipath queue-wise preemption routing for zigbee-based,” Wireless Personal Communication, vol. 100, no. 4, pp. 1537–1551, 2018. [Google Scholar]
28. Y. Xiuwu, L. Qin, L. Yong, H. Mufang, Z. Ke et al., “Uneven clustering routing algorithm based on glowworm swarm optimization,” Ad Hoc Networks, vol. 93, no. 3, pp. 1–8, 2019. [Google Scholar]
29. M. A. Manivasagam, “An efficient self-reconfiguration and route selection for wireless sensor networks,” International Journal of MC Square Scientific Research, vol. 9, no. 2, pp. 192–199, 2017. [Google Scholar]
Cite This Article
 Copyright © 2023 The Author(s). Published by Tech Science Press.
This work is licensed under a Creative Commons Attribution 4.0 International License , which permits unrestricted use, distribution, and reproduction in any medium, provided the original work is properly cited.
 Downloads
 Citation Tools