
 Submit a Paper
 Propose a Special lssue
 Open Access
ARTICLE

Liver Tumors Segmentation Using 3D SegNet Deep Learning Approach
1 Department of Computer Science and Engineering, PSN College of Engineering and Technology, Tirunelveli, 627152, Tamil Nadu, India
2 Department of Computer Science and Engineering, Gokaraju Rangaraju Institute of Engineering and Technology, Hyderabad, Telangana, 500090, India
3 Department of Computer Science, College of Computers and Information Technology, Taif University, P. O. Box 11099, Taif, 21944, Saudi Arabia
4 Department of Computer Science, College of Computers and Information Technology, Taif University, Taif, 21974, Saudi Arabia
* Corresponding Author: G. Nallasivan. Email:
Computer Systems Science and Engineering 2023, 45(2), 1655-1677. https://doi.org/10.32604/csse.2023.030697
Received 31 March 2022; Accepted 15 June 2022; Issue published 03 November 2022
 View Full Text
 Download PDF
Abstract
An ultrasonic filter detects signs of malignant tumors by analysing the image’s pixel quality fluctuations caused by a liver ailment. Signs of malignant growth proximity are identified in an ultrasound filter through image pixel quality variations from a liver’s condition. Those changes are more common in alcoholic liver conditions than in other etiologies of cirrhosis, suggesting that the cause may be alcohol instead of liver disease. Existing Two-Dimensional (2D) ultrasound data sets contain an accuracy rate of 85.9% and a 2D Computed Tomography (CT) data set of 91.02%. The most recent work on designing a Three-Dimensional (3D) ultrasound imaging system in or close to real-time is examined. In this article, a Deep Learning (DL) model is implemented and modified to fit liver CT segmentation, and a semantic pixel classification of road scenes is recommended. The architecture is called semantic pixel-wise segmentation and comprises a hierarchical link of encoder-decoder layers. A standard data set was used to test the proposed model for liver CT scans and the tumor accuracy in the training phase. For the normal class, we obtained 100% precision for chronic cirrhosis hepatitis (73%), offset cirrhosis (59.26%), and offensive cirrhosis (91.67%) for chronic hepatitis or cirrhosis (73,0%). The aim is to develop a Computer-Aided Detection (CAD) screening tool to detect steatosis. The results proved 98.33% exactness, 94.59% sensitivity, and 92.11% case with Convolutional Neural Networks (CNN) classification. Although the classifier’s performance did not differentiate so clearly at this level, it was recommended that CNN generally perform better due to the good relationship between Area under the Receiver Operating Characteristics Curve (AUC) and accuracy.Keywords
The primary cause of morbidity and death in developed countries is Chronic Liver Disease (CLD). Viral hepatitis and alcohol abuse are often responsible for this disease. Several studies have tackled this issue, using objective characteristics based on Ultrasound and CT images and the CLD study classification procedures. The most frequently described features are based on statistics of first place, co-occurrence, transform wavelets, and the parameters and coefficients for attenuation and back dispersion. A multi-frequency method extract features using Monogenic Decomposition (MD) [1–5].
Various feature sets described in the literature survey the performance of the proposed algorithm. The binary and CNN underlying Neural Networks (NN), calculated locally, are used to overlap the Support Vector Machine (SVM) and Random Forest (RF) classifications with the ultrasound and CT images to provide local evidence for the disease. This interactive CAD tool is especially helpful in selecting the Region of Interest (ROI) where the method is sensitive [6–10]. The events of CLDs, such as liver fibrosis and cirrhosis, characterized by the presence of vascular zed fibrotic septa and regenerator nodules, can be identified through ultrasound and CT. Medical imaging is an essential factor in the detection and diagnosis of specific human disorders for most clinical strategies. Various medical imaging methods like Ultrasound, CT scanning, and Magnetic Resonance Imaging (MRI) have been implemented in X-radiation (X-ray), showing an image in the 3-D perspective of the body. The CT is the maximum frequently used transverse imaging procedure for detecting morphologic tumors. We cannot endure without a solid liver because almost all organs in the human body suffer from it. The two basic types of hepatic diseases are diffused liver infections and major hepatic diseases [11–15]. Diffuse hepatic infections affect the whole liver surface, such as fat and cirrhotic liver. If infections affect a small area of the liver surface, they are known as hepatic diseases.
Medical Images (MI) have unique attributes depending on the objective part of the body and the suspected diagnostic test. Standard modes used for medical imaging include radiation X-rays, MRI, Regional Medical Imaging (RMI), Diffusion Tensor Imaging (DTI), and Positron Emission Tomography (PET). In addition to the considerable time and economic costs involved with the formation of radiologists, radiologists lack experience, time, and tiredness. The increasing percentage of MI resulting from an ageing population and more prevalent scanning systems strains radiologists. The authors suggested Fisher’s Linear Discriminant (FLD) classification framework using 95% accuracy for manual texture features. The accomplished researchers focus primarily on handmade features [16–20].
Therefore, to improve FLD classification accuracy through ultrasound images, we propose a CNN and Transfer Learning (TL) based on Critical Discourse Analysis (CDA) frameworks in this study. However, health imaging remains a challenge when compared with real MI in acquiring the required data for training the DL models. When profound models of learning are trained using the limited available medical information, Deep Convolutional Neural Networks (DCNN) tend to overfit, and convergence problems arise. New transmission learning methods were used in DCNN in medical imaging applications with smaller data sets to address these problems.
The pretrained CNN models can produce input image features that can then be used to train a new classification. The trained CNN has used suitable real MI and has implemented the coevolutionary layers of pretrained CNN into a new CNN framework for the ultrasound video sequence of the fetal abdominal plane. The author [21–25] has already used CNN and layer fine-tuning to improve performance in the foetal defence plane with a minor data set. Motivated by the success of transmission, we adhere in this article to the transfer of learning to a previously-trained CNN level to accurately classify the normal and fatty images of the liver ultrasound. We offer a framework to resolve the timely problem and provide an efficient and emotionally supportive clinical choice network. There is a presentation of a CAD method for dividing LTs.
The proposed strategies include extraction and division of elements based on the division and the Region of Interest pooling (ROI), Gray Level Classification Matrix (GLRLM), and CNN (Fig. 1). We can then examine variations from the standard and help indicate solid device-detect fluctuation in Liver Tumor (LT) injuries (Fig. 2). Characteristics of images of ultrasound LT are extremely troubling in the preparation of images. Computers in the clinical field in each section of today’s medicine are currently used for all purposes [26–30]. In light of the essential importance of the liver to people, LT is considered valid. Two classes of LT are present: sweet-hearted and harmful. Ultrasound is a great way to show delicate tissue status for demonstrative clinical purposes. Ultrasound was critical when an elemental LT was separated from other liver masses.

Figure 1: 3D Ultra sound and CT liver image

Figure 2: Sample CT liver image datasets
Digital Imaging and Communications in Medicine (DICOM) images are used for medical imaging. It stores essential patient information, like the patient’s name, age, sex, etc., and image data [31]. For example, changing the color map from cells below the cell is impossible to create a graph. However, cells below the ones creating the plot change the plot. It’s a living object in memory for other backgrounds, such as Tensorflow, opened in a separate window, and is open-source, scientific, and engineering software. The Scientific Python (SciPy) library depends on NumPy for the array’s easy and fast N-dimensional manipulation. The SciPy library is constructed to work with NumPy arrays and delivers numerical routines that are efficient and easy to use, such as numerical integration and optimization routines.
Hepato-Cellular Carcinoma (HCC) is one of the most killer cancers global. Current developments in proteomic methods allow for several large-scale proteomic analysis of markers and insights into HCC development mechanisms. Modern high-order data mining techniques searching for meaningful and biologically essential patterns and trends in the proteomic dataset may provide a systematic approach to relatively large amounts of data in the proteome. Every 1,433 variables were used to build and evaluate classification models based on the Artificial Neural Network (ANN) and Classification And Regression Trees (CART) algorithms. Both algorithms successfully divide samples into corresponding high-sensitivities and specificity phenotypes (ANN: 89.4% and 89.4%; CART: 80.3% and 80.3%), illuminating the usefulness and potential of genomic and proteomic expression profiling techniques. It was evaluated with three classifiers, including K-means, Backpropagation Neural Network (BNN), and SVM, using 25 features from First-Order Statistics (FOS), Gray-Level Co-occurrence Matrix (GLCM), Gray-Level Run-Length Matrix (GLRLM), Grey Level-Dependent Matrix (GLDM), and Laws. Our method improved the classification accuracy of classification models in identifying LT, hemangioma, and average LT from B mode ultrasound images in a survey of 166 normal liver tissues, 30 hemangiomas, and 60 Malignant Tumors (MT). It has been proved that fuzzy improvement can be used as an efficient data pre-processing method in the LT CAD system [32–36].
A method to decrease speckle noise is presented in medical ultrasound images. The adaptive Weighted Median Filter (WMF) is known and is based on the weighted median, derived by the introduction of weight coefficients from the well-known median filter. The weight of the filter and, according to local statistics, its smoothing characteristics around each image point can then be adjusted, allowing the noise to be eliminated while the edges and other essential features are preserved. Processing has shown that using filters on several ultrasound scans improves the detection performance of small dimensions and subtle gray-scale changes without impacting the sharpness or body information of the original image. Since it is a quick robbed table, the segmentation by seeded region and free of tuning parameters are widely used compared to the pure median filters. However, an automatic seed generator is necessary for the seeded region, and there is difficulty in labeling unassembled pixels [37]. This article introduces a new Automatic Seeded Region Growing and Instance-Based Learning (ASRG-IBL) algorithm that automatically increases seed region and performs color segmentation and multi-spectral imaging. A seed is generated automatically by histogram analysis. The graph of each band is investigated to achieve sample pixel values. If the grey values of an image pixel drop within a sample interval for each group, it is assumed to be a root. After that, the image segment is covered by our new seed region growing algorithms. This algorithm uses distance criteria for instance-based learning. Finally, the regions are merged with ownership tables according to user needs. The algorithm was applied to a percentage of leukaemia MI and generated positive results. A precise cancer diagnosis is essential for saving human lives. This can put cancer patients at risk for their lives. From the literature, the ML classifiers of Artificial Intelligence (AI) help physicians more accurately diagnose cancer. Both of them have shown good cancer classification accuracy performance [38].
This research study compares RF and SVM classification performances on four different data sets for cancer. These data are based on the state of the organs in breast cancer and LT, commonly known as prostate cancer and ovarian cancer; they are gene expression data. The proposed methods classify the data sets with benign and malignant tumors. This research has proven that the SVM classification can perform better than the CNN classification in LT data classification. Throughout all the research findings, diagnostic accuracy for various ultrasound approaches was defined. In the 21 studies included, there were 48 diagnostic accuracy reports for particular ultrasound techniques. 30 different ultrasonic techniques have been reported. Multiple reports were made on 7 techniques [39–42].
CT Liver image sequences have been attained from Medall scans, Radiography Department, Tirunelveli (Fig. 3). An ultrasound liver Image is collected in the Liver Dataset Source file (Fig. 4).

Figure 3: Dataset collections of ultrasound liver images

Figure 4: Data flow of image processing
3.2 Proposed Model for Image Preprocessing
When processing signals, the alternative to a clamor decrease in a photo or sign is routinely appealing. Such a decline in clamor is an average pre-process, which dares to improve later processing effects. The information image is preprocessed using the central channel, the most popular method for emptying salt and pepper. The center channel is an electronic isolation methodology that is used to remove turmoil from time to time. Median insulation is used a lot in advanced image processing because it keeps the edges while removing the bumps (Fig. 5).

Figure 5: Analysis of median value liver DICOM data set
Consider a color MI ‘I’ in the RGB color space; then, Eq. (1)
where I(P, Q) is the pixel vector at (P, Q) in shading image ‘I’ (Tab. 1). The median filter is implement to every portion of the shaded image as follows: Eq. (2)

I(xb,yb) exemplifies the longitude and latitude of the median values for each color model, where ‘w’ is an odd-sized window. Eq. (3) can be done by adding the three vectors to form a median matrix ‘m’ (Fig. 6).

Figure 6: Input of CT image
This work considers factors such as Normal Image (NI), Decompensated Cirrhosis (DC), Hepatitis B Circumcision (HBC), Compensated Cirrhosis (CC), and Chronic Hepatitis (CH). The images are gradually assembled as data snippets in award crisis facilities; each image accumulates 8 bits target and 720 × 960 pixels, respectively (Figs. 7 and 8). There are 177 realistic images taken from 36 patients in the database. The patient was referred to as an aid for using the images in the creative work of final procedures. Two doctors collected realistic images of the reverberation as common liver and steatosis. Intrigue locations (ROI) were removed from each image by 50 pixels. All areas containing vessels and old-fashioned rarities were dismissed as far as possible. Some ROI for steatotic fluids and a few for ordinary levers were included in the educational collection.

Figure 7: Noisy image

Figure 8: Compensated cirrhosis
Usually, MI is used for the testing of the disease. The underlying phase of the examination is preprocessing. The CT and ultrasound image is prepared to smooth and decrease the upheaval without obliterating the enormous features of the CT Ultrasound liver images. We use progressively effective and more straightforward technology to improve the characteristics that highlight certain features of CT Ultrasound images. The filtering methodology is generally used for image preprocessing. The work proposed is linked to a few phases: (a) median filter denouncement, (b) CT image resize, and (c) worldwide differentiation estimate dynamic thresholding.
4.1 Liver Ultrasound and CT 3D Image Classification
We confirmed, as previously suggested that patients with CC and DC have significant survival differences and different predictors of death in an era in which different therapies are recommended for patients with compensated and decompensated cirrhosis. We also confirm that those with varicose veins (STAGE 2) have significantly less survival in the group of patients with cc than those without varicose veins (STAGE 1). This confirms patients with compensated cirrhosis sub-stratification and proposes that patients should stratify patients with compensated cirrhosis by the presence or absence of variance. This may be due to recent advances in variegate haemorrhage therapy, which have resulted in better survival, while ascites therapies did not improve survival considerably. In children, mortality has been proven zero in recent randomised trials to treat varicella hemorrhage. Our survival rate aligns with the Danish cohort study in patients with various haemorrhages and ascites.
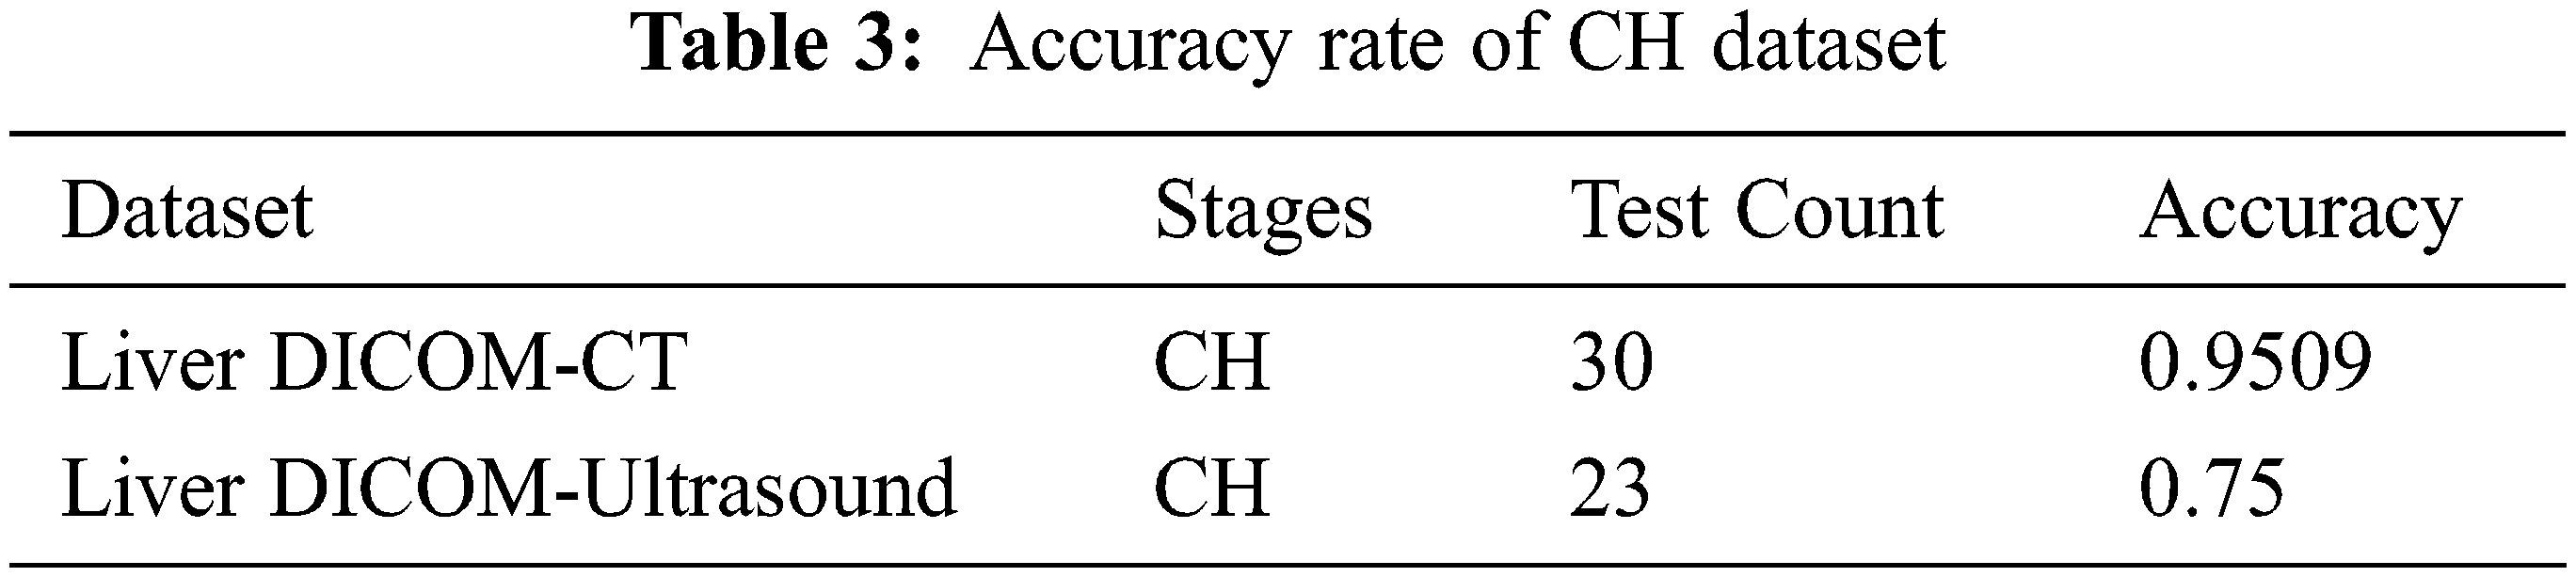
Chronic hepatitis is a clinical and pathological syndrome without a single genetic disorder, with different causes and multiple levels of hepatocellular necrosis and inflammatory processes (Fig. 9 and Tab. 2). We propose two new steps for decompensated patients based on our results. The redefined STAGE 3 would consist of ascites-free hemorrhagia, and the redefined STAGE 4 would consist of various free or ascites-free patients. This proposed sub-stage system should be confirmed in future studies, as it would have been possible to exclude patients with complicated courses of various hemorrhage/poor results without referring to hemodynamic measures by only including patients who performed hemodynamic tests. Incredible cells are mainly lymphocytic. Because chronicity is not better defined, chronic hepatitis is still defined for at least 6 months as a continually improved disease (Fig. 10 and Tab. 3). However, it should be stressed that diagnosis and therapy may be started in most cases. The clinic can be described as having symptomatic or asymptomatic illness in patients with chronic viral hepatitis. Unfortunately, no standard criteria are available to determine whether symptoms exist. Patients may claim no symptoms and feel good but admit fatigue directly if questioned. Doctors may reject fatigue complaints as irrelevant or due to other causes.

Figure 9: Analysis of CC


Figure 10: CH
Without the careful yet fruitless search for symptoms, “asymptomatic” should not be used. The symptoms of CH are not reliable measurements, and no well-established, validated tools are available for their grade. Indeed, symptoms are not mentioned in most natural history or therapy studies because the quality of life is an essential outcome in a therapy assessment.
Sexual transmission can occur. Infected blood and body fluids such as saliva and menstrual, vaginal, or seminal fluids are also spread through needle stick injuries, tattoos, piercings, and exposure (Fig. 11). Sexual transmission of hepatitis B may occur, particularly in unvaccinated men with multiple sex partners. CH expands in less than 5% of adult infectious diseases, but CH improves in 95% of early childhood diseases. The virus can also be spread by recovering needles or syringes in the health centre or among injection drug users. An increase in the use of razors and similar objects contaminated with blood can be caused during medical, surgical, and dental procedures via tattooing/using infected blood (Fig. 12). DC is a complicated disorder that affects several systems and requires a systematic management approach (Fig. 14 and Tab. 4). A ‘care bundle’ is available to help patients undergoing DC during the first 24 h and is supported by the British Society of Gastroenterology (Figs. 13 and 14).

Figure 11: Analysis of CH

Figure 12: HBC

Figure 13: Analysis of HBC

Figure 14: DC

Image classification is an essential cognitive task in diagnostic radiology that can be achieved by identifying specific anatomical/pathological characteristics that distinguish between one anatomical or tissue structure and another (Fig. 15 and Tab. 5). While computers are now far removed from having the complete chain of reasoning necessary for medical image interpretation, the research focus of compatible diagnostic systems is the automated classification of targets of interest. Traditional ML methods often used different hand-crafted features extracted from US images combined with a multi-way CNN linear classification system to achieve a specific classification task. However, these methods are suspected of distortion of images such as internal or external deformation or image processing conditions. Here, CNN’s have several clear advantages because of their direct knowledge of the raw data’s mid/high-level abstract features. CNNs can also be used directly to generate a separate forecast label for each image to classify targets. There are some unique challenges for different anatomical applications discussed below. According to the latest statistics by the Centres for Disease Control and Prevention, breast cancer has become the world’s second most common cause of cancer death among women. While mammography is still the leading imaging model for clinical testing and diagnosis, ultrasound imagery is also a key tool for breast cancer diagnosis (Fig. 16). In particular, it provides practical decisional support and a second tool option for radiologists/diagnosticians to use ultrasound Computer-Aided Diagenesis (CADx) to classify tumor disorders. Feature extraction is the basis for subsequent steps in a conventional CADx, including selecting and classifying features to ensure the final classification of tumors and mass lesions. It is possible to achieve this. Traditional Machine Learning (ML) often uses hand-crafted and heuristic lesion-extracting features for CADx breast tums or mass injury. DL, on the other hand, can automatically learn features from images.

Figure 15: Analysis of DC


Figure 16: Segment image
It can be challenging to persuade a physician to use an automated system. As a result, we’re looking for an approach to automated liver segmentation that outperforms conventional specialist features. A three-step Liver Segmentation Technique (LST) was developed in this paper. Segmenting 69 CT (2D) images was the first step in the proposed approach. All CT images were obtained from the Atlas of Liver Imaging. Each image is a 512 × 512 JPG file representing a single patient.
The data are divided into healthy CT images and infected CT images. Each image was preserved as a 256 × 256 grayscale image and was not used in any other case. The histogram of the grey images is used to extract the liver from CT images for the first time. The process of determining the liver likelihood intensity range by observing the histogram of the prepared grey images is known as thresholding. The histogram of the 69 grey images was used to achieve this. In the entire set of images, the number of liver pixels ranged from 100 to 150. It is not always easy to persuade doctors to use automatic diagnostic devices. As a result, we’re looking for an automatic LST that outperforms expert-created manual contours. Three steps comprise the LST developed in this paper. Segmenting 69 CT (2D) images was the first step in the proposed method. All CT images came from the liver imaging Atlas (an online reference for liver imaging).
A 512 × 512 JPG file represents each patient. There are 13 healthy CT images and 56 infected CT images in this data set (Fig. 17). All images were converted to 256 × 256 grayscale and saved from further processing. The liver is extracted from CT images using a histogram of the greyscale. Assembled grey images are thresholded by looking at the histogram of the liver pixels. The liver range was determined using 69 histogrammed grey images. The liver pixels were between 100 and 150 when testing the whole set of images. We aim to find an automated method that outperforms expert-made contours (Fig. 18).

Figure 17: ROI selection and segment image

Figure 18: ROI selection and non-ROI image
Step 1. Initialize the number of gatherings by setting K = 0. Think about every pixel (I, j) in this path in a raster channel, proceeding with a fragment by line (I = 1, n), and taking j = 1, n for every appraisal.
Step 2. One of the choices alludes to pixels (I, j); nothing can be accomplished if (I, j) is an edge pixel.
Step 3. If I1, j and I, j1 presently visited neighbours are edge pixels, another portrayal should be made for (I, j), Eq. (4)
where the areas in h1,…, HK is used to screen in order to find the equivalent orders, and gij records the class name for pixel (I, j). If just one of the two neighbours is an edge pixel, then (I, j) is allotted a comparable imprint as the other one, Eq. (5)
is the edge pixel,
4.3 CT Image Improvement and Automated Liver Segmentation
The production of automated disease detection and improved CT images is also a strategy. The calculation that is proposed depends on unusual locals divided within the liver. The arrangement of the premises based on a shape classification should be possible. The calculation should include the following:
Step 1. For the division, many CT images are chosen for the first stage.
Step 2. Preprocessing is done to reduce fake negative effects because of wounds under the portion of the liver, CT image similarity and concussion decreased, and different typical liver characteristics exist.
Step 3. Improving the CT image using histogram sound with equivalent containers is concluded.
Step 4. The Mean Square Error (MSE) and the CT outputs of Liver sections are evaluated.
Step 5. The Liver dataset is composed of the improved image for liver malignancy arrangement.
Step 6. The supported classification strategies use methods of design recognition to parcel the space of image power using information with regular classes.
Step 7. The class partition contains space for various assemblies, as indicated by the tissue/anatomical area.
Step 8. The classification is needed to prepare a physically portioned information collection and then use it as a perspective to fragment new information naturally.
Step 9. The final classification evaluated with the test determines all blundering in the malignant liver growth division.
Different methodologies characterize B-mode images’ echo-gentility. Those are the main requested measures: dark level running length grid, dense level co-event grid, legislation on area vitality, and fractal measurement with 325 highlights. A few highlights have been obtained from these lines. The FOS processes the data from a confined pixel that does not consider the connection between its neighbours. As a result, FOS can only show the echo gentleness of the surface and the diffuse variation within the ROI. The FOS was used with 9 highlights: mean, difference and default, skewness, kurtosis, median, entropy, mod, and range. A total of 44 highlights have been extracted. The GLRLM is a 3D network constructed for each ROI and portrays a neighbouring pixel’s standard shape and linearity. Each Gray Level Run Length Matrix (GLRLM) component contains the number in the dark ‘i’, and the direction of continuous ‘j’ runs.
The term “run” means the complete number of back-to-back pixels with a similarly low level and a similar direction for the accompanying qualities: 0°, 45°, 90°, and 135°. Different GLRLMs have been evaluated. The GLRLM strategy is optimal for extracting measurable surface highlights of higher demands. The GLRLM is a 2D grid of (G*R) components in which each component gives the absolute number of run events of a dark level of 1 (j) in guidance. GLRLM helps physically cut a part of the image and processes seven surfaces to limit the high level of inconsistency: Run Rate (RP), Run Length of Inconsistency (RLN), Low Dark Level of Running Emphasis (LGRE), Low Level of Running Stress (LGRE), and High-Level Dim Accentuation (HGRE).
Currently, the innovation in medical imaging is being used; for example, the PC helped to find the technique for analysing sickness and medical activities. Biomedical image determination and research are becoming complex tasks. The area of interest in which the districts are worrisome in the small scenes is neuromental ideas. The analyzers attempt to duplicate and change the neuro-mental idea quickly and accurately by programming the function. We can limit the speed with which ROI techniques can help upgrade processing. Only relevant information is taken as a means of effectively speeding up processing. The surface element investigation is based on the ROI and non-ROI selection in the proposed work. The highlights of the ROI-based GLCM are improved, and previous techniques are contrasted. The ROI and non-ROI age can be used for other divisional preprocessing strategies. The ROI ages can speed up the extraction of the following image highlight.
Each element between −1 and +1 was standardized to prevent some highlights from being predominant in the category. The moment, three uniclassifiers were used to match the classes as expected, and statuses were given. CNN has low accuracy problems. Here is an illuminated method depending on the improvement of CNN, which is more accurate than normal CNN. CNN’s average DL model provides the most effective way to address PC vision issues such as visual recognition and image division. This model captures the complex, non-strict mappings among data sources and results. The multi-layer CNN structure can thus get to know several progressive highlights. The shallow layer learns the neighbourhood’s characteristics; the DL is factual. The DL characteristic has increased as abstract and reflective data, which gradually matches the image order. In the model of the Natural Sensory System, CNN classification is active. Neurons are easier to connect in different configurations. Multi-layer back-propagation calculation is used because of its demonstrated expertise in neural system learning. Preparation for the classifier begins with arbitrary loads and the readiness for data and cloak layers. The info vector included 385 components (hubs), one clad layer of 3 neurons acquired using the experimenting strategy, and one yield layer. New calculations for image research are being seriously considered, including DL. These AI strategies naturally allow Personal Computers (PCs) to create valuable characterization highlights. In addressing various medical image examination issues, the convenience of CNN has been addressed. CNN changes image entries to a single selection variable by convolution filters as an output, which generally shows the image name. In all cases, such information is usually needed to prepare a CNN effectively. This problem confines the practical use of DL models in examining medical photographs, as accessible datasets are generally limited.
4.6 Convolution Neural Network Switch Attention Module
Within the clinical practice, clinicians adaptively rule out lung contamination areas through a two-venture proto and get familiar with the converse consideration in three equal elevated level highlights. Our technology can use the same areas and details repeatedly by removing the assessed contamination spots from DL (Figs. 19 and 20).

Figure 19: Proposed model diagram

Figure 20: Test sample epochs
We acquire the yield RA highlights RI by increasing the combination of elevated level side-yield highlights fi, I = 3,4,5 and edge consideration highlights trouble = f2 with RA loads Ai, i.e., Eqs. (8)–(12).
Where Dow() signifies the down-examining activity, () de-takes note of the connection activity followed by 2-D 64-channel convolution layers. The weight of RA has been accepted for notable item identification, and it is characterized as Eqs. (13)–(20)
where (

Figure 21: Classification results

Figure 22: Confusion matrix for CT image
The images acquired using the proposed method are compared, and related images of ground truth are used to break the presentation of the proposed framework for tumor detection. Different steps are typically used to evaluate the technique presentation. The disarray grid determines these measures, including Accuracy of Characterization (AC) and Correlation. The disarray structure shows actual and forecasted technical classes (Fig. 23). MI has tested python for the exhibition of the proposed attempt. The MI combined standard CT and ultrasound liver images with various unhealthy liver images, supported by the clinical analysis. This section describes the effectiveness and implementation of the pre-processing highlight mining, selection, and characterization techniques for liver disease order (Tab. 6).

Figure 23: Test and train model

Tab. 7 above shows the accurate characteristics and CNN models shown in the ultrasound image. As far as accuracy is concerned, 96% of it is given as our proposed model. This accuracy shows 96% of the exactness of our CT Image CNN model and specific characterization techniques.

Our study shows the feasibility of using DL to assess liver status. Although this information was sufficient to create an effective classifier with ML, we did use a small data set containing images from some patients (Fig. 24). The CNN highlights were valuable and enabled the grouping and recurrence models to be productive. The CNN-based methodology is expected to be implemented well. We did not prepare the system without preparation in our examination but used the pre-prepared CNN to include the extraction. The real dataset containing 1.2 million images of different objects has been used to create this model (Tab. 8). The HI count incorporates two convergence tasks that the CNN should probably learn to do well on the real dataset. The presence of the liver in encompassing tissues is significant for practical status evaluation. For an accurate status assessment, the liver is an important tissue to have (Figs. 25 and 26).

Figure 24: Analysis of images stages with accuracy
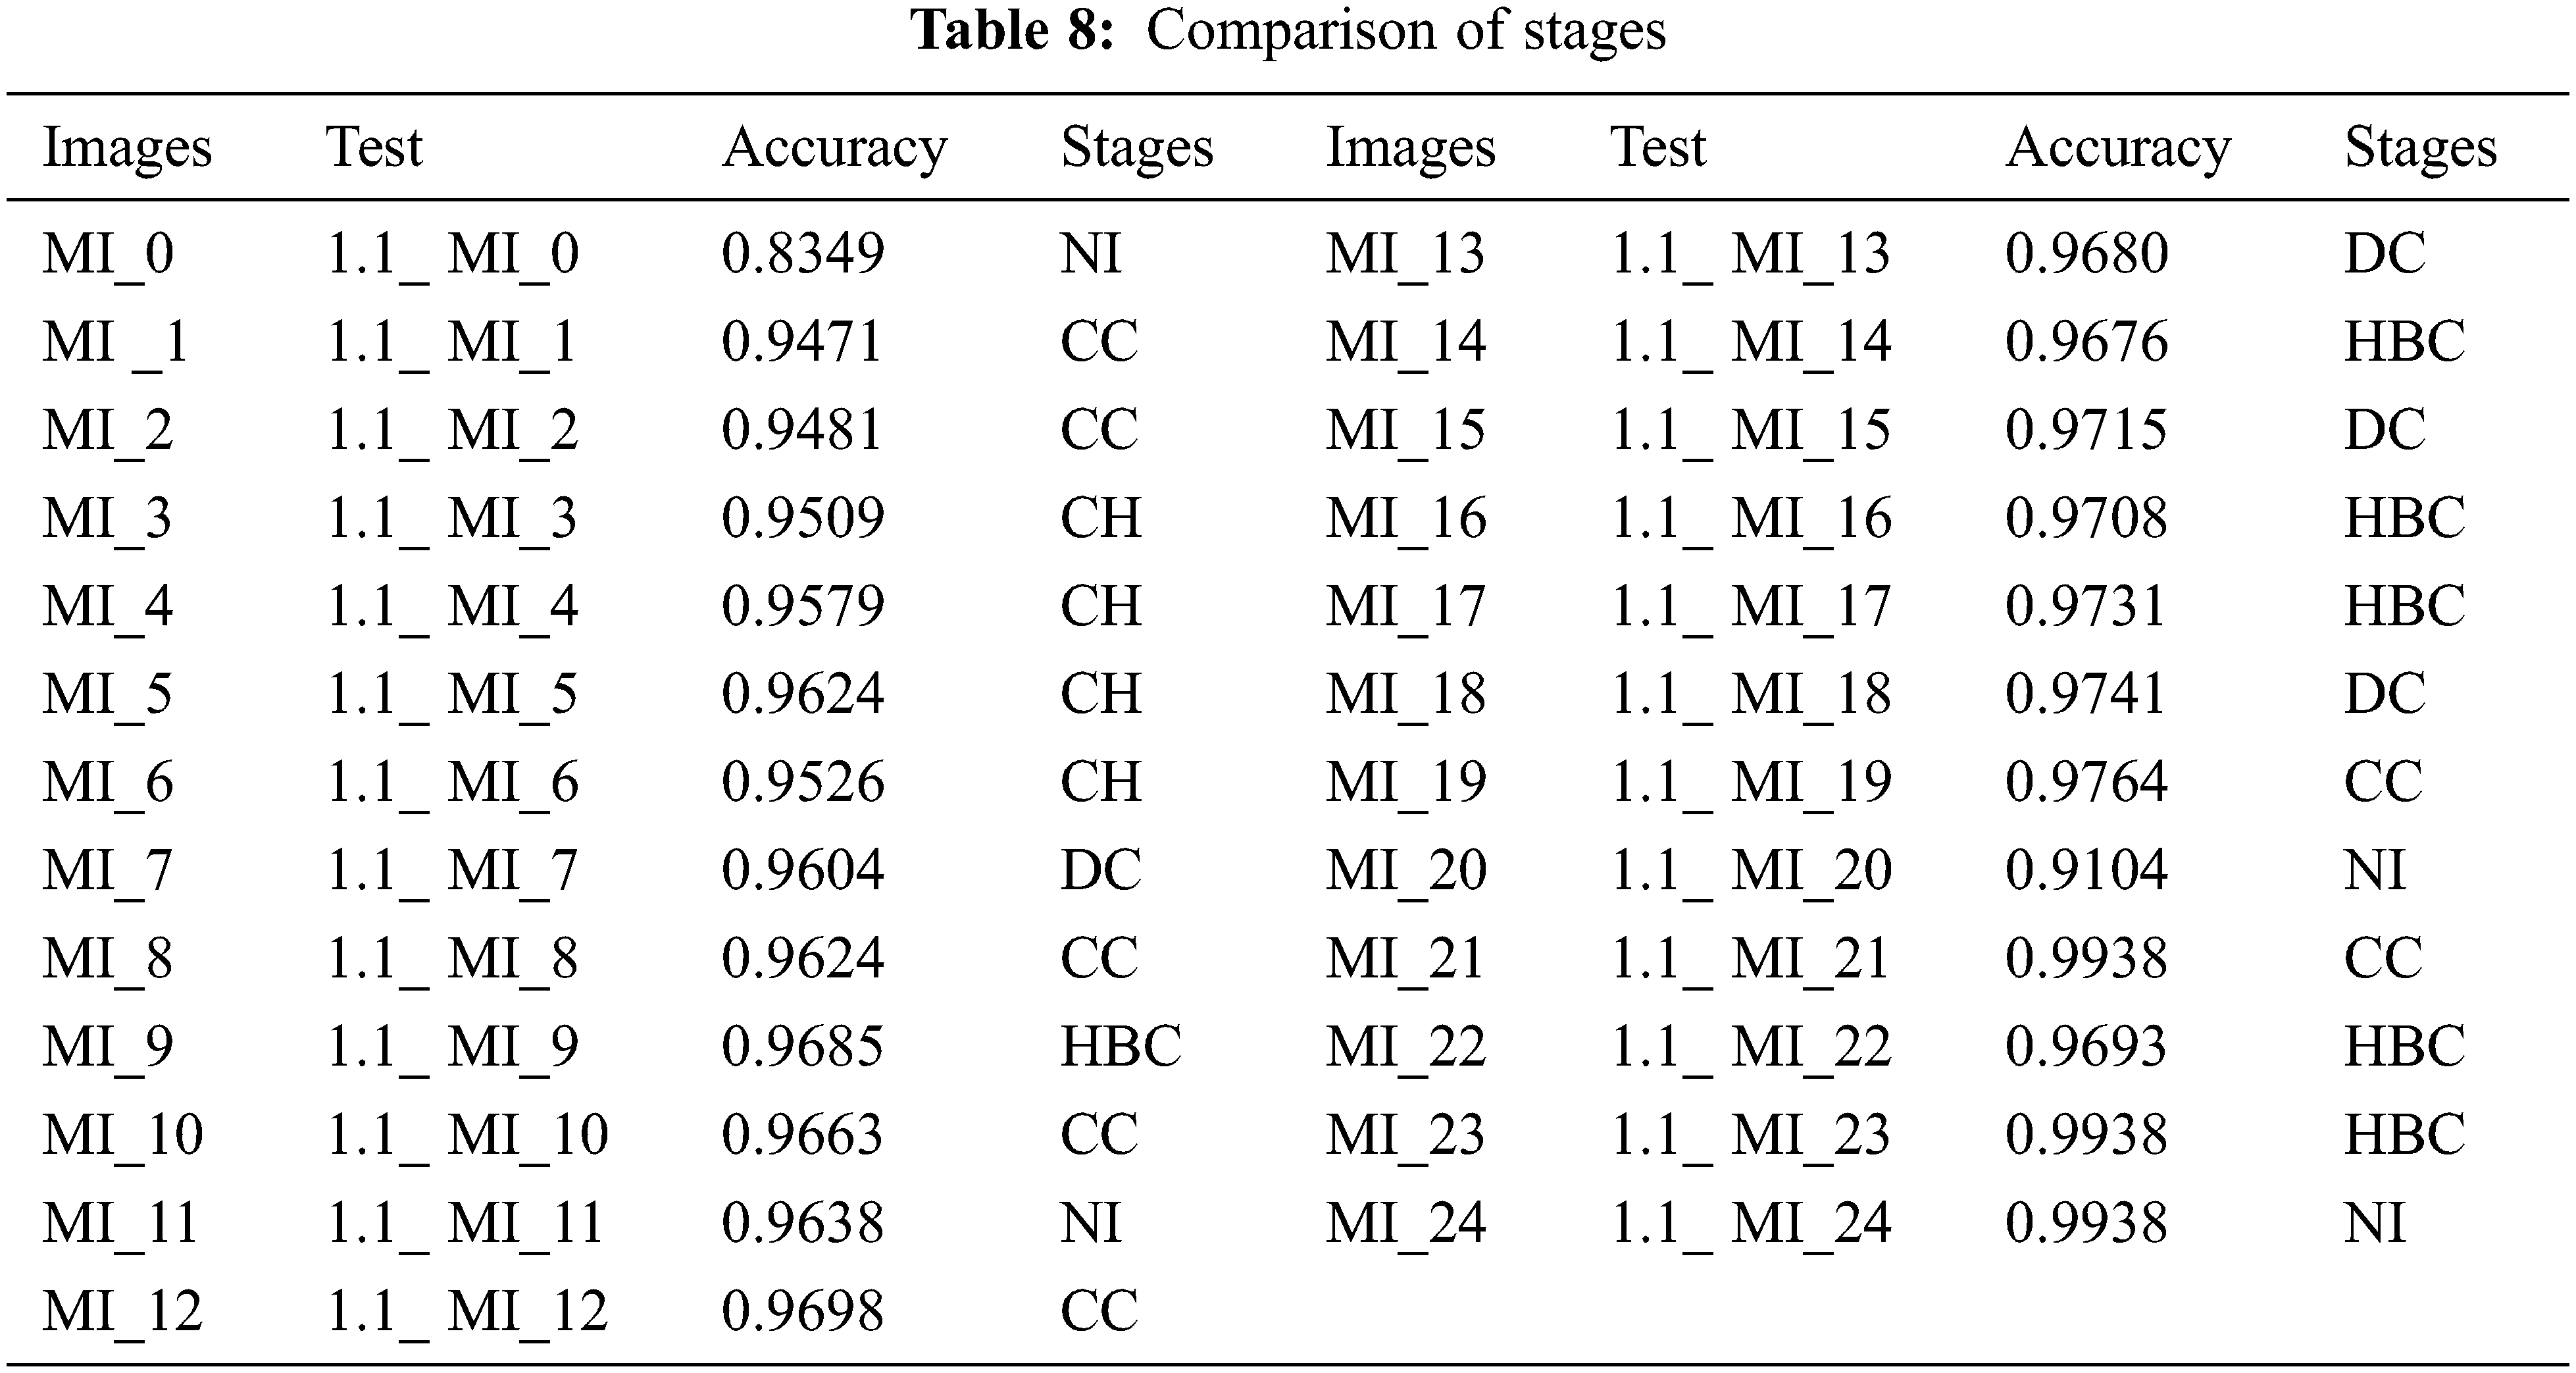

Figure 25: Analysis of accuracy

Figure 26: Analysis of classifiers outcomes
This work aimed to assess the performance of CNN Classification CT and Ultrasound for the diagnosis, using several features extracted from ultrasound and CT images. The authors used clinical data, assuming the number of stadiums in the liver was characteristic. The calculated features from the textural, histogram and fractal approaches had positive outcomes as inputs from the classifiers used—the classification system is improved by CNN when a progressive regression shows the seven more discriminatory features. Although the classifier’s performance did not differentiate so clearly at this level, it was suggested that CNN would generally perform better due to the good relationship between AUC and accuracy.
Funding Statement: The authors are grateful to the Taif University Researchers Supporting Project number (TURSP-2020/36), Taif University, Taif, Saudi Arabia.
Conflicts of Interest: The authors declare that they have no conflicts of interest to report regarding the present study.
References
1. B. A. Jourabloo, M. Ye, X. Liu and L. Ren, “Do convolutional neural networks learn class hierarchy?,” IEEE Transactions on Visualization and Computer Graphics, vol. 24, no. 1, pp. 152–162, 2018. [Google Scholar]
2. C. A. A. Febres, S. Alghamdi, K. Krishnamurthy and R. J. Poppiti, “Liver fibrosis helps to distinguish autoimmune hepatitis from Dili with autoimmune features: A review of twenty cases,” Journal of Clinical and Translational Liver Diseases, vol. 7, no. 1, pp. 21–26, 2019. [Google Scholar]
3. D. M. Sabatini, “mTOR and cancer: Insights into a complex relationship,” Nature Reviews Cancer, vol. 6, no. 9, pp. 729–734, 2006. [Google Scholar]
4. S. Sudhakar and S. Chenthur Pandian, “Hybrid cluster-based geographical routing protocol to mitigate malicious nodes in mobile ad hoc network,” International Journal of Ad Hoc and Ubiquitous Computing, vol. 21, no. 4, pp. 224–236, 2016. [Google Scholar]
5. D. Spinczyk and A. Krasoń, “Automatic liver segmentation in computed tomography using general-purpose shape modeling methods,” Biomedical Engineering Online, vol. 17, no. 1, pp. 1–13, 2018. [Google Scholar]
6. F. Bessone, M. V. Razori and M. G. Roma, “Molecular pathways of nonalcoholic fatty liver disease development and progression,” Cellular and Molecular Life Sciences, vol. 76, no. 1, pp. 99–128, 2019. [Google Scholar]
7. J. J. P. M. Y. Alotaibi, O. I. Khalaf and S. Alghamdi, “Heap bucketization anonymity-an efficient privacy-preserving data publishing model for multiple sensitive attributes,” IEEE Access, vol. 10, pp. 28773–28791, 2022. [Google Scholar]
8. K. Doi, “Computer-aided diagnosis in medical imaging: Historical review current status and future potential,” Computerized Medical Imaging and Graphics, vol. 31, no. 4–5, pp. 198–211, 2007. [Google Scholar]
9. M. Budak, Y. Guo, E. Tanyildizi and A. Łengr, “Cascaded deep convolutional encoder-decoder neural networks for efficient liver tumor segmentation,” Medical Hypotheses, vol. 134, no. 2, pp. 109431, 2020. [Google Scholar]
10. M. Furuzuki, H. Lu, H. Kim, Y. Hirano, S. Mabu et al., “A detection method for liver cancer region based on faster R-CNN,” in 19th Int. Conf. on Control, Automation and Systems, Jeju, Korea, pp. 808–811, 2019. [Google Scholar]
11. S. Sudhakar and S. Chenthur Pandian, “A Trust and co-operative nodes with affects of malicious attacks and measure the performance degradation on geographic aided routing in mobile ad hoc network,” Life Science Journal, vol. 10, no. 4s, pp. 158–163, 2013. [Google Scholar]
12. S. Sudhakar and S. Chenthur Pandian, “An efficient agent-based intrusion detection system for detecting malicious nodes in MANET routing,” International Review on Computers and Software, vol. 7, no. 6, pp. 3037–3304, 2012. [Google Scholar]
13. M. S. Couceiro, R. P. Rocha, N. M. F. Ferreira and J. A. T. Machado, “‘Introducing the fractional-order darwinian PSO,” Signal, Image Video Processing, vol. 6, no. 3, pp. 343–350, 2012. [Google Scholar]
14. P. Bharti, D. Mittal and R. Ananthasivan, “Characterization of chronic liver disease based on ultrasound images using the variants of grey-level difference matrix,” Proceedings of the Institution of Mechanical Engineers Part H Journal of Engineering in Medicine, vol. 232, no. 9, pp. 884–900, 2018. [Google Scholar]
15. T. Ilyas, A. Khan, M. Umraiz and H. Kim, “SEEK a framework of superpixel learning with CNN features for unsupervised segmentation,” Electronics, vol. 9, no. 3, pp. 383, 2020. [Google Scholar]
16. X. Guo, L. H. Schwartz and B. Zhao, “Automatic liver segmentation by integrating fully convolutional networks into active contour models,” Medical Physics, vol. 46, no. 10, pp. 4455–4469, 2019. [Google Scholar]
17. Y. Liu and S. Chen, “The value of ultrasound-guided fine-needle aspiration biopsy in the qualitative diagnosis of thyroid micronodules,” Shanghai Medical Imaging, vol. 28, no. 1, pp. 42–45, 2019. [Google Scholar]
18. Y. Ming, H. Qu and E. Bertini, “RuleMatrix: Visualizing and understanding classifiers with rules,” IEEE Transactions on Visualization and Computer Graphics, vol. 25, no. 1, pp. 342–352, 2019. [Google Scholar]
19. Z. Wang, Q. Qu, K. Cai and T. Xu, “CT image examination based on virtual reality analysis in clinical diagnosis of gastrointestinal stromal tumors,” Journal of Healthcare Engineering, vol. 2021, no. 9996565, pp. 1–10, 2021. [Google Scholar]
20. Z. Yang, X. Gong, Y. Guo and W. Liu, “A temporal sequence dual-branch network for classifying hybrid ultrasound data of breast cancer,” IEEE Access, vol. 8, pp. 82688–82699, 2020. [Google Scholar]
21. O. Cheikhrouhou, M. Bhatti and R. Alroobaea, “A hybrid DV-hop algorithm using RSSI for localization in large-scale wireless sensor networks,” Sensors, vol. 18, no. 5, pp. 1–14, 2018. [Google Scholar]
22. S. Mehbodniya, A. Bhatia, A. Mashat, E. Mohanraj and S. Sudhakar, “Proportional fairness based energy-efficient routing in wireless sensor network,” Computer Systems Science and Engineering, vol. 41, no. 3, pp. 1071–1082, 2022. [Google Scholar]
23. S. Nanthini, S. N. Kalyani and S. Sudhakar, “Energy-efficient clustering protocol to enhance network lifetime in wireless sensor networks,” Computers, Materials & Continua, vol. 68, no. 3, pp. 3595–3614, 2021. [Google Scholar]
24. S. Stalin David, M. Anam, K. Chandraprabha, S. Arun Mozhi Selvi, D. K. Sharma et al., “Cloud security service for identifying unauthorized user behaviour,” CMC-Computers, Materials & Continua, vol. 70, no. 2, pp. 2581–2600, 2022. [Google Scholar]
25. S. Stalin David, S. Arun Mozhi Selvi, S. Sivaprakash, P. Vishnu Raja, D. K. Sharma et al., “Enhanced detection of glaucoma on ensemble convolutional neural network for clinical informatics,” CMC-Computers, Materials & Continua, vol. 70, no. 2, pp. 2563–2579, 2022. [Google Scholar]
26. S. Sudhakar and S. Chenthur Pandian, “Secure packet encryption and key exchange system in mobile ad hoc network,” Journal of Computer Science, vol. 8, no. 6, pp. 908–912, 2012. [Google Scholar]
27. S. Sudhakar and S. Chenthur Pandian, “Authorized node detection and accuracy in position-based information for MANET,” European Journal of Scientific Research, vol. 70, no. 2, pp. 253–265, 2012. [Google Scholar]
28. P. Dadheech, R. Sheeba, R. Vidya, P. Rajarajeswari, P. Srinivasan et al., “Implementation of internet of things-based sentiment analysis for farming system,” Journal of Computational and Theoretical Nanoscience, vol. 17, no. 12, pp. 5339–5345, 2020. [Google Scholar]
29. P. S. Ngangbam, S. Shruti, R. P. Thandaiah, S. Tripti, R. Selvakumar et al., “Investigation on characteristics of monte carlo model of single-electron transistor using orthodox theory,” Sustainable Energy Technologies and Assessments, vol. 48, no. 101601, pp. 1–15, 2021. [Google Scholar]
30. P. Thirumoorthy, A. Daniyal, B. Surbhi, A. M. Areej, D. Pankaj et al., “Improved energy based multi-sensor object detection in wireless sensor networks,” Intelligent Automation & Soft Computing, vol. 33, no. 1, pp. 227–244, 2022. [Google Scholar]
31. R. Nithya, K. Amudha, A. Syed Musthafa, D. K. Sharma, R. A. Edwin Hernan et al., “An optimized fuzzy-based ant colony algorithm for 5G-MANET,” CMC-Computers, Materials & Continua, vol. 70, no. 1, pp. 1069–1087, 2022. [Google Scholar]
32. R. Vasanthi, O. I. Khalaf, C. A. T. Romero, S. Sudhakar and D. K. Sharma, “Interactive middleware services for heterogeneous systems,” Computer Systems Science and Engineering, vol. 41, no. 3, pp. 1241–1253, 2022. [Google Scholar]
33. N. Keerthana, V. Vinod and S. Sudhakar, “Slicing, tokenization, and encryption-based combinational approach to protect data-at-rest in cloud using TF-Sec model,” Journal of Computational and Theoretical Nanoscience, vol. 17, no. 12, pp. 5296–5306, 2020. [Google Scholar]
34. K. Muthumayil, R. Karuppathal, T. Jayasankar, B. Aruna Devi, N. B. Prakash et al., “A big data analytical approach for prediction of cancer using modified k-nearest neighbour algorithm,” Journal of Medical Imaging and Health Informatics, vol. 11, no. 8, pp. 2120–2125, 2021. [Google Scholar]
35. K. Rajakumari, M. Vinoth Kumar, V. Garima, S. Balu, D. K. Sharma et al., “Fuzzy based ant colony optimization scheduling in cloud computing,” Computer Systems Science and Engineering, vol. 40, no. 2, pp. 581–592, 2022. [Google Scholar]
36. N. Keerthana, V. Viji and S. Sudhakar, “A novel method for multi-dimensional cluster to identify the malicious users on online social networks,” Journal of Engineering Science and Technology, vol. 15, no. 6, pp. 4107– 4122, 2020. [Google Scholar]
37. W. Alhakami, A. Alharbi, S. Bourouis, R. Alroobaea and B. Nizar, “Network anomaly intrusion detection using a nonparametric bayesian approach and feature selection,” IEEE Access, vol. 7, pp. 52181–52190, 2019. [Google Scholar]
38. A. Roobaea, A. Rajakumar, R. Saeed, A. S. Fahd, T. Usman Tariq et al., “AI-assisted bio-inspired algorithm for secure IoT communication networks,” Cluster Computing, vol. 25, no. 3, pp. 1805–1816, 2022. [Google Scholar]
39. H. Dostdar, I. Muhammad, H. Israr, A. Roobaea, H. Saddam et al., “Face mask detection using deep convolutional neural network and mobilenetv2-based transfer learning,” Wireless Communications and Mobile Computing, vol. 2022, no. 1536318, pp. 1–10, 2022. [Google Scholar]
40. I. Ashraf, P. Yongwan, H. Soojung, K. W. Sung, A. Roobaea et al., “A survey on cyber security threats in IoT-enabled maritime industry,” IEEE Transactions on Intelligent Transportation Systems, pp. 1–14, 2022. [Google Scholar]
41. S. M. Farooq, A. Ansif, A. Roobaea, B. M. Abdullah, J. Y. Mohamed et al., “Untangling computer-aided diagnostic system for screening diabetic retinopathy based on deep learning techniques,” Sensors, vol. 22, no. 5, pp. 1–37, 2022. [Google Scholar]
42. S. Bourouis, A. Zaguia, N. Bouguila and R. Alroobaea, “Deriving probabilistic SVM kernels from flexible statistical mixture models and its application to retinal images classification,” IEEE Access, vol. 7, pp. 1107–1117, 2019. [Google Scholar]
Cite This Article
 Copyright © 2023 The Author(s). Published by Tech Science Press.
This work is licensed under a Creative Commons Attribution 4.0 International License , which permits unrestricted use, distribution, and reproduction in any medium, provided the original work is properly cited.
 Downloads
 Citation Tools