
 Submit a Paper
 Propose a Special lssue
 Open Access
ARTICLE

Real Time Automation and Ratio Control Using PLC & SCADA in Industry 4.0
Dept of Electrical Engineering, Delhi Technological University, Delhi 110042, India
* Corresponding Author: Basant Tomar. Email:
Computer Systems Science and Engineering 2023, 45(2), 1495-1516. https://doi.org/10.32604/csse.2023.030635
Received 30 March 2022; Accepted 17 May 2022; Issue published 03 November 2022
 View Full Text
 Download PDF
Abstract
Industrial Control Systems (ICS) and SCADA (Supervisory Control and Data Acquisition) systems play a critical role in the management and regulation of critical infrastructure. SCADA systems brings us closer to the real-time application world. All process and equipment control capability is typically provided by a Distributed Control System (DCS) in industries such as power stations, agricultural systems, chemical and water treatment plants. Instead of control through DCS, this paper proposes a SCADA and PLC (Programmable Logic Controller) system to control the ratio control division and the assembly line division inside the chemical plant. A specific design and implementation method for development of SCADA/PLC based real time ratio control and automated assembly line system in a chemical plant is introduced. The assembly line division is further divided into sorting stage, filling stage and the auxiliary stage, which includes the capping unit, labelling unit and then the storage. In the ratio control division, we have defined the levels inside the mixer and ratio of the raw materials through human machine interface (HMI) panel. The ratio of raw materials is kept constant on the basis of flow rates of wild stream and manipulated stream. There is a flexibility in defining new levels and the ratios of the raw materials inside the mixer. But here we taken the predefined levels (low, medium, high) and ratios (3:4, 2:1, 2:5). Control valves are used for regulating the flow of the compositions. In the assembly line division, the containers are sorted on the basis of size and type of material used i.e., big sized metallic containers and small sized non-metallic containers by inductive and capacitive proximity sensors. All the processes are facilitated with laser beam type or reflective type sensors on the conveyor system. Building a highly stable and dependable PLC/SCADA system instead of Distributed Control System is required to achieve automatic management and control of chemical industry processes to reduce waste manpower and physical resources, as well as to improve worker safety.Keywords
In simple world, Automation in the engineering scenario means the controlling or handling of any operation or creating and applying various technologies together to produce a finished good with very minimal human intervention [1,2]. Thus, providing uniformity and transparency. As a result, all types of industries are shifting towards Industry 4.0 concept of automation [3]. It has been proved that this is providing better flexibility, improved efficiency and high work to cost ratio in limited time frame for the industries. Earlier the industries were manually operated thus consumed lot of time and money and were inefficient to some extent. But now automation has curtailed all such shortcomings and concerns [4,5]. Now the probable errors have reduced to a great extent in industries. This has resulted into conservation of resources too. Industry 4.0 has following goals and principles in designing: interconnectivity; acquiring real time data; information sharing and transparency; technical assistance in decision making process and decentralization in decisions. Industry 4.0 may be understood as an exhaustive way of interconnecting multiple machineries, different kind of software, smart sensors, modern controllers, actuators together in a structured way for organizing, analyzing, predicting, and utilizing the information of controller outcomes for industrial complex processes [6].
Christler et al. [7] shows the importance of semi-automated process analytics to reduce operator-specific influence on test results of typical analytical methods. This method presented semi-automated methods using liquid handling stations for different biochemical tests like binding affinity and endotoxins. These robust and reproducible analytics also helps in establishment of process analytical technologies and the preparation of downstream processes for quality by design methods.
Pardi [8] reviewed the evolution of automotive manufacturing technologies and organizations, and analyzed the impact of “4th industrial revolution” concepts on their current transformations for employment and work, to assess the potential of digital manufacturing revolution (Industry 4.0) in automation sector.
By merging variable sampling and predictive control techniques, Rahmani [9] presented a scheme for internet-based control of linear automation systems. When actuators receive a new control input signal from the controller, then sensors are activated to sample the plant outputs (based on data driven event). This method offers an easier way for analyzing closed-loop stability when compared to other methodologies.
Kannan [10] highlighted the challenges and future directions in smart process measurement and automation. It also discussed the problem of multiple input and output and confined nature of the industrial processes and non-linearity compensation for sensors. It mainly focused on the measurement of smart processes parameters in automated industry, challenges like non-linearity, uncertainty, noises etc. faced during acquisition of data and then the possible solutions and direction to cater these challenges.
Gil et al. [11] introduced a method for integration of various open communications protocols like MQTT, LoRaWAN, HTTP REST and OPC UA into an IoT platform and interoperable architecture for automated industry applications. The OPC UA protocol’s integration allows for more data-driven applications in automated industrial plants. OPC UA has a Service Oriented Architecture (SOA) for automation networks that uses an appropriate data model to describe variables, objects procedures and services. Zegzhda et al. [12] reviewed the classic DA/HDA/A&E protocols based on Microsoft DCOM and RPC technologies and discussed the vulnerabilities of industrial automation protocols of OPC series. This work systematizes the architectural cyber threats of classical OPCs. The methods of Ethernet-compatible real-time protocols such as PROFINET, EtherNet/IP, Powerlink, EtherCAT, Foundation Fieldbus HSE and Modbus TCP were studied by Aristova [13]. Wireless Ethernet networks’ characteristics and application domains are also discussed.
Mixing of raw materials is the most important process in the medical, paint, chemical, beverage and pharmaceutical industry. The most important aspect of mixing liquids is determining an appropriate raw material ratio that can be carried out qualitatively, accurately, effectively and quantitatively with the aid of technology that does not require human participation. Ratio control method is a special type of feedforward control strategy that can be implemented in these industries to maintain the desired ratio of raw materials [14]. Here two disturbances (raw materials i.e., CH1 (chemical 1) & CH2 (chemical 2)) are measured and then maintained in a fixed ratio to one another. In this method here, the raw materials are measured with respect to the flow rates of each stream. But only one stream can be controlled at a time which is referred to the controlled stream and other one is referred to wild stream. Ratio control strategy is extensively used in chemical industries for various purposes like maintaining a constant predetermined ratio between the stream in the reboiler and feed flow rate of distillation column and reflux ratio of distillation column; keep the optimum ratio in combustion; maintaining a desired ratio of recycle stream and purge stream; holding the fixed ratio of two blended streams to maintain the desired fixed composition for the blend, which will be discussed here.
Here, the purpose is to visualize or foresee the automated chemical plant process. The plant has two stages: the first stage depicts the formation of products with raw materials and the second stage depicts the assembly line operation in supervisory control and data acquisition (SCADA) system, with each stage regulated by separate programmable logic controllers (PLCs). An OMRON (NX1P2-9024DT1) PLC is utilized in both phases, with ladder logic programming assisted by OMRON’s Sysmac Studio Programming Software. Wonderware Intouch SCADA software is used to implement the visualization of both stages separately. The communication between SCADA and PLC is the most important stage in any industry, which can be facilitated with PC through wireless devices nowadays. A regulated power supply, preferable of 24 V DC is required by PLC to execute its functionality. SMPS (switched mode power supply) is a special designed circuit which provides a regulated DC voltage from any unregulated DC/AC voltage source.
When compared to implementing and replacing tones of hard-wired controllers like relays, timers and so on, PLCs are widely used in automated chemical process control industries because they are easily programmable, way more reliable, less time consuming, easy to troubleshoot and have less hardware failure [15,16]. PLCs control numerous inputs and outputs at the same time. PLCs are resistant to vibrations and shocks and are immune to variable system noises and disturbances [17].
The paper has two divisions. The first division includes the ratio control of raw materials and second division includes the assembly line. Each division is further being organized into various sections: Prototype of automated chemical process industry; operation; and at last results are displayed along with some vital discussions.
2 Prototype of Simulated Chemical Process Plant
In a chemical process industry, we have two divisions. The one where the raw materials are processed in a predetermined desired ratio to obtain a final product and the second division is the assembly line area where this final product is being filled into various containers based upon certain factors like size of containers and the type of containers [18–20]. All chemical industries are concerned with products having a constant ratio of raw materials. The first division is primarily dependent on Feedforward Ratio Control technique. As discussed earlier, here we have two streams of disturbances. The one whose flow rate can be measured but it can’t be controlled is called wild (disturbance) stream and the other one whose flow rate can be both measured and controlled is called controllable (manipulated) stream. We have two different ratio control configurations.
In this configuration (Fig. 1), flow rates of both disturbance and manipulated streams are measured and their ratio is determined. Then this determined ratio is compared with predetermined constant ratio or setpoint and the aberration or error generated between the determined ratio and desired constant ratio will gives the correcting signal to ratio controller which is a PLC in our case.
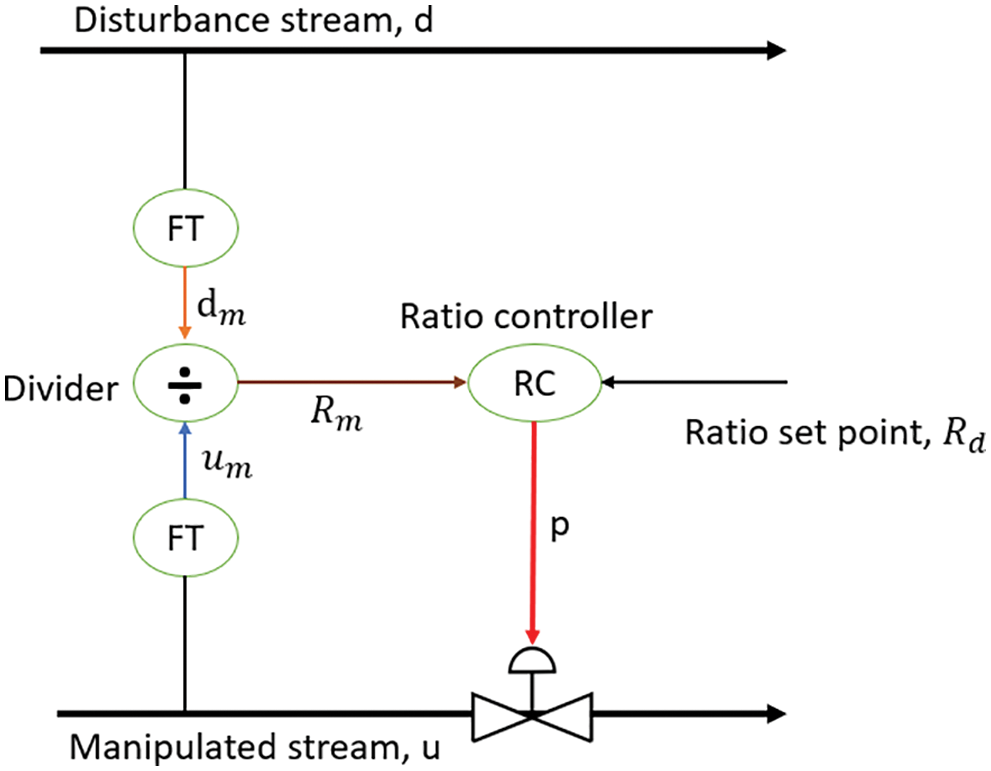
Figure 1: Configuration 1
In this configuration (Fig. 2), first the flow rate of the wild stream is measured and then it is multiplied with our desired constant ratio. The resultant provides the value of the flow rate that the controllable stream must have for predetermined constant ratio and provides a setpoint. Now this setpoint is then compared with the measured value of the flow rate of manipulated stream. The aberration or deviation from actual constant ratio provides the actuating signal to PLC which will adjust the flow rate of controllable stream by control valve.
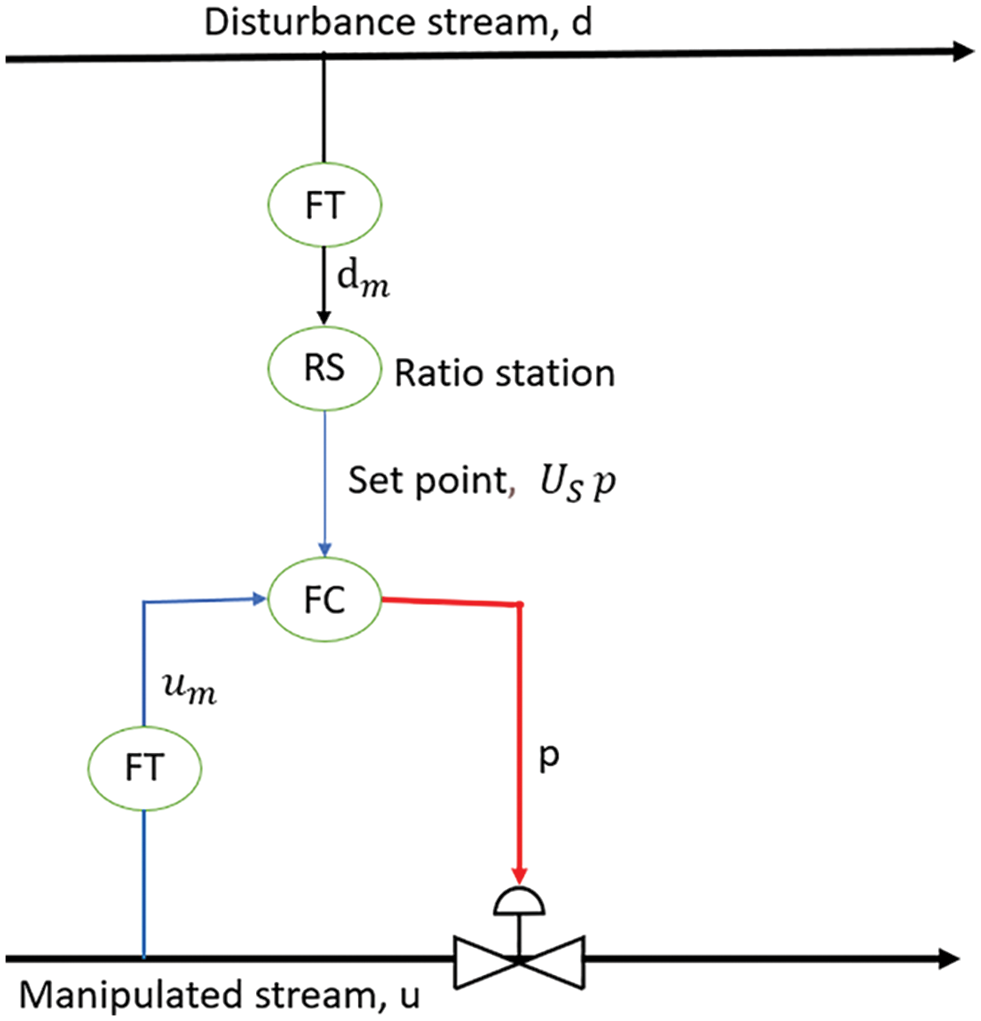
Figure 2: Configuration 2
It is kind of a ratio adjustment mechanism to configuration 2, acting like a feedforward ratio control compensation. Here we take the auxiliary measurement of the controllable stream and adjust the desired ratio.
The block diagram of the ratio controller can be considered in this way where proportional–integral–derivative (PID) controller is taken as a controller within the PLC programming (Fig. 3). PID parameters are achieved through auto tuning method of PID. This facility is provided by Sysmac Studio programming software PID tool box, where we provide the provide the transfer function of plant, disturbances (flow measurements) and final control element control valves.
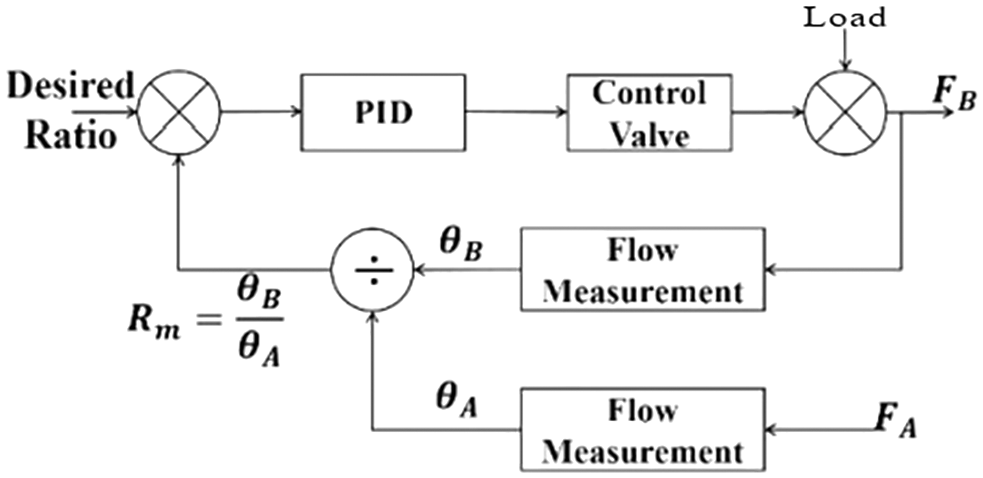
Figure 3: Block diagram of ratio control strategy
The process model of the ratio control division in Wonderware Intouch SCADA software is displayed in Fig. 4. In this prototype model, CH1 (chemical 1) and CH2 (chemical 2) are the raw materials contained in their reservoirs. Pump1; CV1 (control valve 1) and Pump2; CV2 (control valve 2) are the corresponding pumps and valves of wild stream and manipulated stream. These control valves get actuated signals from PLC based on the timers. The actuating time of both valves are decided by the quantities and mixing ratios of CH1 & CH2.
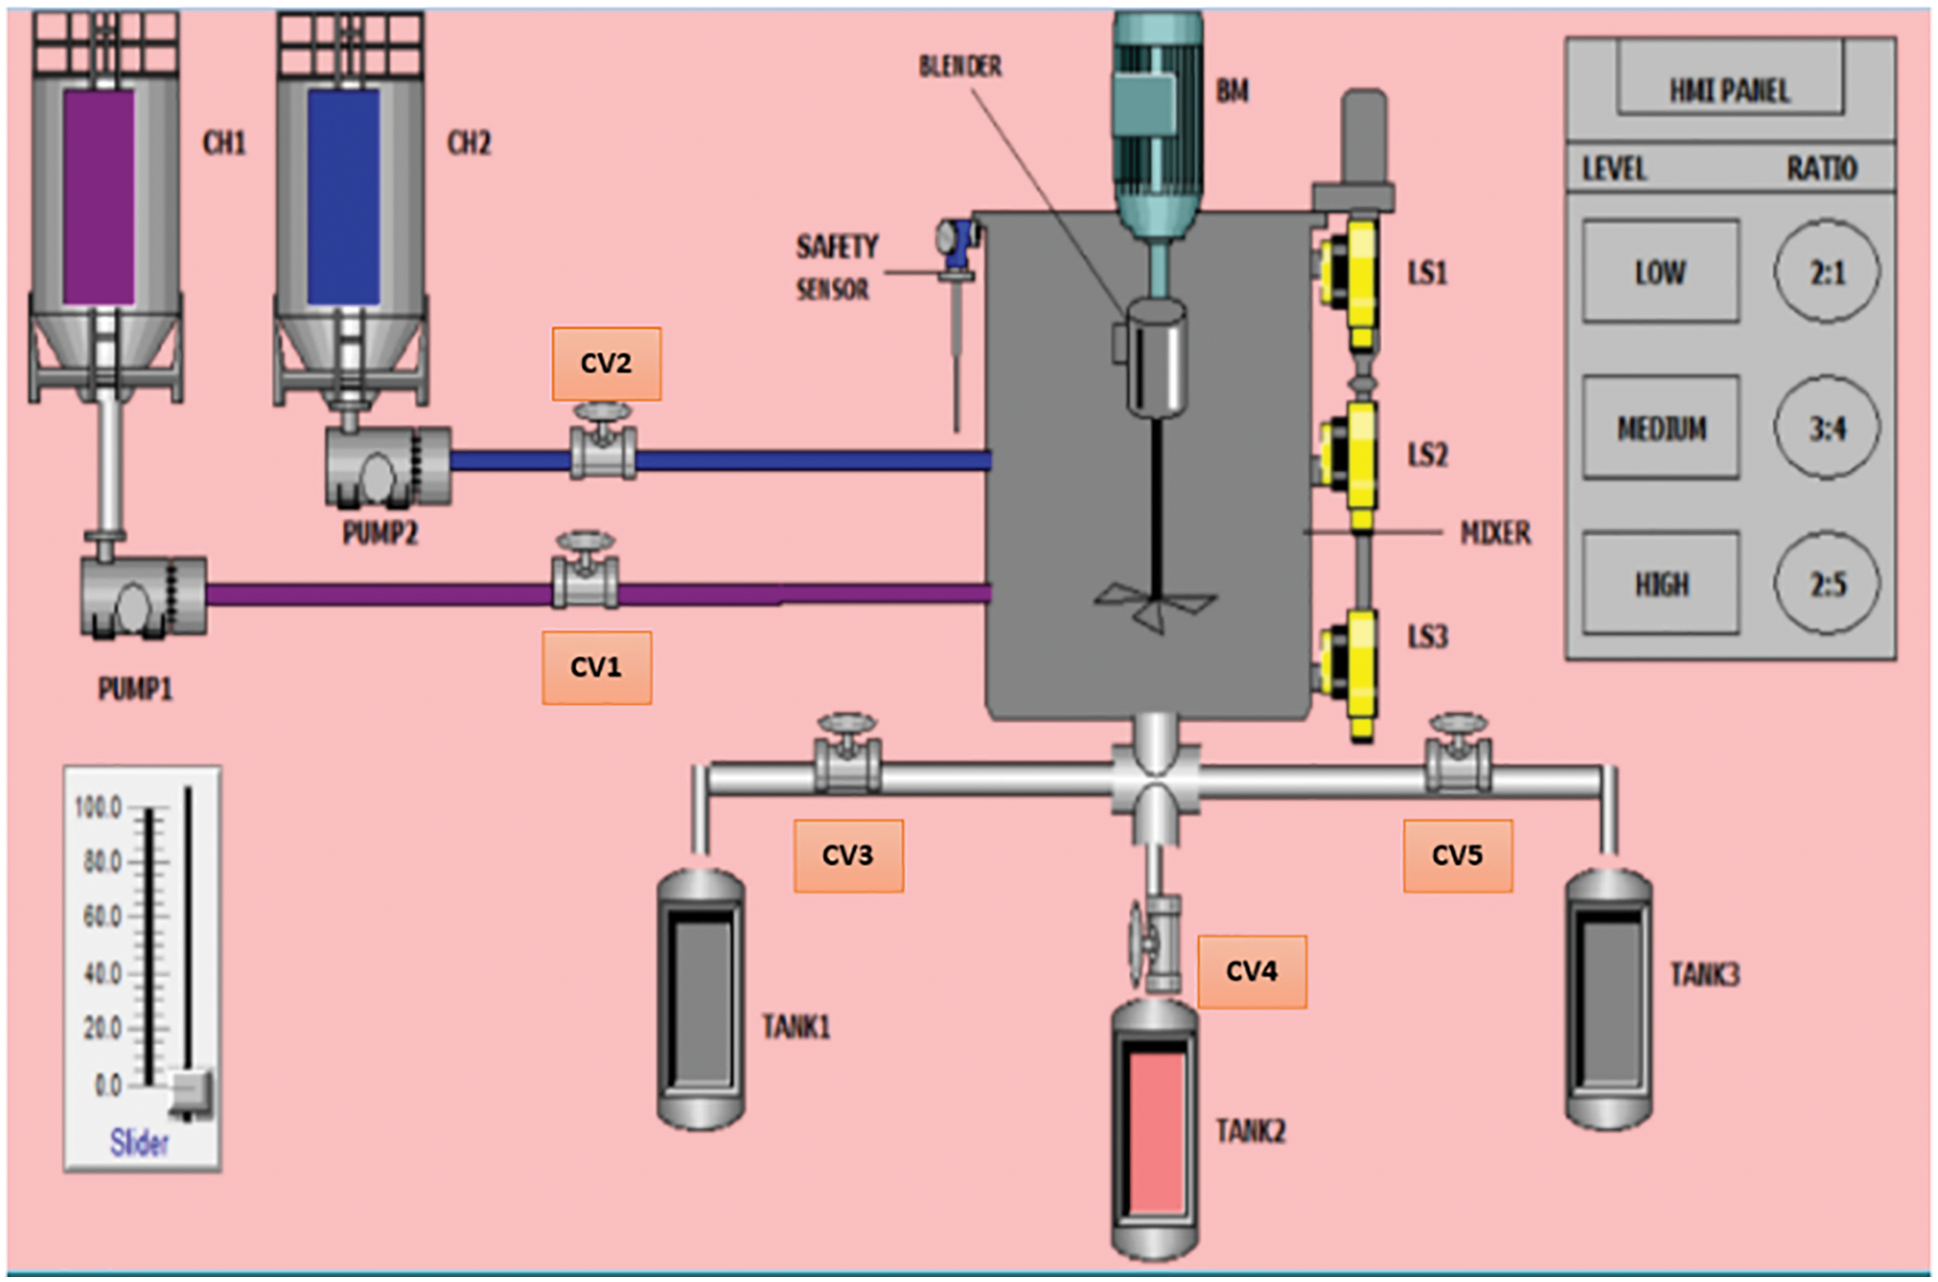
Figure 4: Simulated model of ratio control division in SCADA
The mixer has a blender which is controlled by a DC motor (BM). The mixer is also incorporated with four sensors. LS1, LS2, LS3 are level sensors and one safety sensor for preventing excess or overflowing. After getting the desired product, it is filled to the corresponding tanks: tank1, tank2, tank3. The flow to these tanks is regulated by their corresponding control valves: CV3, CV4, CV5. The ratio of wild stream and manipulated stream and the quantity to be processed i.e., low, medium, high, is controlled by human machine interface (HMI) PANEL.
The second division is the assembly line area where filling and other important assembly processes take place [21]. The framework of assembly line division is shown in Fig. 5. As earlier discussed, after the first process we have final composition of products in various tanks. Now we have to initiate the filling process of these different compositions into containers.
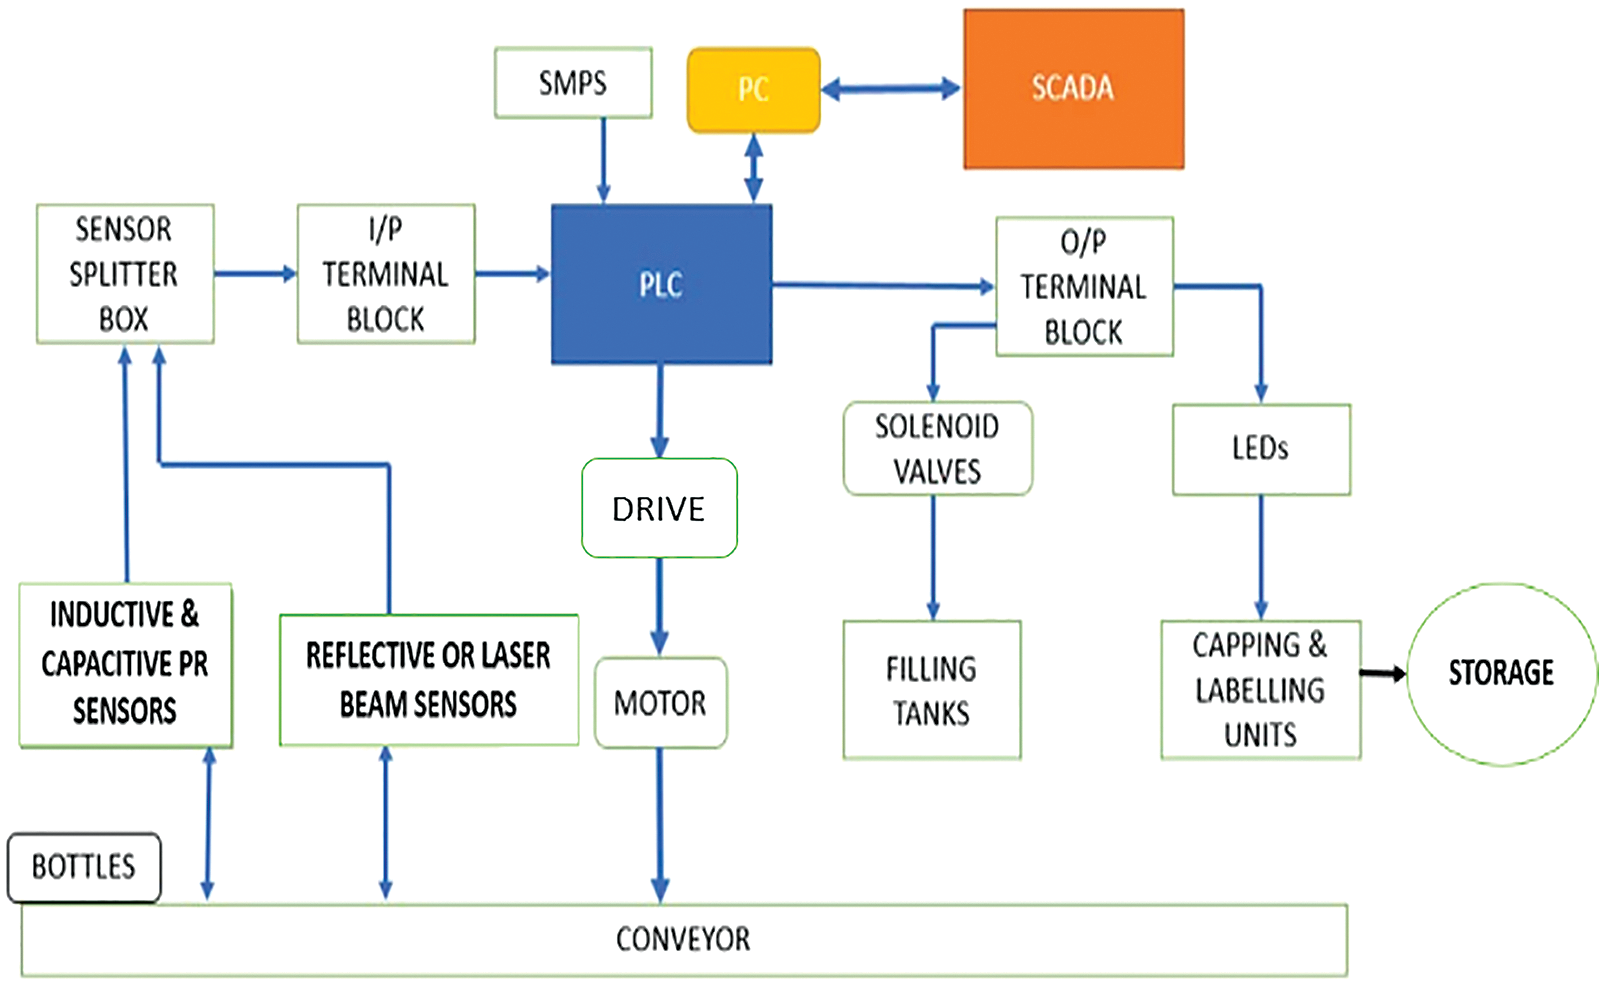
Figure 5: Framework of assembly line division
The entire container filling and other assembly processes are partitioned into various stages:
• Sortation stage: The containers running over the conveyor belt are being categorized on the basis of size as small and big sized containers and on the basis of type of material used as Metallic or Non-Metallic base containers. The sorting metallic and non-metallic ones, Inductive proximity IME10/IME08 sensor is used and for sorting the containers as of size, two capacitive proximity sensors (located on the inside top of the size detector unit) are used. The capacitive proximity sensor can sense any type of container while inductive ones will detect only metallic containers. This is most important stage that decides which composition to be carried out in which container.
• Material filling stage: Containers with various material compositions are filled at this stage. Small metallic base containers will have three liquid compositions, one-third of which will be in each container, but large non-metallic containers will contain only two material compositions, one-third of which will be in each container. Both Laser beam sensors and Photo-electric Retro reflective sensors can be used at this stage. Laser ones will provide the maximum accuracy but cost can be a deciding factor here. Solenoid Valves are used to regulate the flow.
• Auxiliary Assembly line Stage: This stage includes the capping process, labelling process and finally the storage. Here also, both laser beam sensors and Photoelectric retro-reflective sensor can be used.
• Counting Stage: This is the virtual process. Counting process of both type of containers is done at the end in each case within the PLC programming.
PLC is the head unit of this entire second division process. SCADA communicate with PLC through different media via PC. Tab. 1 shows the list of components involved in both operations. Push buttons, sensors act like input devices. Input signals from these devices like inductive proximity (PR) sensors, capacitive PR sensors, laser beam type sensors are sent to PLC. Then the information from these sensors is interpreted, logical operations are performed over this interpreted information and a logical action is commanded for the output connected devices at the output terminal block such as VFD to motor to conveyor belt, LEDs to cap & label units, solenoid valves to filling tanks. Conveyor system movement is facilitated by a DC motor and Drive so that high precision and accuracy can be achieved throughout the motion. Then both types of containers are spotted by capacitive & Inductive PR sensors as well as Photoelectric Retro-reflective sensors or laser beam type sensors, placed over the conveyor system. These all sensors are connected to a box known as sensor splitter, which provides the status of all sensors, whether they are ON/OFF and they are faulty or not. All output devices like solenoid valves and LED indicators are connected to PLC via output terminal block. Different compositions of final product are poured into the containers, which is regulated by solenoid valves, attached to the filling tanks. Similarly, Labelling & Capping units are also regulated with laser beam type sensors or Reflective type sensors through signal conditioning with PLC. These processes are followed by simple handpicked storage. The simulated model of assembly line division in SCADA is shown below in Fig. 6.
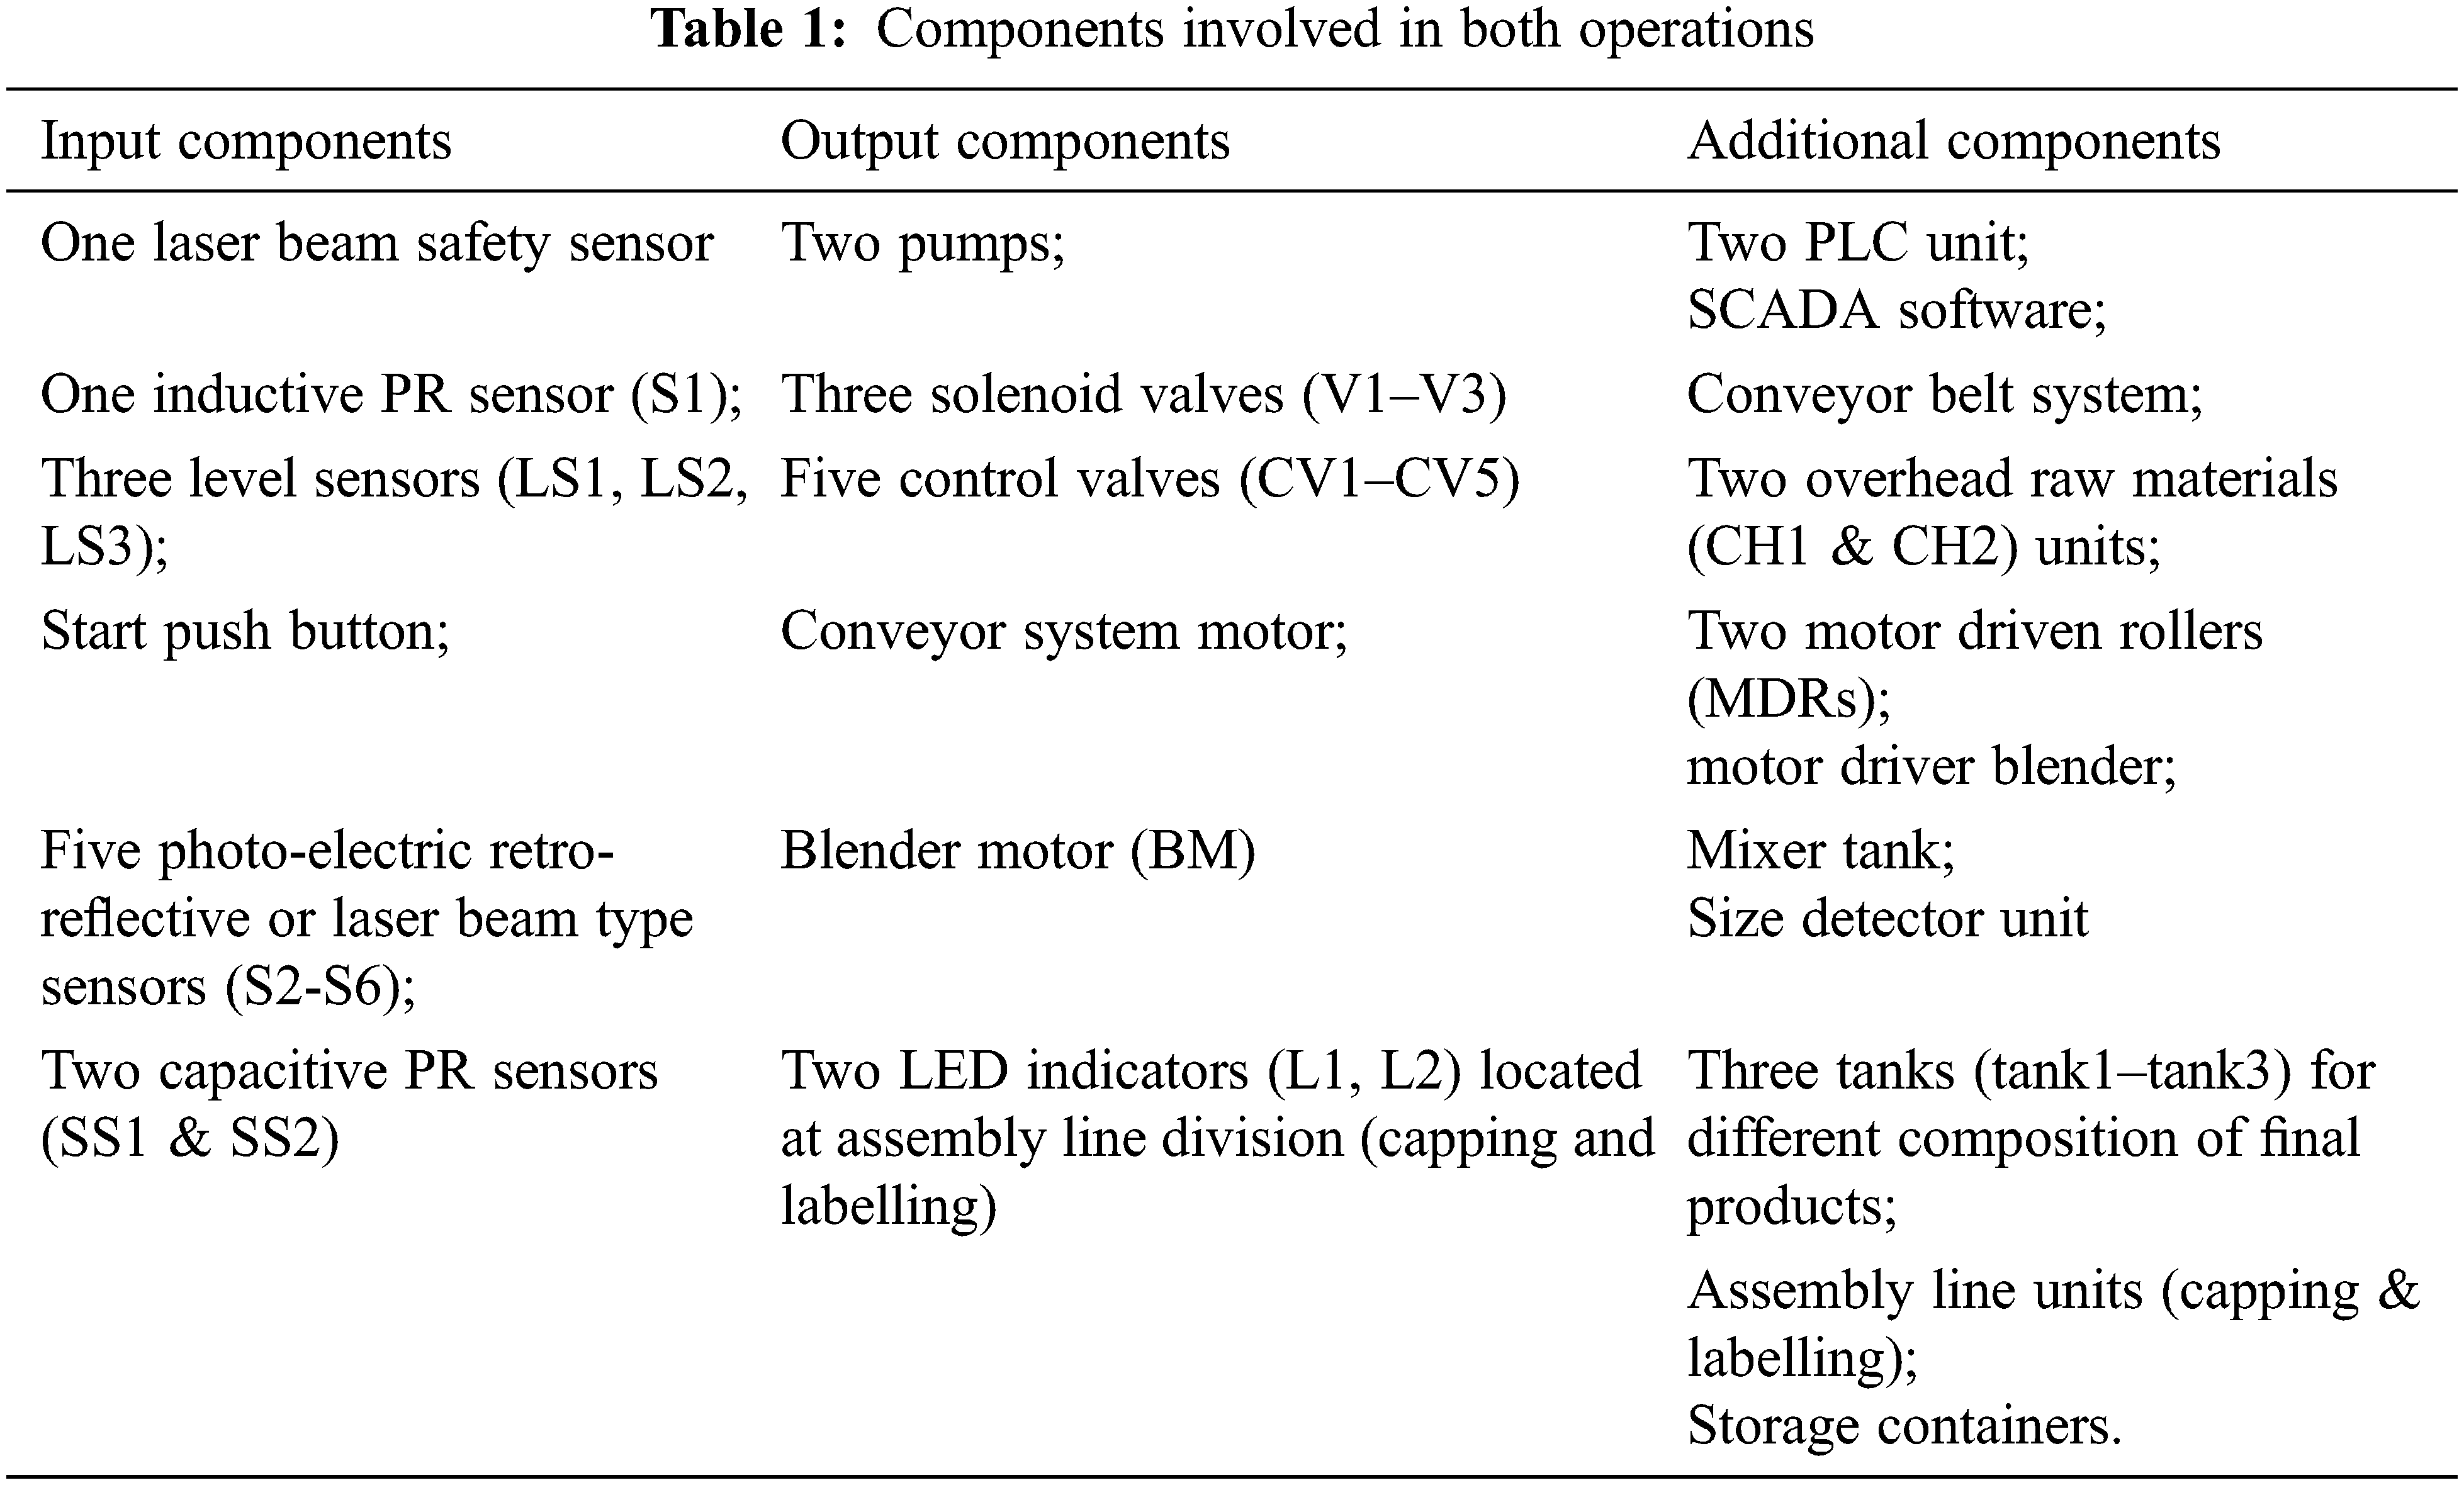
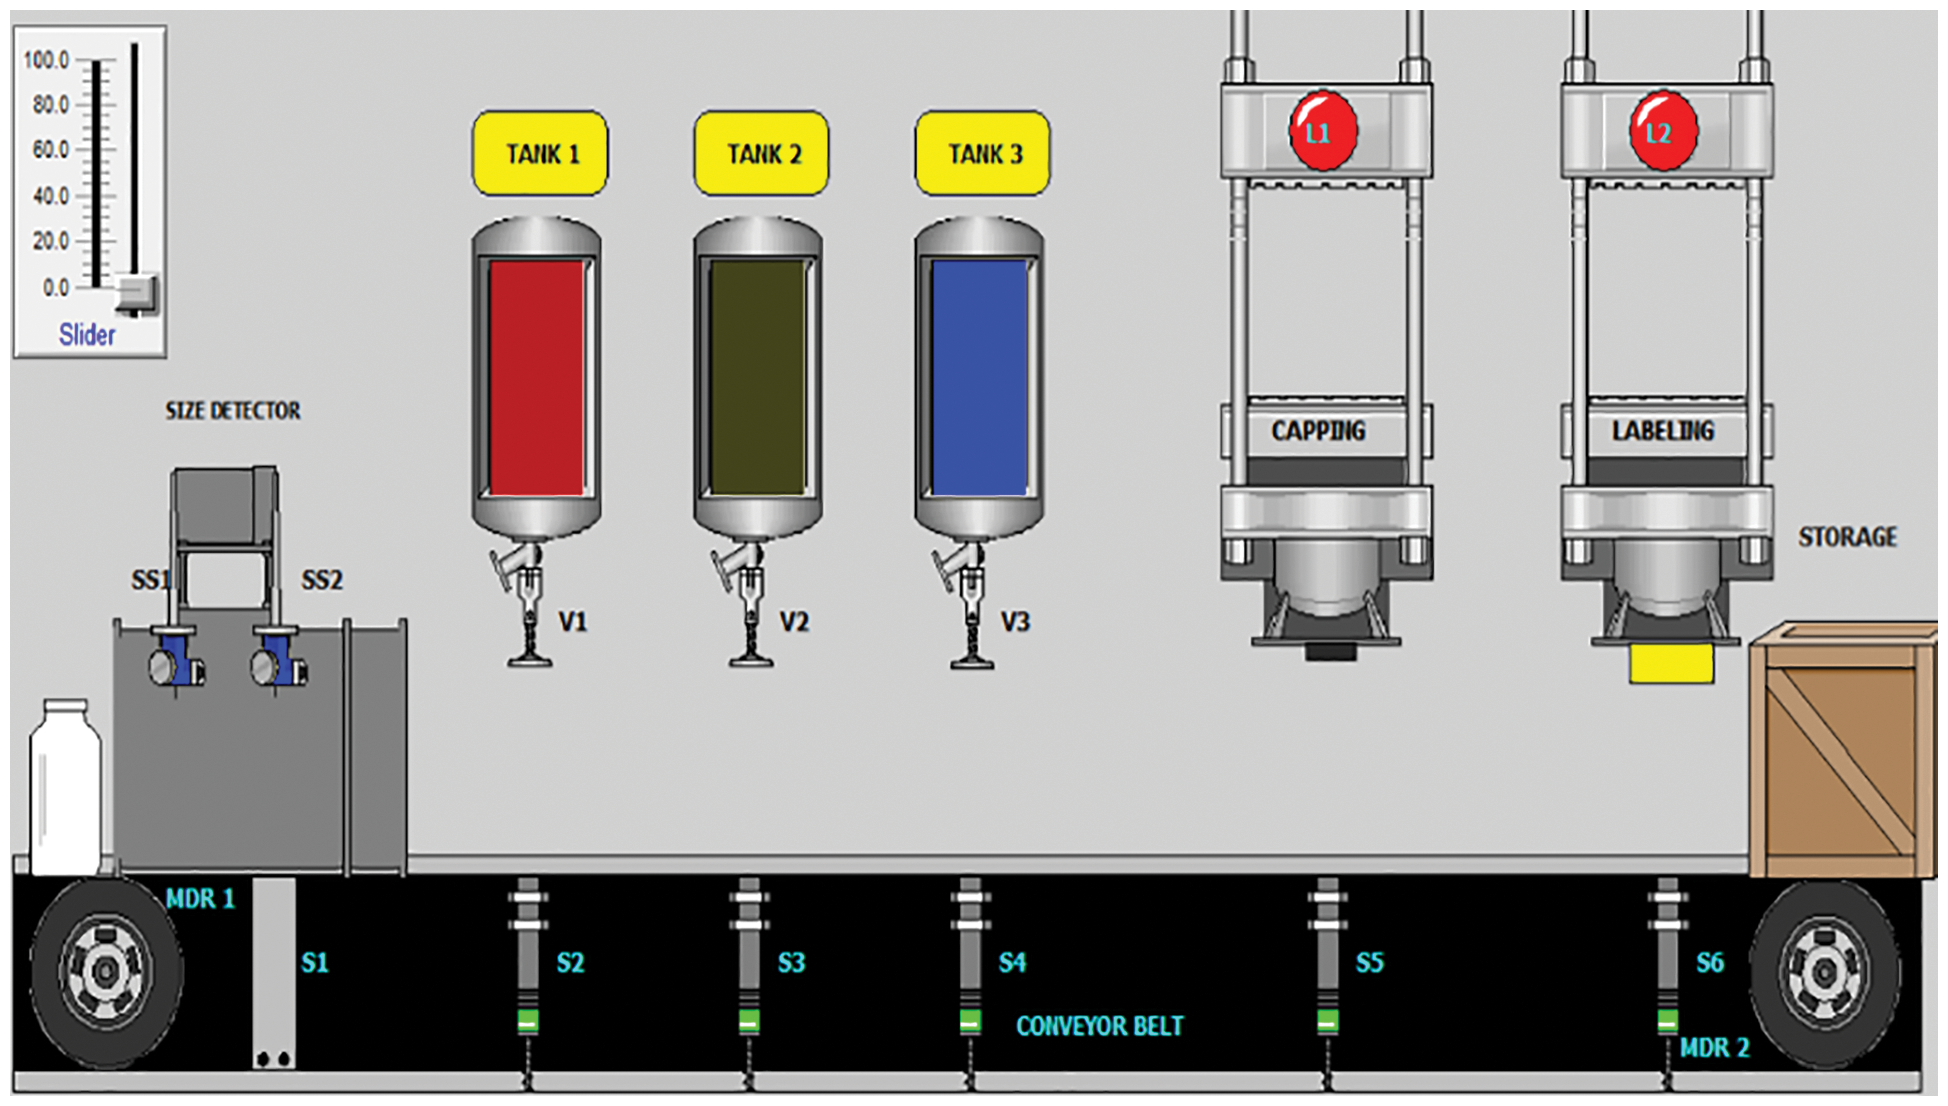
Figure 6: Simulated model of assembly line division in SCADA
The entire system’s functionality of both divisions is explained using the flow charts mentioned in this section.
The above flow chart in Fig. 7 demonstrates the strategy of ratio control division in a chemical process plant. The first step is to check whether the safety sensor is ON or OFF. In case it is high, then alarm will be ON and no further action can’t be taken but if the alarm is OFF, the HMI panel will turn ON and further processes can be executed after that. On HMI panel, we have two categories: LEVEL and RATIO. The level indicator will decide how much final product we need to develop from raw materials CH1 (chemical 1) and CH2 (chemical 2). The ratio indicator will decide the predefined ratio of CH1 to CH2. The level to be decided from LOW, MEDIUM, HIGH. The predefined ratios (CH1:CH2) are 3:4, 2:1, 2:5. We can decide several combinations of level with ratios but here we have chosen three combinations (LOW & 3:4); (MEDIUM & 2:1); (HIGH & 2:5). After selection of level and ratio the pumps and blender motor (DC) ON and the CH1 & CH2 start filling into the MIXER through control valves CV1 & CV2. The time for which these valves should be open is decided by the level and ratio of CH1:CH2.
• LOW & 3:4 = [(CV1 × 30) + (CV2 × 40)] × 0.3 sec
• MEDIUM & 2:1 = [(CV1 × 70) + (CV2 × 35)] × 0.6 sec
• HIGH & 2:5 = [(CV1 × 20) + (CV2 × 50)] × 0.8 sec
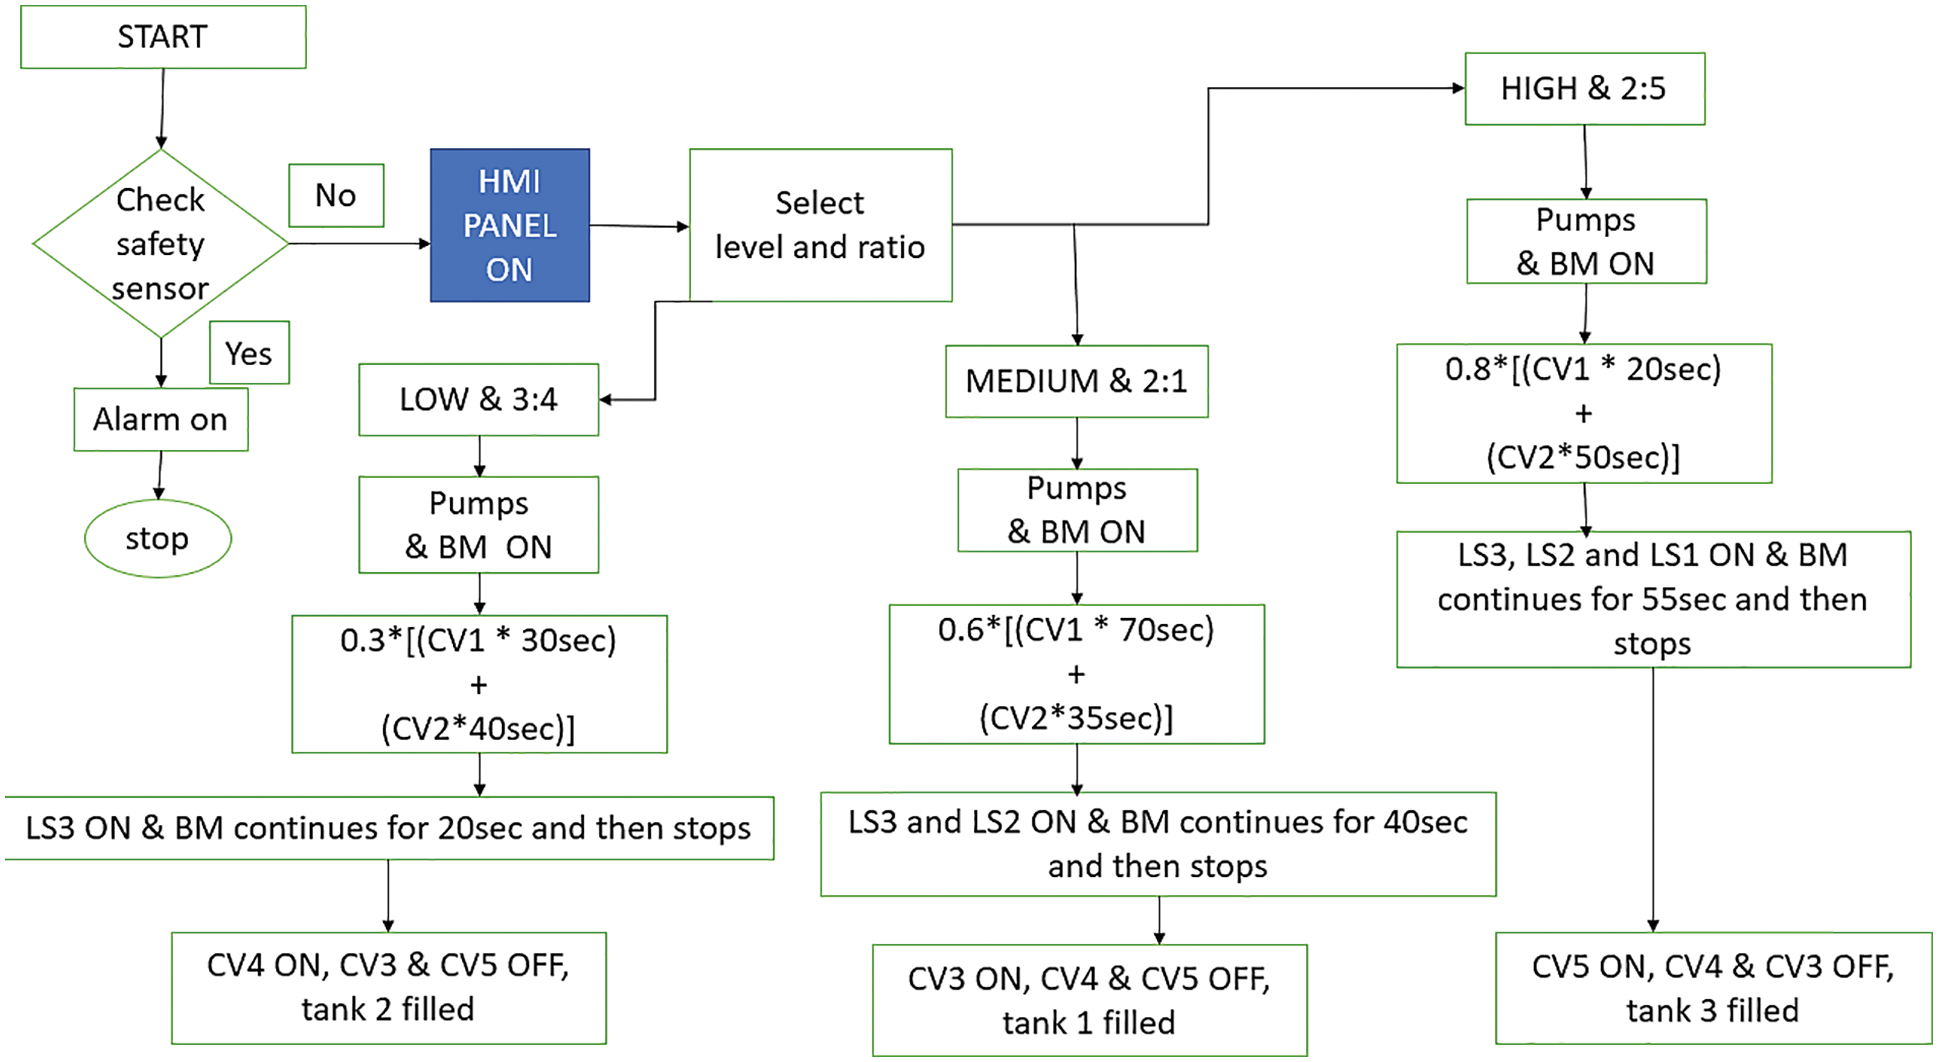
Figure 7: Strategy of ratio control division
During this time BM and level sensors LS1, LS2, LS3 turn ON which indicates the level of the composition inside the mixer. LS3 turns ON to indicate LOW level and remains ON for 20 sec which is the mixer timing for the composition. After this time, CV4 open and CV3 & CV5 remain closed and final product is filled into the tank2. Both LS3 & LS2 turn ON to indicate MEDIUM level and remain ON for 40 sec which is the mixer timing for the composition in this case. After this time, CV3 open and CV5 & CV4 remain closed and final product is filled into the tank1. Similarly, LS3, LS2 & LS1 turn ON to indicate HIGH level and remain ON for 55 sec which is the mixer timing for the composition in this case. After this time, CV5 open and CV3 & CV4 remain closed and final product is filled into the tank3. There is a safety sensor which is present at the top of the mixer, which is to prevent the overflowing of the composition in case of any failures of the level sensors and control valves.
After the ratio control division, the assembly line division is there. Here the motion of the containers along the conveyor belt takes place. So, controlling the motion of the conveyor system is of prime importance. This flow chart in Fig. 8 shows the events when to stop the conveyor motor and it will be in ON state, even after the inputs provided by the sensors. The dynamics of the conveyor belt is governed by the motor driven rollers (MDRs), which are controlled by motor. During the detection of size and material type of container, motor will be in ON state and when any of the other sensors (S2, S3, S4, S5, S6) get HIGH in case of detection of the container, the motor stops. The stopping time depends upon the timer, for which the container is getting filled with compositions from tank1, tank2, tank3, capping unit, labelling unit. After the timer gets OFF, normal running process of conveyor system is resumed after motor turn ON.
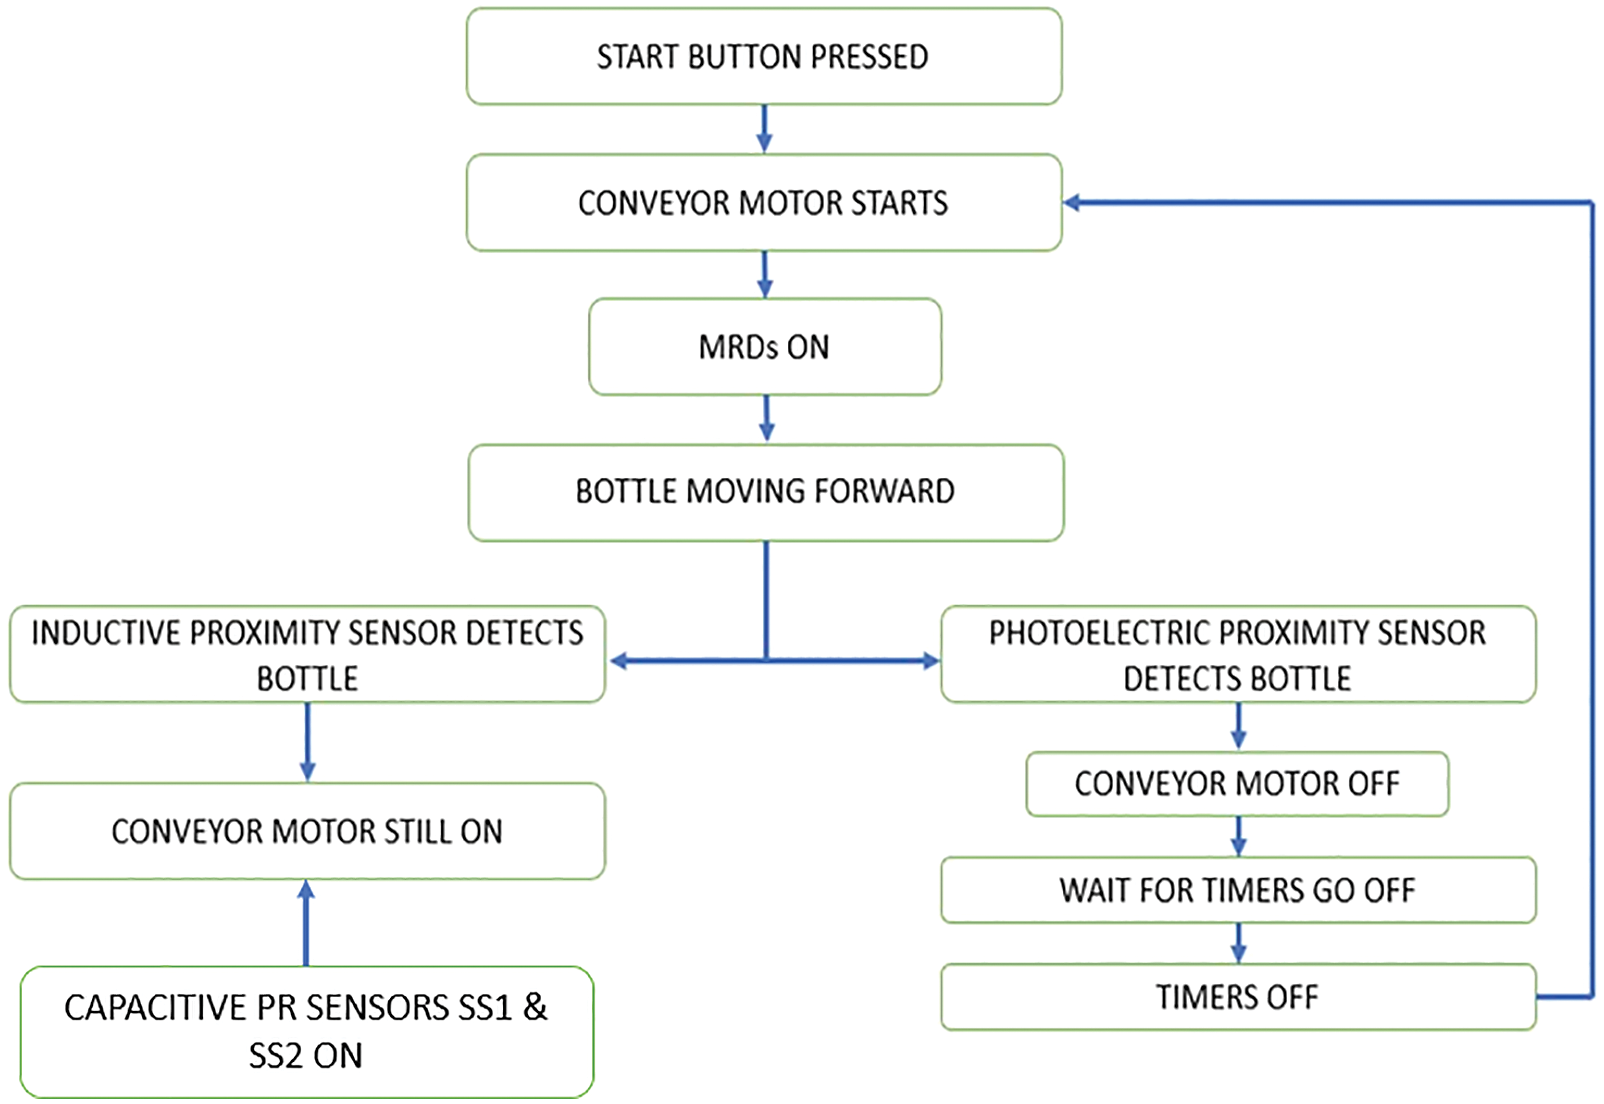
Figure 8: Events of conveyor system
Now the assembly line division is discussed with different sections like sorting, filling and auxiliary processes like capping, labelling and storage in Fig. 9. When the containers start moving along the conveyor belt, the first stage is sorting. Here the sorting of the containers is based on the size and type of material used for container. The smaller ones are non-metallic and the bigger ones are metallic containers. When a big metallic container is moving on the belt, both capacitive PR sensors SS1 & SS2 are HIGH and thus confirm the bigger size. At the same time, the inductive PR sensor gets HIGH and confirm the metallic container. But when the small non-metallic container is moving on the conveyor belt, SS1 turns HIGH and SS2 remains LOW. This indicates the smaller size. The PR sensor also remains LOW, confirms non-metallic container.
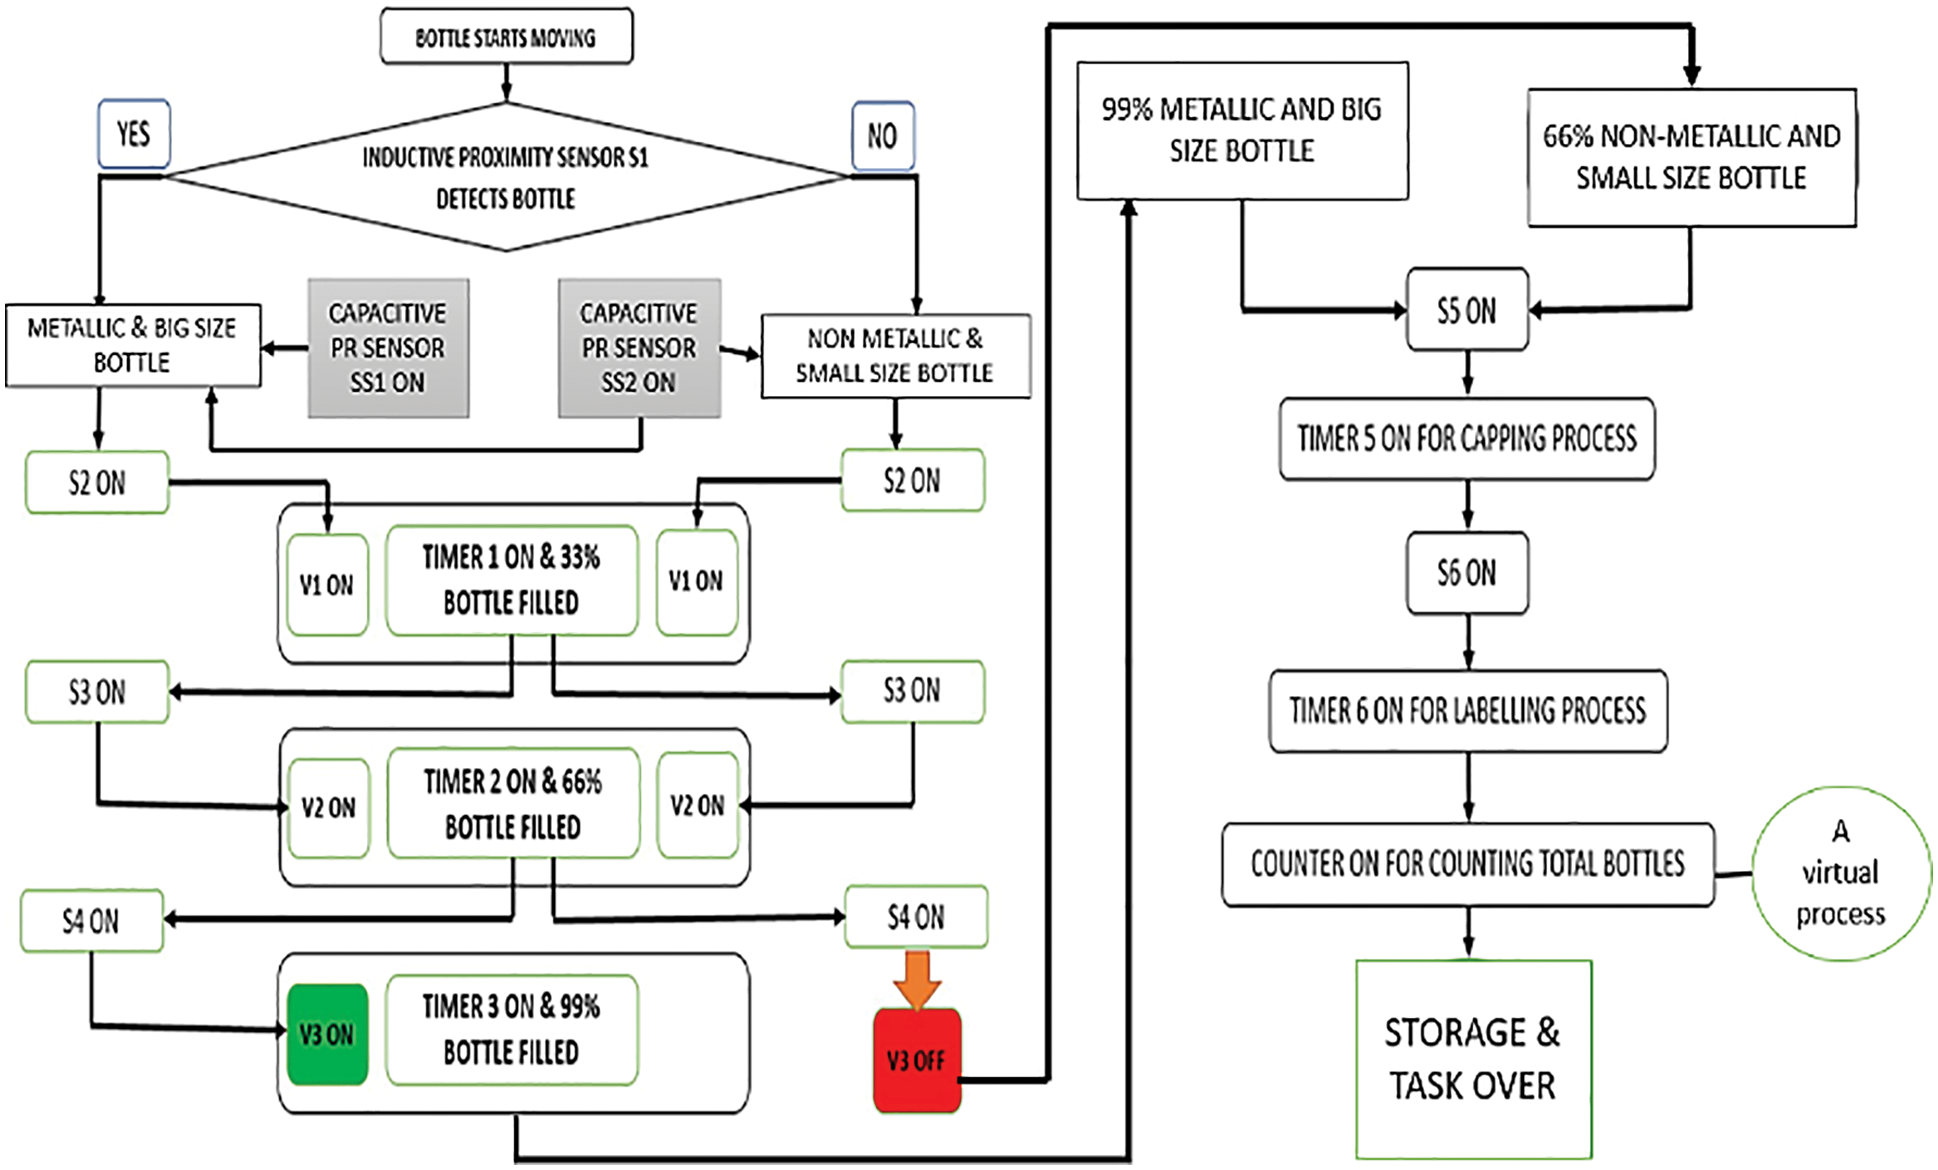
Figure 9: Strategy of assembly line division
After this stage, both category containers move ahead on the conveyor system and in filling stage, these both containers are spotted by the Photoelectric retro-reflective type sensor or laser beam type sensor (S2). The motor stops and conveyor system become stand-still, that follows the opening of solenoid valve (V1) and as a feedback of this signal, the tank1 starts filling its composition into the container and continues for predetermined time of the timer to fill up to one-third of the container. Then the motion of the conveyor system resumes after timer off and it continues its motion until the forthcoming laser beam type sensor (S3) spots the container, which again repeats the previous process.
The motor stops and conveyor system become stand-still, that follows the opening of solenoid valve (V2) and as a feedback of this signal, the tank2 starts filling its composition into the container and continues for predetermined time of the timer to fill up to two-third of the container. Then the motion of the conveyor system resumes after timer off and it continues its motion until the forthcoming laser beam type sensor (S4) spots the container. Now here comes two cases. In case of big and metallic container, the motor stops and conveyor system become stand-still, that follows the opening of solenoid valve (V3) and as a feedback of this signal, the tank2 starts filling its composition into the container and continues for predetermined time of the timer to fill up to brim or 99% of the container. But in case of the small non-metallic container, the motor stops and conveyor system become stand-still. Here, the solenoid valve doesn’t open because there was no feedback from the HIGH level and metallic type signal from SS2 and inductive PR sensor S1, which were there in the previous case.
As a result of this logical process, the small non-metallic container filled with two-third of big metallic container composition in this entire process. Now, these stages are followed by the auxiliary assembly stages which includes capping, labelling and storage. For distinguishing the containers, they are separately labelled and stored. When Photoelectric retro-reflective or laser beam type sensor (S5) spots any type of the containers, the motor stops and conveyor system become stand-still, then the LED indicator L1 of capping unit in auxiliary stage gets HIGH and it is followed by the placing of the caps over the containers. And after the timer of the capping unit goes off, the motor resumes again.
Now again, these both containers are spotted by the Photoelectric retro-reflective type sensor or laser beam type sensor (S6). The motor stops and conveyor system become stand-still, then the LED indicator L2 of labelling unit in auxiliary stage gets HIGH and it is followed by the placing of the different labels over the different type of containers. And after the timer of the labelling unit goes off, the motor resumes again. The containers further move ahead where they are handpicked and stored in different storage cartons.
The SCADA results of both divisions along with explanations are displayed here.
(1) LOW level & 3:4 ratio is selected from HMI panel. Pump1 and pump2 start. CV1 & CV2 of wild and manipulated streams are ON. LS3 indicating the LOW level and BM is ON during the preparation stage. After that CV4 opens and composition is poured into tank2 (refer Fig. 10).
(2) MEDIUM level & 2:1 ratio is selected from HMI panel. Pump1 and pump2 start. CV1 & CV2 of wild and manipulated streams are ON. LS3 & LS2 indicating the MEDIUM level and BM is ON during the preparation stage. After that CV3 opens and composition is poured into tank1 (refer Fig. 11).
(3) HIGH level & 2:5 ratio is selected from plc panel. Pump1 and pump2 start. CV1 & CV2 of wild and manipulated streams are ON. LS3, LS2 & LS1 indicating the HIGH level and BM is ON during the preparation stage. After that CV5 opens and composition is poured into tank3 (refer Fig. 12).
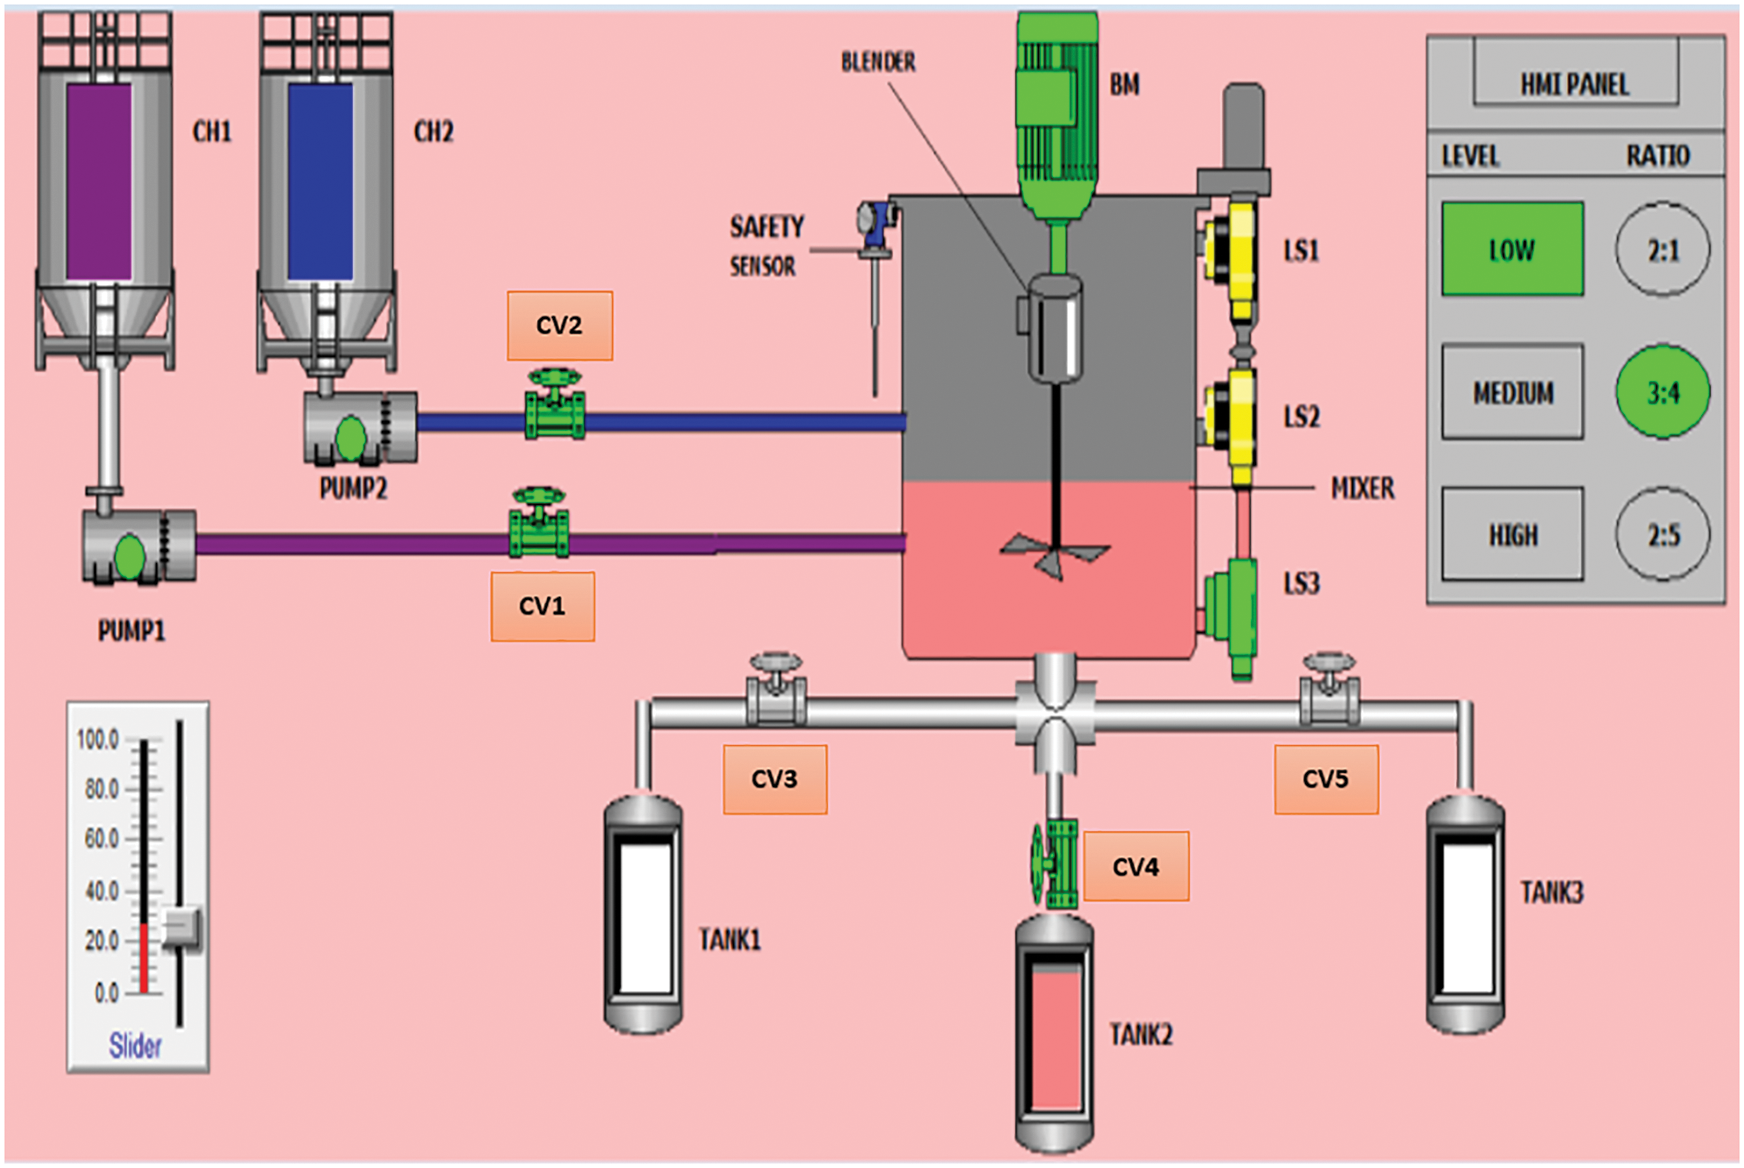
Figure 10: Low level and 3:4 ratio of ratio control division
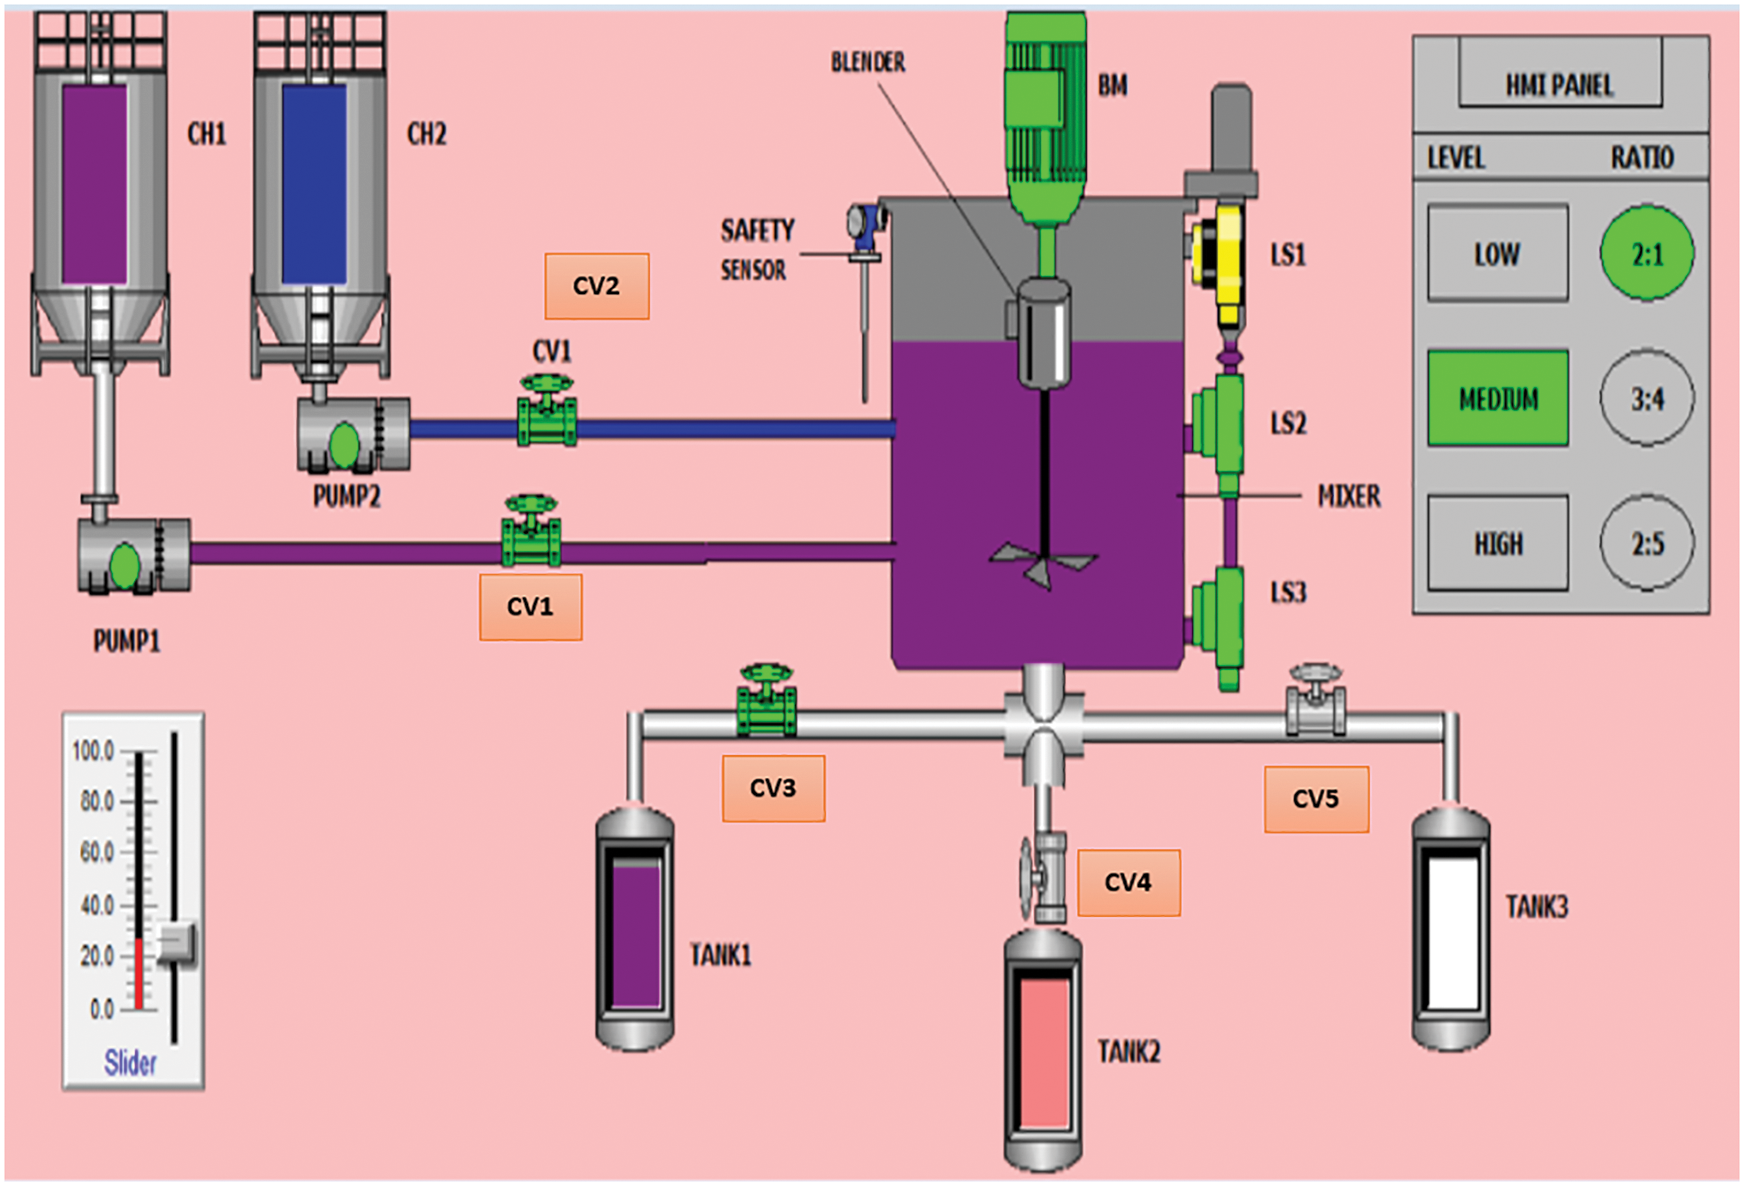
Figure 11: Medium level and 2:1 ratio of ratio control division

Figure 12: High level and 2:5 ratio of ratio control division
Here the chosen color combination of tank1, tank2 and tank3 is different from that of the ratio control division. This shows that we can also change the ratio of the compositions according to our need.
(1)Inductive PR sensor (S1) and capacitive PR sensors (SS1 & SS2) are detecting metallic base and big size containers respectively (refer Fig. 13a).
(2) Inductive PR sensor bypassing the non-metallic base container and only capacitive PR sensor (SS1) is HIGH and SS2 is LOW. Thus, detecting only small size container (refer Fig. 13b).
(3) (S2) laser beam type or Photo-electric retro-reflective sensor spot both type of containers. As a result, the conveyor motor stops, which results (V1) valve to open and both containers got filled with tank1 composition up to one-third level (refer Fig. 14a).
(4) (S3) laser beam type or Photo-electric retro-reflective sensor spot both type of containers. As a result, the conveyor motor stops, which results (V2) valve to open and both containers got filled with tank2 composition up to two-third level (refer Fig. 14b).
(5) (S4) laser beam type or Photo-electric retro-reflective sensor spot big size metallic type of containers. As a result, the conveyor motor stops, which results (V3) valve to open and both containers got filled with tank3 composition upto the brim or 99% level (refer Fig. 15a).
(6) (S4) laser beam type or Photo-electric retro-reflective sensor spot small size non-metallic type of containers. As a result, the conveyor motor stops. But the solenoid valve is not open. So, the container is filled with two-third composition of the total composition filled in big size metallic container (refer Fig. 15b).
(7) (S5) laser beam type or Photo-electric retro-reflective sensor spot both type of containers. As a result, the conveyor motor stops, (L1) led indicator turns HIGH and capping unit places caps onto both type of containers (refer Fig. 16).
(8) (S6) laser beam type or Photo-electric retro-reflective sensor spot both type of containers. As a result, the conveyor motor stops, (L2) led indicator turns HIGH and labelling unit places labels over both type of containers but with different colors in order to identify the containers (refer Fig. 17).
(9) After all the processes, here comes the storage of the containers (refer Fig. 18).
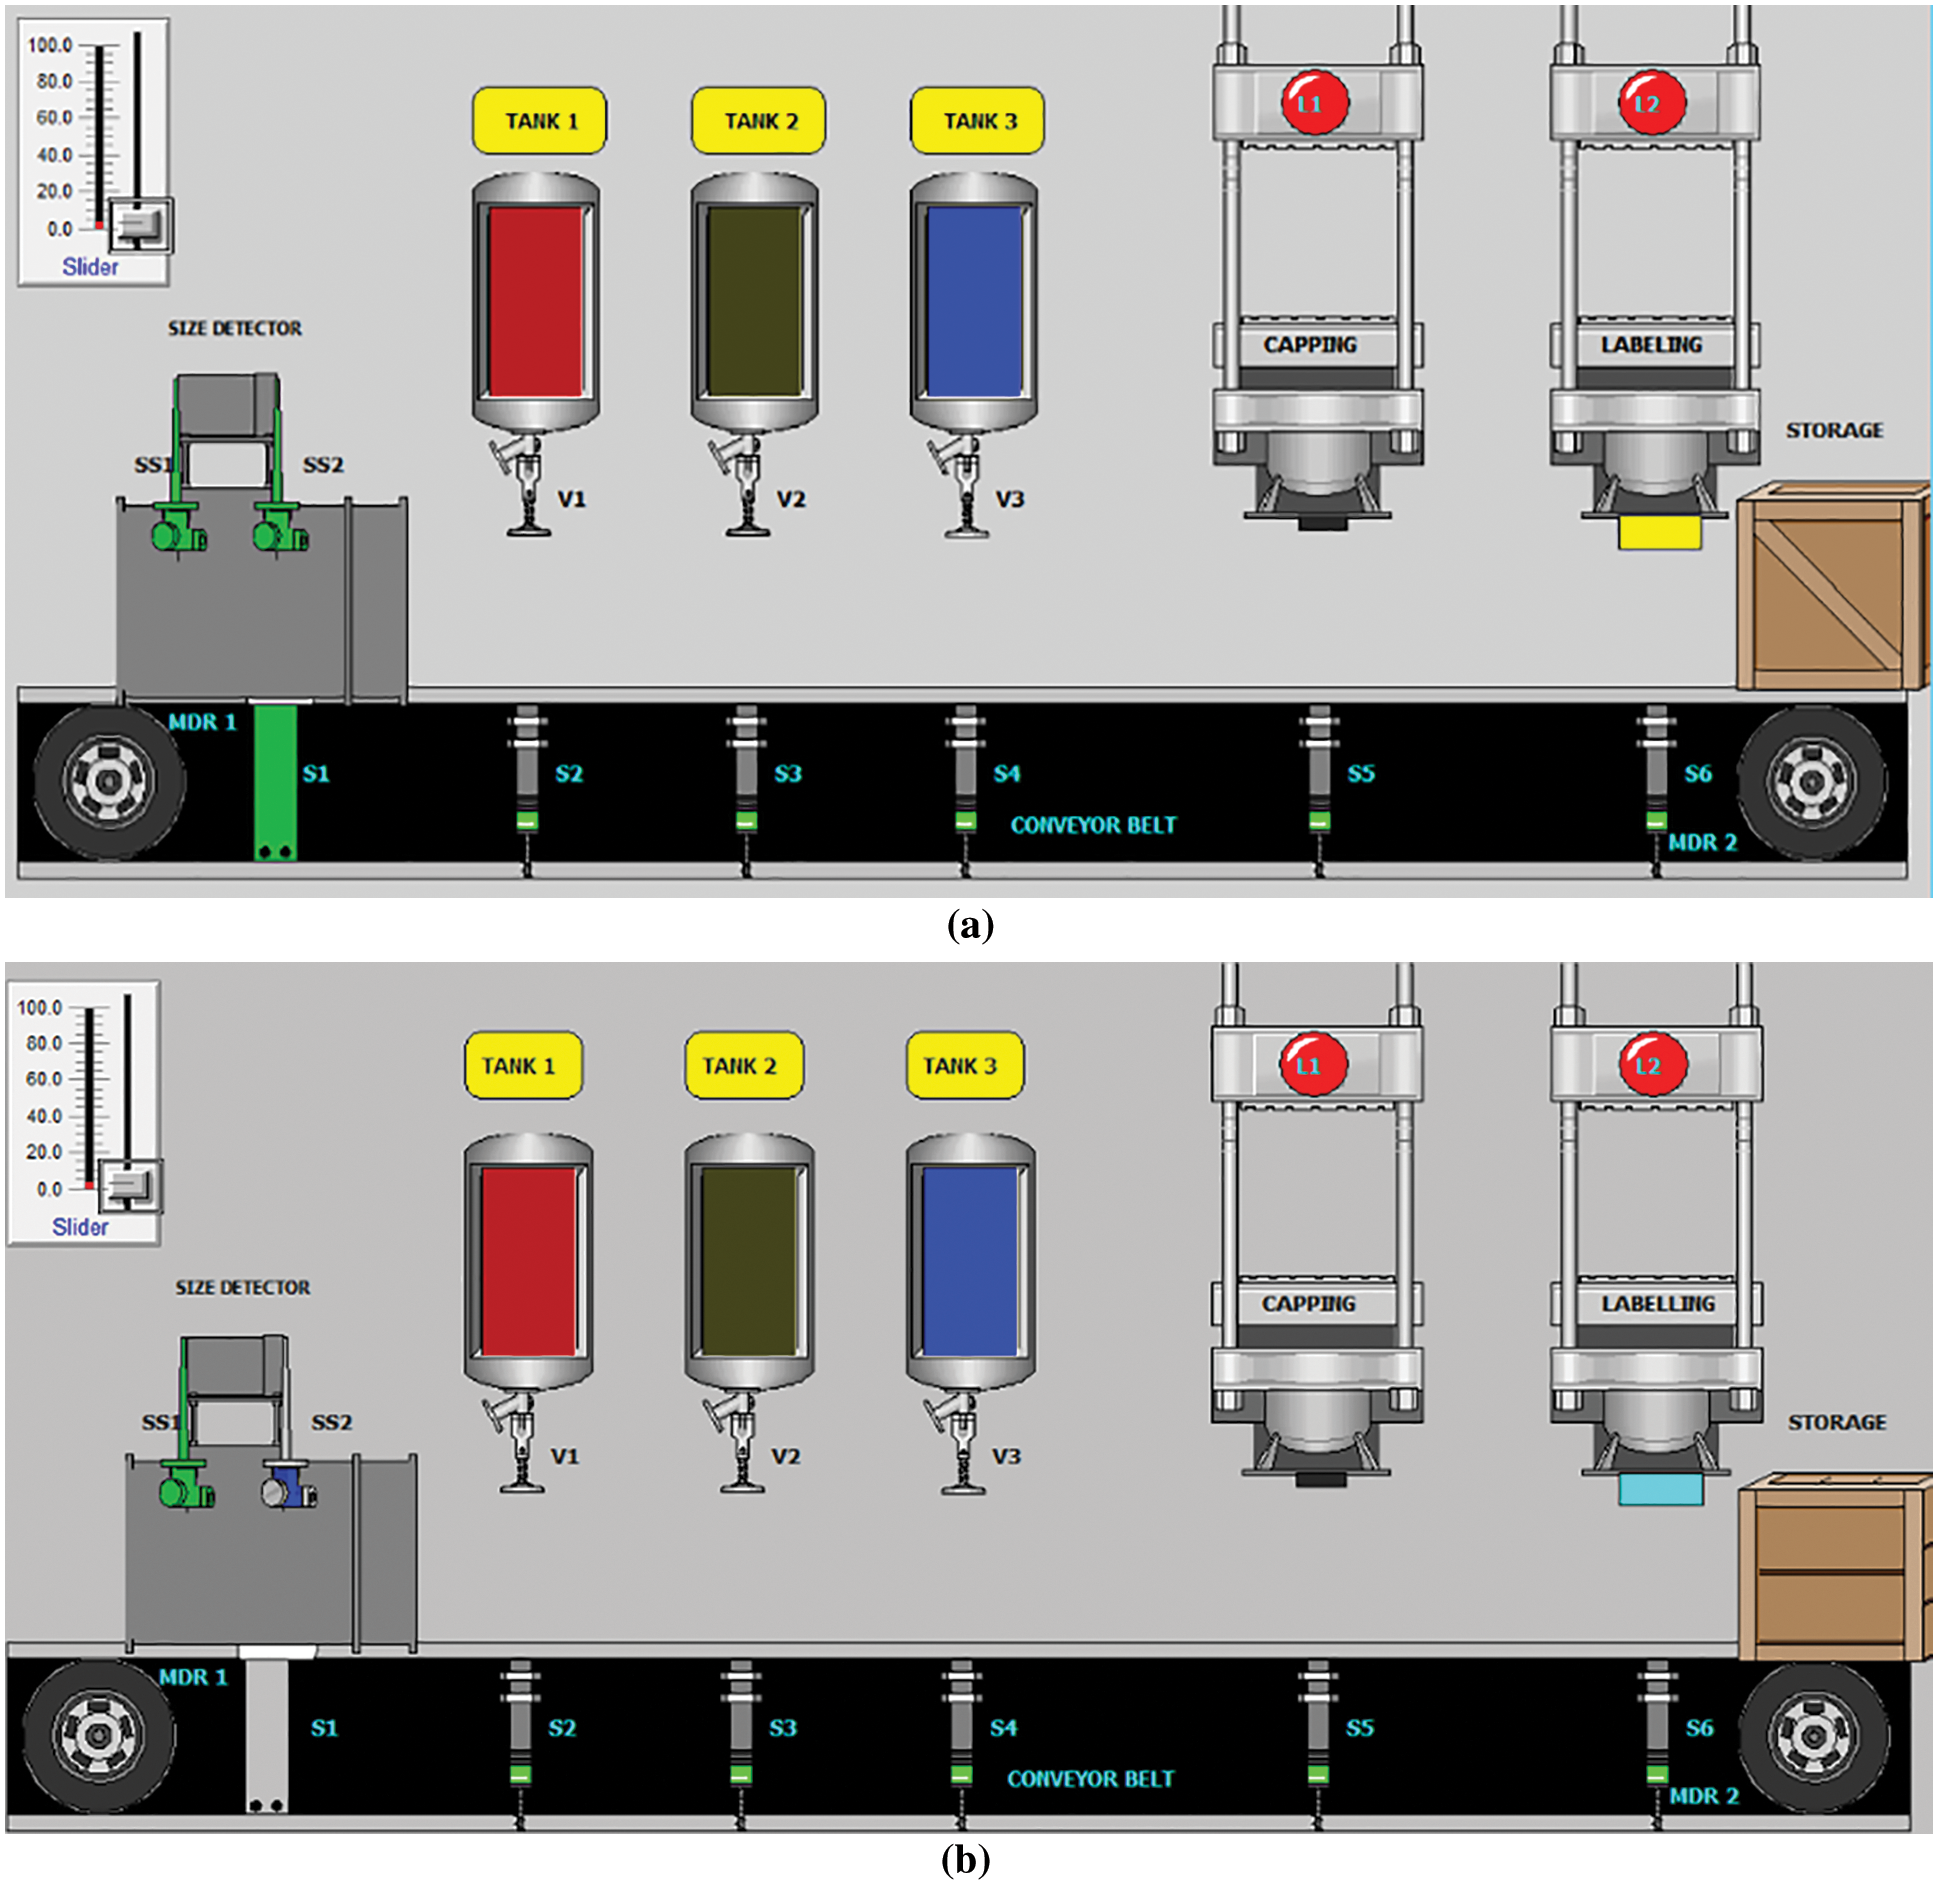
Figure 13: Spotting a container (a) Metallic and big sized container (b) Non-metallic and small sized container
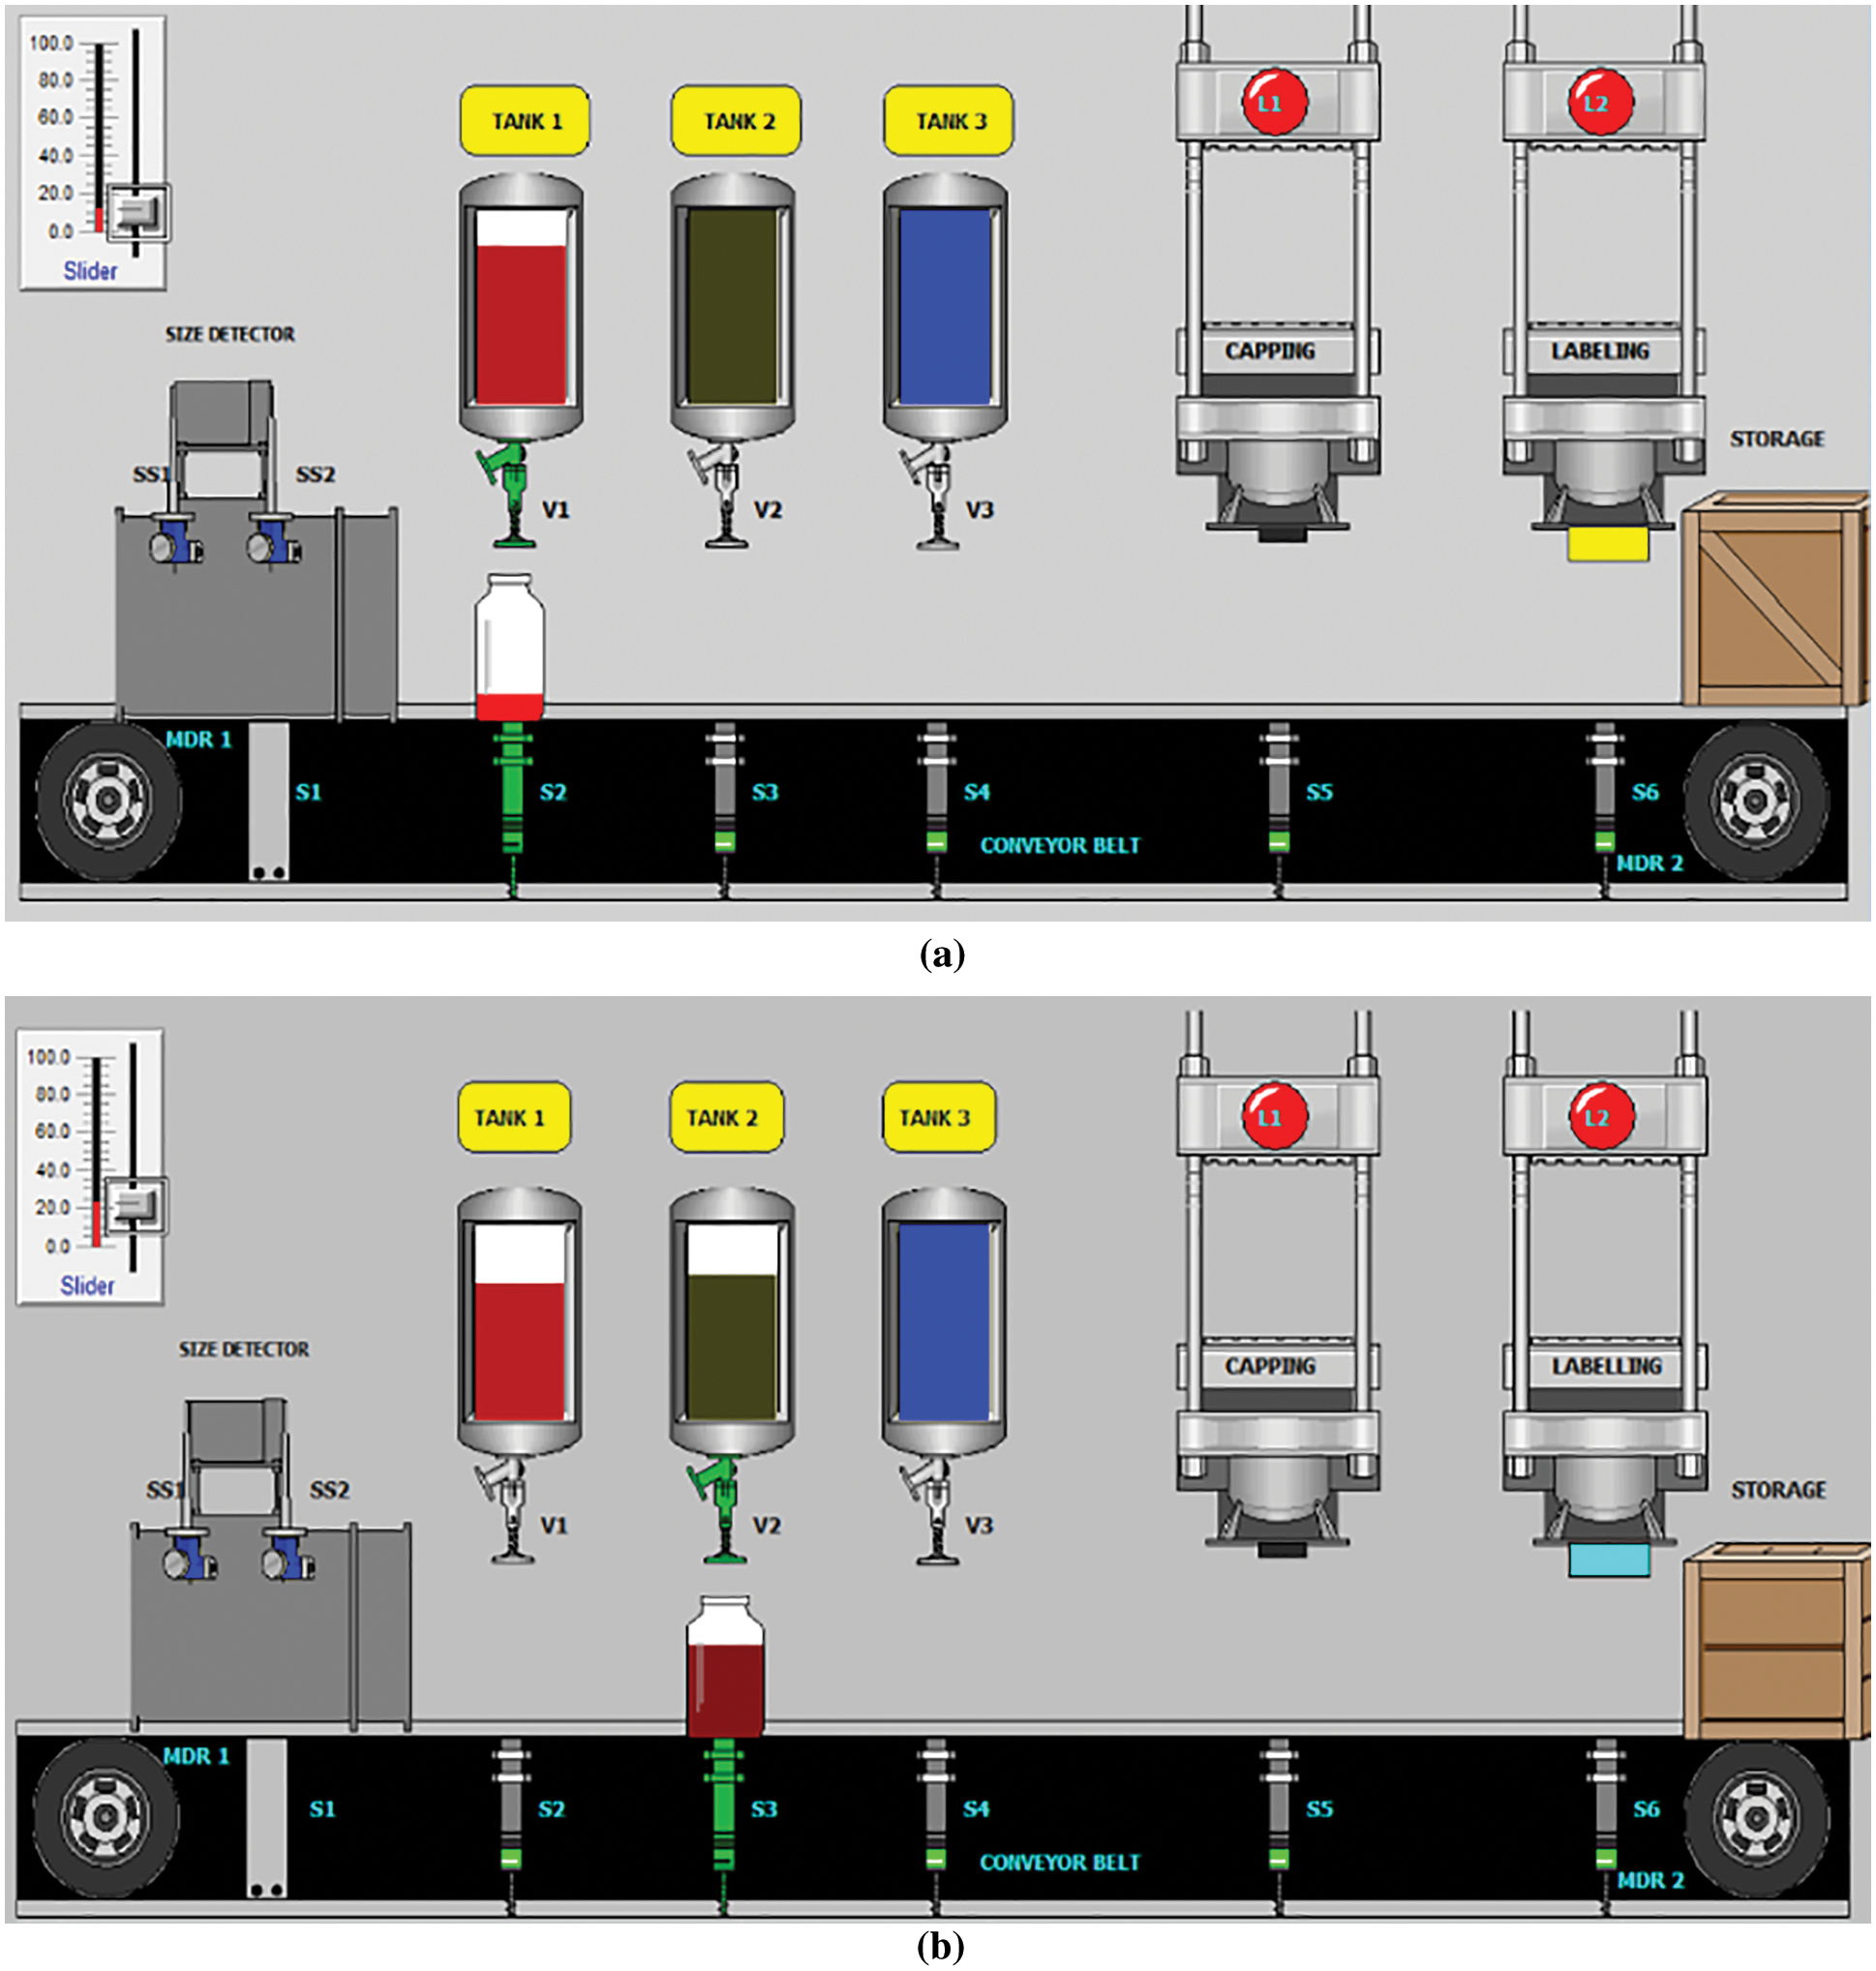
Figure 14: (a) Filling by tank1 in assembly line (b) Filling by tank2 in assembly line
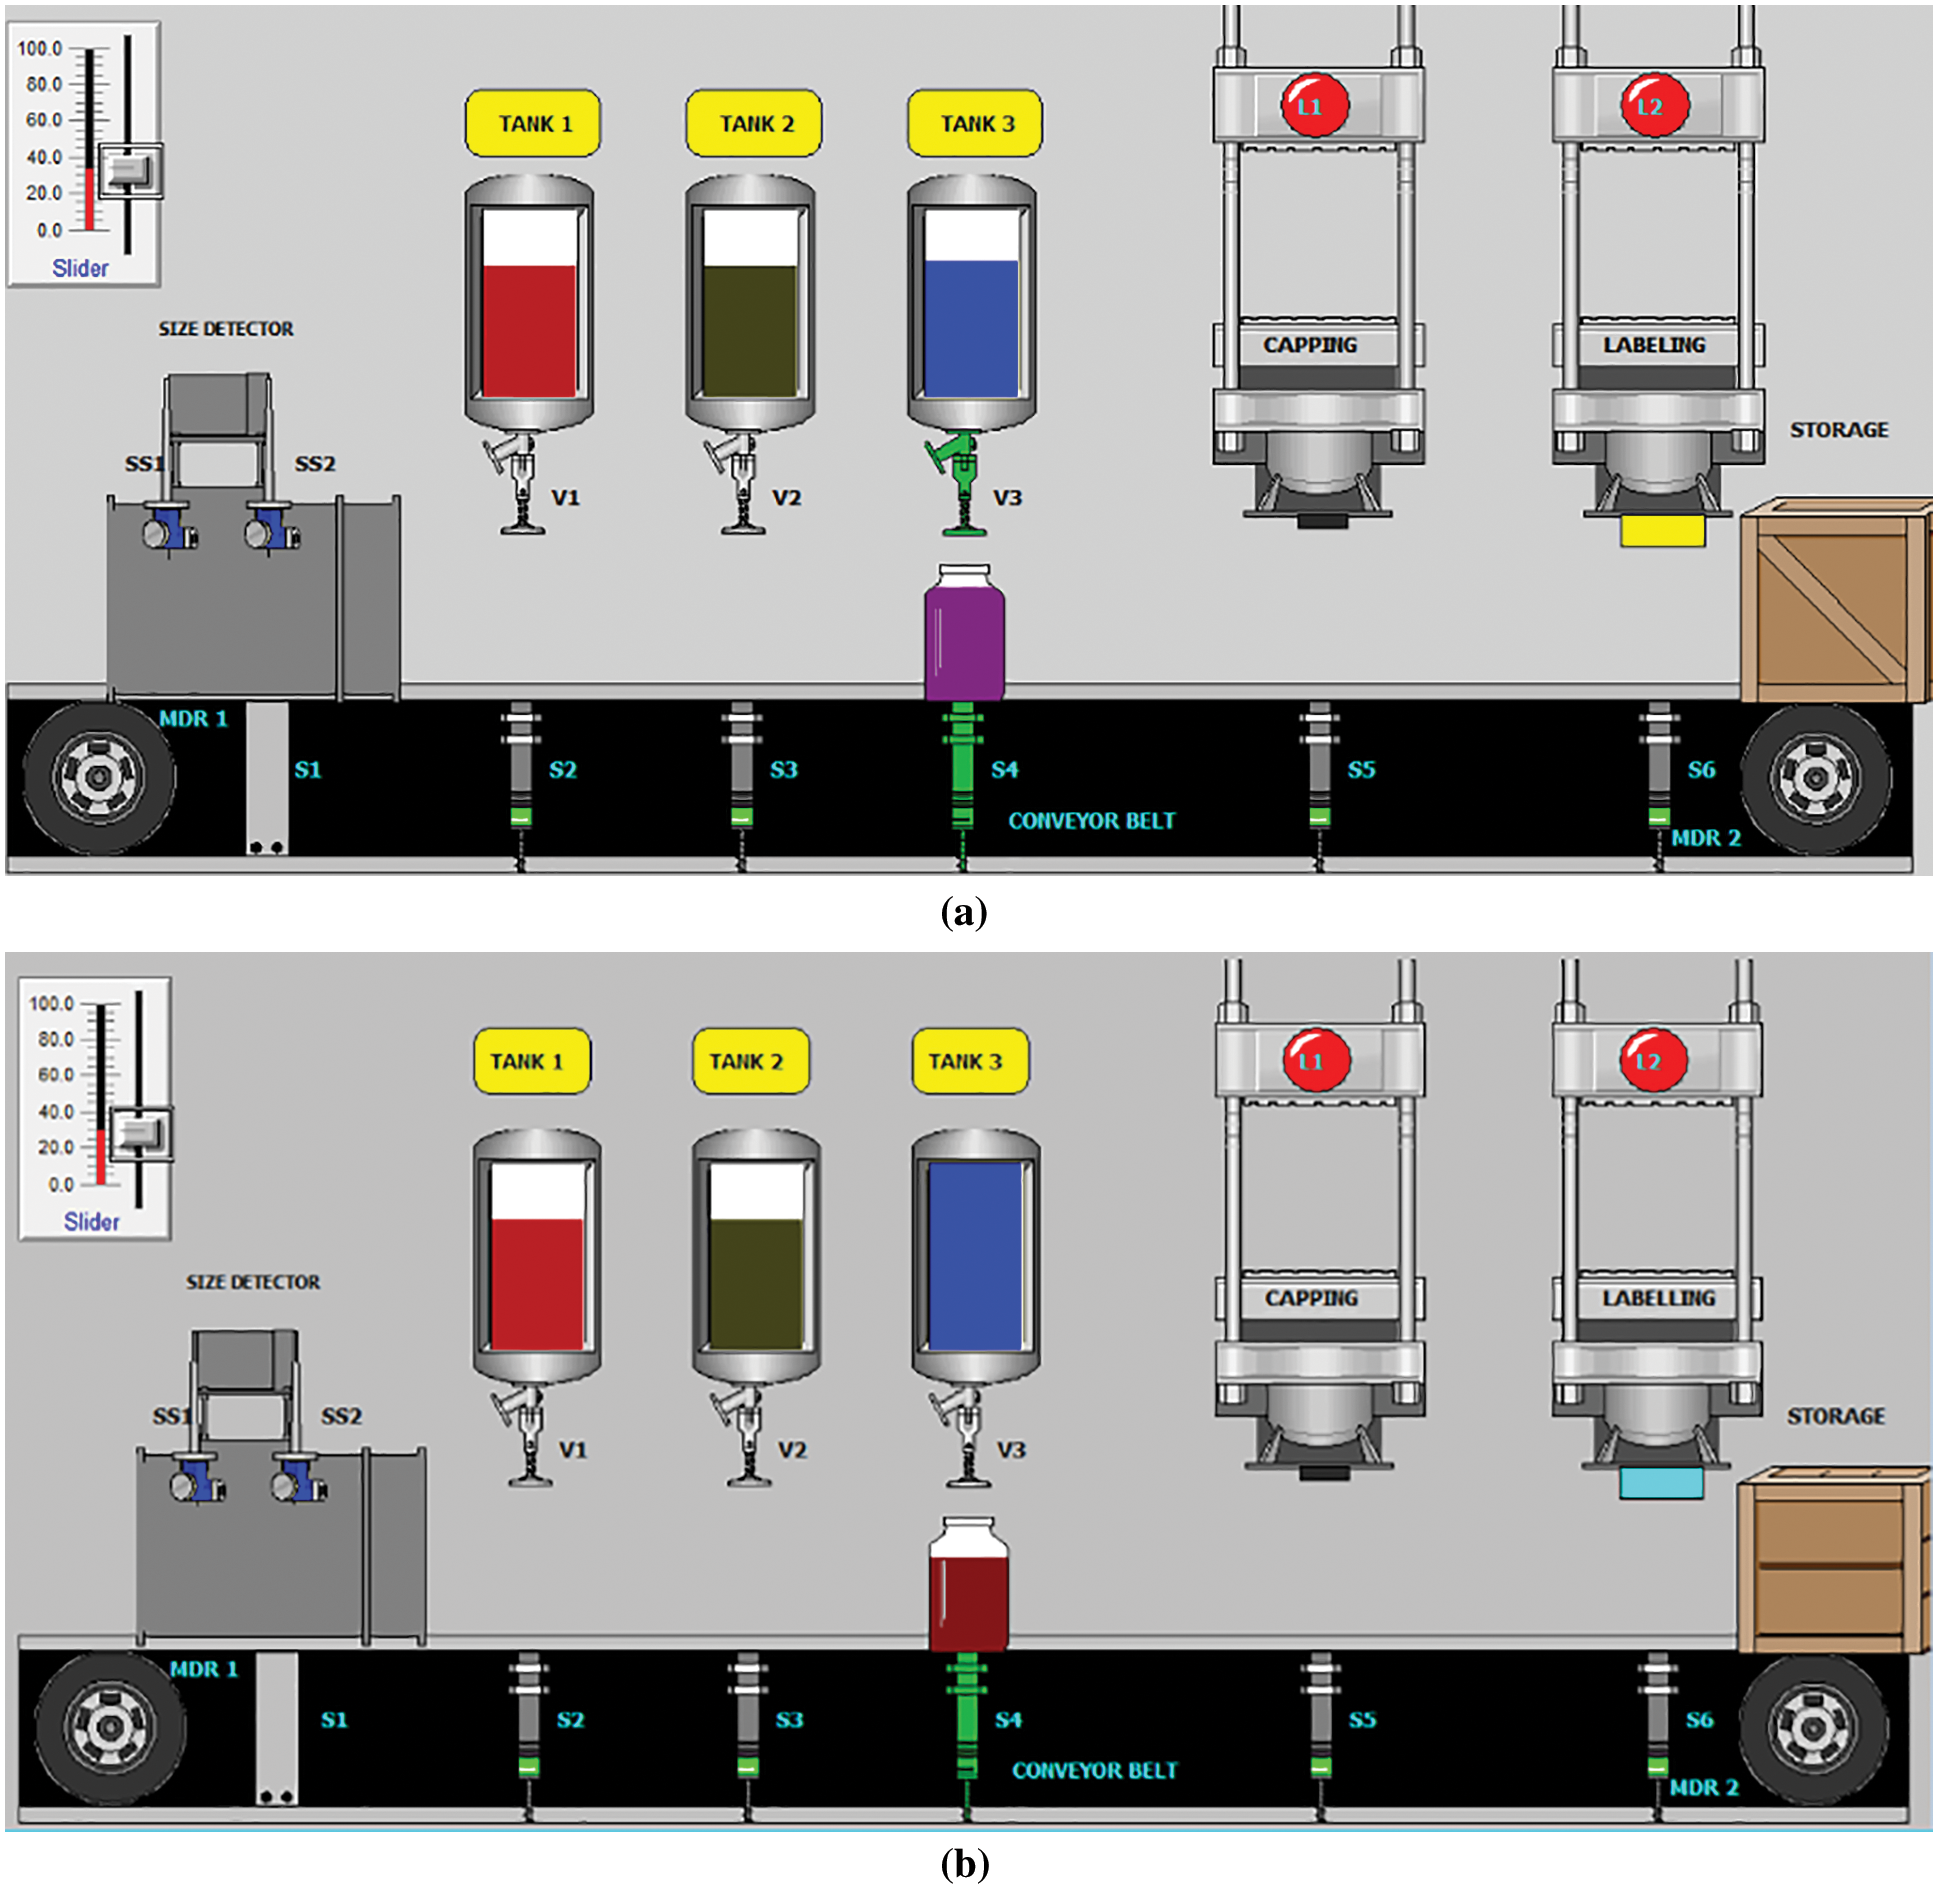
Figure 15: Filling by tank3 in assembly line (a) Metallic and big sized container (b) Non-metallic and small sized container
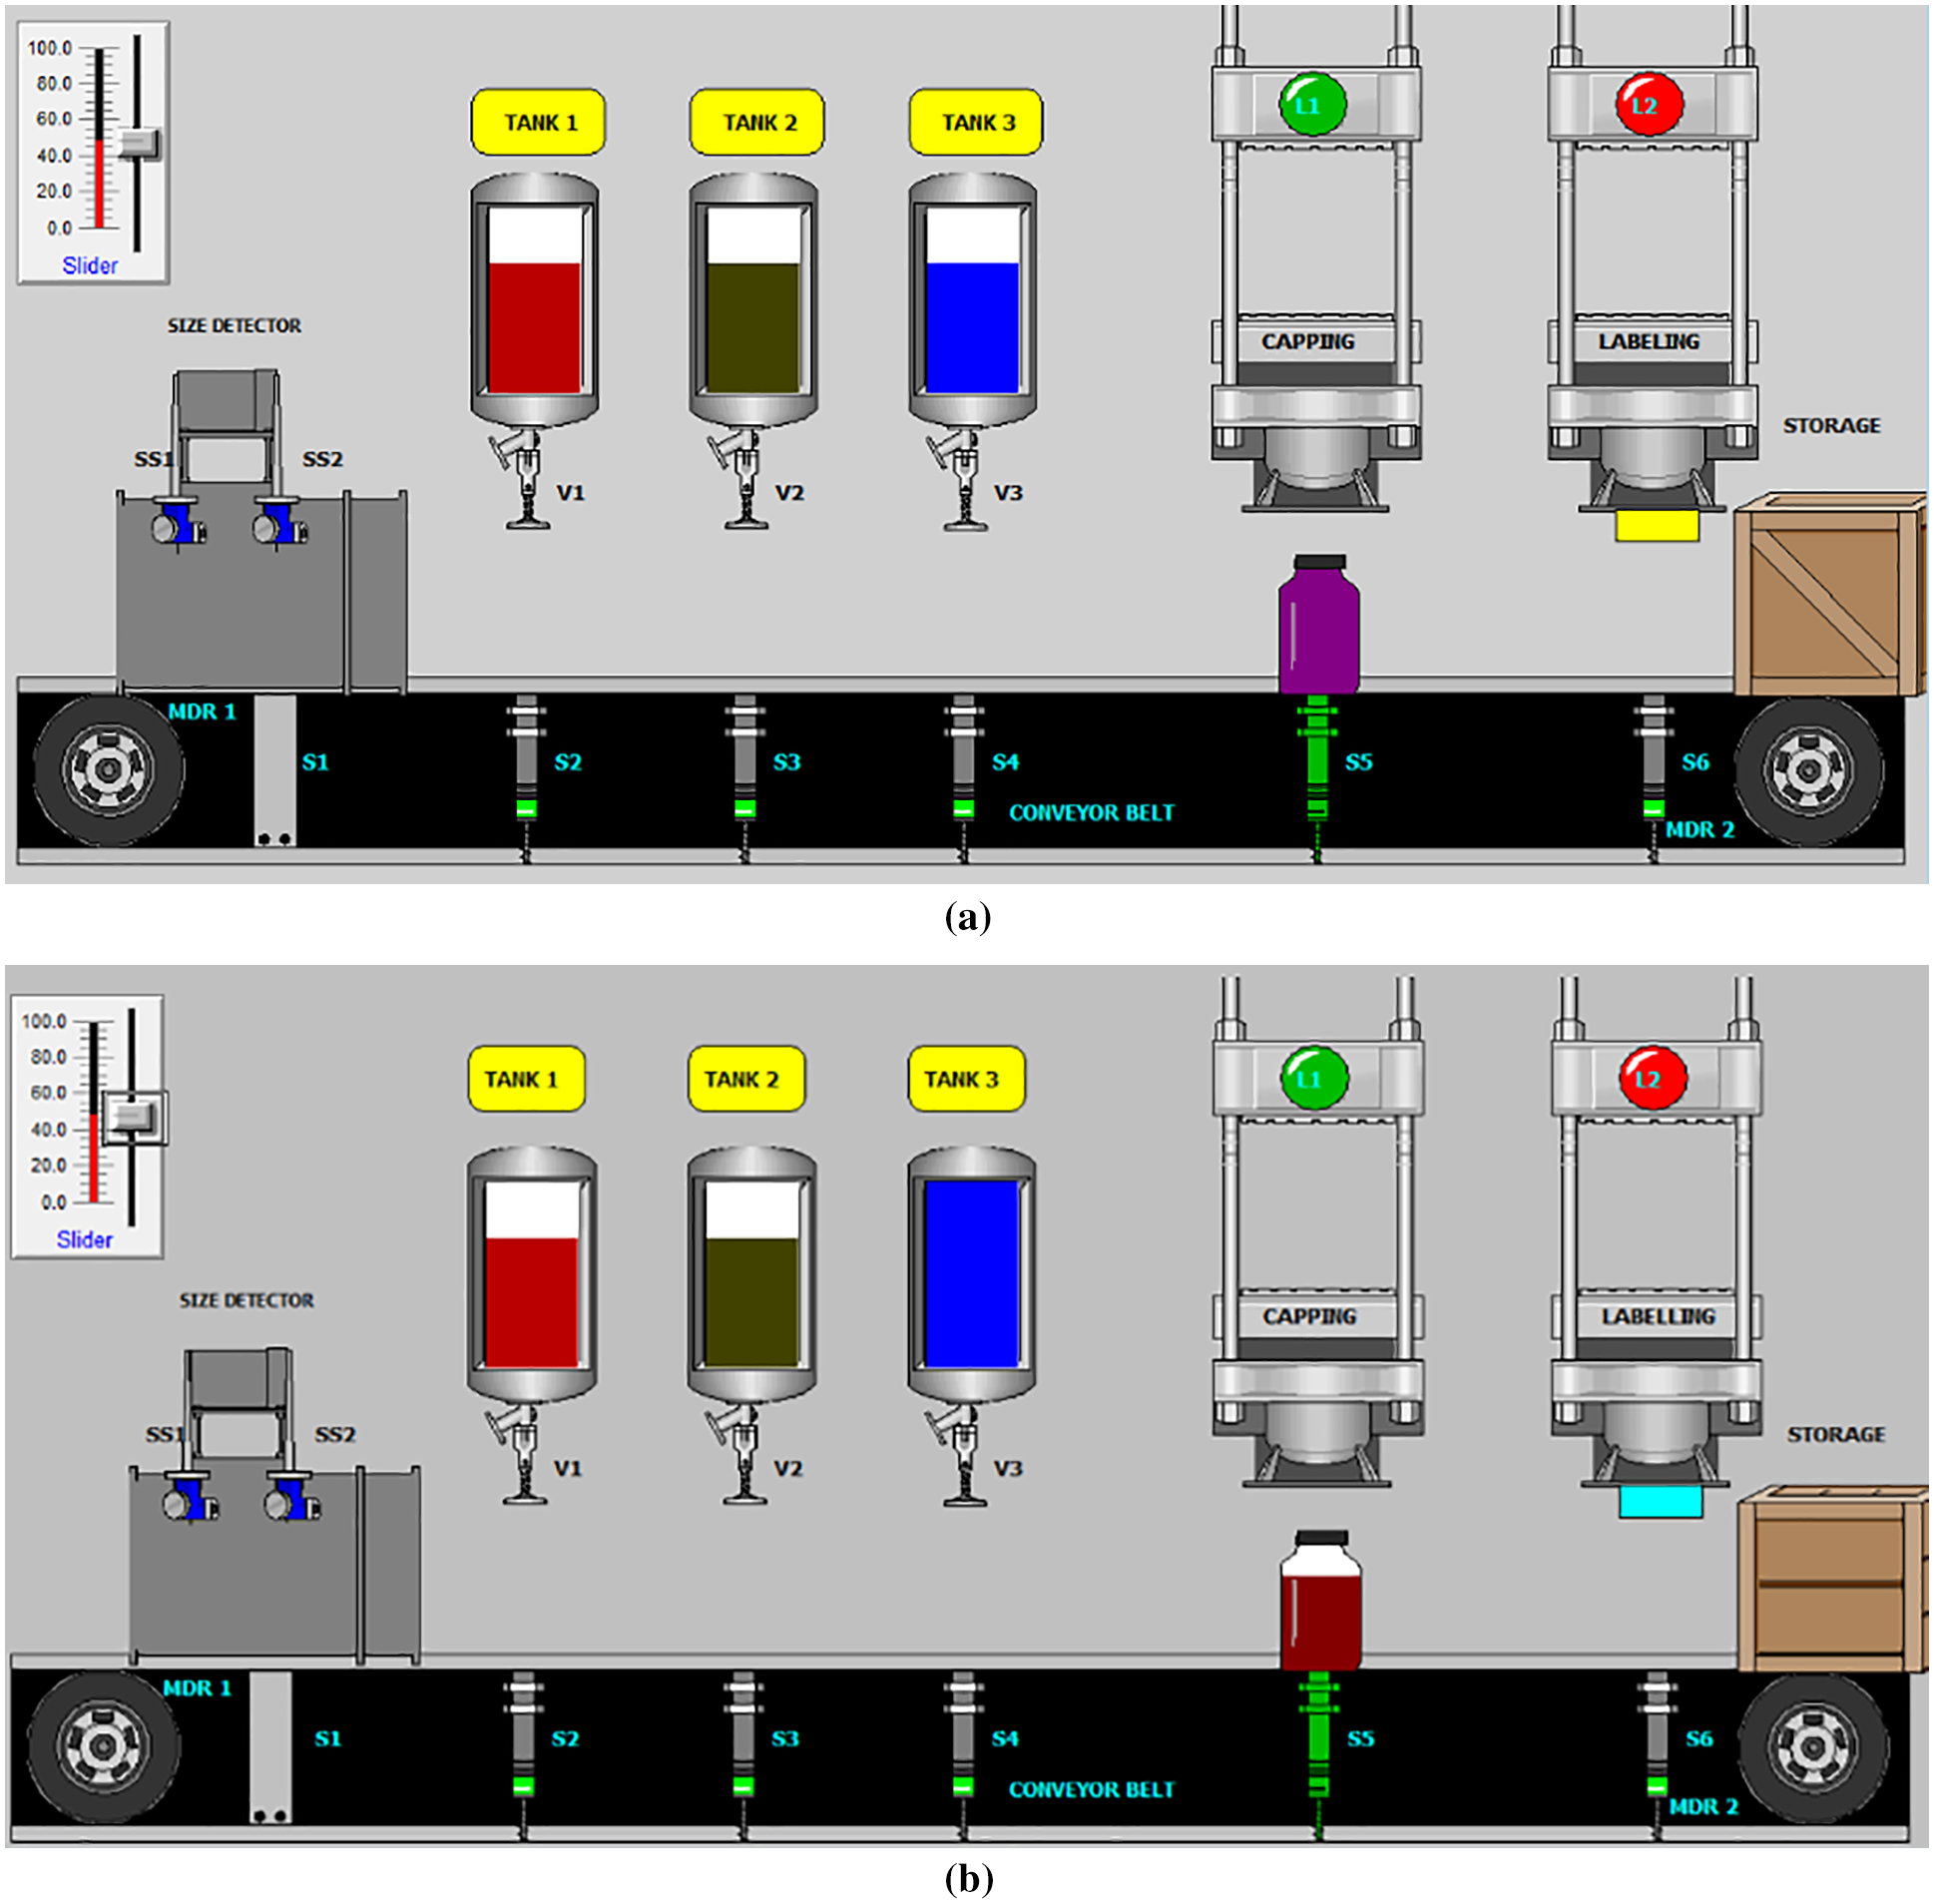
Figure 16: Capping auxiliary stage (a) Metallic and big sized container (b) Non-metallic and small sized container
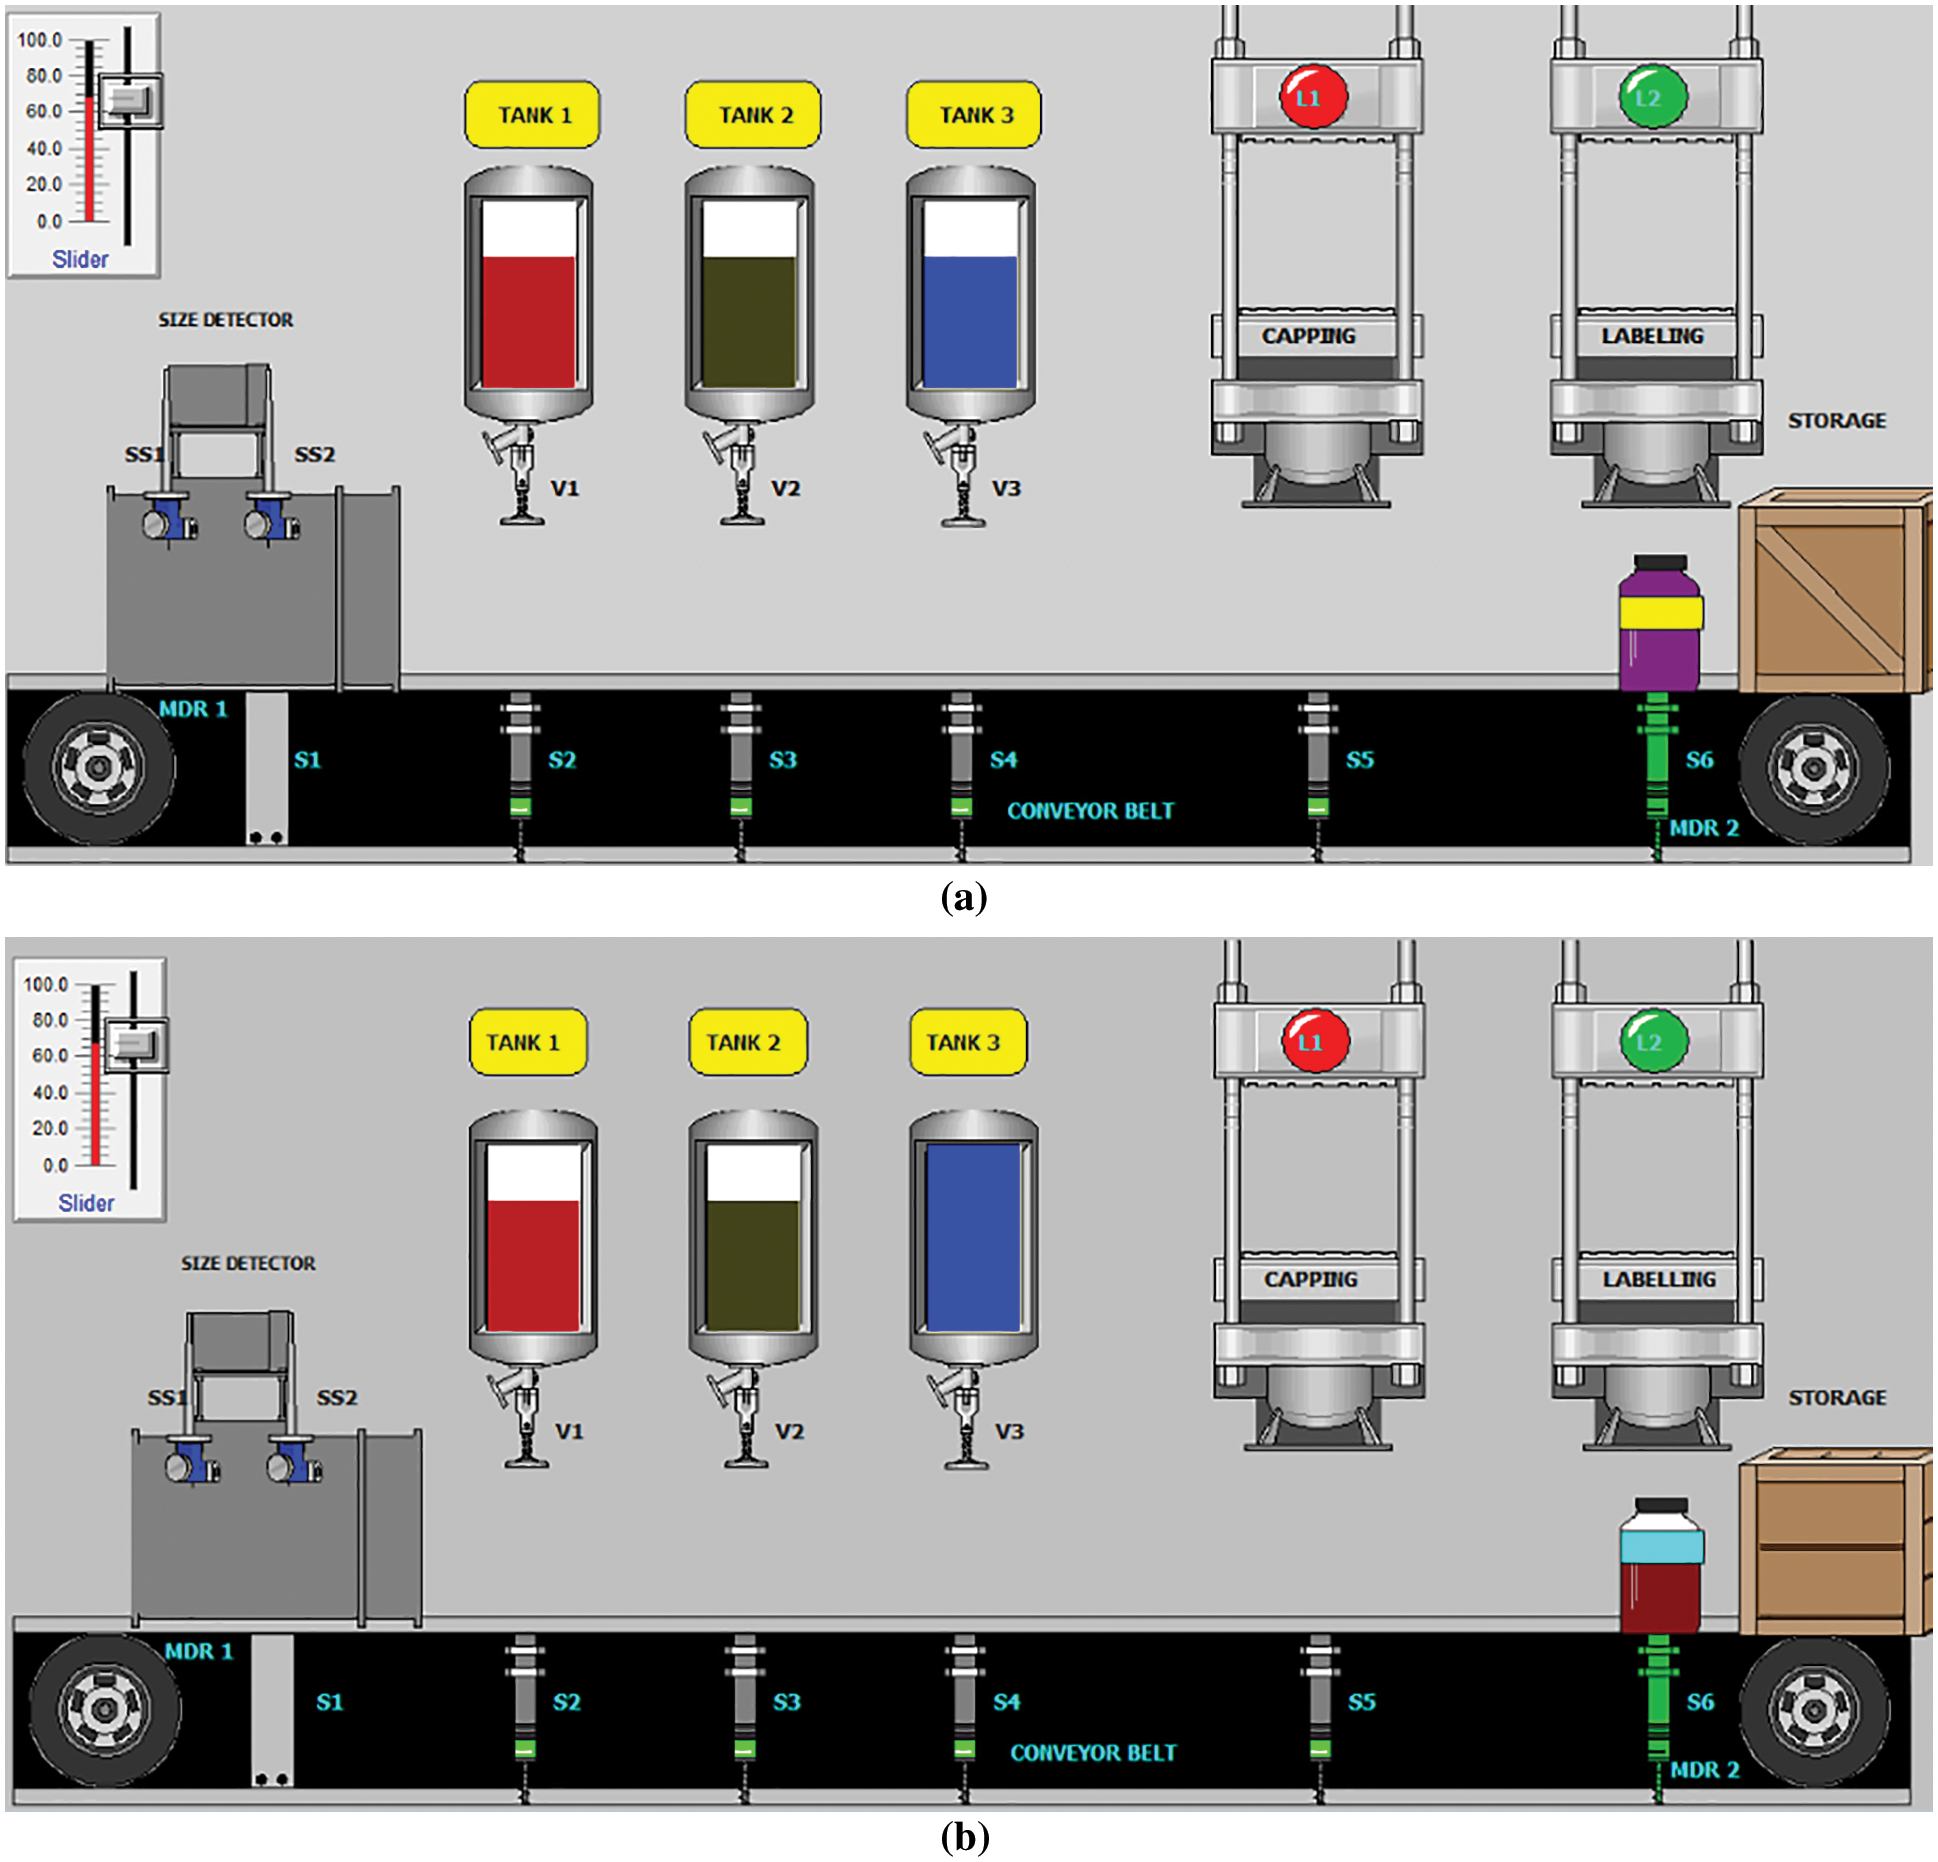
Figure 17: Labelling auxiliary stage (a) Metallic and big sized container (b) Non-metallic and Small Sized Container
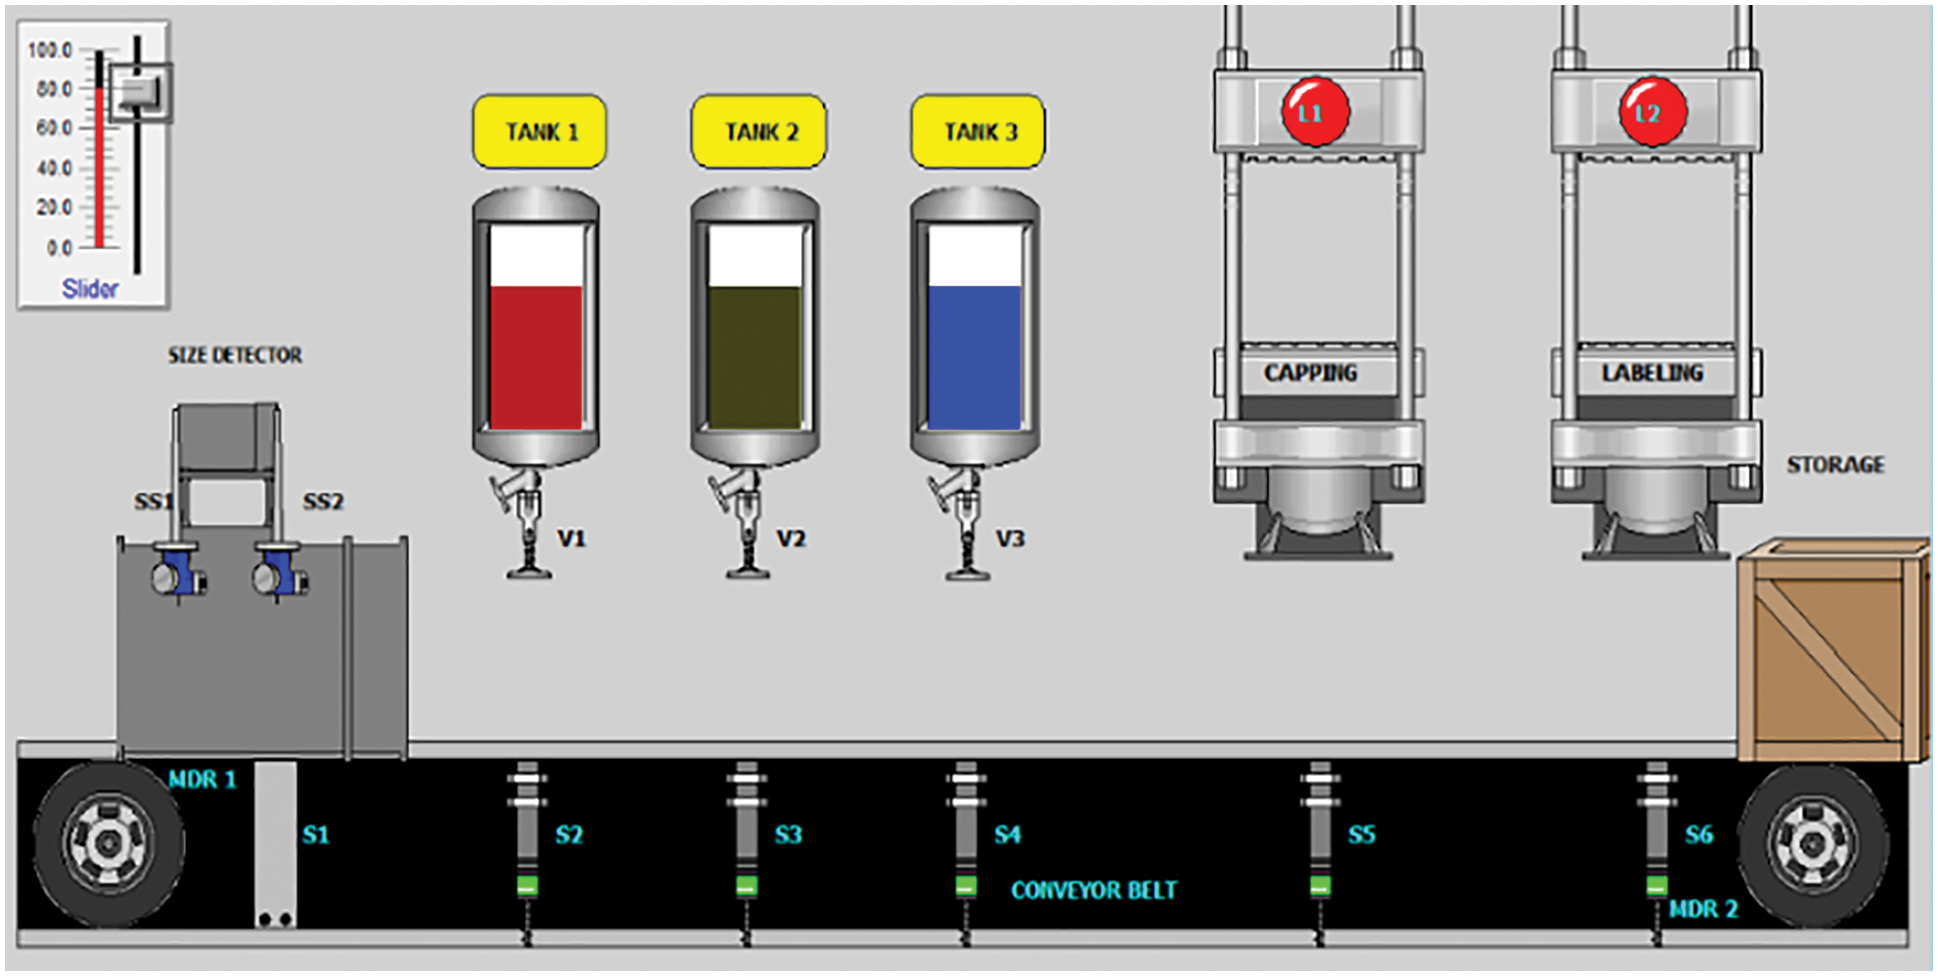
Figure 18: Storage auxiliary stage
The simulated prototype of two divisions namely the ratio control division and assembly line division inside the chemical plant is successfully achieved in the Wonderware Intouch SCADA software, which is regulated or controlled with the help of Omron PLC programming. The ratio control division provides flexibility in choosing the ratios of both streams as well the level to be set inside the mixer with the help of HMI (Omron NB5Q-TW01B, 5.6 inches) and the flexibility of changing the ratios is only possible through programming software and choosing the ratios is possible at configuration level and plant site too. Overflowing conditions inside the mixer is also tackled with safety sensor, mounted at the side-top of the mixer. The assembly line division sorted the containers on the basis of size and material type of the containers with the help of inductive and capacitive proximity sensors. The single assembly line is used to fill both type of containers with different types of mixtures, capped and then in the later stage, labelled and stored distinguishably after counting. This assembly line division allows labor the freedom of putting any type of container over the conveyor system without pre-deciding, which saves operation time, reduce manpower and industry cost to a great extent. This work helps us to understand the necessity of study and implementation of automated systems inside the industries. The future scope of this work would be to carry it out on the real time setup to analyze the throughput along with economic and energy factor.
Acknowledgement: This work has been carried out under the supervision of Prof. Narendra Kumar and Prof. Mini Sreejeth, Department of Electrical Engineering, Delhi Technological University, and I (Basant Tomar) pay immense gratitude towards my guides for enlightening me through the process. Also, I (Basant Tomar) would like to acknowledge the financial assistantship provided by Delhi Technological University.
Funding Statement: The authors received no specific funding for this study.
Conflicts of Interest: The authors declare that they have no conflicts of interest to report regarding the present study.
References
1. A. P. Somavanshi, S. B. Austkar and S. A. More, “Automatic bottle filling using microcontroller volume correction,” International Journal of Engineering Research Technology (IJERT), vol. 2, no. 3, pp. 1–4, 2013. [Google Scholar]
2. A. U. A. Saeed, M. A. Mamun and A. H. M. Zadidul Karim, “Industrial application of PLCs in Bangladesh,” International Journal of Science and Engineering Research (IJSER), vol. 3, no. 6, pp. 1–4, 2012. [Google Scholar]
3. K. S. Kiangala and Z. Wang, “An industry 4.0 approach to develop auto parameter configuration of a bottling process in a small to medium scale industry using PLC and SCADA,” Procedia Manufacturing, vol. 35, pp. 725–730, 2019. [Google Scholar]
4. N. Valadão, G. Künzel, I. Müller and C. E. Pereira, “Industrial wireless automation: Overview and evolution of WIA-PA,” IFAC-PapersOnLine, vol. 51, no. 10, pp. 175–180, 2018. [Google Scholar]
5. K. S. Shinde and P. H. Bhagat, “Industrial process monitoring using IoT,” in Proc. Int. Conf. on IoT in Social, Mobile, Analytics and Cloud (I-SMAC), Palladam, India, pp. 38–42, 2017. [Google Scholar]
6. N. Nadgauda and S. A. Muthukumaraswamy, “Design and development of industrial automated system using PLC-SCADA,” in Proc. IEEE 10th GCC Conf. & Exhibition (GCC), Kuwait, pp. 1–6, 2019. [Google Scholar]
7. A. Christler, E. Felföldi, M. Mosor, D. G. Sauer, N. Walch et al., “Semi-automation of process analytics reduces operator effect,” Bioprocess and Biosystems Engineering, vol. 43, no. 5, pp. 753–764, 2020. [Google Scholar]
8. T. Pardi, “Fourth industrial revolution concepts in the automotive sector: Performativity, work and employment,” Journal of Industrial and Business Economics, vol. 46, pp. 379–389, 2019. [Google Scholar]
9. B. Rahmani, “Internet-based control of industrial automation systems,” Journal of Intelligent & Robot Systems, vol. 83, no. 1, pp. 71–83, 2016. [Google Scholar]
10. S. Kannan, “Smart process measurement and automation: Challenges, solution and future direction,” CSI Transactions on ICT, vol. 7, no. 5, pp. 93–98, 2019. [Google Scholar]
11. S. Gil, G. D. Zapata-Madrigal, R. G. Sierra and L. A. C. Salazar, “Converging IoT protocols for the data integration of automation systems in the electrical industry,” Journal of Electrical Systems and Information Technology, vol. 9, no. 1, pp. 1–21, 2022. [Google Scholar]
12. D. P. Zegzhda, M. O. Kalinin and M. V. Levykin, “Actual vulnerabilities of industrial automation protocols of an open platform communications series,” Automation Control and Computer Science, vol. 53, no. 8, pp. 972–979, 2019. [Google Scholar]
13. N. I. Aristova, “Ethernet in industrial automation: Overcoming obstacles,” Automation and Remote Control, vol. 77, no. 5, pp. 881–894, 2016. [Google Scholar]
14. M. Sreejeth and S. Chouhan, “PLC based automated liquid mixing and bottle filling system,” in Proc. 1st IEEE Int. Conf. on Power Electronics, Intelligent Control and Energy Systems (ICPEICES-2016), Delhi, India, pp. 1–5, 2016. [Google Scholar]
15. H. H. Aung and T. T. E. Aung, “Simulation and implementation of PLC based for nonstop filling process using PLCSIM and HMI,” International Journal of Creative and Innovative Research in All Studies, vol. 2, no. 3, pp. 134–137, 2019. [Google Scholar]
16. Z. K. Win and T. T. Nwe, “PLC based automatic bottle filling and capping system,” International Journal of Trend in Scientific Research and Development (IJTSRD), vol. 3, no. 6, pp. 389–392, 2019. [Google Scholar]
17. E. R. Alphonsus and M. O. Abdullah, “A review on the applications of programmable logic controllers (PLCs),” Renewable and Sustainable Energy Reviews, vol. 60, no. 3, pp. 1185–1205, 2016. [Google Scholar]
18. N. Nadgauda, S. A. Muthukumaraswamy and S. U. Prabha, “Smart automated processes for bottle-filling industry using PLC-SCADA system,” Intelligent Manufacturing and Energy Sustainability, vol. 169, pp. 693–702, 2020. [Google Scholar]
19. S. V. Viraktamath, A. S. Umarfarooq, V. Yallappagoudar and A. P. Hasankar, “Implementation of automated bottle filling system using PLC,” Inventive Communication and Computational Technologies, vol. 89, pp. 33–41, 2020. [Google Scholar]
20. K. Chakraborty, M. G. Choudhury, S. Dasc and S. Paul, “Development of PLC-SCADA based control strategy for water storage in a tank for a semi-automated plant,” IOP Publishing for Sissa Medialab, Journal of Instrumentation, vol. 15, no. 4, pp. 1–7, 2020. [Google Scholar]
21. B. Tomar and N. Kumar, “PLC and SCADA based industrial automated system,” in Proc. 2020 IEEE Int. Conf. for Innovation in Technology (INOCON), pp. 1–5, Bangluru, India, 2020. [Google Scholar]
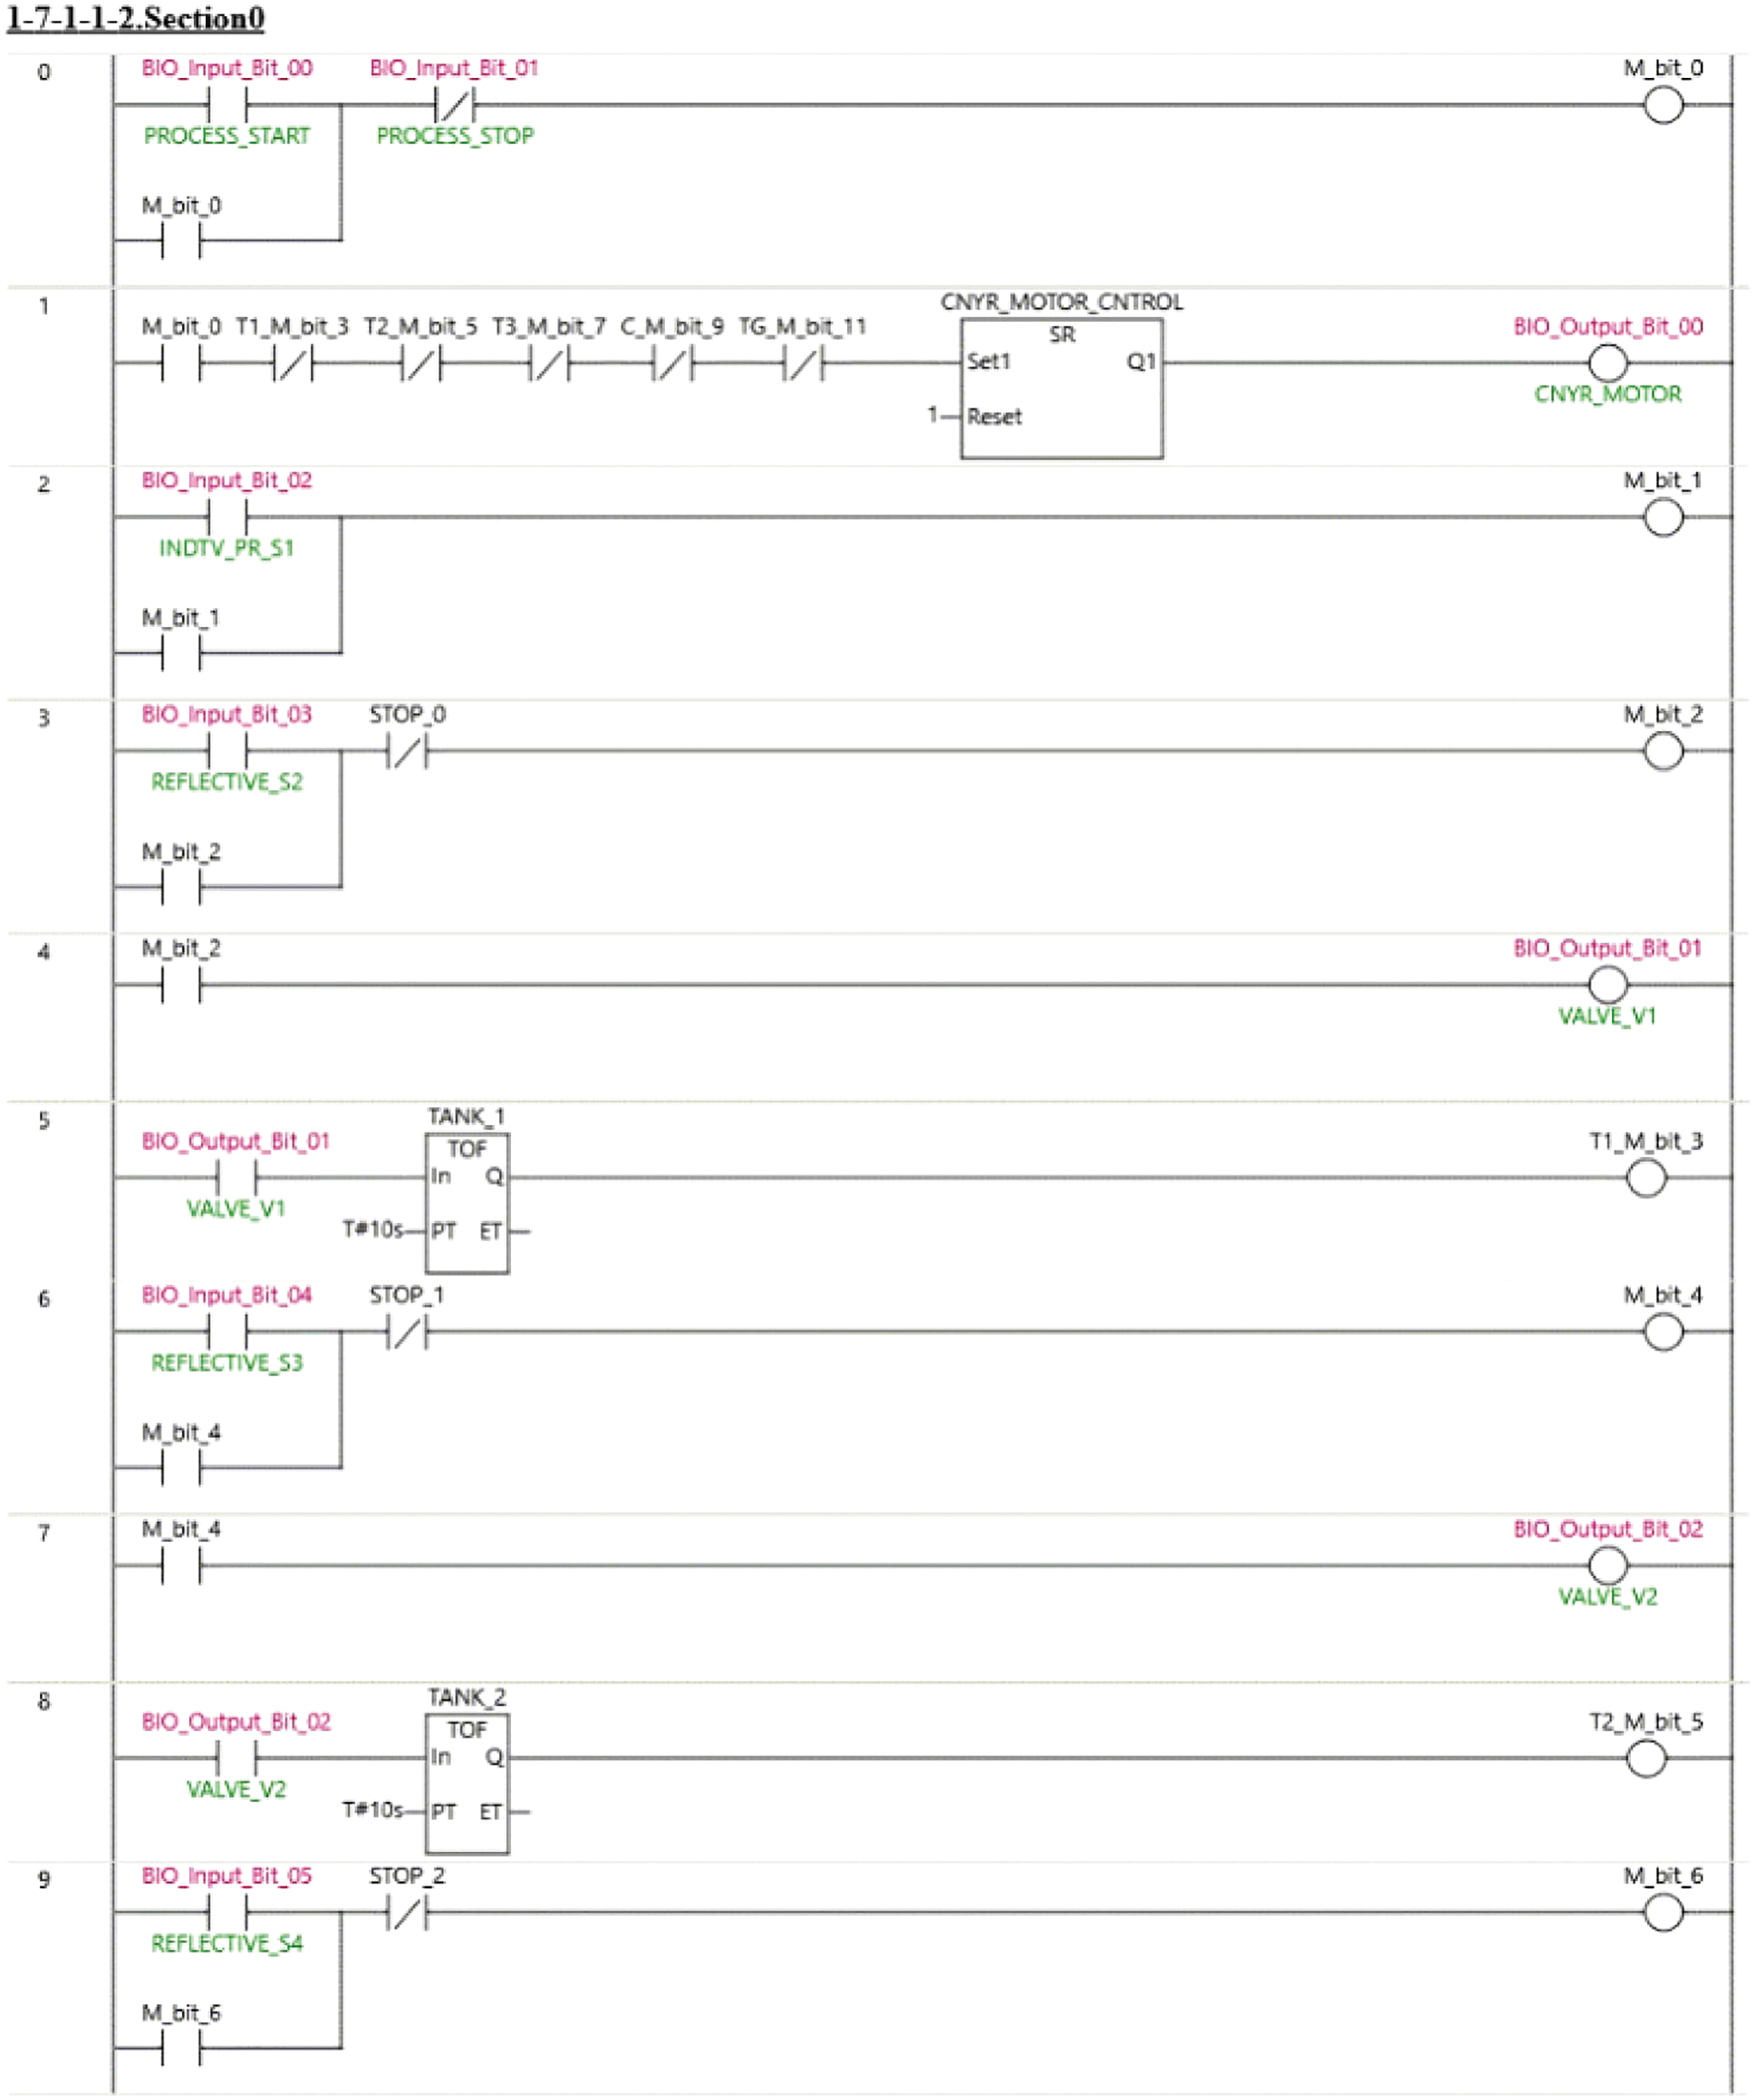
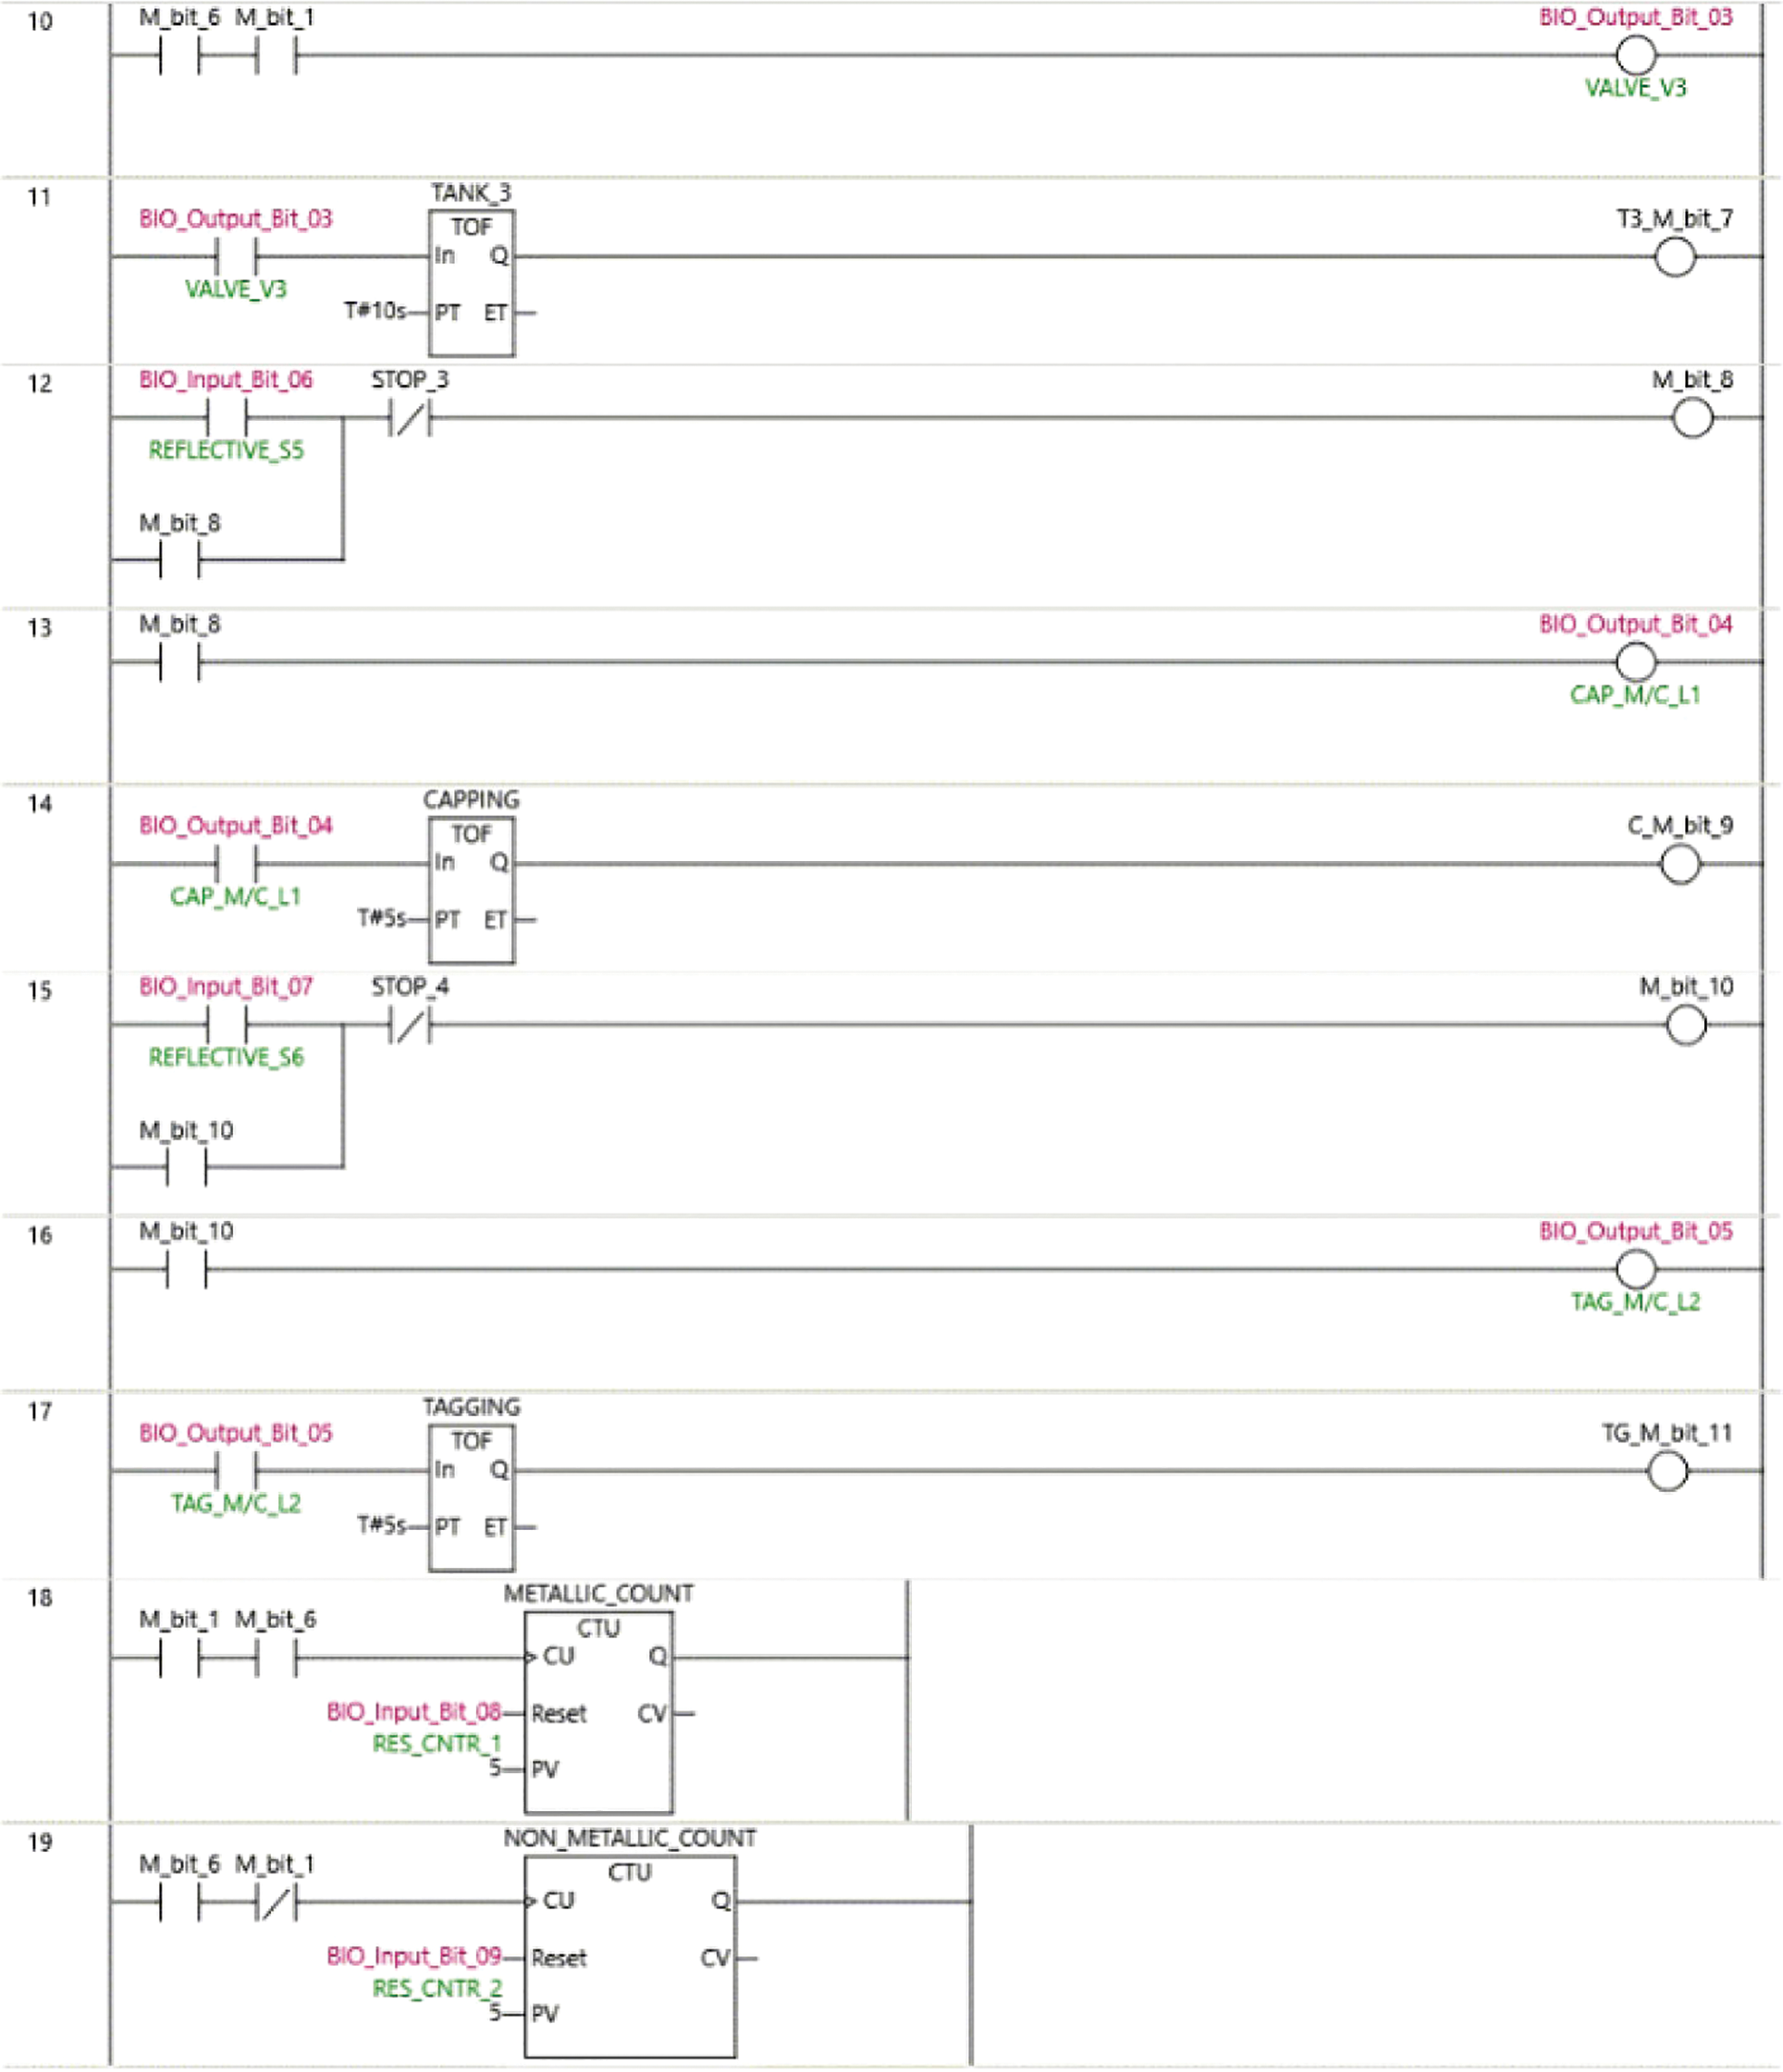
Appendix:
Some of the part of the PLC Code are given below.
Cite This Article
 Copyright © 2023 The Author(s). Published by Tech Science Press.
This work is licensed under a Creative Commons Attribution 4.0 International License , which permits unrestricted use, distribution, and reproduction in any medium, provided the original work is properly cited.
 Downloads
 Citation Tools