
 Submit a Paper
 Propose a Special lssue
 Open Access
ARTICLE

A Machine Learning Based Funding Project Evaluation Decision Prediction
1 Economic Research Institute, Beijing Language and Culture University, Beijing, 100083, China
2 School of Computer Science and Technology, Hainan University, Haikou, 570228, China
3 School of Computer Science, Shenzhen Institute of Information Technology, Shenzhen, 518172, China
4 Faculty of Arts, University of British Columbia, Vancouver, CV6T 1Z1, Canada
* Corresponding Author: Jiangyuan Yao. Email:
Computer Systems Science and Engineering 2023, 45(2), 2111-2124. https://doi.org/10.32604/csse.2023.030516
Received 28 March 2022; Accepted 21 June 2022; Issue published 03 November 2022
 View Full Text
 Download PDF
Abstract
Traditional linear statistical methods cannot provide effective prediction results due to the complexity of human mind. In this paper, we apply machine learning to the field of funding allocation decision making, and try to explore whether personal characteristics of evaluators help predict the outcome of the evaluation decision? and how to improve the accuracy rate of machine learning methods on the imbalanced dataset of grant funding? Since funding data is characterized by imbalanced data distribution, we propose a slacked weighted entropy decision tree (SWE-DT). We assign weight to each class with the help of slacked factor. The experimental results show that the SWE decision tree performs well with sensitivity of 0.87, specificity of 0.85 and average accuracy of 0.75. It also provides a satisfied classification accuracy with Area Under Curve (AUC) = 0.87. This implies that the proposed method accurately classified minority class instances and suitable to imbalanced datasets. By adding evaluator factors into the model, sensitivity is improved by over 9%, specificity improved by nearly 8% and the average accuracy also increased by 7%. It proves the feasibility of using evaluators’ characteristics as predictors. And by innovatively using machine learning method to predict evaluation decisions based on the personal characteristics of evaluators, it enriches the literature in the field of decision making and machine learning field.Keywords
Evaluators are the core of project evaluation. The expertise of evaluators will not only affect the project selection, but also affect the fairness of project evaluation. Nowadays, studies of evaluator characteristics and evaluation decision mainly focus on exploring causal relationship between variables, neglecting to which extent that evaluators’ characteristics can predict evaluation results.
Human mind is a complex system, traditional linear statistical methods cannot provide effective prediction results and may be difficult to clearly and accurately clarify the complex relationship in between [1]. Machine learning is a way to solve this problem. Essentially, machine learning is a model to find the unknown functions, dependencies or structures between inputs and outputs which are impossible to be represented by explicit algorithms through an automatic learning process [2], therefore it can get rid of the restrictive assumptions that traditional statistical methods depend (normality, linearity, and independence between predictor variables) and discover more complex patterns in data. It is helpful in proposing and validating new theories, thereby promoting the advancement of explanatory models and theories.
Among the many machine learning algorithms, the data analysis efficiency of decision tree is better due to it is a non-parametric approach without distributional assumptions, and the output result is easy to understand [3]. Therefore, decision tree is more favored by the industry and widely used. Although very popular in practice, decision trees share some disadvantages that are revealed under imbalanced data. When a dataset is highly dimensional and highly class imbalanced, existing feature selection algorithms usually ignore the small classes which can be important [4]. Actually, in many cases, such as anomaly detection, project evaluation, the cost of misjudging a minority category as majority category is much higher than the opposite. Therefore, it is necessary to detect minority as much as possible to reduce the false negative rate. Therefore, it is necessary to ensure that when the test result is positive. To address this issue, this paper improved decision tree algorithms to adapt to imbalanced dataset. Moreover, can the personal characteristics of the evaluators help predict the outcome of the evaluation decision? This article is trying to figure these problems out.
Compared with the existing literature, the contributions of this article are as follows:
• This paper innovatively using machine learning method to evaluates the personal characteristics of the evaluators to predict evaluation decisions, and it enriches the literature in the field of decision making and machine learning field.
• The experimental results showed that the proposed slacked weighted entropy decision tree performs well with sensitivity of 0.87, specificity of 0.85 and average accuracy of 0.75. It also provides a satisfied classification accuracy with AUC = 0.87. This implies that the proposed method accurately classified minority class instances and suitable to imbalanced datasets.
In this section, we will describe the potential influential factor to funding decision making, and then, we provide an introduction to the advantages and disadvantages that classical classification methods may have when dealing with imbalanced data. Next, we specify the research gap of current machine learning algorithms that may have when dealing with imbalanced datasets. At last, we describe the dataset and prepare it for testing the slacked weighted entropy decision tree model we proposed.
2.1 Evaluators’ Characteristics and Evaluation Decision
The influential factors of reviewers can be divided into the following categories: demography, life experience factors, and project evaluation factors.
Demography. Gender. Reference [5] shows that in personal decision-making, women are more willing to avoid risks than men. Reference [6] find that male evaluators gave higher scores to same-sex candidates than female evaluators. Education. The study of reference [7] confirmed that the higher the level of education, the stronger the ability to accept new knowledge and new things, and the higher the tolerance for ambiguity. Discipline. Reference [8] supposes that the theories or methods adopted by a certain discipline determines their evaluation results. Reference [9] shows that compared with psychologists, philosophers were more negative and more likely to reject items. Professional title. Reference [10] shows that the predicting accuracy of a high reputation stock investment analyst is much higher than that of analysts with lower reputation. Reference [11] shows that the professional status of evaluators is closely related to evaluation decision.
Life experience factors. The research of reference [12] confirmed that a person with a commercial bank background serving as a company director (bank affiliate) can significantly change the financing behavior of the company where he belongs. Reference [13] discovers that corporate managers with university connections are more innovative. The research reference [14] reveals that entrepreneurs with government connections tend to have a stronger sense of market competition. The research of reference [15] shows that managers with connections in professional institutions show more social responsibility tendencies.
Project evaluation variables. Duration. Reference [16] holds that insufficient evaluation time may make reviewers more inclined to approve unqualified applications. Reference [17] verifies that there is significant loss aversion inclination in effort-based decision making. The research results of reference [18] show that the relationship between decision speed and decision quality depends on the decision environment. Evaluation number. Reference [19] supposes that as the workload increases, evaluators are more likely to grant patents rather than reject them. Familiarity. Reference [20] found that participants responded faster and performed better in the easy task condition. Reference [21] shows that evaluators tend to give lower scores to items that are unfamiliar to them. On the other hand, reference [22] reveals that novel projects are more popular among evaluators. Evaluation experience. Reference [23] discovers that experienced evaluators are easier to filter out irrelevant information than novices, and they are also better at selecting and evaluating inputs. Reference [24] finds that when faced with a situation similar to the past, experienced decision makers often rely on past experience to act and make decisions. But reference [25] discovers that experts sometimes show more false memories than novices. Confidence. Reference [26] shows that highly confident people are more confident in making decisions and are more likely to take risks in decision making. The study of reference [27] reveals that self-confidence affects reviewers’ assessment. Evaluation order. The research of reference [28] confirms that the first-evaluated project tends to have lower scores.
2.2 Machine Learning Algorithms
Among the many machine learning algorithms, the calculation process of K nearest neighbor (KNN) is simple and efficient, yet it is easily influenced by the sensitivity of k [29]. Support vector machines (SVM) can solve high-dimensional problems and the interaction of nonlinear features, but sometimes it is difficult to find a suitable kernel function [30]. Naive Bayes performs well on huge-scale data and requires little calculation, but it is sensitive to input data format [31]. The Artificial Neural Network (ANN) method has higher efficiency, stronger adaptability, and better generality, but there are more parameters that need to be adjusted during the training process [32]. In contrast, the decision tree is less sensitive to data distribution and can get high predictive performance for a relatively small computational effort, but it still has overfitting and instability issue [33]. Tab. 1 summarizes the advantages and disadvantages of classical machine learning models.
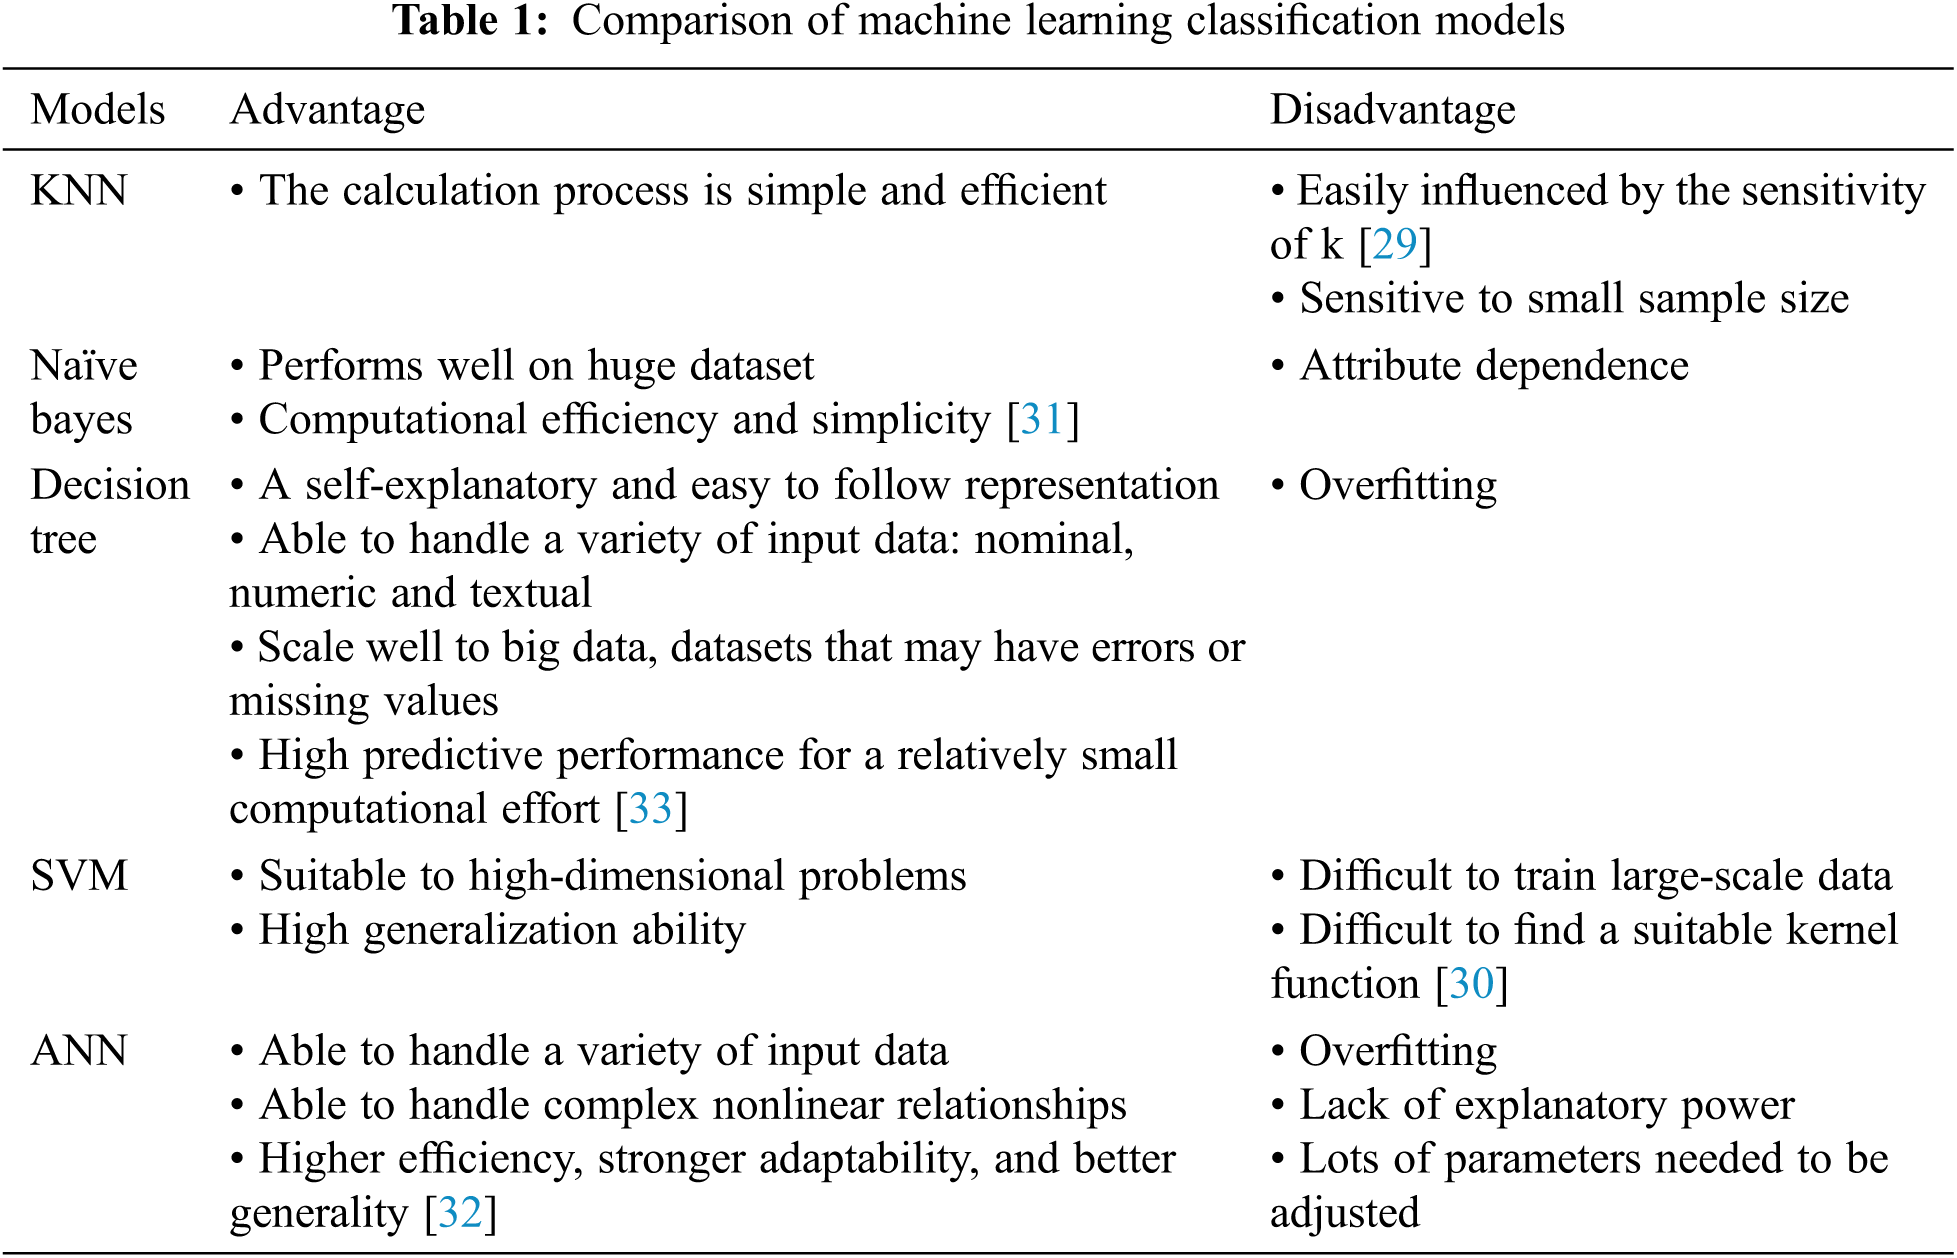
However, when dealing with imbalanced datasets, these classical classification algorithms may tend to favor majority class, making the minority class ignored. Therefore, it is necessary to improve these algorithms to adapt to imbalanced data.
2.3 Machine Learning Algorithms and Imbalanced Dataset
In order to have a better prediction result on imbalanced dataset, scholars modify the machine learning algorithms either from data-level or algorithm-level. Data-level methods concentrate on modifying the training data set to make it suitable for a standard learning algorithm. With respect to balancing distributions, we may distinguish approaches that generate new objects for minority groups (over-sampling) and that remove examples from majority groups (under-sampling). Standard approaches use random approach for selection of target samples for preprocessing. They do not depend on the specific classifier and have better adaptability, but it often leads to removal of important samples or introduction of meaningless new objects [34]. Therefore, more advanced methods were proposed. SMOTE is a renowned oversampling technique. It applies an over-sampling method by modeling from minority class instances. EasyEnsemble, BalanceCascade, NearMiss, Tomek Links are typical under-sampling methods based on Nearest Neighbor. They overcome the problems of the random under-sampling algorithm and improves generalization ability. Hybrid sampling involves partially sampling the original data using one sampling technique and then completing the process with another method [34]. In this way, the combination of under-and oversampling can drop fewer examples from the data thus decrease the loss of information. Although these existing sampling methods achieve a considerable effect, their sampling strategies treat all the training samples as the same. That is to say, they do not consider the distributions of the data in their sampling procedure [35]. Tab. 2 presents a detailed explanation of data level methods.
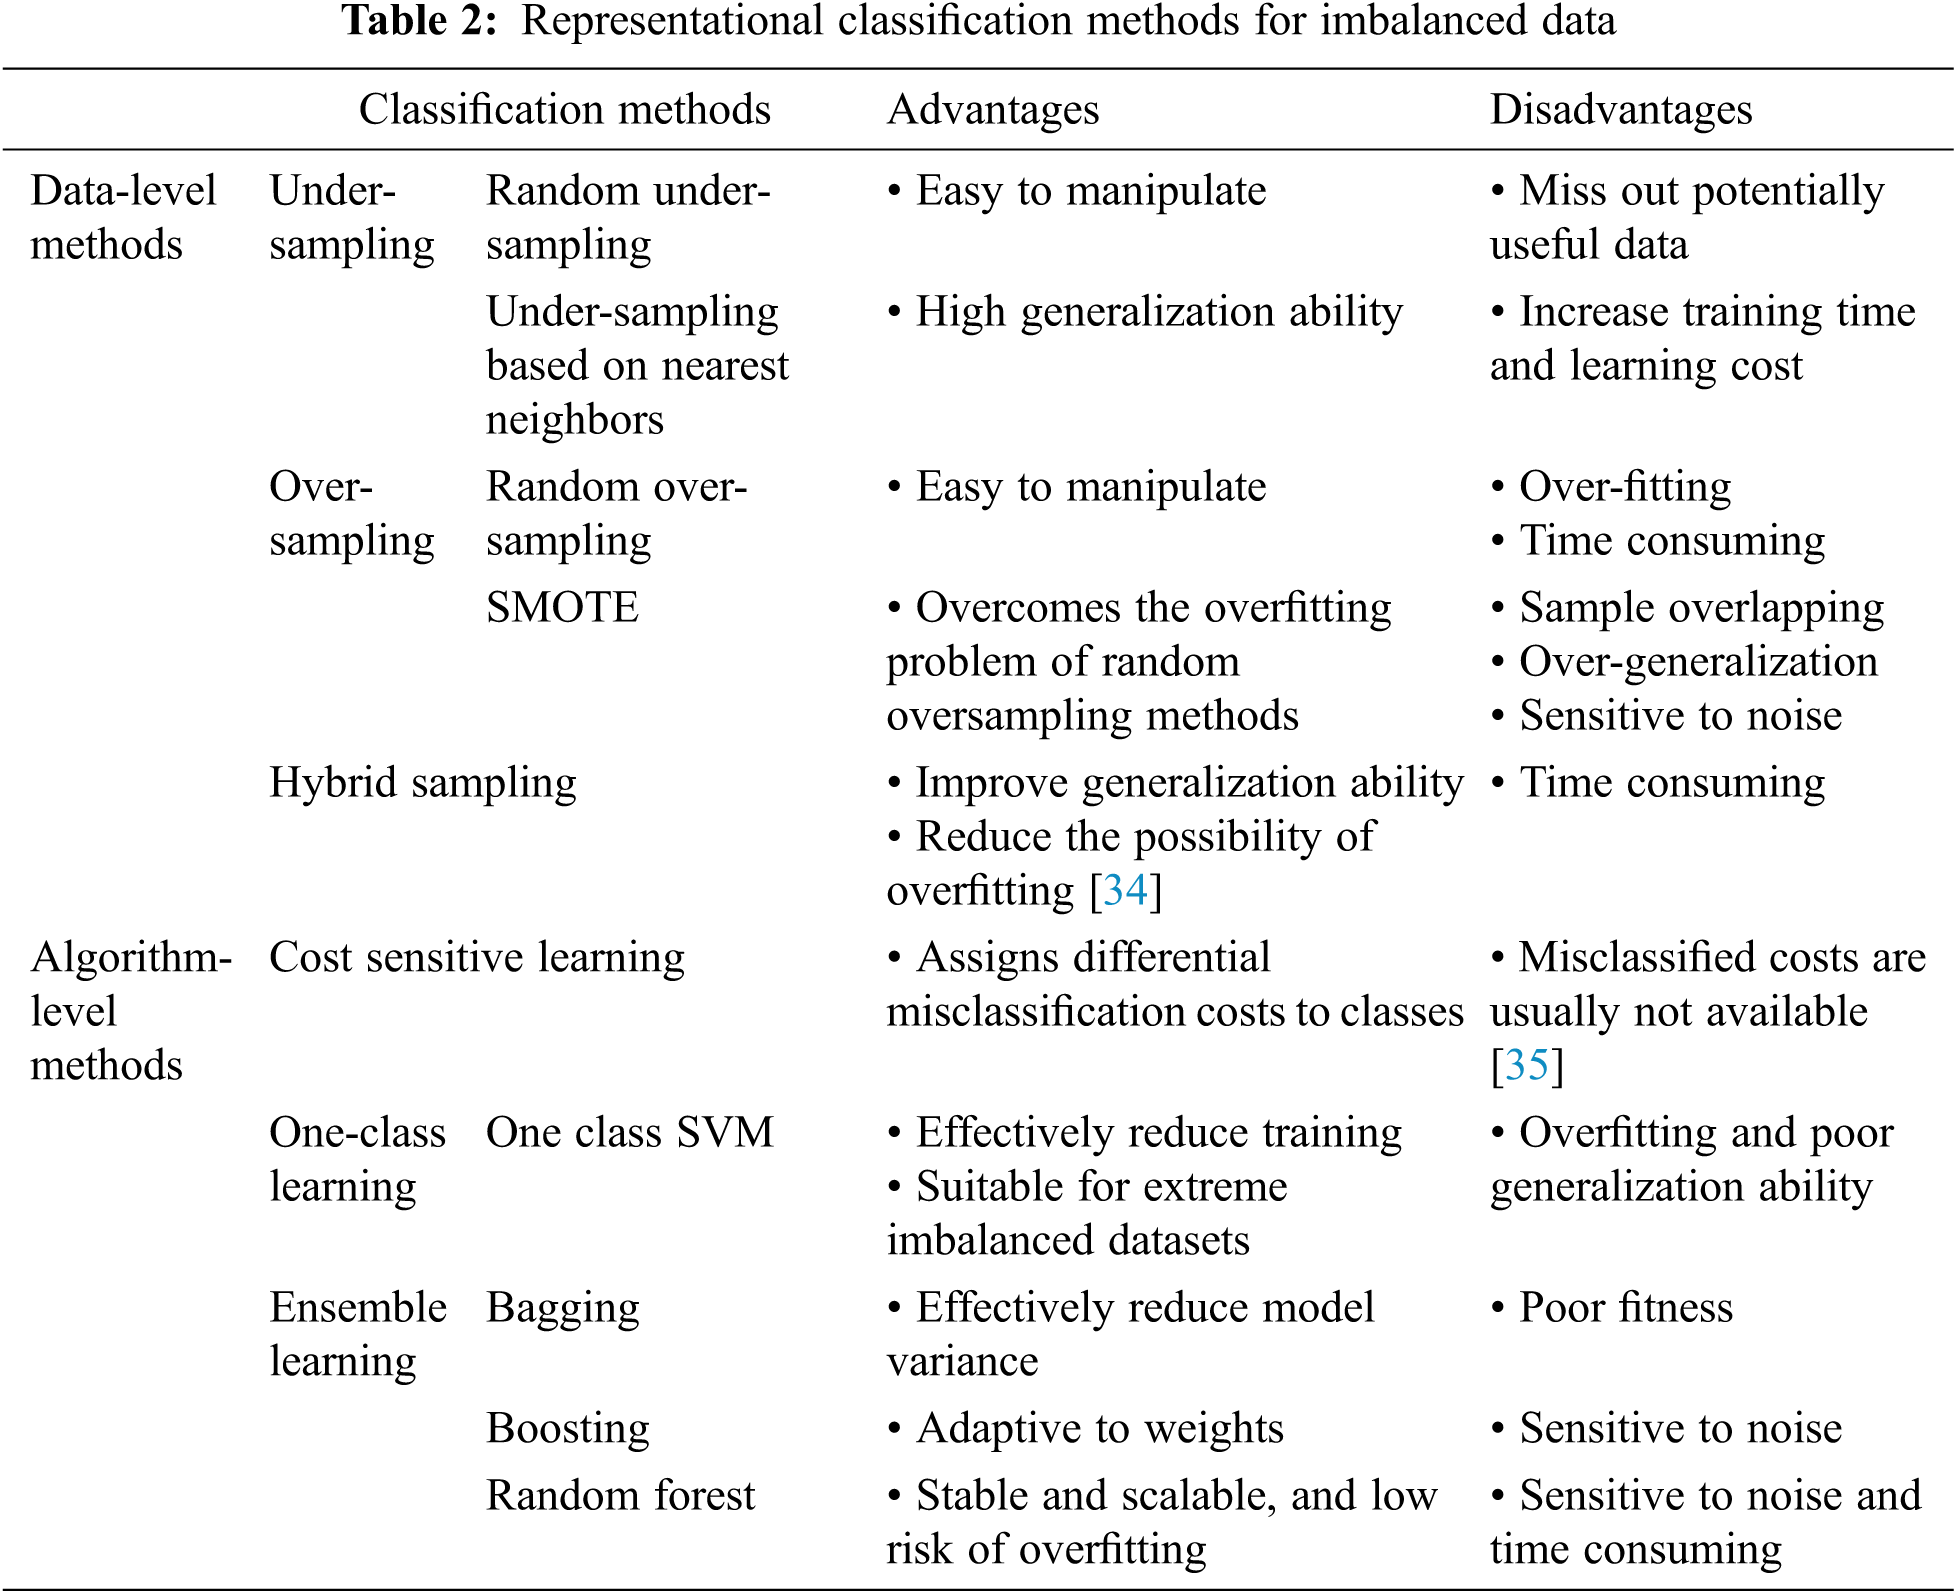
Algorithm-level methods concentrate on modifying existing learners to alleviate their bias towards majority groups [34]. Cost-sensitive learning methods introduce “cost” during the learning process to deal with the problem of imbalanced data classification. However, due to the number of samples of each type or the proportion of the number of samples of each type is used as the cost of misclassification, when the number of minority class samples is too small, i.e., when it is difficult to make an accurate estimate of the true cost of misclassification, the cost-sensitive method is no more applicable [35]. One-class learning method only needs one class of data sets as training samples, which can effectively reduce the time overhead. It is suitable for extreme cases where there are very few minority class samples or a high degree of imbalance between classes, but it is easy to fall into overfitting to the minority class samples in the training set, resulting in a decrease in generalization ability. Moreover, the selection of threshold and kernel function has a great influence on its classification effect [36]. Ensemble methods improve the classification performance by training several different classifiers and combining their predictions to output a single-class label. However, the training process for ensemble algorithm is complex, time-consuming, and it has certain limitations in processing high-dimensional data [37]. In Tab. 2, we summarize the advantage and disadvantage of the algorithm-level methods in dealing with imbalanced datasets.
These conventional class imbalance handling methods might suffer from the loss of potentially useful information, unexpected mistakes or increasing the likelihood of overfitting because they may alter the original data distribution.
The dataset we use is small and medium-sized technology-based enterprise special fund (Beijing Innofund). It covers the basic information of evaluators over the years since 2015, including the name, gender, date of birth, affiliations, position, title, and interested field; applicants’ information, such as company information, the company’s financial status, R&D status, financing needs and development forecasts, etc.; project evaluation information, including: project scoring, project approval status. Our research is based on a sample size of 8150, among which 1395 are positive cases and the rest are negative cases.
Due to both Gain and Gain Ratio are based on the entropy evaluation before and after splitting the dataset, decision trees have been proven to be skew-sensitive. The main problem with the entropy-based measures is that entropy reaches it maximal value when dataset is fully balanced-all classes have equal proportions. And if the initial dataset is not balanced, the initial entropy will be low and will result in a high false-negative rate [38].
In order to solve the above-mentioned problem, researchers keep improving decision tree algorithms. Reference [39] proposes a weighted random forest (W-RF) algorithm based on weighted voting to improve the classification performance of random forest on imbalanced datasets. Reference [40] derives weight from the class distribution to improve the minority class importance. Reference [41] introduces the overlapping weighting function to improve minority class importance. However, heuristic judgments, i.e., determined by experts is not rigorous, and grid search is time-consuming and laborious.
In addition to imbalanced data distribution, the grant funding datasets is also characterized by nonlinearity and complicated interaction between variables. Existing research has not made a breakthrough on this issue. Aiming to solve the above-mentioned issue, we proposed a slacked weighted entropy decision tree algorithms targeting to grant funding dataset.
In this section, we introduce the decision tree model and propose a solution to its degradative performance for imbalanced classification, i.e., slacked weighted entropy decision tree.
Decision tree is a classical machine learning method. It aims to classify an instance into a predefined set of classes based on their attributes’ values (features) [2]. Variable selection, variable’s relative importance assessment, missing value manipulation, prediction, are the common usages of decision tree models.
Decision tree is constructed in a top-down manner in a sequence, i.e., the entire dataset splits into smaller partitions until no further partitioning can be made. Let’s take a binary tree for example. For a single binary target variable Y (0 or 1) and four attributes, the construction of decision tree can be divided into three steps. And we will illustrate the construction of a typical decision tree in Fig. 1 as well.
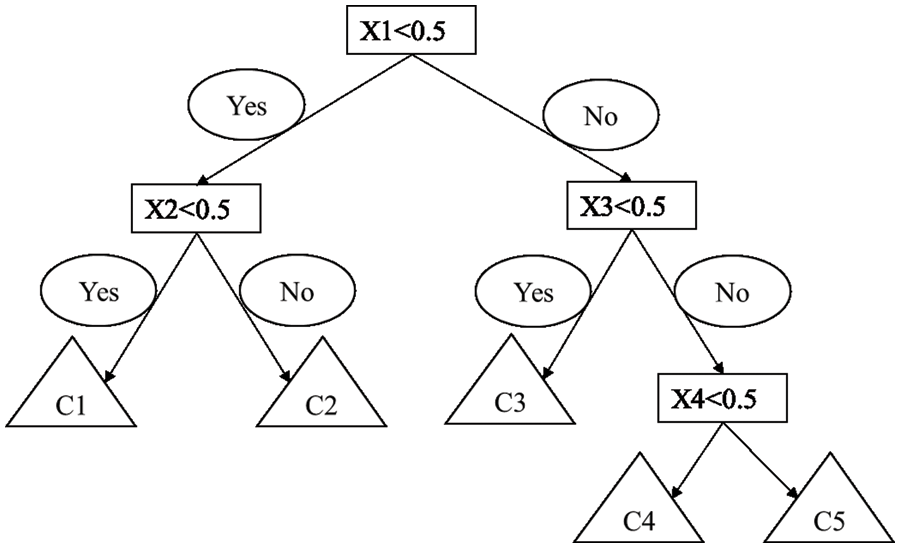
Figure 1: Example of decision tree model
Step 1: According to the splitting criterion, select the most important input attribute (X1) for the dataset (D). This root node represents a choice that will result in the subdivision of all records into two mutually exclusive subsets. At this split, all attributes/features are taken into account and the training data is divided into different groups. As presented in Fig. 1, we have 4 attributes in total, so there will be 4 pending splits. Then, the decision tree algorithm automatically calculates the cost of each split and chooses the one with the smallest loss. In this situation, the smallest loss can be got when X1 < 0.5.
Step 2: Select the optimal splitting point for the optimal splitting attribute and divide the dataset into two sub-nodes. It is worth mentioning that only input variables related to the target variable are used to split parent nodes into purer child nodes. As the child nodes splitting, the decision tree continues to grow. The decision tree uses the information gain or the information gain rate as the basis for selecting attributes.
Step 3: When all leaf nodes satisfy the stopping criterion, the decision tree stops growing. In such condition, the data in the child nodes all belong to the same class. The stopping criterion usually consists of conditions such as purity, number of leaf nodes, and tree depth.
3.2 Slacked Weighted Entropy Decision Tree
Since the predicting items of Beijing Innofund is composed of firm level information and individual level of information, normalization is needed. In this study, data are scaled into the interval of [0, 1] by using the following Eq. (1):
where x is the original value, x’ is the scaled value, max(x) is the maximum value of feature x, and min (x) is the minimum value of feature x. Then the dataset is divided into two parts for training and testing the model. The training dataset is used to train the model, while the testing dataset is used to evaluate the predictive and generalization ability of the developed model. Since there is little or no guidance in the literature on the division ratio for the training and testing of the model, we follow the tradition to set 80% of the data for training and 20% for testing.
When the data distribution is unbalanced, the C4.5 algorithm tends to favor the attribute of majority partition. In order to address this issue, we improved C4.5 algorithm by adding weight:
where n is the number of classes of dataset (D) and
Based on the information theory, the decision tree uses entropy to determine which node to split next in the algorithm. It calculates the amount of information for different classifications and then obtains the average amount of information for the training set. The higher the entropy, the higher the potential to improve the classification. The weighted information entropy of set (D) can be illustrated as Eq. (3):
where
where
The decision tree aims to normalize gain and to divide gain value by a value of split information, formulated as Eq. (6):
In extreme cases, the information gain rate is an infinite multiple of the information gain, and the information gain obviously does not play a leading role at this time. Therefore, the slacked factor δ is introduced in the calculation formula of the information gain rate. The improved information gain rate calculation formula is as follows:
After introducing the slacked factor, the information gain rate is limited to the range of [
In this section, we present the classification results of the slacked weighted entropy decision tree. By comparing it with the other machine learning methods, we find that our proposed methods can achieve satisfying classification results.
In the case of unbalanced data, sensitivity and specificity are introduced to measure classification accuracy. The sensitivity (True Positive Rate) is the ratio of correctly classified positive instances to true positive instances. Among them, True Positives (TP) represents the number of positive samples predicted to be positive, and false negatives (False Negatives, FN) represents the number of positive samples predicted to be negative.
The specificity indicates the percentage of correctly classified negative samples to the true negative samples, as shown in Eq. (9). Among them, True Negatives (TN) represents the number of negative samples predicted to be negative, and False Positives (FP) represents the number of negative samples predicted to be positive.
A receiver operating characteristic (ROC) graph is a useful tool for visualizing and comparing classifier performance based on TPR and FPR measures. In the presence of imbalanced datasets with unequal error costs, it is more appropriate to use the ROC curve or other similar techniques. ROC curves can be thought of as representing the family of best decision boundaries for relative costs of TP and FP. On an ROC curve the X-axis represents FPR = FP/(TN + FP) and the Y-axis represents TPR = TP/(TP + FN). The ideal point on the ROC curve would be (0, 100), that is all positive examples are classified correctly and no negative examples are misclassified as positive [42].
Besides the above-mentioned metrics, we also include average accuracy rate into our model. Unlike accuracy rate, average accuracy rate is suitable for unbalanced data, because it calculates the accuracy of each category separately.
4.2 Development of Slacked Weighted Entropy Decision Trees
This default rule of decision tree parameters often works well across a broad range of problems. In details, the splitting criterion used is entropy; the minimum sample leaf = 1; the min sample split = 2; the max features = none, random state = none; the maximum leaf nodes = none; the minimum impurity split = none; the maximum depth = none. Due to our dataset is imbalanced, we set class weight = ’balanced’, and let minimum weight fraction leaf increased from 0 to 0.5 gradually. As shown in Fig. 2, when the minimum weight fraction leaf reaches to 0.5, the model gets the highest sensitivity, specificity and accuracy. Therefore, minimum weight fraction leaf is set as 0.5.

Figure 2: Accuracy rate under different minimum weight fraction leaf
A) ROC Results of SWE-DT
Fig. 3 presents the ROC results of the slacked weighted entropy decision trees. It shows the SWE decision tree provides a satisfied classification accuracy with AUC = 0.87. This implies that our proposed method accurately classified minority class instances with a tolerable FPR sacrifice.
B) Robust Check of SWE-DT

Figure 3: Classification results of improved decision tree
Fig. 4 shows the forecasting accuracy, sensitivity and specificity attained by our DT algorithms with 50%, 60%, 70% and 80% of the training dataset. The predictive performance of the SWE-DT algorithms increases progressively from the smallest to the biggest size group. Specifically, accuracy keeps steady at about 0.75, sensitivity also remains unchanged around 0.86. Specificity increases from 0.66 to 0.84. It proves that the DT model can not only provide reliable prediction results, but also in a consistent way.
C) Comparison between Slacked Weighted Entropy Algorithm and Classical Decision Tree

Figure 4: Classification results of SWE-DT
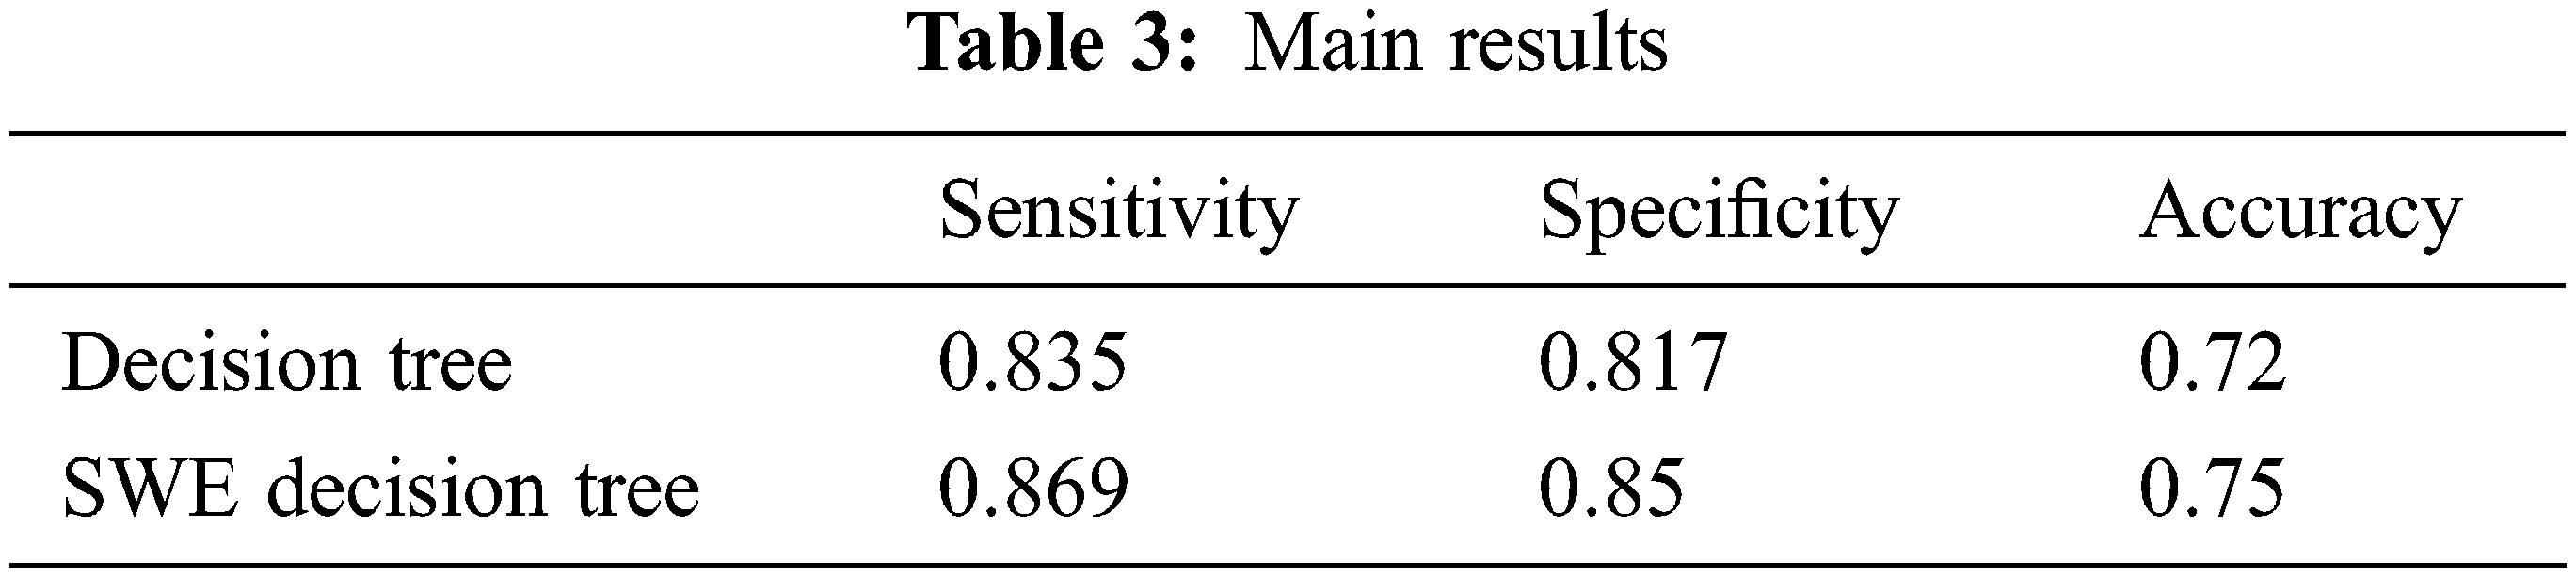
As can be seen from the Tab. 3, the SWE-DT with the proposed enhancement gives better sensitivity results with 0.869, better than that of 0.835 of the classical decision tree. It means that the application of the weighted entropy instead of the classical entropy evaluation without modification of the dataset itself can give positive increase in the classifier sensitivity. At the same time, the table shows that there is an increase in the specificity of modified decision tree algorithm (0.85), comparing to the original decision tree algorithm results with a specificity of 0.817. The increase of sensitivity and specificity makes the average accuracy improves from 0.72 to 0.75.
D) Comparison between Machine Learning Methods
As can be seen from Fig. 5a, the improved decision tree achieves the best sensitivity results. We observe that the sensitivity of naïve bayes, KNN, SVM, ANN and SWE decision tree is 0.8, 0.78, 0.85, 0.84, 0.87 respectively at 80% dataset. It proves that the SWE-DT model can select the most positive cases among all the machine learning methods. Moreover, Fig. 5b presents the specificity of each machine learning models. With the enlarging of dataset, the specificity of SWE-DT increases from 0.65 to 0.85.It is surpassed by SVM (0.86), and followed by ANN (0.73), naïve bayes (0.67) and KNN (0.63). It shows that the SWE-DT can correctly select quite a large number of negative cases. Fig. 5c compares the classification accuracy of the five machine learning models with 50%, 60%, 70% and 80% of the dataset. We can see that the average accuracy of all the models decrease progressively from the smallest to the biggest size group. However, the SWE-DT performs better than naïve bayes, KNN, SVM, ANN with classification accuracy of 0.76 (50%), 0.76 (60%), 0.75 (70%) and 0.75 (80%) respectively. It is reflected that positive cases and negative cases can be separated by using our machine learning models. Based on these results, the slacked weighted entropy decision tree is recommended for funding results prediction.

Figure 5: (a) Comparison of sensitivity between machine learning methods (b) Comparison of specificity between machine learning methods (c) Comparison of average accuracy between machine learning methods
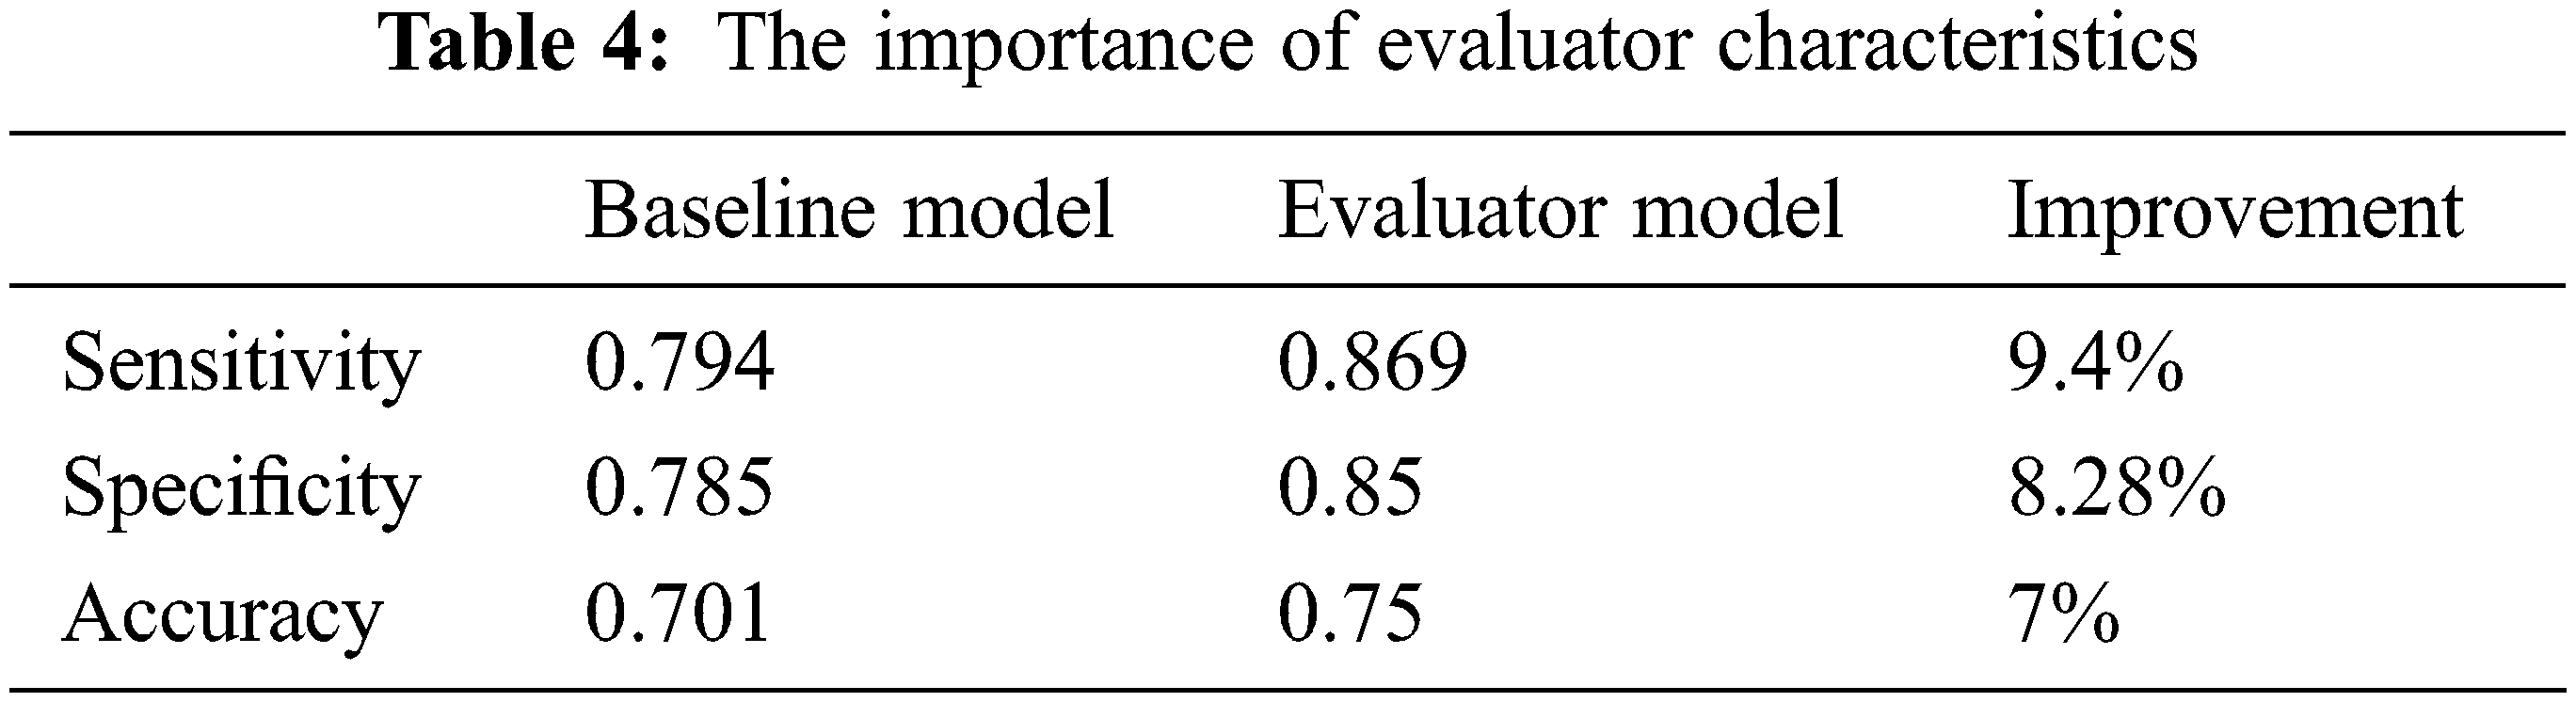
4.4 Can Evaluators’ Personal Characteristics Predict Evaluation Results?
Tab. 4 is the comparison and display of classification results before and after adding evaluator model. In this experiment, the effect difference of the baseline model and evaluator model are quite obvious. In the baseline model, the sensitivity is 0.79 and specificity is 0.78. After adding evaluator factors into the model, the sensitivity improved into 0.87, and specificity increased into 0.85. Sensitivity was improved by over 9% and specificity was improved by nearly 8%. The average accuracy also increases by 7% from 0.7 to 0.75. It proves the feasibility of our model.
We proposed a new tree induction method-slacked weighted entropy to modify the classical decision tree algorithm. Instead of examining information entropy, the proposed method uses the difference in the weight to determine the best split when growing a decision tree. We compared our method with the original decision tree algorithm based on Beijing Innofund data. The experimental results showed that the slacked weighted entropy algorithm with the proposed enhancement performs well with sensitivity of 0.87, specificity of 0.85 and average accuracy of 0.75. The proposed method appeared to be more suitable for binary imbalanced data classification. More specifically, our method did not sacrifice the false positive rate to increase the true positive rate. It is, therefore, useful when the misclassification costs are unknown in imbalanced data classification tasks.
For future research, more evaluators’ factors could be used by the developed model to improve performance. To learn which factors and how much improvement have to be done to win a funding would be a challenging issue to study. The other possible direction is the collection of data from other fundings, such as NNSFC, NSSFC, in order to examine the feasibility and generality of the slacked weighted entropy decision tree model.
Acknowledgement: We would like to thank Beijing municipal government for support us doing this research.
Funding Statement: This research project is supported by the Science Foundation of Beijing Language and Culture University (supported by the Fundamental Research Funds for the Central Universities) (21YBB35), the Hainan Provincial Natural Science Foundation of China (620RC562), the Program of Hainan Association for Science and Technology Plans to Youth R & D Innovation (Grant No. QCXM201910) and the Postdoctoral Science Foundation of China (2021M690338).
Conflicts of Interest: The authors declare that they have no conflicts of interest to report regarding the present study.
References
1. C. Kuzey, A. Uyar and D. Delen, “The impact of multinationality on firm value: A comparative analysis of machine learning techniques,” Decision Support Systems, vol. 59, pp. 127–142, 2014. [Google Scholar]
2. C. Voyant, G. Notton, S. Kalogirou, M. L. Nivet, C. Paoli et al., “Machine learning methods for solar radiation forecasting: A review,” Renewal Energy, vol. 105, pp. 569–582, 2017. [Google Scholar]
3. A. K. Dutta, “Detecting lung cancer using machine learning techniques,” Intelligent Automation & Soft Computing, vol. 31, no. 2, pp. 1007–1023, 2022. [Google Scholar]
4. K. A. Bhavsar, A. Abugabah, J. Singla, A. A. AlZubi, A. K. Bashir et al., “A comprehensive review on medical diagnosis using machine learning,” Computers, Materials & Continua, vol. 67, no. 2, pp. 1997–2014, 2021. [Google Scholar]
5. J. Nieboer, “Group member characteristics and risk taking by consensus,” Journal of Behavioral & Experimental Economics, vol. 57, pp. 81–88, 2015. [Google Scholar]
6. V. Chandler, “Do evaluators prefer candidates of their own gender?” Canadian Public Policy, vol. 44, no. 4, pp. 289–302, 2015. [Google Scholar]
7. M. F. Wiersema and K. A. Bantel, “Top management team demography and corporate strategic change,” Academy of Management Journal, vol. 35, pp. 91–121, 1992. [Google Scholar]
8. M. Lamont, How Professors Think Inside the Curious World of Academic Judgment, Cambridge, Mass.: Harvard University Press, 2009. [Google Scholar]
9. C. J. Lee and C. D. Schunn, “Social biases and solutions for procedural objectivity,” Hypatia, vol. 26, no. 2, pp. 352–373, 2011. [Google Scholar]
10. B. Groysberg, J. T. Polzer and H. A. Elfenbein, “Too many cooks spoil the broth: How high-status individuals decrease group effectiveness,” Organization Science, vol. 22, pp. 722–737, 2011. [Google Scholar]
11. C. Zhang, Y. Li, D. Liu and X. Hu, “Professional power, job security, and decision making in project funding: The assessors’ perspective,” Social Behavior and Personality: An International Journal, vol. 48, no. 2, pp. e8567, 2020. [Google Scholar]
12. W. Li, C. Wu, L. Xu and Q. Tang, “Bank connections and the speed of leverage adjustment: Evidence from China’s listed firms,” Accounting and Finance (Parkville), vol. 57, no. 5, pp. 1349–1381, 2017. [Google Scholar]
13. J. Ye, Y. Wu, B. Hao and Z. Chen, “The interplay of external ties and internal knowledge base,” Chinese Management Studies, vol. 13, no. 4, pp. 778–801, 2019. [Google Scholar]
14. W. Gao, Z. Huang and P. Yang, “Political connections, corporate governance and M&A performance: Evidence from Chinese family firms,” Research in International Business and Finance, vol. 50, pp. 38–53, 2019. [Google Scholar]
15. J. Luo and Q. Liu, “Corporate social responsibility disclosure in China: Do managerial professional connections and social attention matter?” Emerging Markets Review, vol. 43, pp. 100679, 2020. [Google Scholar]
16. M. Frakes and M. F. Wasserman, “Is the time allocated to review patent applications inducing examiners to grant invalid patents? Evidence from microlevel application data,” The Review of Economics and Statistics, vol. 99, no. 3, pp. 550–563, 2017. [Google Scholar]
17. S. Massar, Z. Pu, C. Chen and M. Chee, “Losses motivate cognitive effort more than gains in effort-based decision making and performance,” Frontiers in Human Neuroscience, vol. 14, pp. 287. 2020. [Google Scholar]
18. M. Kocher and M. Sutter, “Time is money-time pressure, incentives, and the quality of decision-making,” Journal of Economic Behavior & Organization, vol. 61, pp. 375–392, 2006. [Google Scholar]
19. Y. K. Kim and J. B. Oh, “Examination workloads, grant decision bias and examination quality of patent office,” Research Policy, vol. 46, no. 5, pp. 1005–1019, 2017. [Google Scholar]
20. Y. Sun, Y. Ding, J. Jiang and V. G. Duffy, “Measuring mental workload using erps based on fir, ica, and mara,” Computer Systems Science and Engineering, vol. 41, no. 2, pp. 781–794, 2022. [Google Scholar]
21. J. P. Ferguson and G. Carnabuci, “Risky recombinations: Institutional gatekeeping in the innovation process,” Organization Science, vol. 28, no. 1, pp. 133–151, 2016. [Google Scholar]
22. K. J. Boudreau, E. C. Guinan, K. R. Lakhani and C. Riedl, “Looking across and looking beyond the knowledge frontier: Intellectual distance, novelty, and resource allocation in science,” Management Science, vol. 62, no. 10, pp. 2765–2783, 2016. [Google Scholar]
23. J. Mishra, D. Allen and A. Pearman, “Information seeking, use, and decision making,” Journal of the Association for Information Science & Technology, vol. 66, pp. 662–673, 2015. [Google Scholar]
24. P. Fischer, F. Julia, W. Silke and F. Dieter, “Selective exposure to information: How different modes of decision making affect subsequent confirmatory information processing,” British Journal of Social Psychology, vol. 49, no. 4, pp. 871–81, 2010. [Google Scholar]
25. V. Ottati, E. Price, C. Wilson and N. Sumaktoyo, “When self-perceptions of expertise increase closed-minded cognition: The earned dogmatism effect,” Journal of Experimental Social Psychology, vol. 61, pp. 131–138, 2015. [Google Scholar]
26. S. Chuang, Y. Cheng, C. Chang and Y. Chiang, “The impact of self-confidence on the compromise effect,” International Journal of Psychology, vol. 48, no. 4, pp. 660–675, 2013. [Google Scholar]
27. J. Friedman and R. Zeckhauser, “Analytic confidence and political decision-making: Theoretical principles and experimental evidence from national security professionals,” Political Psychology, vol. 39, no. 5, pp. 1069–1087, 2018. [Google Scholar]
28. J. Bian, J. Greenberg, J. Li and Y. Wang, “Good to go first? Position effects in expert evaluation of early-stage ventures,” Management Science, vol. 8, no. 1, pp. 300–315, 2021. [Google Scholar]
29. J. Gou, H. Ma, W. Ou, S. Zeng, Y. Rao et al., “A generalized mean distance-based k-nearest neighbor classifier,” Expert System with Application, vol. 115, pp. 356–372, 2019. [Google Scholar]
30. S. Han, Q. Wu, H. Zhang, B. Qin, J. Hu et al., “Log-based anomaly detection with robust feature extraction and online learning,” IEEE Transactions on Information Forensics and Security, vol. 16, pp. 2300–2311, 2021. [Google Scholar]
31. N. Singh and P. Singh, “A novel bagged naïve Bayes-decision tree approach for multi-class classification problems,” Journal of Intelligent & Fuzzy Systems, vol. 36, no. 3, pp. 2261–2271, 2019. [Google Scholar]
32. K. Kumar and S. Bhattacharya, “Artificial neural network vs. linear discriminant analysis in credit ratings forecast: A comparative study of prediction performances,” Review of Accounting Finance, vol. 5, no. 3, pp. 216–227, 2006. [Google Scholar]
33. L. Rokach, “Decision forest: Twenty years of research,” Information Fusion, vol. 27, pp. 111–125, 2016. [Google Scholar]
34. B. Krawczyk, “Learning from imbalanced data: Open challenges and future directions,” Progress in Artificial Intelligence, vol. 5, no. 4, pp. 221–232, 2016. [Google Scholar]
35. D. Li, Z. Chi, B. Wang, Z. Wang, H. Yang et al., “Entropy-based hybrid sampling ensemble learning for imbalanced data,” International Journal of Intelligent Systems, vol. 36, no. 7, pp. 3039–3067, 2021. [Google Scholar]
36. S. M. Erfani, R. Sutharshan, K. Shanika and L. Christopher, “High-dimensional and large-scale anomaly detection using a linear one-class SVM with deep learning,” Pattern Recognition, vol. 58, pp. 121–34, 2016. [Google Scholar]
37. X. Gao, B. Ren, H. Zhang, B. Sun, J. Li et al., “An ensemble imbalanced classification method based on model dynamic selection driven by data partition hybrid sampling,” Expert Systems with Applications, vol. 160, pp. 113660, 2020. [Google Scholar]
38. A. Kirshners, S. Parshutin and H. Gorskis, “Entropy-based classifier enhancement to handle imbalanced class problem,” Procedia Computer Science, vol. 104, pp. 586–591, 2017. [Google Scholar]
39. Z. Yu, C. Zhang, N. Xiong and F. Chen, “A new random forest applied to heavy metal risk assessment,” Computer Systems Science and Engineering, vol. 40, no. 1, pp. 207–221, 2022. [Google Scholar]
40. A. B. Pratikkumar and B. J. Harikrishna, “Mgini-improved decision tree using minority class sensitive splitting criterion for imbalanced data of covid-19,” Journal of Information Science and Engineering, vol. 37, no. 5, pp. 1097–1108, 2021. [Google Scholar]
41. A. Sagoolmuang and K. Sinapiromsaran, “Decision tree algorithm with class overlapping-balancing entropy for class imbalanced problem,” International Journal of Machine Learning and Computing, vol. 10, no. 3, pp. 444–451, 2020. [Google Scholar]
42. N. V. Chawla, K. W. Bowyer, L. O. Hall and W. P. Kegelmeyer, “SMOTE: Synthetic minority over-sampling technique,” The Journal of Artificial Intelligence Research, vol. 16, pp. 321–57, 2002. [Google Scholar]
Cite This Article
 Copyright © 2023 The Author(s). Published by Tech Science Press.
This work is licensed under a Creative Commons Attribution 4.0 International License , which permits unrestricted use, distribution, and reproduction in any medium, provided the original work is properly cited.
 Downloads
 Citation Tools