 Open Access
ARTICLE
Political Optimizer with Deep Learning-Enabled Tongue Color Image Analysis Model
1 Department of Computer and Self Development, Preparatory Year Deanship, Prince Sattam bin Abdulaziz University, AlKharj, Saudi Arabia
2 Department of Computer Sciences, College of Computer and Information Sciences, Princess Nourah bint Abdulrahman University, P.O. Box 84428, Riyadh, 11671, Saudi Arabia
3 Department of Industrial Engineering, College of Engineering at Alqunfudah, Umm Al-Qura University, Mecca, 24382, Saudi Arabia
4 Department of Information Systems, College of Science & Art at Mahayil, King Khalid University, Abha, 62529, Saudi Arabia
5 Department of Information System, College of Computer Engineering and Sciences, Prince Sattam bin Abdulaziz University, AlKharj, Saudi Arabia
6 Department of Mathematics, Faculty of Science, Cairo University, Giza, 12613, Egypt
* Corresponding Author: Anwer Mustafa Hilal. Email:
Computer Systems Science and Engineering 2023, 45(2), 1129-1143. https://doi.org/10.32604/csse.2023.030080
Received 17 March 2022; Accepted 26 April 2022; Issue published 03 November 2022
Abstract
Biomedical image processing is widely utilized for disease detection and classification of biomedical images. Tongue color image analysis is an effective and non-invasive tool for carrying out secondary detection at anytime and anywhere. For removing the qualitative aspect, tongue images are quantitatively inspected, proposing a novel disease classification model in an automated way is preferable. This article introduces a novel political optimizer with deep learning enabled tongue color image analysis (PODL-TCIA) technique. The presented PODL-TCIA model purposes to detect the occurrence of the disease by examining the color of the tongue. To attain this, the PODL-TCIA model initially performs image pre-processing to enhance medical image quality. Followed by, Inception with ResNet-v2 model is employed for feature extraction. Besides, political optimizer (PO) with twin support vector machine (TSVM) model is exploited for image classification process, shows the novelty of the work. The design of PO algorithm assists in the optimal parameter selection of the TSVM model. For ensuring the enhanced outcomes of the PODL-TCIA model, a wide-ranging experimental analysis was applied and the outcomes reported the betterment of the PODL-TCIA model over the recent approaches.Keywords
Tongue diagnosis is a productive painless strategy for assessing the condition of an individual’s inside parts in oriental prescription, i.e., Japanese conventional herbal medication, traditional Chinese medication (TCM), etc [1,2]. Traditionally, restorative doctors will examine these color features relying on broad information. Be that as it may, subjectivity and equivocalness are frequently followed with their determinations result [3]. For eliminating these subjective elements, tongue color examinations are impartially inspected by their color features that give an original strategy to diagnosing infection, one that lessens the actual injury caused to individual (connected with another therapeutic examination). The analysis method depends on expert’s view as indicated by visual assessment including structure, substance, color, movement, and covering the tongue [4]. As opposed to tongue irregular events and infection, regular tongue analyze are exceptionally energetic for perceiving the illness. For example, the tongue covering white oily and yellow thick event demonstrates hot and cold conditions, correspondingly that are associated with wellbeing states like safe, aggravation, contamination, endocrine, or stress problems. Eliminating the reliance on experience and emotional based examination of tongue analyses could altogether increase the chance of utilizing tongue analysis on the planet including Western medication [5]. Automated tongue appraisal including color adjustment, light assessment, image examination, math investigation, tongue division, etc can be a proficient gadget to analyze sickness that targets tending to this problem [6].
However, a few modules are relying on approach of individual features are introduced and accomplished compelling results, this sort of strategy utilizes lower level features [7]. It can be expected for coordinating a design which could make entire features from tongue images [8,9]. Hence, more significant level features have been expected for computer aided diagnosis (CAD) tongue investigations. In the current distributions was characterized and utilized deep learning (DL) methods for separating more significant level portrayals to broad vision investigation processes like article acknowledgment, transcribed digit recognizable proof, and face acknowledgment [10].
Mansou et al. [11] develop automatic Internet of Things (IoT) and synergic DL based tongue color images (ASDL-TCI) for disease classification and diagnosis. Furthermore, deep neural network (DNN) based classification is employed to define the presence of the disease. At last, enhanced black widow optimization (EBWO) related parameter tuning procedure was performed for improving the diagnosis accuracy. Jiang et al. [12] proposed an approach-based computer tongue image analysis technique for observing the tongue features of 1778 participants. Integrating basic information, serological indexes, and quantitative tongue image features. The applications of computer intelligent tongue diagnoses technique increase the performance of Non-alcoholic fatty liver disease (NAFLD) diagnoses and offer an appropriate methodological reference for the formation of earlier screening metho.
Yan et al. [13] developed a differentiable weighted histogram system for extracting color features that are utilized in a novel upsampling model named the mixed feature attention upsampling model for assisting image generation. In [14], the authors developed a computer aided smart decision support system, the DenseNet architecture is applied for identifying the essential feature of the tongue images namely texture, color, red spots, fur coating, and tooth markings. To implement Support Vector Machines (SVM) is applied for optimizing accuracy the SVM parameter is tuned via Particle Swarm Optimization (PSO) method. In [15], the authors proposed a stochastic region pooling technique for gaining comprehensive regional characteristics. As well, we proposed an inner-imaging channel relation modelling technique to model multiple region relationships on every network. Furthermore, it combines with the spatial attention module.
This article introduces a novel political optimizer with deep learning enabled tongue color image analysis (PODL-TCIA) approach. The presented PODL-TCIA model aims to detect the occurrence of the disease by examining the color of the tongue. To attain this, the PODL-TCIA model initially performs image pre-processing to enhance medical image quality. Followed by, Inception with ResNet-v2 model is employed for feature extraction. Besides, political optimizer (PO) with twin support vector machine (TSVM) model is exploited for image classification process. The design of PO algorithm assists in the optimal parameter selection of the TSVM model. For ensuring the enhanced outcomes of the PODL-TCIA model, a wide-ranging experimental analysis is performed and the outcomes reported the betterment of the PODL-TCIA model over the recent approaches.
In this study, a novel PODL-TCIA model was established for the investigation of tongue color images. The presented PODL-TCIA model performed image pre-processing to improvise the quality of the medical images. Besides, the Inception with ResNet-v2 model is employed for feature extraction. Moreover, the PO with TSVM model is exploited for image classification process. Fig. 1 illustrates the overall block diagram of PODL-TCIA technique.
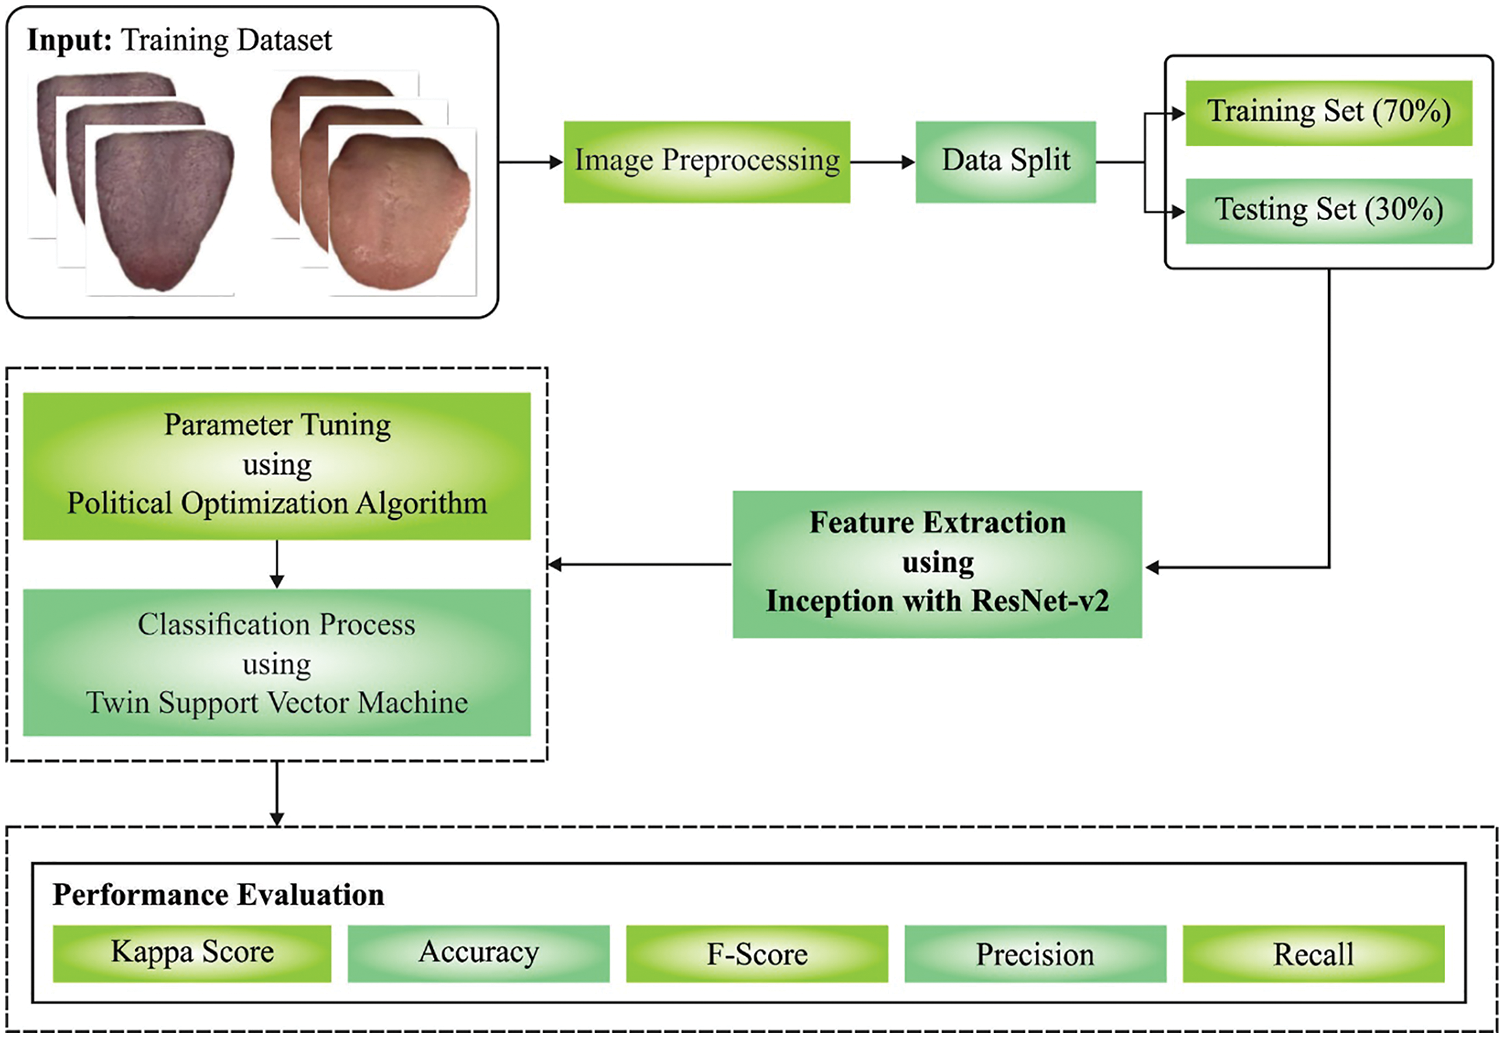
Figure 1: Block diagram of PODL-TCIA technique
2.1 Stage 1: Image Pre-processing
Primarily, the presented PODL-TCIA model performed image pre-processing to improvise the quality of the medical images. The median filter (MF) is used to remove the noise. For an image with null average noise in uniform distribution, the noise variant of the MF technique can be defined as follows.
where
2.2 Stage 2: Feature Extraction
Followed by, the Inception with ResNet-v2 model is employed for feature extraction [16]. Rather than developing a convolutional neural network (CNN) structure from scratch, the presented method is depending upon finetuning some topmost layers where weight in earlier layer is frozen. An earlier layer of CNN-based model is accountable to extract lower-level features, namely blobs, edges, lines, and so on. The effective extraction of this lower-level feature is very significant for image classification challenges. As pretrained deep CNN structure weight is highly previously enhanced on a huge data, the presented technique is depending on the finetuning of topmost layer to augment higher-level features when maintaining first layer frozen. Pretrained InceptionResNet-V2, depending on inception network and contains 164 layers. It incorporates residual connection as in ResNet architecture to improve the accuracy with lower computation cost. Afterward the summary of residual connection, batch normalization is included by all the blocks. To alleviate the training procedure, residual connection is scaled-down beforehand feeding into the activation of preceding layer. Fig. 2 depicts the structure of Inception ResNet v2. Here, the topmost two blocks of this technique are finetuned, and weight is upgraded. Global average pooling layer is employed, and the last 4 fully connected layers using 128, 1024, 512, and 256 units, correspondingly, as well as rectified linear unit (ReLU) activation is employed. For the final layer, the sigmoid activation function is utilized for binary classification.
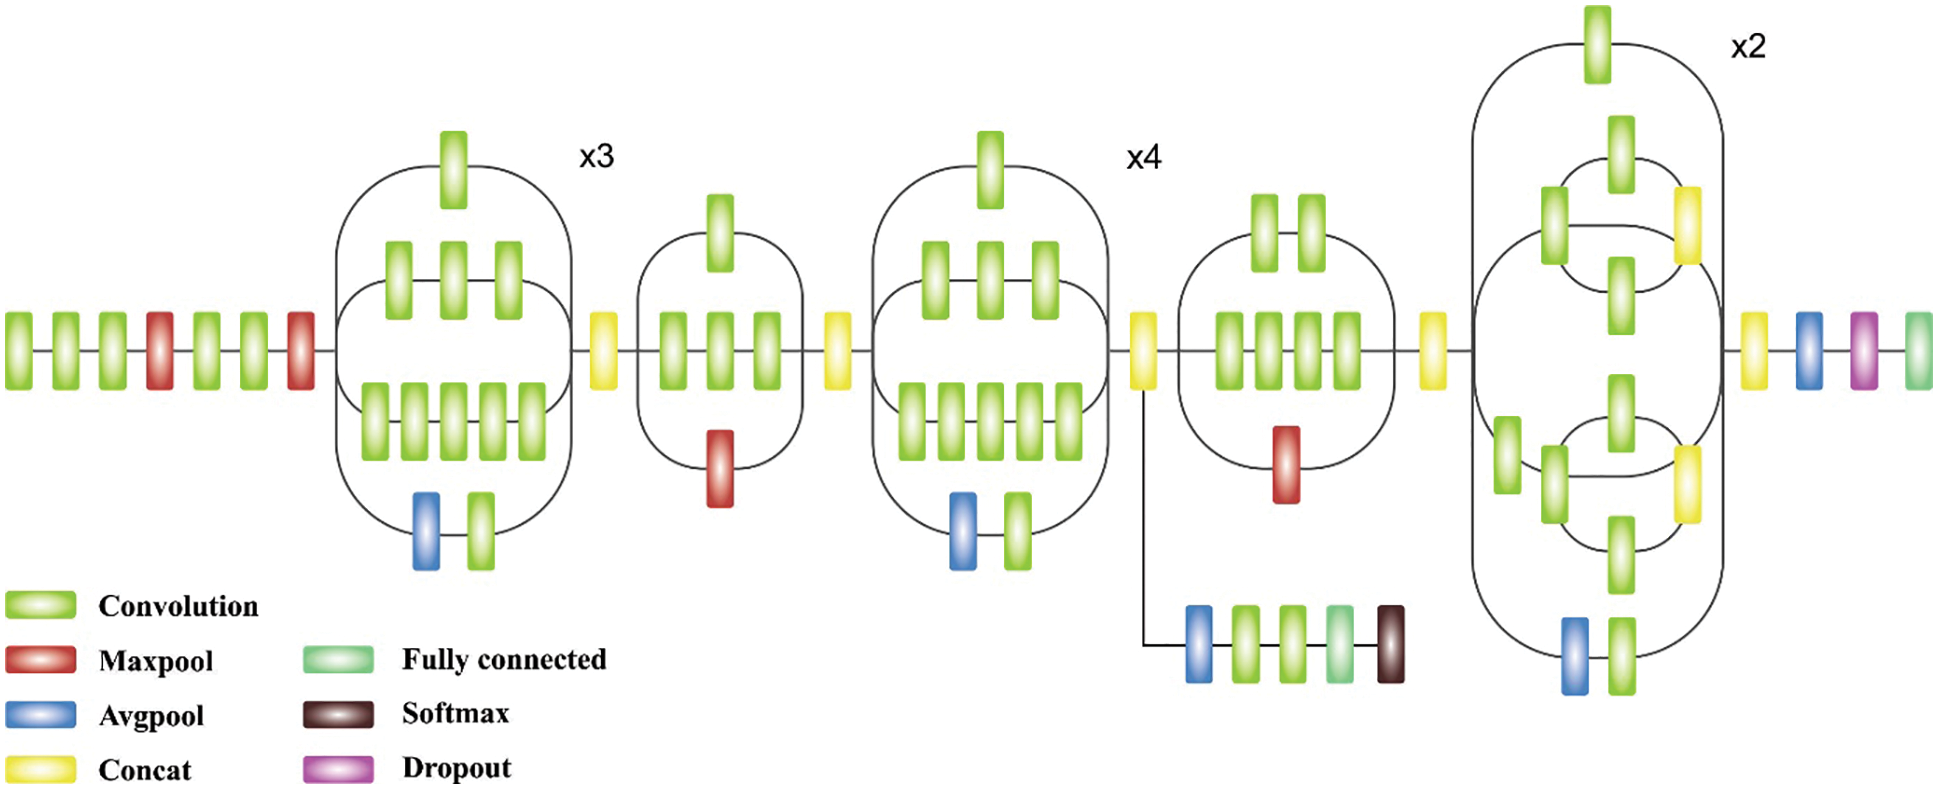
Figure 2: Inception ResNet v2
2.3 Stage 3: Hyperparameter Optimization
For optimal adjustment of the hyperparameters involved in the Inception with ResNet-v2 model, the PO algorithm has been employed to it. In PO technique is an existing meta-heuristic algorithm can be inspired by the political model with multi-phase nature [17]. The politics were dependent upon the political struggle amongst 2 individuals, all individual’s attempts for improving their concern for winning the election. Each party attempts for expanding the count of seats from parliament to the highest range to procedure the government. In PO, the member of parties was regarded as a (candidate solution) if the individual concern was assumed as the individual place (design variable). The election refers the main function, for instance, defined based on the count of votes reached by candidates. The party development, parliamentary affairs, PO, party switching, electioneering, distribution of constituencies, and elections in the party are the 5 steps of the parliament. A primary phase was implemented one time, it can be regarded as initiation procedure once the other stages are applied from the loop.
During the party distribution step, the population includes
whereas
The fittest party member has been regarded as the leader, it could broadcast then the election inside the party as:
Assume
The vector of all parliamentarian is written as:
But
while
The party switching phase is executed by distributing a variable termed as party switch rate
The Election was simulated by measuring the fitness of all individual’s competing candidates from the electoral region and declaring the winner based on the succeeding formula:
whereas
Then, executing the election inside the party, the government was generated. The parliamentarian was described. During this phase, the parliamentarians upgrade their place but the evaluated FF values were optimized.
2.4 Stage 4: Image Classification
At the final stage, the TSVM model has been executed for determining appropriate class labels to the tongue color images. The TWSVM is further progress of SVM projected [18]. TWSVM drives to find 2 symmetry planes for every plane takes a distance of approximately one data class and to probable in other data classes. Consider that trained data set
In which
TWSVM 1:
subject to
and
TWSVM 2:
subject to
whereas
The 2 hyperplanes of TWSVM with kernel:
In which
KTWSVM 1:
subject to
and
KTWSVM 2:
subject to
whereas
This section investigates the enhanced performance of the PODL-TCIA model using tongue image dataset. The dataset comprises five classes with 50 images under each class. Fig. 3 depicts the sample images.
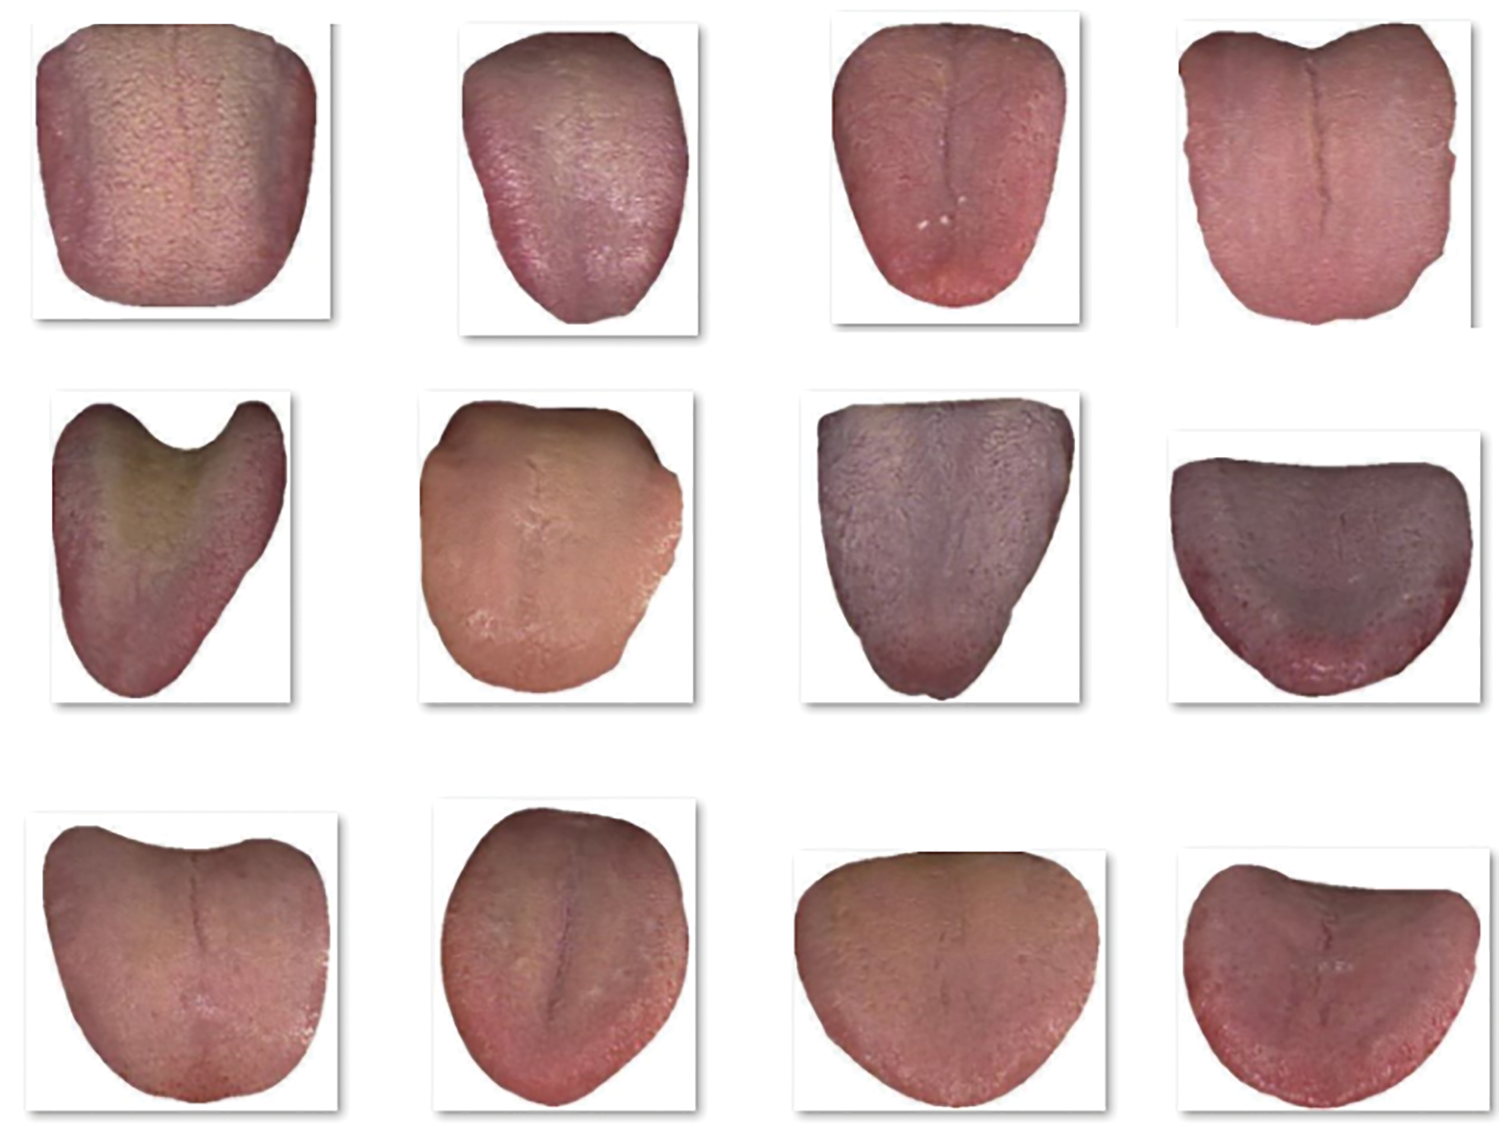
Figure 3: Sample images
Tab. 1 and Fig. 4 highlight the overall classification outcomes of the PODL-TCIA model on 70% of training phase. The obtained results indicated that the PODL-TCIA model has offered higher outcomes under all classes. For sample, under class 1, the PODL-TCIA model has provided

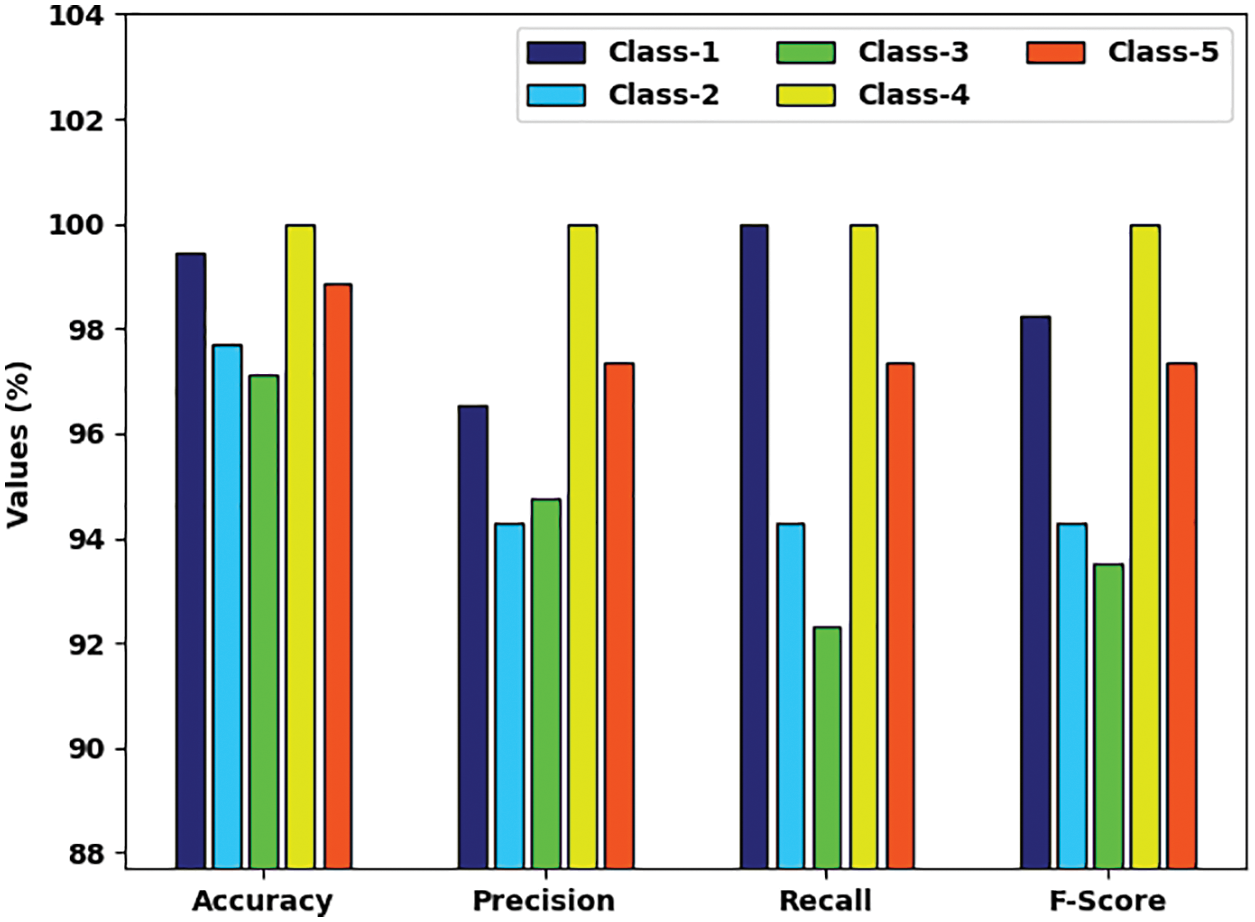
Figure 4: Result analysis of PODL-TCIA technique under 70% of training dataset
A detailed ROC investigation of the PODL-TCIA model on 70% of training dataset is portrayed in Fig. 5. The results indicated that the PODL-TCIA model has exhibited its ability in categorizing five different classes on 70% of training dataset.
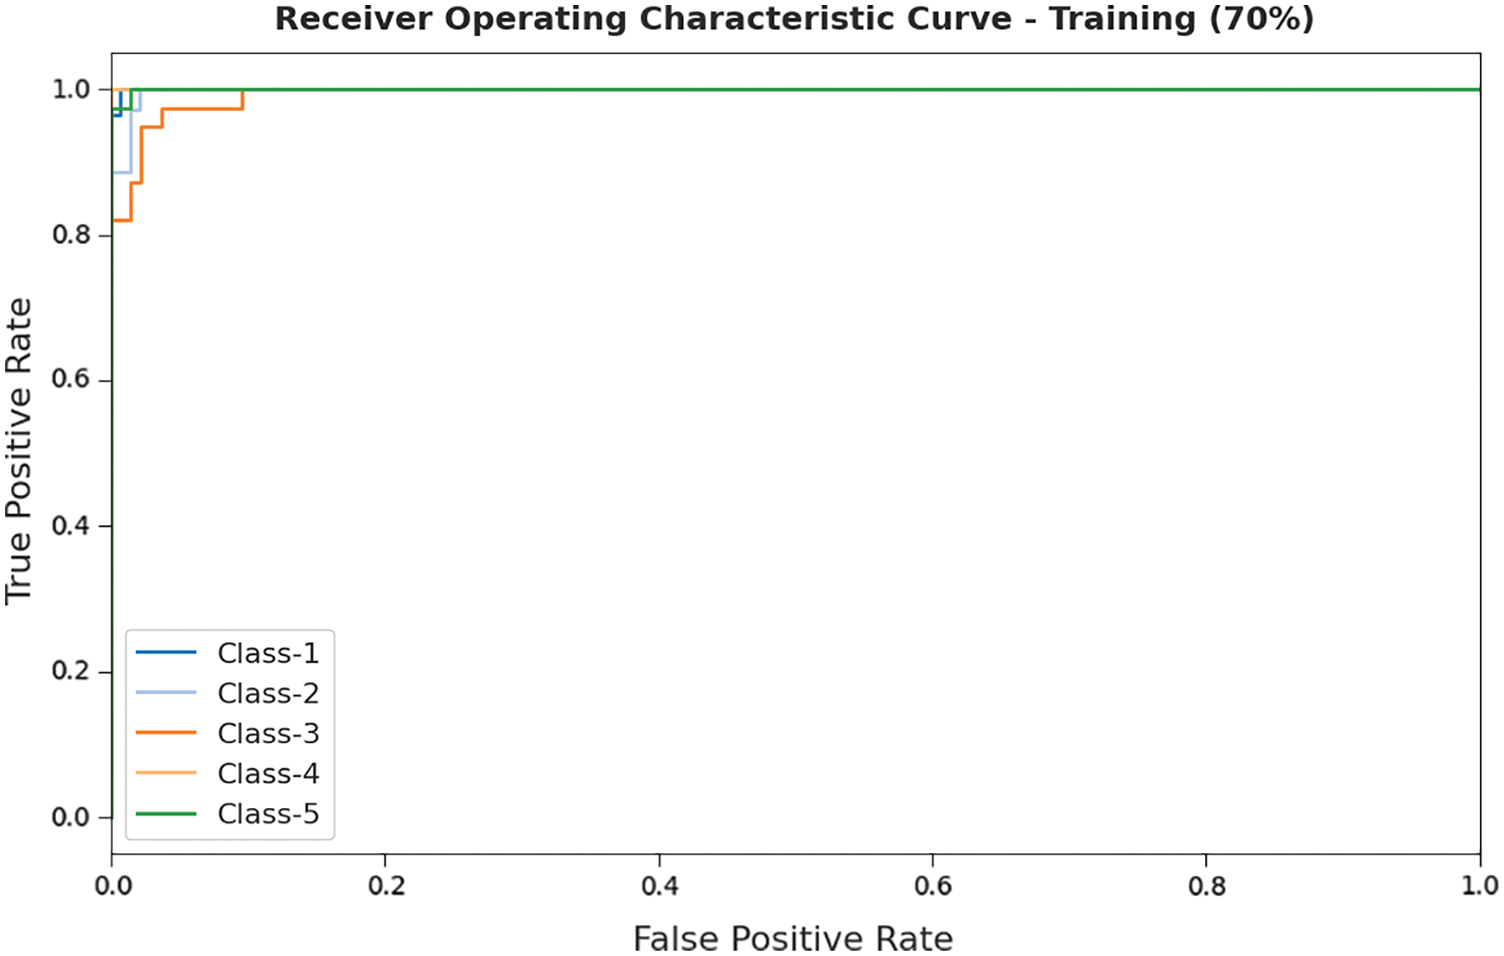
Figure 5: ROC analysis of PODL-TCIA technique under 70% of training dataset
Tab. 2 and Fig. 6 highlights the overall classification outcomes of the PODL-TCIA technique on 30% of testing phase. The obtained results indicated that the PODL-TCIA methodology has offered higher outcomes under all classes. For sample, under class 1, the PODL-TCIA model has provided

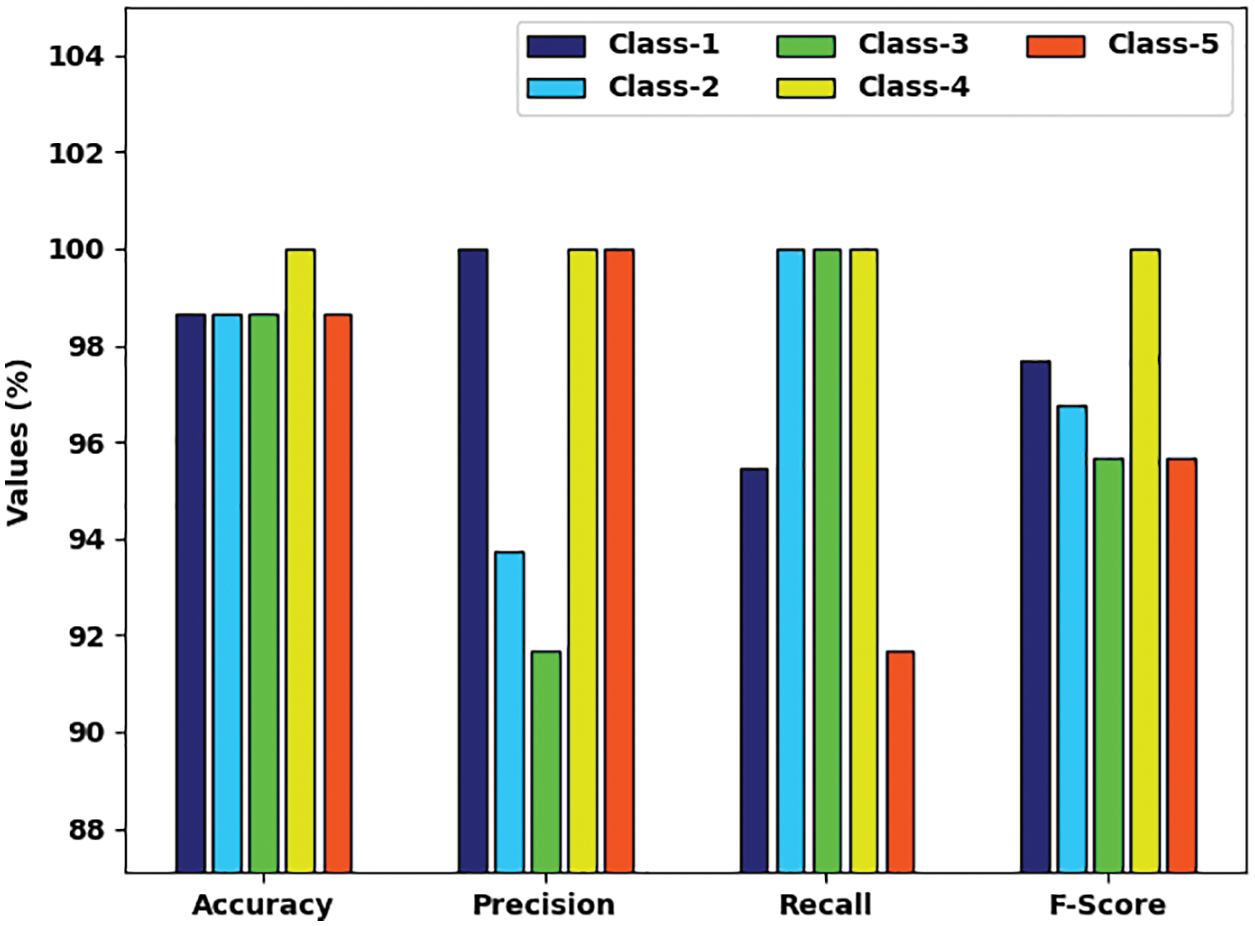
Figure 6: Result analysis of PODL-TCIA technique under 30% of testing dataset
A comprehensive Receiver operating characteristic (ROC) investigation of the PODL-TCIA model on 30% of testing dataset is portrayed in Fig. 7. The results designated that the PODL-TCIA model has exhibited its ability in categorizing five distinct classes on 30% of testing dataset.
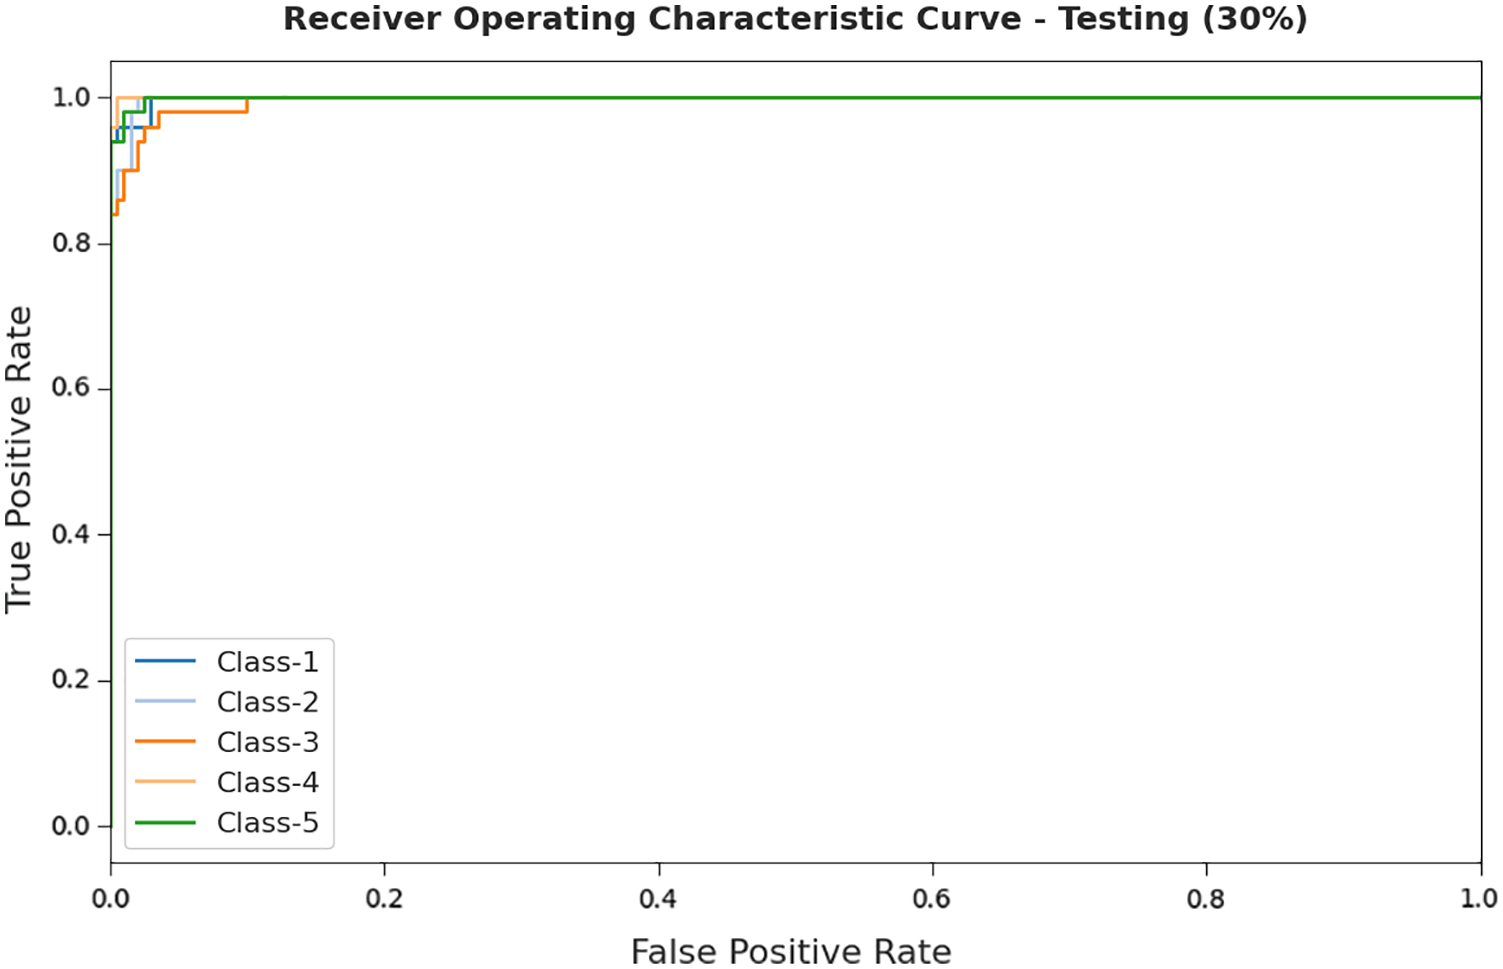
Figure 7: ROC analysis of PODL-TCIA technique under 30% of testing dataset
Fig. 8 showcases the training and validation accuracy inspection of the PODL-TCIA approach on applied dataset. The figure conveyed that the PODL-TCIA technique has offered maximal training/validation accuracy on classification process.
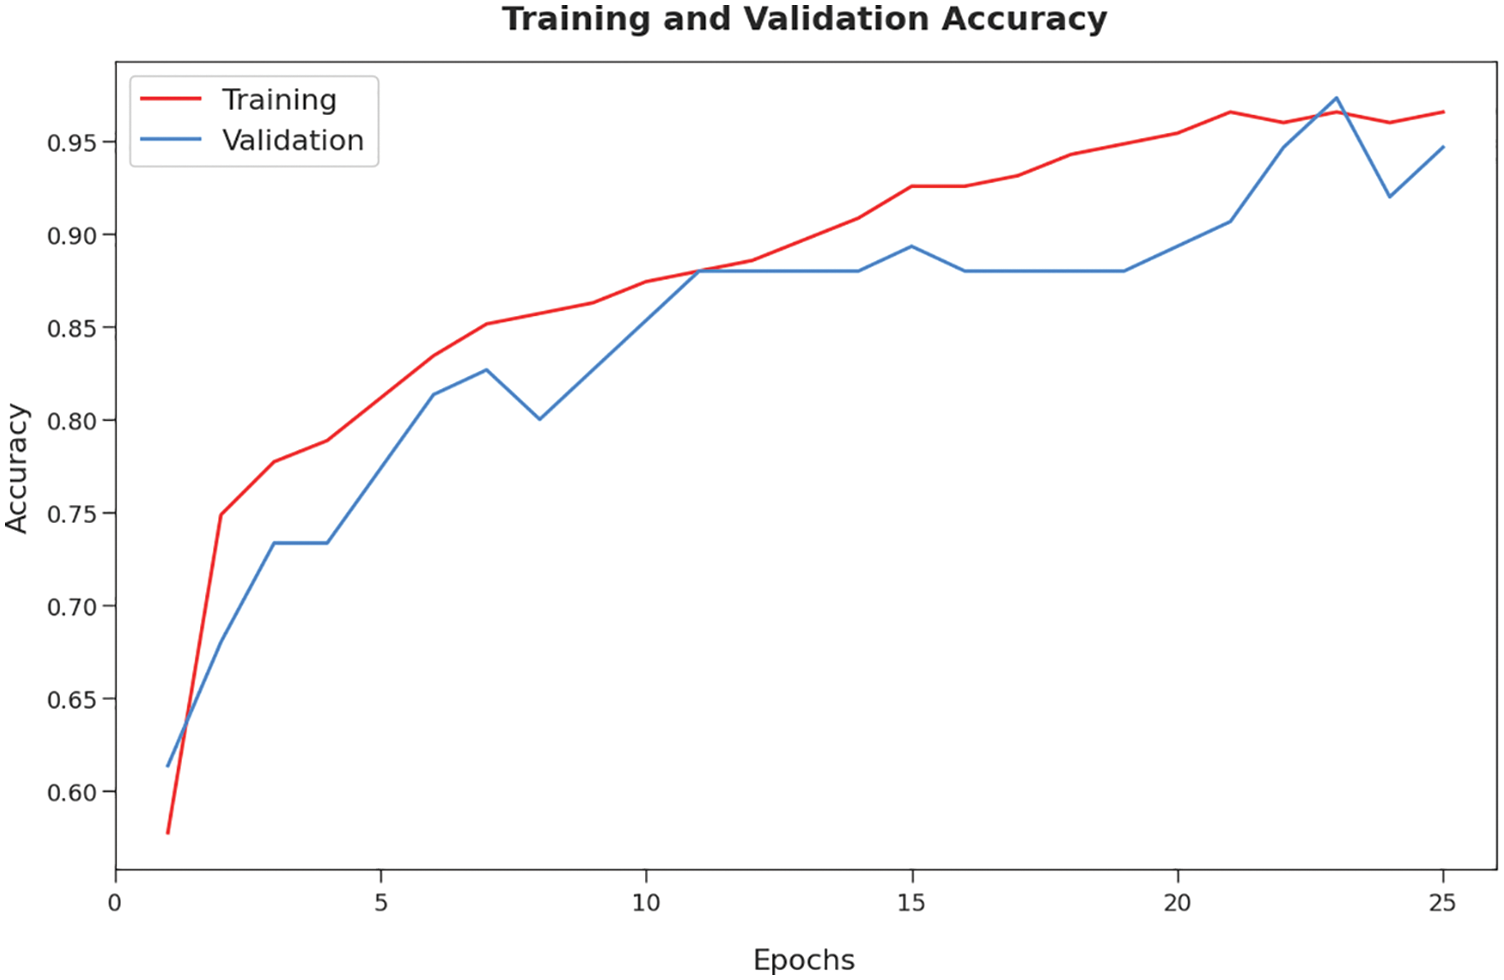
Figure 8: Accuracy graph analysis of PODL-TCIA technique
Next, Fig. 9 demonstrates the training and validation loss inspection of the PODL-TCIA model on applied dataset. The figure reported that the PODL-TCIA method has offered reduced training/accuracy loss on the classification process of test data.
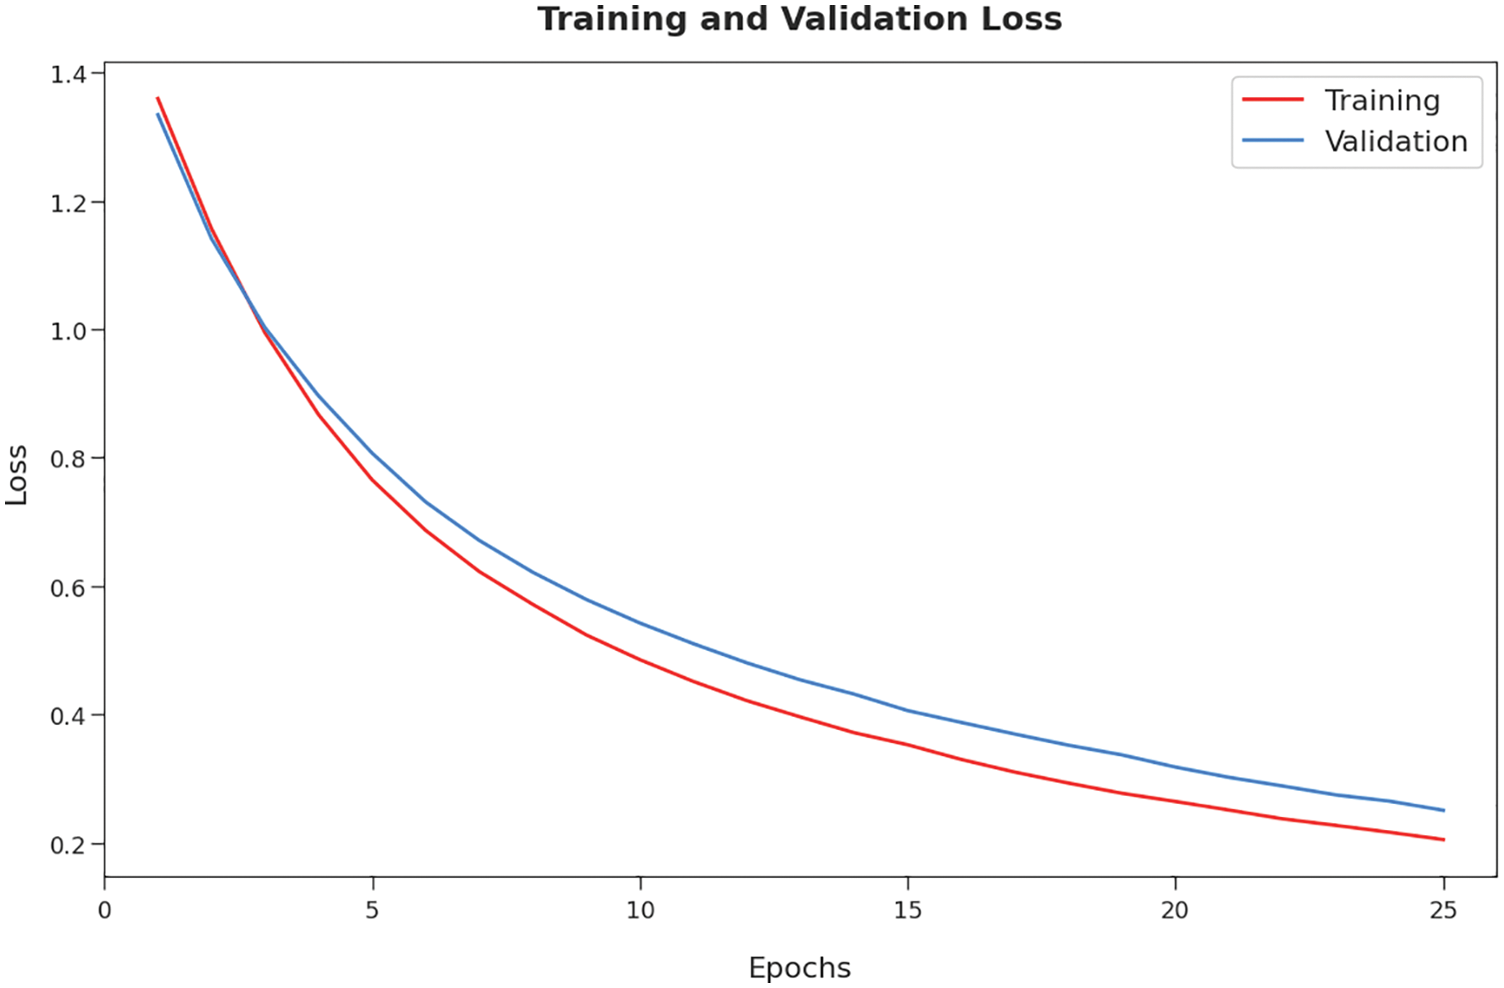
Figure 9: Loss graph analysis of PODL-TCIA technique
A comparative study of the PODL-TCIA model with other models is made in Tab. 3.

Fig. 10 showcases a brief
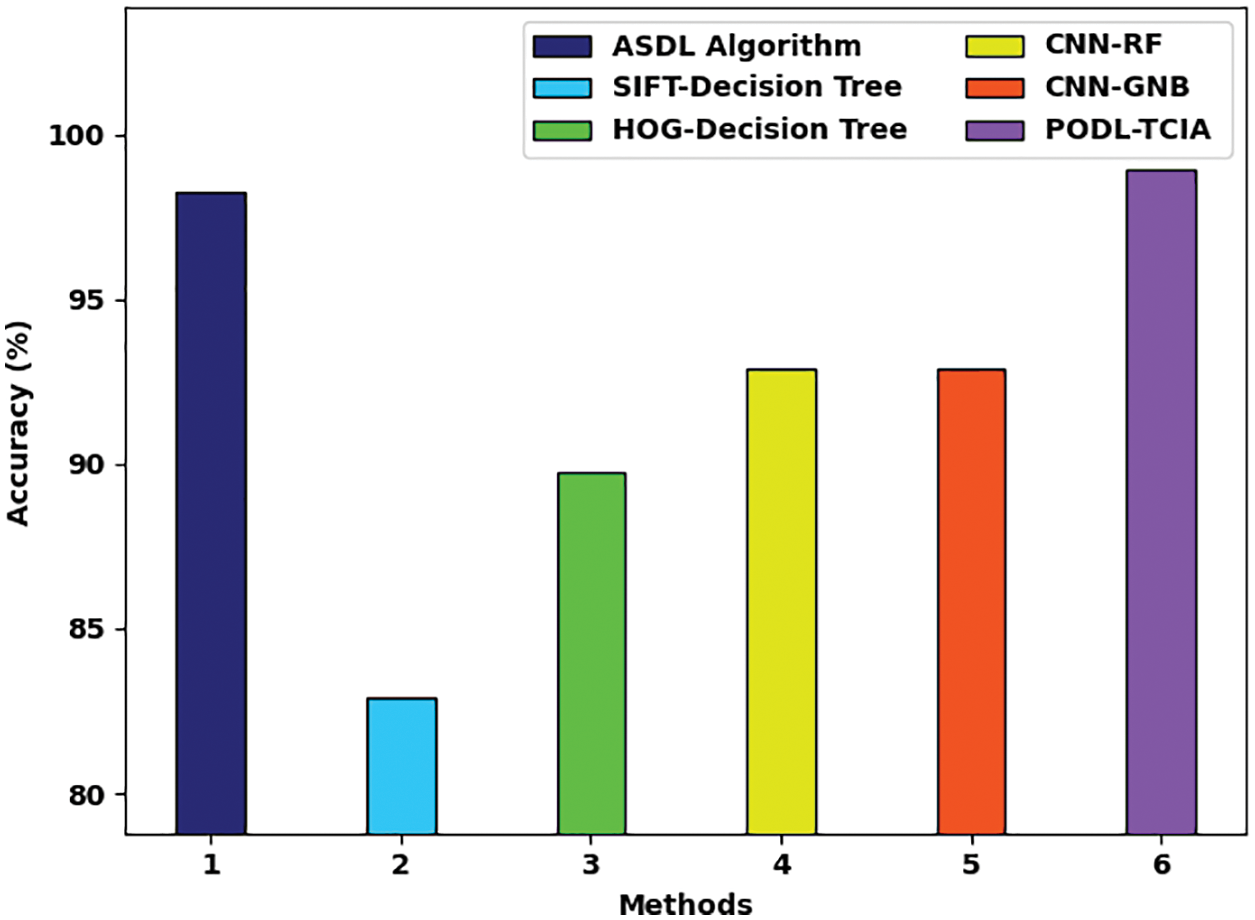
Figure 10:
Fig. 11 demonstrates a brief
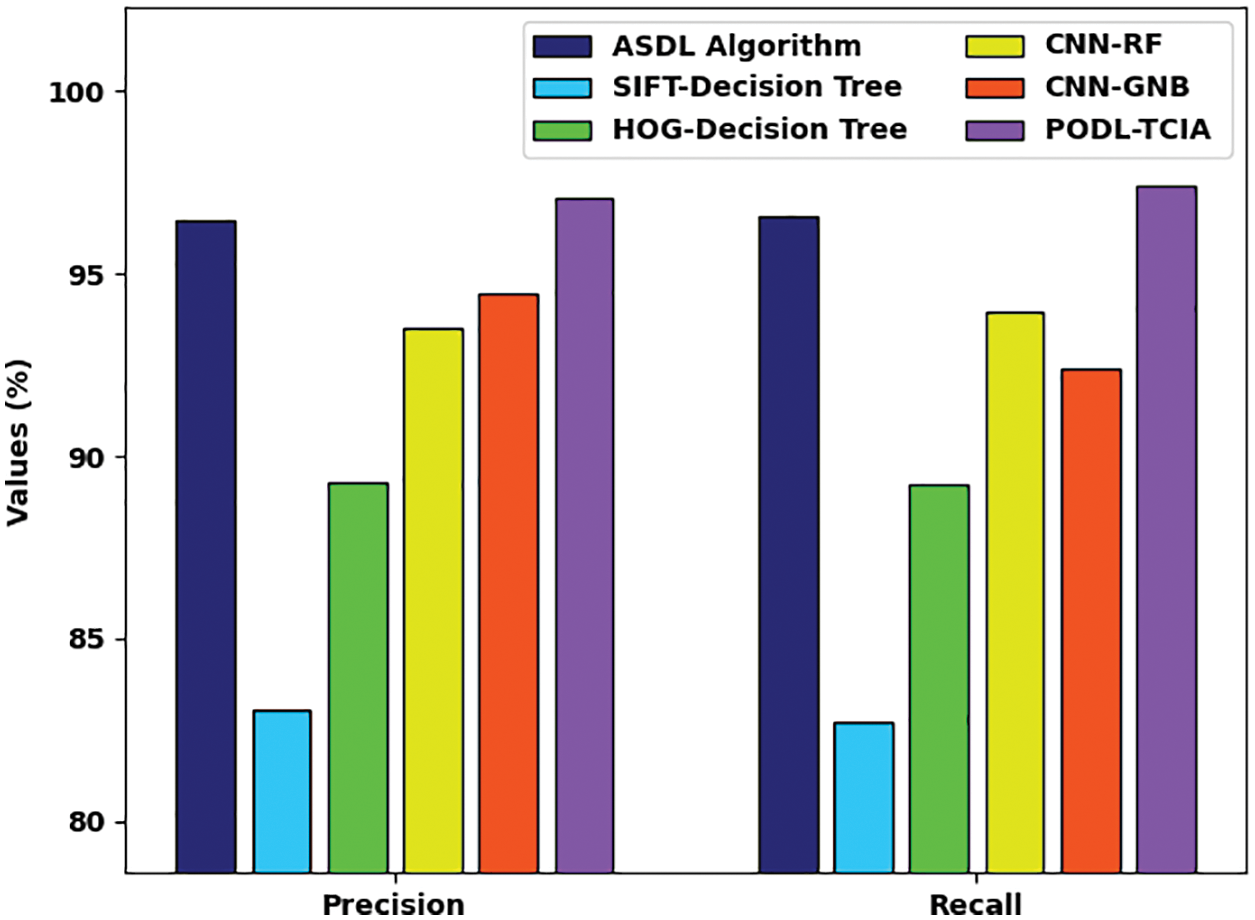
Figure 11:
Fig. 12 illustrates a brief
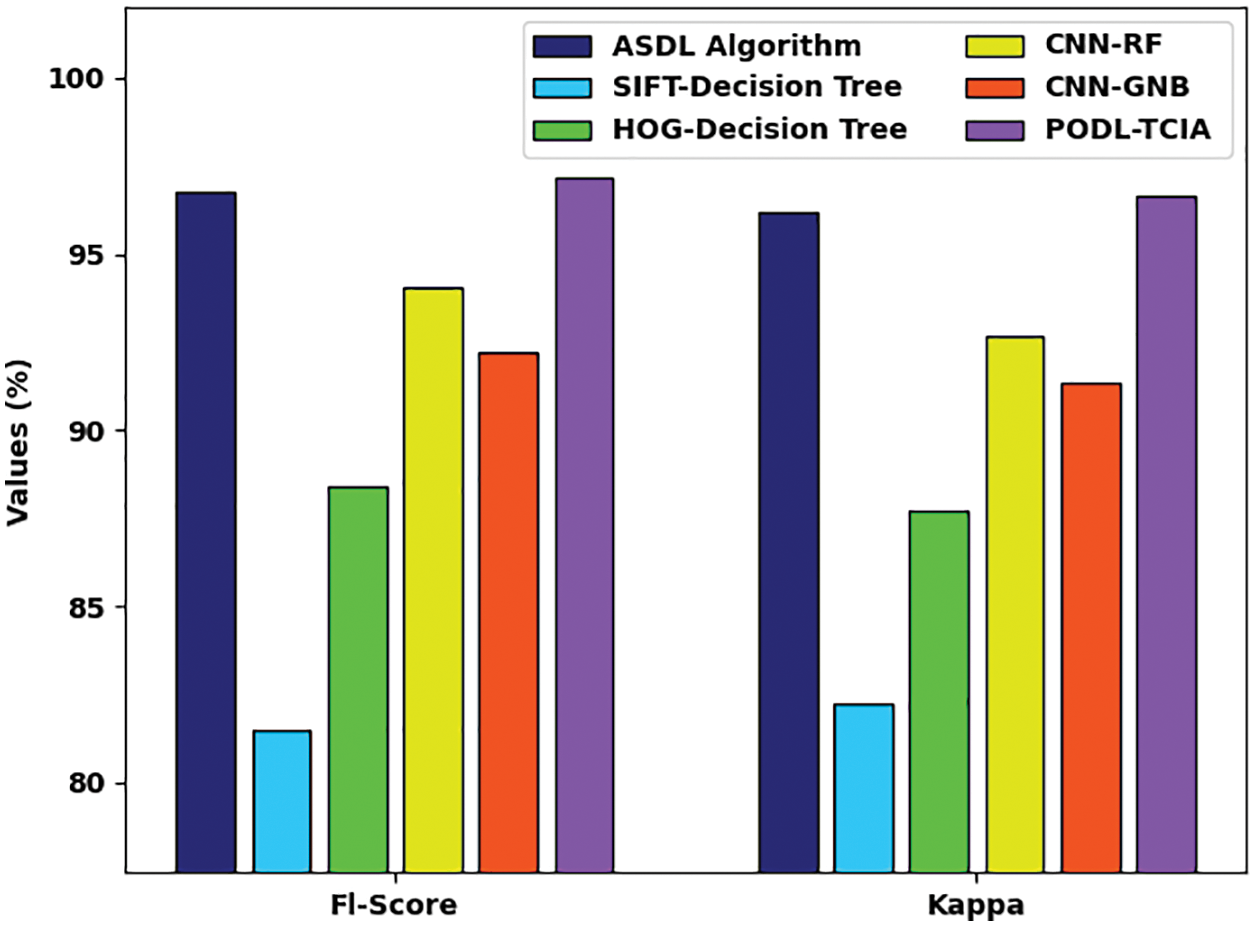
Figure 12:
After noticing the detailed results, it is verified that the PODL-TCIA model is appropriate for tongue color image analysis.
In this study, a novel PODL-TCIA model was established for the investigation of tongue color images. The presented PODL-TCIA model performed image pre-processing to improvise the quality of the medical images. Besides, the Inception with ResNet-v2 model is employed for feature extraction. Moreover, the PO with TSVM model is exploited for image classification process. The design of PO algorithm assists in the optimal parameter selection of the TSVM model. For ensuring the enhanced outcomes of the PODL-TCIA model, a wide-ranging experimental analysis is performed and the outcomes reported the betterment of the PODL-TCIA model over the recent approaches. Therefore, the PODL-TCIA model has been developed as an appropriate tool for tongue color image analysis. In future, hybrid DL models can be employed for improved results.
Funding Statement: The authors extend their appreciation to the Deanship of Scientific Research at King Khalid University for funding this work under grant number (RGP 2/158/43). Princess Nourah bint Abdulrahman University Researchers Supporting Project number (PNURSP2022R161), Princess Nourah bint Abdulrahman University, Riyadh, Saudi Arabia. The authors would like to thank the Deanship of Scientific Research at Umm Al-Qura University for supporting this work by Grant Code: (22UQU4340237DSR11).
Conflicts of Interest: The authors declare that they have no conflicts of interest to report regarding the present study.
References
1. J. Li, Q. Chen, X. Hu, P. Yuan, L. Cui et al., “Establishment of noninvasive diabetes risk prediction model based on tongue features and machine learning techniques,” International Journal of Medical Informatics, vol. 149, no. 1, pp. 104429, 2021. [Google Scholar]
2. X. Huang, L. Zhuo, H. Zhang, X. Li and J. Zhang, “Lw-TISNet: Light-weight convolutional neural network incorporating attention mechanism and multiple supervision strategy for tongue image segmentation,” Sensing and Imaging, vol. 23, no. 1, pp. 6, 2022. [Google Scholar]
3. M. Y. Li, D. J. Zhu, W. Xu, Y. J. Lin, K. L. Yung et al., “Application of U-Net with global convolution network module in computer-aided tongue diagnosis,” Journal of Healthcare Engineering, vol. 2021, no. 2, pp. 1–15, 2021. [Google Scholar]
4. X. R. Zhang, J. Zhou, W. Sun and S. K. Jha, “A lightweight CNN based on transfer learning for COVID-19 diagnosis,” Computers, Materials & Continua, vol. 72, no. 1, pp. 1123–1137, 2022. [Google Scholar]
5. F. Bi, X. Ma, W. Chen, W. Fang, H. Chen et al., “Review on video object tracking based on deep learning,” Journal of New Media, vol. 1, no. 2, pp. 63–74, 2019. [Google Scholar]
6. J. Li, X. Hu, L. Tu, L. Cui, T. Jiang et al., “Diabetes tongue image classification using machine learning and deep learning,” SSRN Journal, 2021. http://dx.doi.org/10.2139/ssrn.3944579. [Google Scholar]
7. A. Sage, Z. Miodońska, M. Kręcichwost, J. Trzaskalik, E. Kwaśniok et al., “Deep learning approach to automated segmentation of tongue in camera images for computer-aided speech diagnosis,” in Information Technology in Biomedicine, Advances in Intelligent Systems and Computing Book Series. Vol. 1186. Cham: Springer, pp. 41–51, 2021. [Google Scholar]
8. N. Guangyu, W. Caiqun, Y. Bo and P. Yong, “Tongue color classification based on convolutional neural network,” in Future of Information and Communication Conf., Advances in Intelligent Systems and Computing Book Series. Vol. 1364. Cham: Springer, pp. 649–662, 2021. [Google Scholar]
9. E. Gholami, S. K. Tabbakh and M. Kheirabadi, “Increasing the accuracy in the diagnosis of stomach cancer based on color and lint features of tongue,” Biomedical Signal Processing and Control, vol. 69, no. 1, pp. 102782, 2021. [Google Scholar]
10. Y. Tang, Y. Sun, J. Y. Chiang and X. Li, “Research on multiple-instance learning for tongue coating classification,” IEEE Access, vol. 9, pp. 66361–66370, 2021. [Google Scholar]
11. R. F. Mansour, M. M. Althobaiti and A. A. Ashour, “Internet of things and synergic deep learning based biomedical tongue color image analysis for disease diagnosis and classification,” IEEE Access, vol. 9, pp. 94769–94779, 2021. [Google Scholar]
12. T. Jiang, X. Guo, L. Tu, Z. Lu, J. Cui et al., “Application of computer tongue image analysis technology in the diagnosis of NAFLD,” Computers in Biology and Medicine, vol. 135, no. 1, pp. 104622, 2021. [Google Scholar]
13. B. Yan, S. Zhang, H. Su and H. Zheng, “TCCGAN: A stacked generative adversarial network for clinical tongue images color correction,” in 2021 5th Int. Conf. on Digital Signal Processing, Chengdu China, pp. 34–39, 2021. [Google Scholar]
14. S. Deepa and A. Banerjee, “Intelligent decision support model using tongue image features for healthcare monitoring of diabetes diagnosis and classification,” Network Modeling Analysis in Health Informatics and Bioinformatics, vol. 10, no. 1, pp. 1–16, 2021. [Google Scholar]
15. Y. Hu, G. We, M. Luo, P. Yang, D. Dai et al., “Fully-channel regional attention network for disease-location recognition with tongue images,” Artificial Intelligence in Medicine, vol. 118, pp. 102110, 2021. [Google Scholar]
16. J. Wang, X. He, S. Faming, G. Lu, H. Cong et al., “A real-time bridge crack detection method based on an improved inception-resnet-v2 structure,” IEEE Access, vol. 9, pp. 93209–93223, 2021. [Google Scholar]
17. Q. Askari, I. Younas and M. Saeed, “Political optimizer: A novel socio-inspired meta-heuristic for global optimization,” Knowledge-Based Systems, vol. 195, no. 5, pp. 105709, 2020. [Google Scholar]
18. Z. Qi, Y. Tian and Y. Shi, “Robust twin support vector machine for pattern classification,” Pattern Recognition, vol. 46, no. 1, pp. 305–316, 2013. [Google Scholar]
19. R. F. Mansour, M. M. Althobaiti and A. A. Ashour, “Internet of things and synergic deep learning based biomedical tongue color image analysis for disease diagnosis and classification,” IEEE Access, vol. 9, pp. 94769–94779, 2021. [Google Scholar]
Cite This Article
 Copyright © 2023 The Author(s). Published by Tech Science Press.
This work is licensed under a Creative Commons Attribution 4.0 International License , which permits unrestricted use, distribution, and reproduction in any medium, provided the original work is properly cited.


 Submit a Paper
 Propose a Special lssue
 View Full Text
 Download PDF
 Downloads
 Citation Tools