
 Submit a Paper
 Propose a Special lssue
 Open Access
ARTICLE

Improved Model for Genetic Algorithm-Based Accurate Lung Cancer Segmentation and Classification
1 Department of Electronics and Communication Engineering, SNS College of Engineering, Coimbatore, Tamilnadu, India
2 Department of Electronics and Communication Engineering, Karpagam College of Engineering, Coimbatore, Tamilnadu, India
* Corresponding Author: K. Jagadeesh. Email:
Computer Systems Science and Engineering 2023, 45(2), 2017-2032. https://doi.org/10.32604/csse.2023.029169
Received 26 February 2022; Accepted 13 June 2022; Issue published 03 November 2022
 View Full Text
 Download PDF
Abstract
Lung Cancer is one of the hazardous diseases that have to be detected in earlier stages for providing better treatment and clinical support to patients. For lung cancer diagnosis, the computed tomography (CT) scan images are to be processed with image processing techniques and effective classification process is required for appropriate cancer diagnosis. In present scenario of medical data processing, the cancer detection process is very time consuming and exactitude. For that, this paper develops an improved model for lung cancer segmentation and classification using genetic algorithm. In the model, the input CT images are pre-processed with the filters called adaptive median filter and average filter. The filtered images are enhanced with histogram equalization and the ROI(Regions of Interest) cancer tissues are segmented using Guaranteed Convergence Particle Swarm Optimization technique. For classification of images, Probabilistic Neural Networks (PNN) based classification is used. The experimentation is carried out by simulating the model in MATLAB, with the input CT lung images LIDC-IDRI (Lung Image Database Consortium-Image Database Resource Initiative) benchmark Dataset. The results ensure that the proposed model outperforms existing methods with accurate classification results with minimal processing time.Keywords
In present scenario of world health, lung tumor has become the second largest death threatening disease next to Heart Attacks, as this type of tumor cause more death rate than other types of cancer [1]. Typically, Lung cancer can be defined as the uncontrolled tissue growth that makes to form lung nodules. It is reported that earlier disease detection can effectively reduce the death rate globally, by treating them on time. When the tumor detection is done in earlier stages, the survival rate of the patients can be raised from 50% to 70%.
The lung cancer can be majorly categorized into two as, Non-Small Cell Lung Cancer and Small Cell Lung Cancer based on the cell features. Among those, the Non-small cell Lung Cancer is the most common type of lung cancer, whereas the other category of tumor is diagnosed less [2]. The major lung cancers categorized are further classified as Small Cell Lung Cancer is divided into two as, limited and extensive. And, the categories of Non-Small Cell Lung Cancer are based on Tumor location (T), presence of lymph Node (N) and the Metastases (M) system that denotes the spreading rate of tumor throughout the human body. The Based on the spreading of lung tumor features, it is categorized into four stages that are given below [3].
• Grade I-the tumor cells are confined to the lung
• Grade II-the cancer cells are spreading to the chest area
• Grade III-the cancer with large and persistent tumor cells that are confined to the chest area
• Grade IV-the tumor cells are started spreading to other body parts.
There are several techniques are used to detect tumor from lung images such as, Sputum Cytoogy, MRI (Magnetic Resonance Imaging) images, X-ray images and Computed Tomography (CT) [4]. In this proposed model, CT lung images are taken as input and processed for cancer diagnosis, since, those images are more reliable for detecting the lung cancer nodules in accurate manner [5].
The proposed work for detecting Lung Cancer using Genetic Algorithm utilized CT lung image inputs from LIDC-IDRI dataset that comprises large amount of cancerous and non-cancerous images for training and testing. The contributions of the proposed model for Accurate Lung Cancer Segmentation and Classification are listed below.
i) The input CT images are pre-processed using two efficient filters such as Median and Average Filter.
ii) For image enhancement, histogram equalization is processed.
iii) Genetic Algorithm is effectively applied here for segmenting Region of Interest of cancer cells.
iv) Specifically, the proposed model uses Guaranteed Convergence Particle Swarm Optimization for cancer tissue segmentation.
v) The final identification of cancerous and non-cancerous images is performed with Probabilistic Neural Networks (PNN) based classification, which can produce accurate results in binary classification.
vi) Performance evaluation of the proposed model is derived with evaluation factors such as accuracy, precision and recall.
vii) Comparative analysis is carried out for evidencing the work efficiency when compared with existing model in Lung cancer segmentation and classification.
The remaining part of this paper is framed as follows: Section 2 deliberates the existing models in Lung Tumor Detection and also the methods used genetic algorithms in different manner for tumor diagnosis. The work procedure of the proposed model in cancer diagnosis is described in Section 3. Section 4 contains the results obtained with the evaluation factors with proposed model and discussions of comparative evaluations. Finally, conclusion and points for future enhancement is given in Section 5.
There are myriad works have been developed in recent years for cancer detection. The method proposed by the authors in [6] developed CAD ( Computer Aided Design) scanner for lung cancer detection. For extracting the ROI, the model used circular filter. The model was cost effective in cancer diagnosis, but the accuracy rate of detection was not to the satisfactory level. In [7], K-Means Clustering (KMC) has been used for segmentation. Further, feature extraction was carried out with Gray-Level Co-Occurrence Matrix (GLCM). For image classification, the work utilized Back Propagation Neural Networks (BPNN). In the work provided in [8] used active contouring technique and fuzzy interference model for cancer nodule detection. In a different manner, Watershed Segmentation was performed for tumor segmentation in [9]. For image quality improvement, Gabor Filter has been used. Still, the accuracy rate of this model in cancer detection could be enhanced.
For classifying the images under benign and malignant classes, the work in [10] used Housefiled Unit (HU) based ROI segmentation along with Prior information. Moreover, in [11], fuzzy rules based model has been combined in cancer detection process for deriving a model called Genetic Algorithm based Template Matching (GATM). The model effectively used for detecting the lung cancer tissues from the input CT image and the inducement of genetic algorithm helped in defining the fast template matching. Three-Tier model for lung tumor diagnosis and processing was presented in [12]. The first tier comprised binarization for exact region segmentation, image labelling, image shrinking and extension. The second tier used Ground Glass Opacity for deriving mean and variance rates. The final tier used linear discriminant function for feature extraction.
In [13], two-level ANN (Artificial Neural Network) model has been derived, in which the first level involve in detecting the suspicious regions of input images in low resolution. And, in second level, the curve peak rates of the suspicious regions were derived and given for training in Artificial Neural Network. A conventional method of tumor identification and segmentation process has been presented in [14] that used morphological operations, and thresholding methods for segmentation. Further, in [15], Shape based Computed Aided Diagnosis has been presented that used fuzzy threshold technique for region segmentation. In the work, index mapping has been processed with Gaussian and mean curvature derivation and hessian matrix has been used for dot mapping. Automated Region Growing technique was provided in [16] for nodule segmentation and SVM (Support Vector Machine) based classification has been performed for disease diagnosis. The accuracy levels of diagnosis results were not satisfactory.
Massive Training Artificial Neural Network (MTANN) has been developed and presented in [17] that provided solution for overlapping of cells on ribs. For separating the muscles and bones, dual-energy subtraction technique was used. The integration of GLCM and Self Organizing Maps (SOM) for cancer segmentation was done in [18]. ANN based classification has been processed for identifying benign and malignant images. The paper work presented in [19] provided a comparative analysis between KMC, Fuzzy C-Means Clustering (FCM) and Gustafson-Kessel (GK). It was provided in the results that KMC provided better results than other compared works. An alternative model for lung tumor detection from CT lung images was presented in [20]. Further, an effective literature survey has been presented in [21] about the effectiveness of evolutionary algorithms in tumor image segmentation and lung tumor diagnosis.
In the process of medical image processing in lung tumor diagnosis, the classification accuracy is very much important, for saving people lives. Hence, this paper develops Genetic Algorithm based Accurate Lung Cancer Segmentation and Classification called Image Model- Lung Cancer Segmentation and Classification (IM-LCSC), which comprises the following phases to be processed for accurate cancer detection from CT lung images.
1. Image Pre-Processing
2. CT Image Enhancement
3. Cancer Segmentation using Guaranteed Convergence Particle Swarm Optimization (GCPSO)
4. Classification using Probabilistic Neural Networks (PNN)
5. Analysis Metrics for Performance Evaluation
Here, the first phase of work involves in performing pre-processing of input CT images, from which the noise content is effectively removed using filters. The quality of noiseless images is further improved by image enhancement. Furthermore, the segmentation is employed using Guaranteed Convergence Particle Swarm Optimization technique for separating the cancer tissue from the input CT image. GC-PSO is incorporated here to enhance the segmentation accuracy. Finally, the segmented images are given for SVM training for classifying the images under two classes CANCEROUS and NON-CANCEROUS. The operations of the proposed IM-LCSC are depicted in Fig. 1.
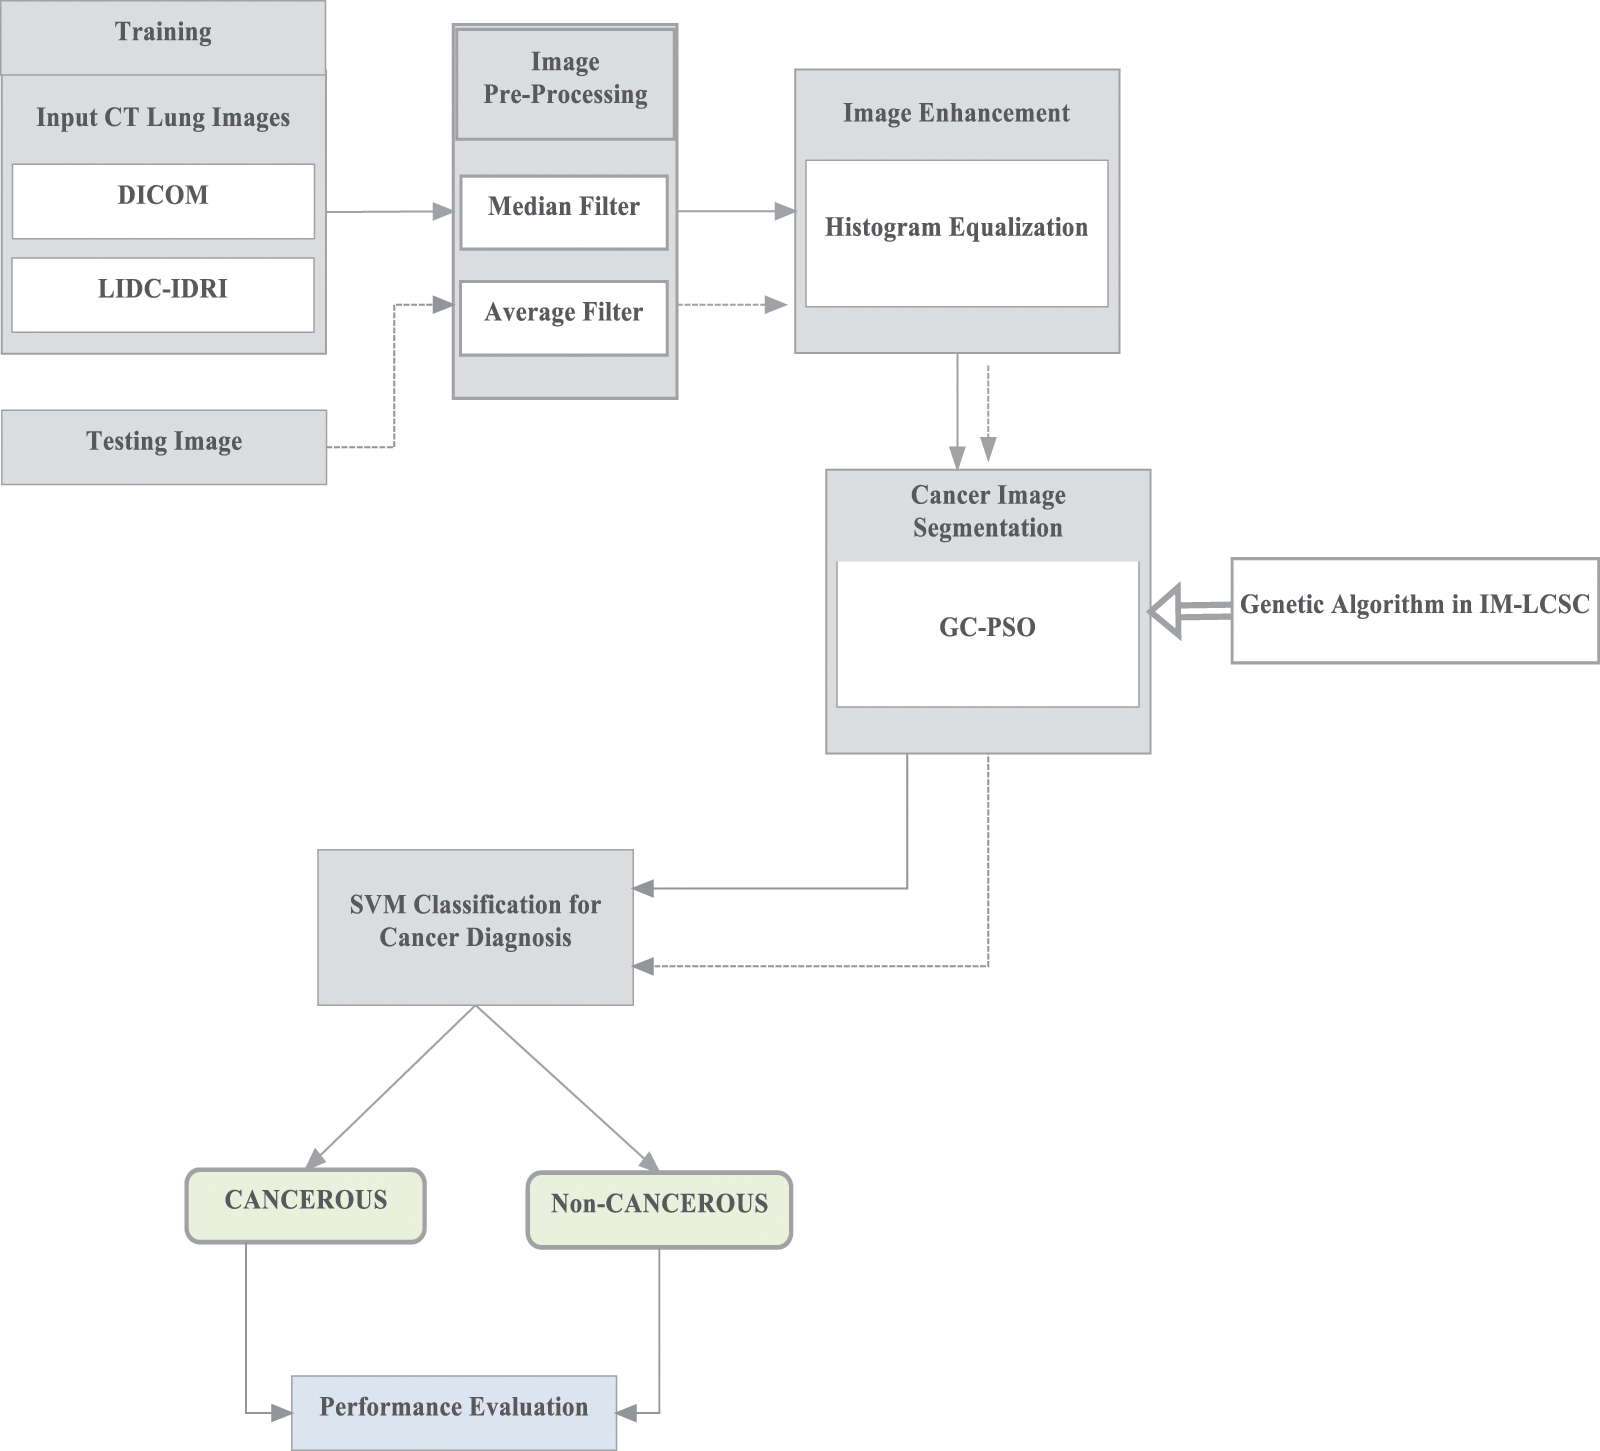
Figure 1: Operations in IM-LCSC
As mentioned in the Fig. 1 for training, images from lung image benchmark dataset, namely, Lung Image Database Consortium and Image Database Resource Initiative (LIDC-IDRI) dataset [22].
From the input CT image, extra noise is removed using two filters in this section such as median filter and average filter. In that, the median filter involves in noise removal and holds the sharpness of the image. Each pixel in the input image is replaced with a median value of their corresponding pixels nearer. Here, the filter uses 3 × 3 window matrix ‘M’ that has ‘X’ rows and ‘Y’ columns. A new matrix is constructed by appending zeros on two sides as ‘X+2’ and ‘Y+2’ and mask is generated with size 3 × 3. The mask is placed at the first element of matrix ‘M’ and the elements pointed by the mask are selected for sorting in ascending order [23,24]. The center element value is computed from the sorted list and then, replacing that in M(1, 1). Following, the mask is moving to the next element of the matrix ‘M’. The center element replacement process is continues until all the elements in the matrix are replaced with their corresponding median rates called center element value [24–29].
The next process is using average filter for eliminating the spatial noise, which are caused during the data obtaining process of input CT image. The average value of neighbourhood of each pixel is determined and replaced with their corresponding average rates. In this, for matrix ‘M’, after sorting the elements in ascending order, the average or the mean value for all pixels is measured and replaced. The process is repeated for all elements to provide noiseless image to the image enhancement process.
Image enhancement is used to enhance the digital image quality thereby improving the classification accuracy. For that, the proposed model uses histogram equalization, through which, a small changes on the pixel intensities are performed. Moreover, each pixel in the input image is mapped to other neighbour pixel which is proportional to their corresponding ranks.
For histogram equalization, the histogram of the input digital image is computed and then, normalized with the probability distribution function. Normalization is determined by the rate of each pixel frequency to the total number of pixels presented in the lung image. This is mathematically equal to the image denotation matrix with X rows and Y columns. The transformation to modified histogram ensures that it is to be flat. The steps and the computations involved in the process are provided below.
• Compute the histogram of input CT image
• Cumulative Distributive Function (CDF) is calculated for determining the gray levels
• The gray levels are computed using,
• The gray levels are mapped to the image pixels
• Modified histogram is plotted using this.
The discrete gray scale image is considered as ‘{m}’ and ‘n_k’ is the number of frequencies of gray level ‘k’. The probability of pixel frequency is computed as,
where, ‘N’ is the total number of gray levels in the Lung image, ‘n’ is the total number of image pixels and ‘P_m (k)’ is the equivalent image histogram of pixel rate ‘k’ normalized with [0,1]. The cumulative distribution function with respect to P_m can be given as,
The new image transformation is to be generated, G = T(m), the new image is given as {G} as the flat histogram output. From that, the cdf for new image is given as,
where, ‘H’ is the constant factor. Further, the property of cumulative distribution function can process transform function, which is given as,
where, ‘r’ is in the range [0, N]. It can be noted that T maps the pixel level into the previously mention range [0,1], with the {m}. For obtaining the resultant histogram equalization, which is derived as,
3.3 Image Segmentation Using Guaranteed Convergence Particle Swarm Optimization (GCPSO)
Particle Swarm Optimization (PSO) is a meta-heuristic model that can be effectively used for image processing. The derivations can be made with the behaviour of birds that are on search for food. The basic idea behind PSO is data communication and information sharing. In the proposed model, each particle is assumed to have an initial velocity value and position. With respect the fitness rate, the rate of velocity and particle position is updated. The equations for position and velocity update of particles in PSO is given as follows,
where, ‘k_1 and k_2’ are the random numbers and ‘a_1 and a_2’ are the accelerate on co-efficient and the fitness function (FF) of PSO is derived as,
where ‘n’ is the total number of clusters. In the proposed model, GCPSO is used for image segmentation, which focuses on the particles with present best position in the space. In this process, the particle is swarm is considered as the particle member and the position and updating process of particle velocity is given as follows,
The search capability of the particles is carried out in the surface around the global best position. The diameter of the search space is given as ‘α(t)’ and ‘r’ is the random factor that ranges from 0 to 1. The search space diameter is updated with respect to the findings, as follows.
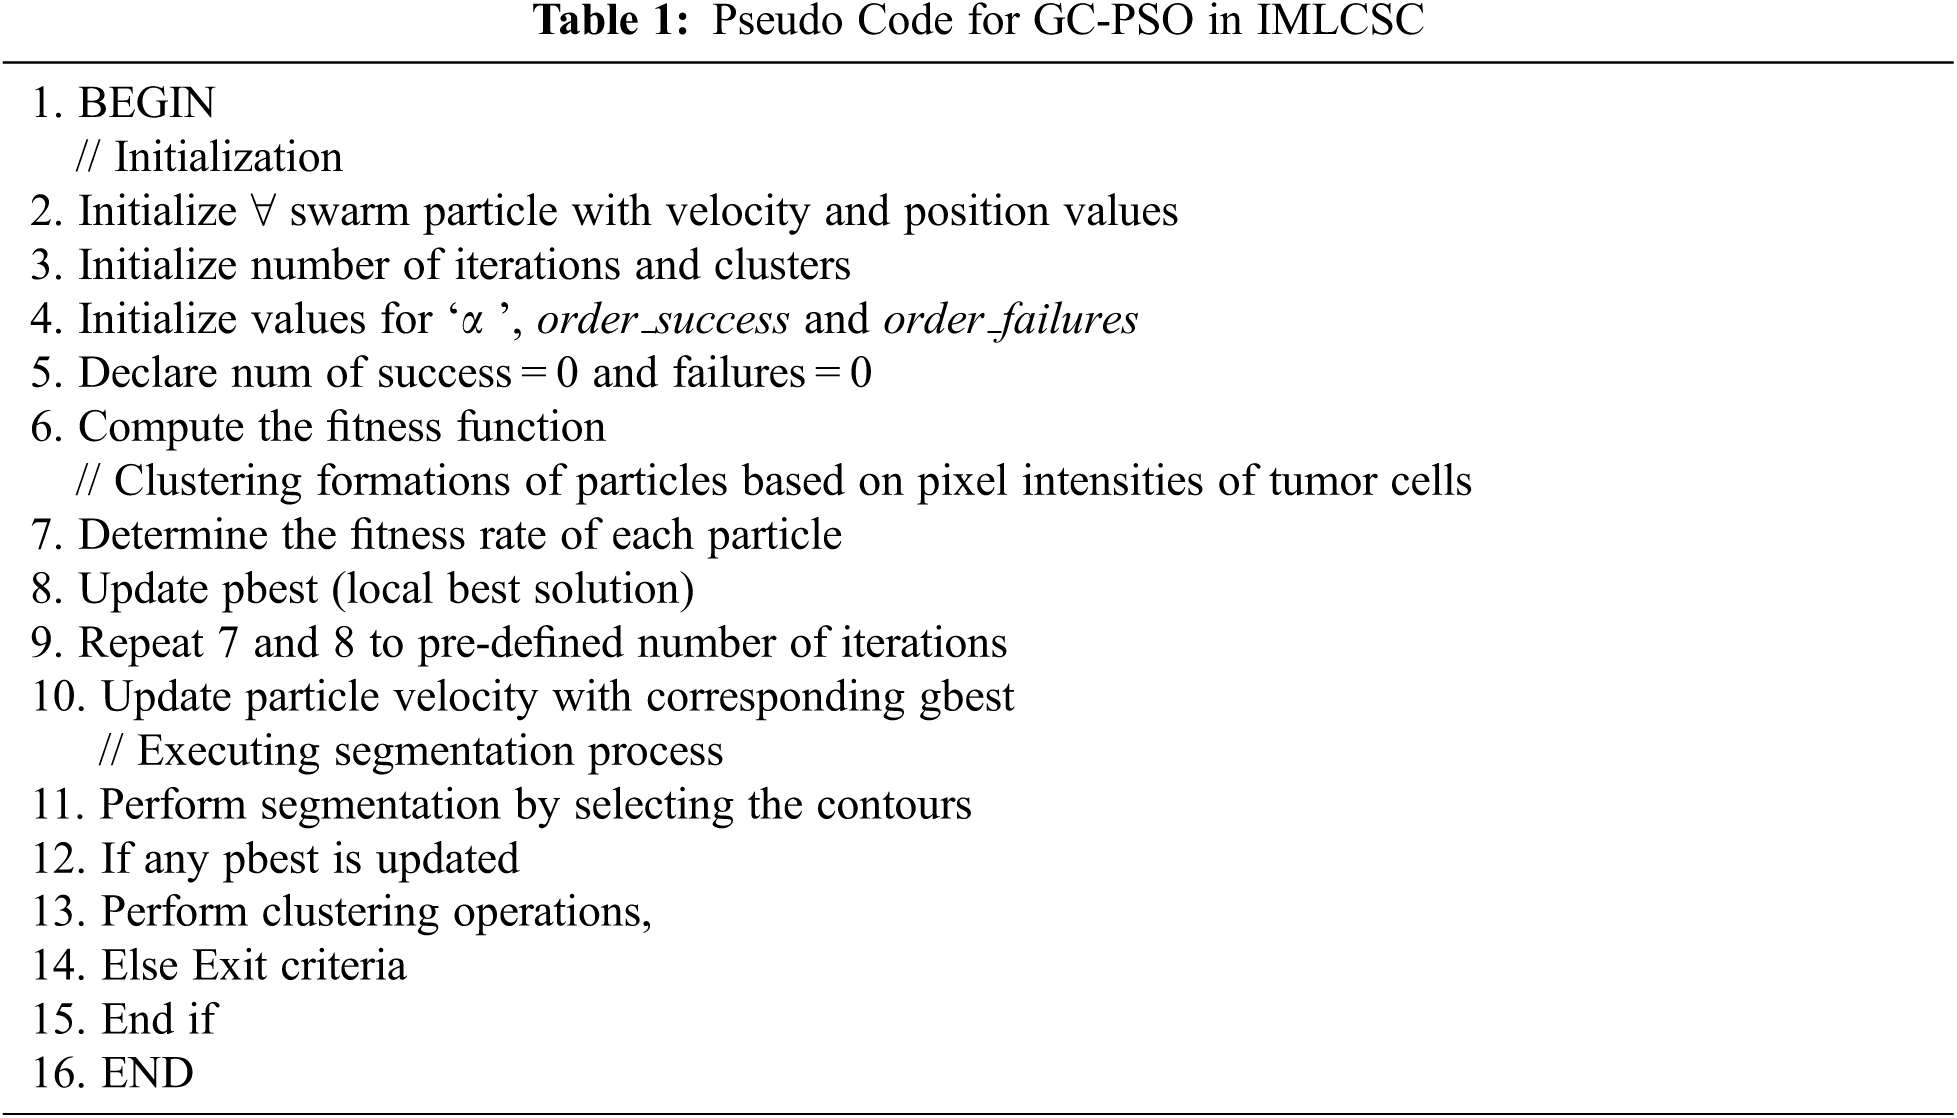
Here, the success and failure rates are determined with their corresponding consecutive success and failure orders. Moreover, order_success and order_failures are considered here as the threshold factors. The flow of working process of GCPSO is given in Fig. 2. It is complicated to acquire a better rate of threshold factor in minimal iterations in a high dimensional search area; hence, it can be taken as 15 and 5, respectively. With the obtained images LIDC-IDRI dataset, the kind of PSO based genetic algorithm provides higher rate of accuracy in finding the minimal space location with only minimal number of swarm particles. The segmentation of tumor cells is processed with the GC-PSO and the pseudo code is presented in Tab. 1.
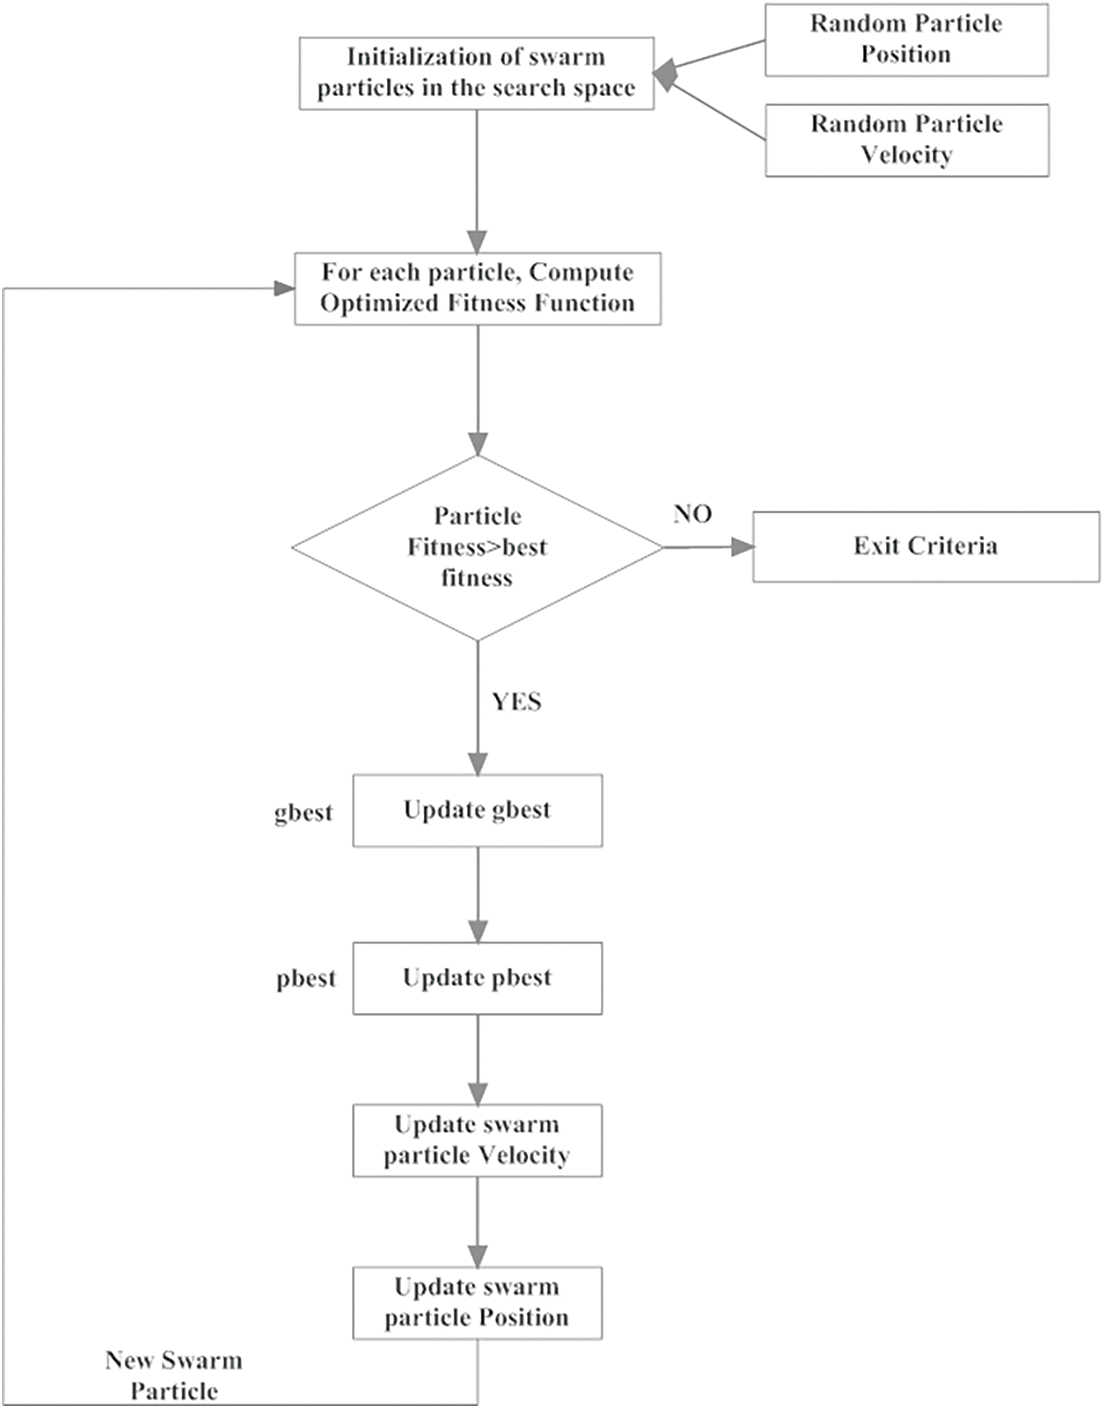
Figure 2: Implementation of GC-PSO in segmentation of lung cancer cells
3.4 Classification Using Probabilistic Neural Networks (PNN)
In the proposed IM-LCSC, Probabilistic Neural Network (PNN) is utilized for classifying CT lung images into classes, CANCEROUS and Non- CANCEROUS based on the segmentation done by GC-PSO. The advantage of using PNN with this is, the training process has less complexity. The structure of PNN is presented in Fig. 3. The first layer in the structure is the input layer, comprised of neurons that are transmitted to the hidden layer, which is presented next to it for processing. In that layer, the input neurons are divided into ‘C’ clusters and the probability density function of each cluster ‘c’ is computed. The patter that is obtained from the above layer is given to the summation layer that performs addition of derived density functions (pdf) of all clusters. The final layer is responsible for providing the classification results. The formula for deriving probability density function for a segmentation vector ‘S’ for a definite cluster ‘c’, 1 ≤ c ≤ C is given as,
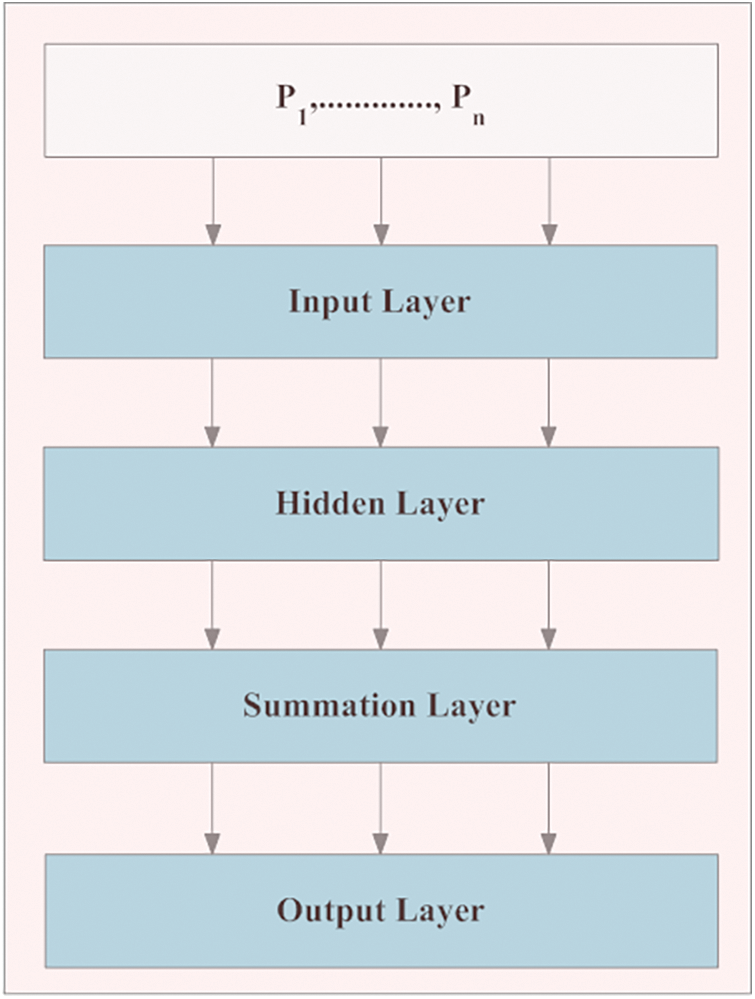
Figure 3: Structure of PNN in classification
where, ‘P’ is the amount of patterns in the segmentation vector, ‘n’ denotes the training patters presented in the cluster ‘c’, ‘
3.5 Analysis Metrics for Performance Evaluation
This section presents the analysis metrics for performance evaluation of the proposed IM-LCSC. The performance is analysed with the classification of images on the following values,
i. True positive, which denotes the cancerous lung image that are accurately classified.
ii. True negative, which is the number of Non- cancerous images that are under the same.
iii. False positive, which is the number of non-cancerous images are classified under cancerous class
iv. False negative defines the number of sample cancerous images that are classified on to the non-cancerous class.
By determining the above values, the sensitivity (True Positive Rate), Specificity (Recall), Precision and Accuracy Rate are calculated. Further, the computations are provided below.
i. Sensitivity (TPR):
It can be defined as the probability of the non-cancerous class is accurately classified on the same
class and the equation is given as,
ii. Specificity or Recall or True Negative Rate:
It can be defined as the number of images of non-cancerous class is identified as such; derivation is
presented in (13).
iii. False Positive Rate (FPR):
The images are falsely classified as Non-cancerous and the calculation is given as,
iv. False Negative Rate (FNR):
It is derived as the falsely classified images as Cancerous, when it is really non-cancerous and the
derivation is presented below.
v. Precision Rate (PR):
It is derived as the classification of lung CT images under CANCEROUS and NON-CANCEROUS
classes and the calculation is,
vi. Accuracy Rate (AR):
The quality of the IM-LCSC is evaluated by accuracy rate of image classification using the following derivation.
For evaluating the IM-LCSC in lung cancer diagnosis, the implementation is carried out in MATLAB V12. Furthermore, the obtained results that are derived on the metrics presented in Section 3.5 are compared with the available models, namely, Massive Training Artificial Neural Networks (MTANN), Fuzzy C-Means Clustering (FCM) and Genetic Algorithms based Template Matching (GATM) for evidencing the competence of the proposed model.
The proposed model is analyzed using the input CT images obtained from the benchmark dataset called LIDC-IDRI database dataset. The database contains lung images from 1018 patients. Moreover, the images are on three categories, namely, nodule size ≥ 3 mm, nodule size < 3 mm and non-nodule ≥ 3 mm and the sample image from the LIDC dataset is displayed in the Fig. 4.
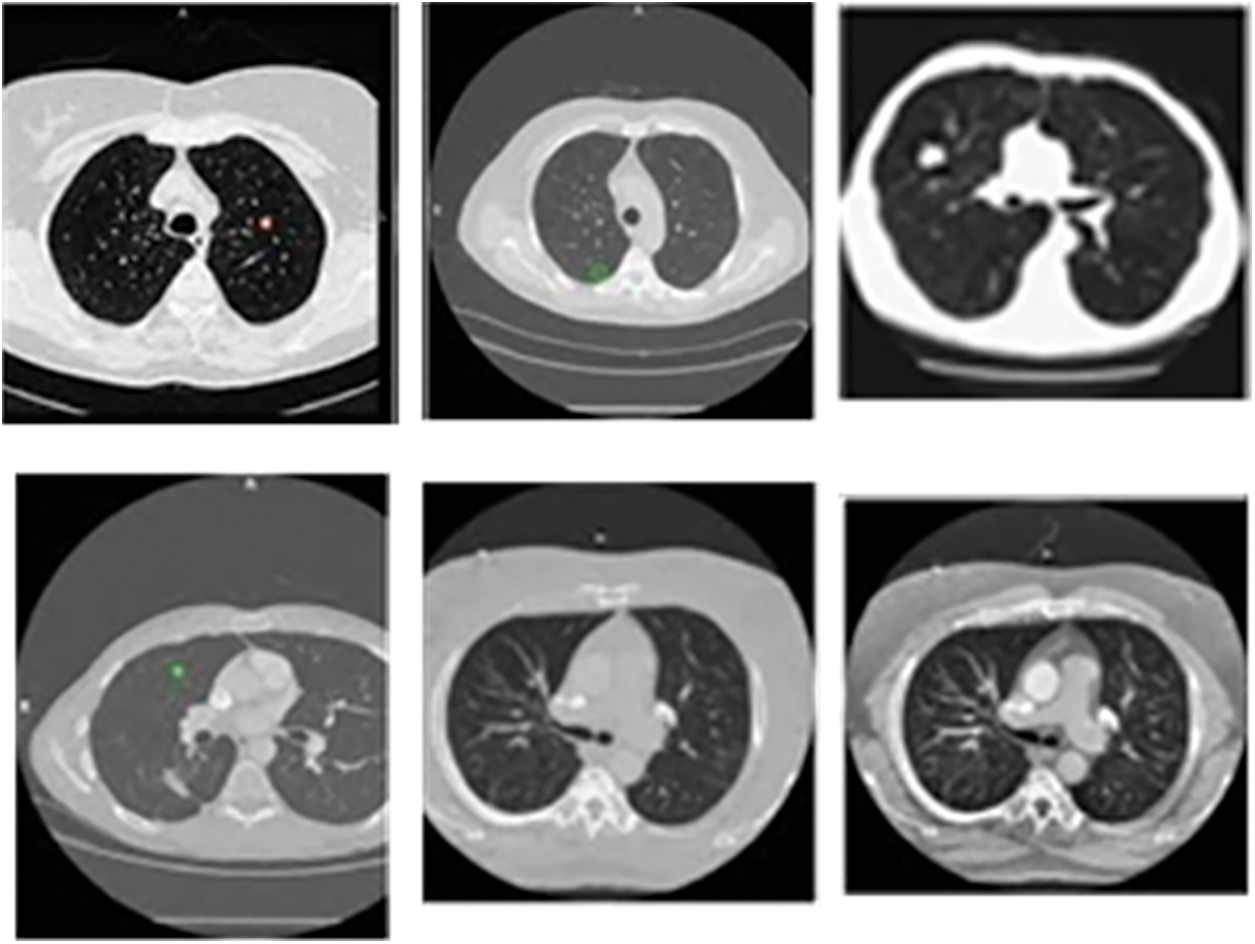
Figure 4: Sample CT lung images from LIDC-IDRI dataset
The evaluations are performed based on the analysis metrics such as True Positive Rate (TPR), True Negative Rate (TNR), False Positive Rate (FPR), False Negative Rate (FNR), Precision Rate and Accuracy Rate. The Fig. 5 displays the results obtained for TPR rate on classifying 30 lung CT images from LIDC-IDRI dataset. The average TPR rate obtained by the proposed cancer diagnosis model is 94.583% (in average), which is greater than other compared works. The Fig. 6 presents the results obtained for TNR of the proposed and existing models. By effectively enforcing the genetic algorithm in segmenting cancer tissues, the exactness of accurate classification is effectively achieved in the proposed model. Moreover, the model achieves higher rate of TNR in correctly classifying the Non-cancerous images under that particular class and the average TNR of the proposed model is 98.01%, which is higher amongst others and evidences the effectiveness of IM-LCSC.
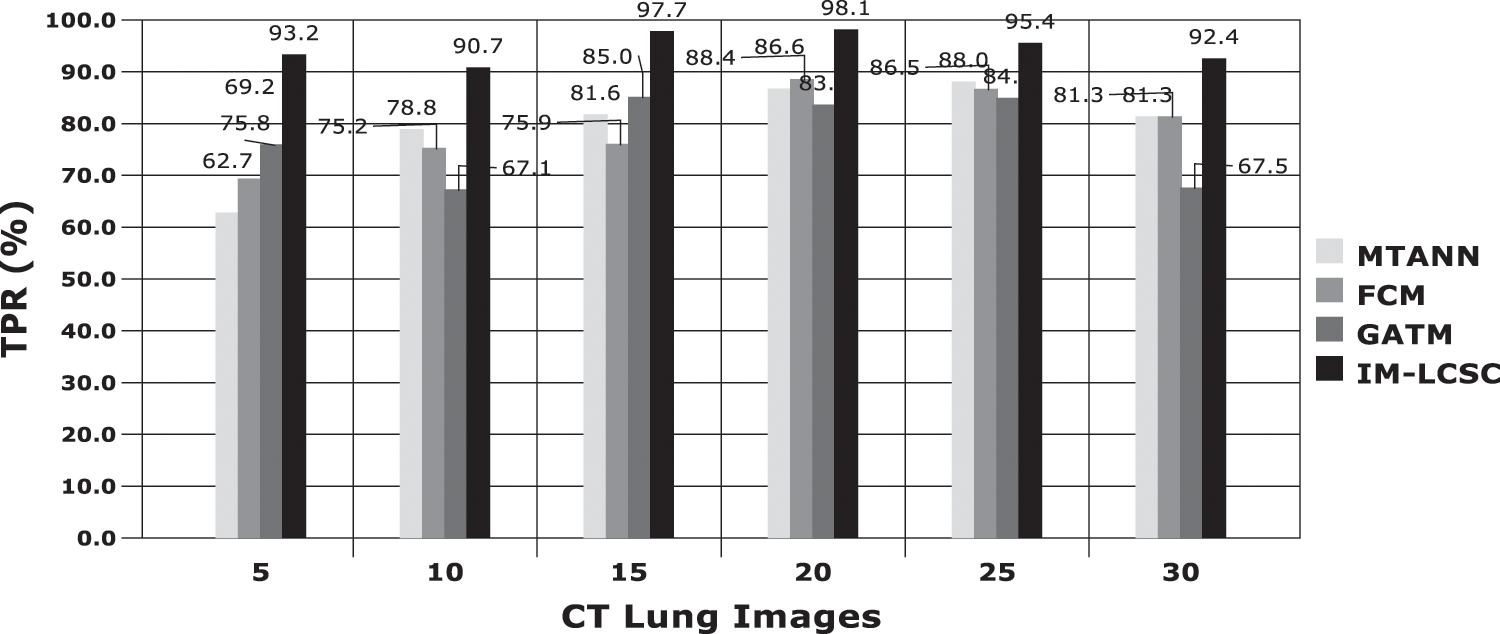
Figure 5: True positive rate based (TRP) based evaluations
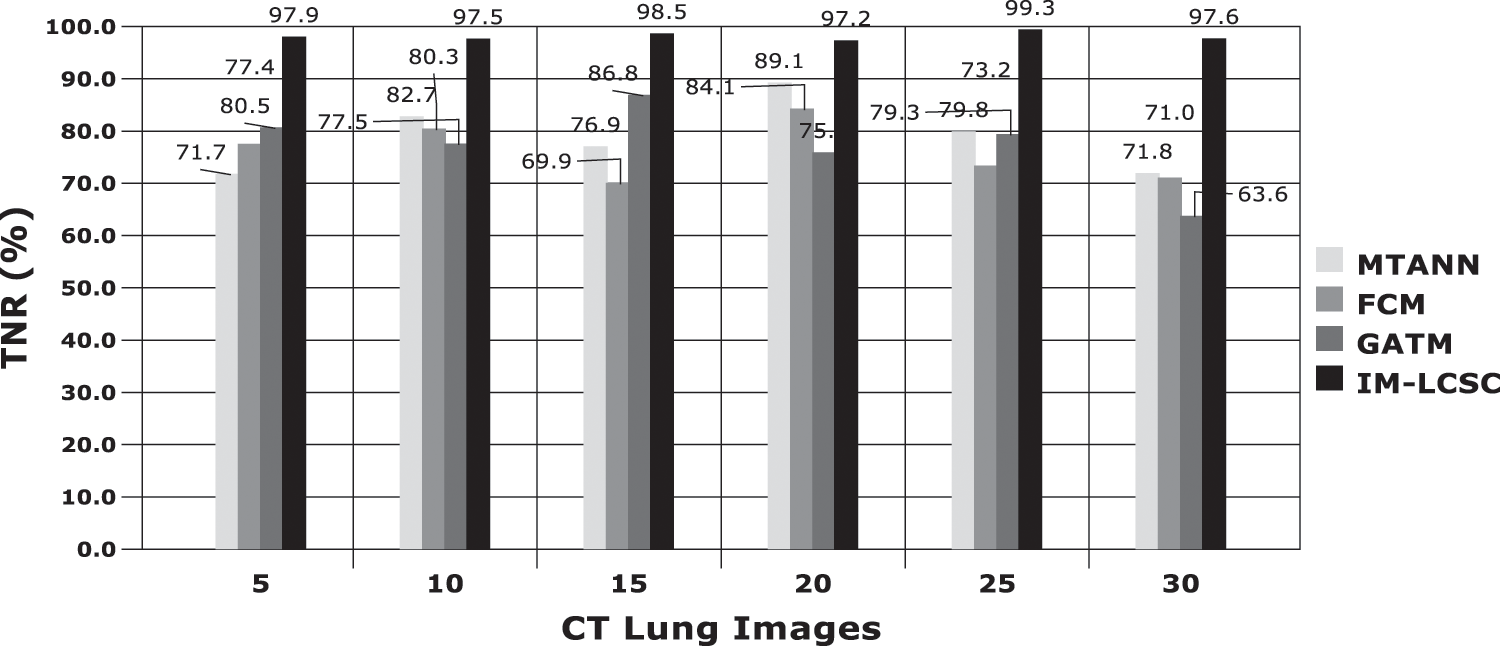
Figure 6: True negative rate (TNR) based comparisons and results
The results obtained in classifying lung images with False Positive Rate and False Negative Rates are portrayed in Figs. 7 and 8. The proposed model achieves minimal FPR and FNR values, hence, very less number of lung images are wrongly classified.
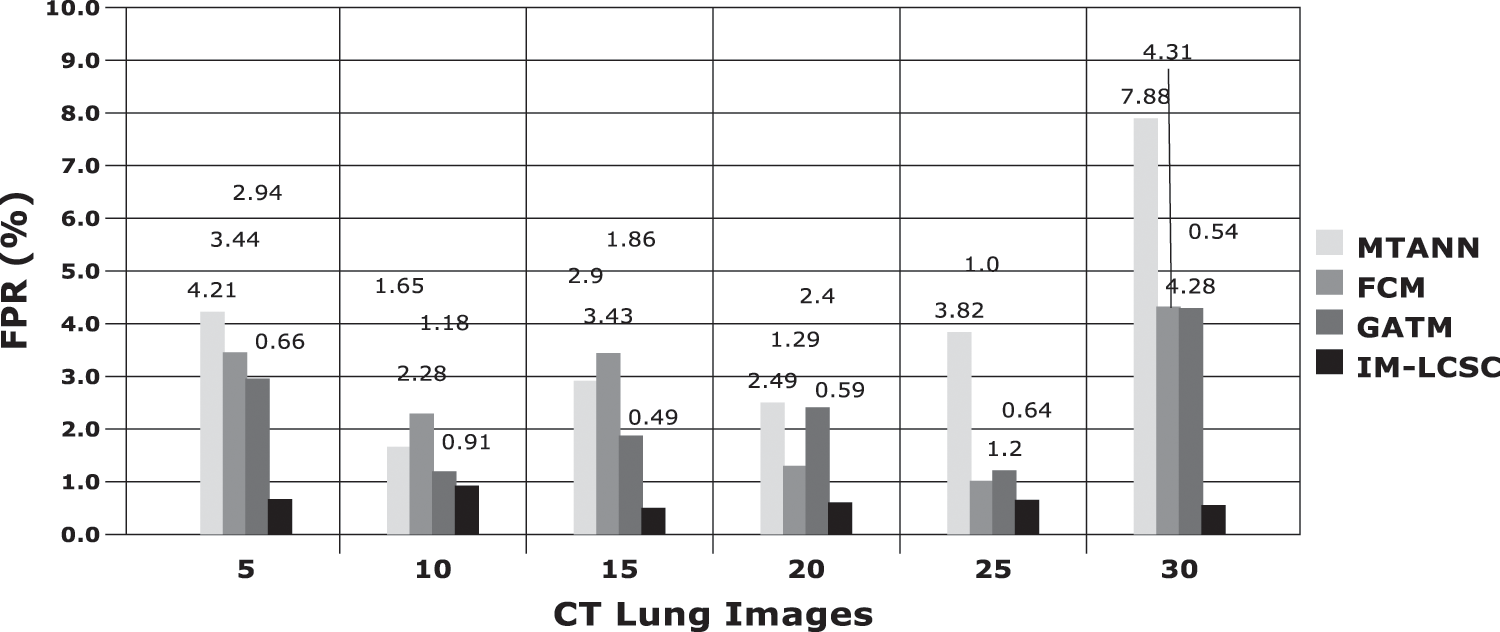
Figure 7: FPR analysis
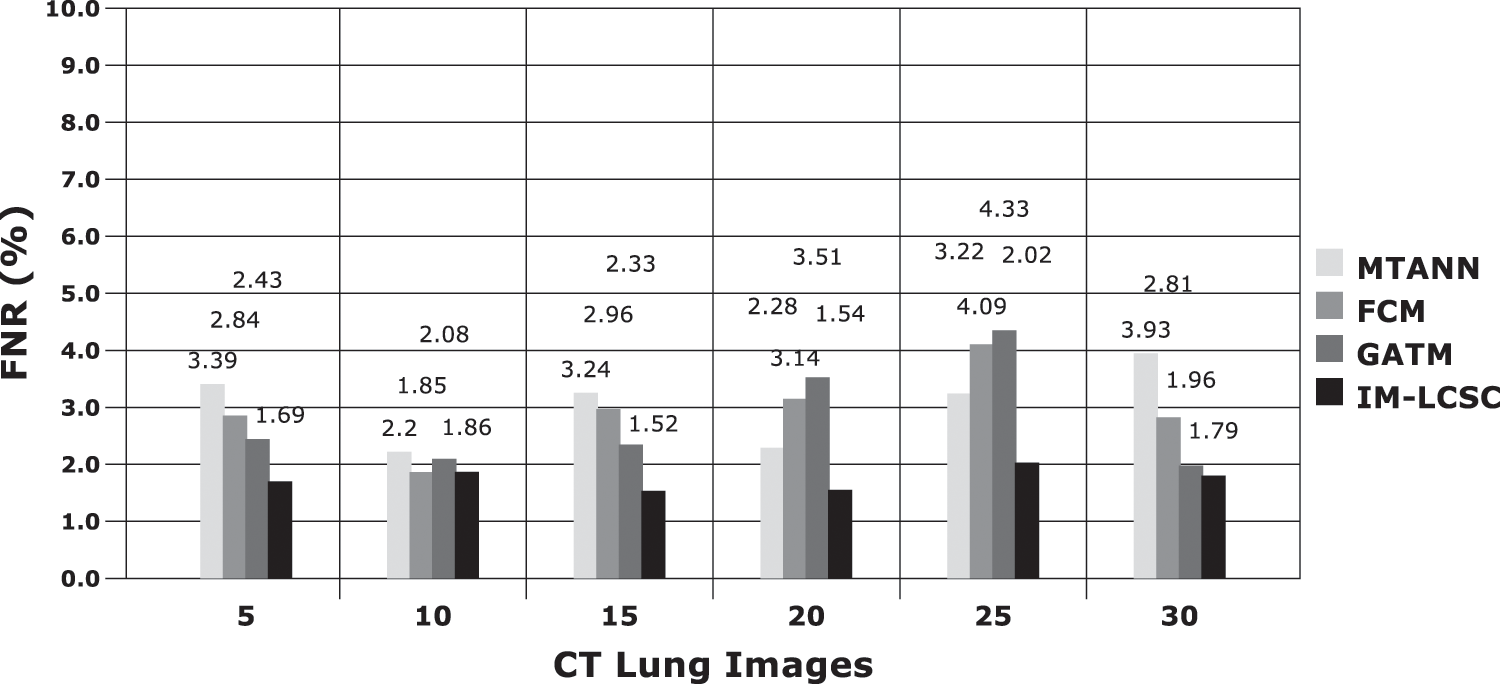
Figure 8: FNR calculations between models
Accuracy Rate and Precision Rates are the most important parameters to be considered for evaluating a classification model in medical image diagnosis. In that concern, the computations are made and the results are portrayed in Figs. 9 and 10. The lung cancer diagnosis and classification must be accurate for aiding radiologist to provide further treatments. The effective implementation of median and average filters, the noiseless image is obtained and segmentation is processed with GC-PSO that clearly defines the cancer tissue and PNN based classification is performed for producing results with higher rate of classification accuracy. Further, the results with sample lung images after performing histogram equalization based image enhancement, image segmentation and PNN based classification are provided in the Figs. 11–13. respectively.
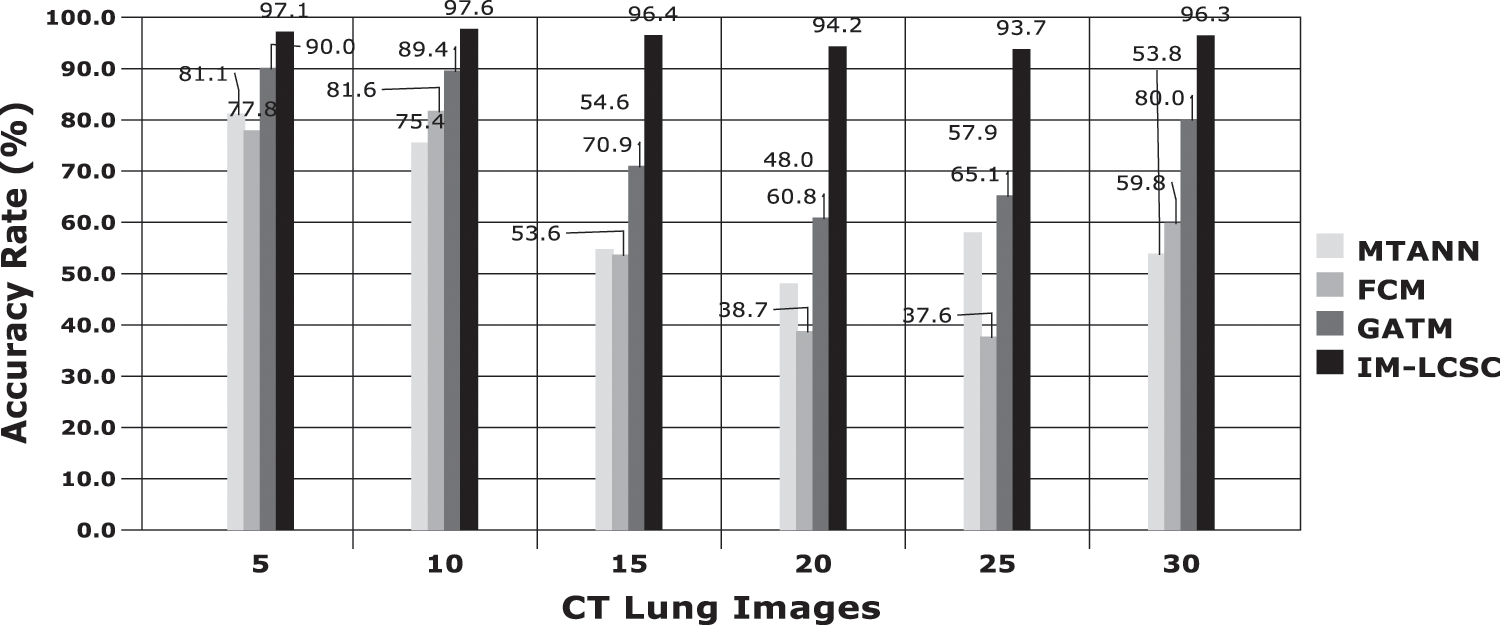
Figure 9: Accuracy rate in lung image classification
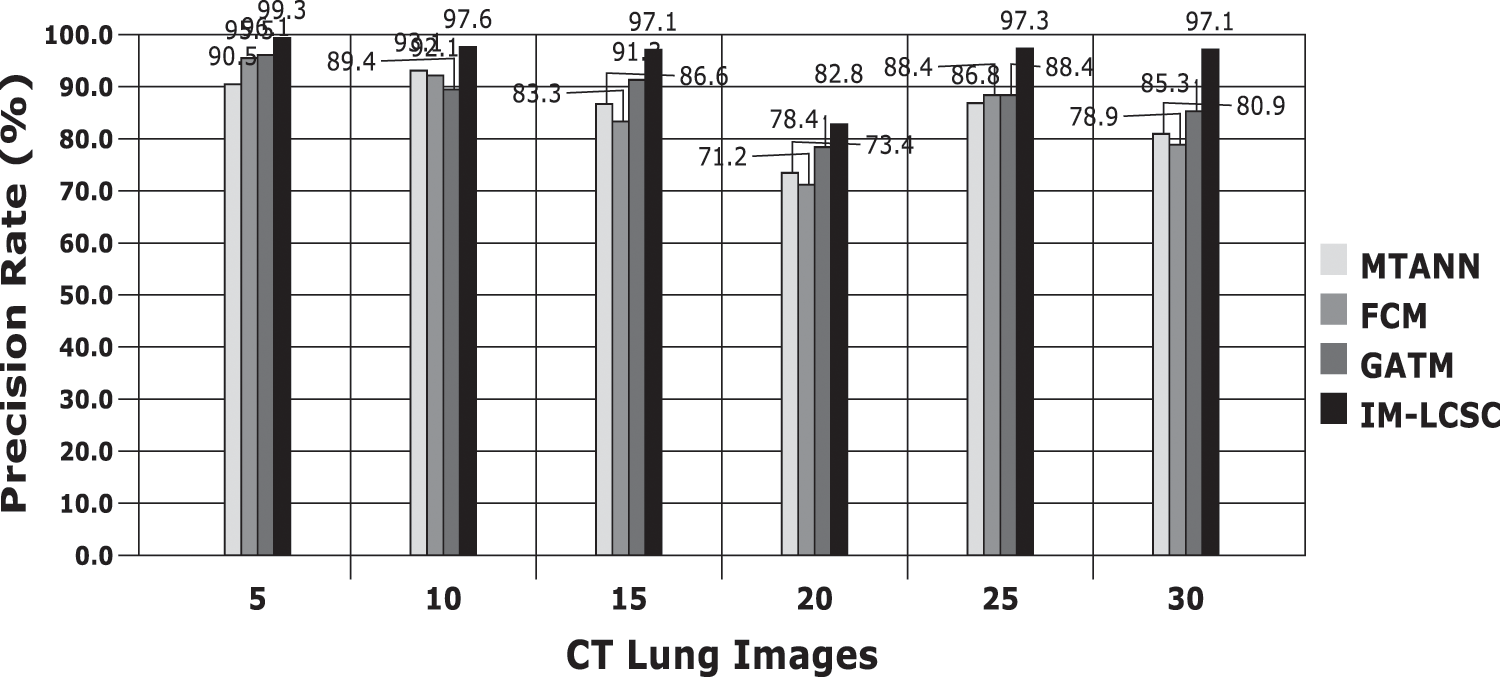
Figure 10: Precision rate analysis among models
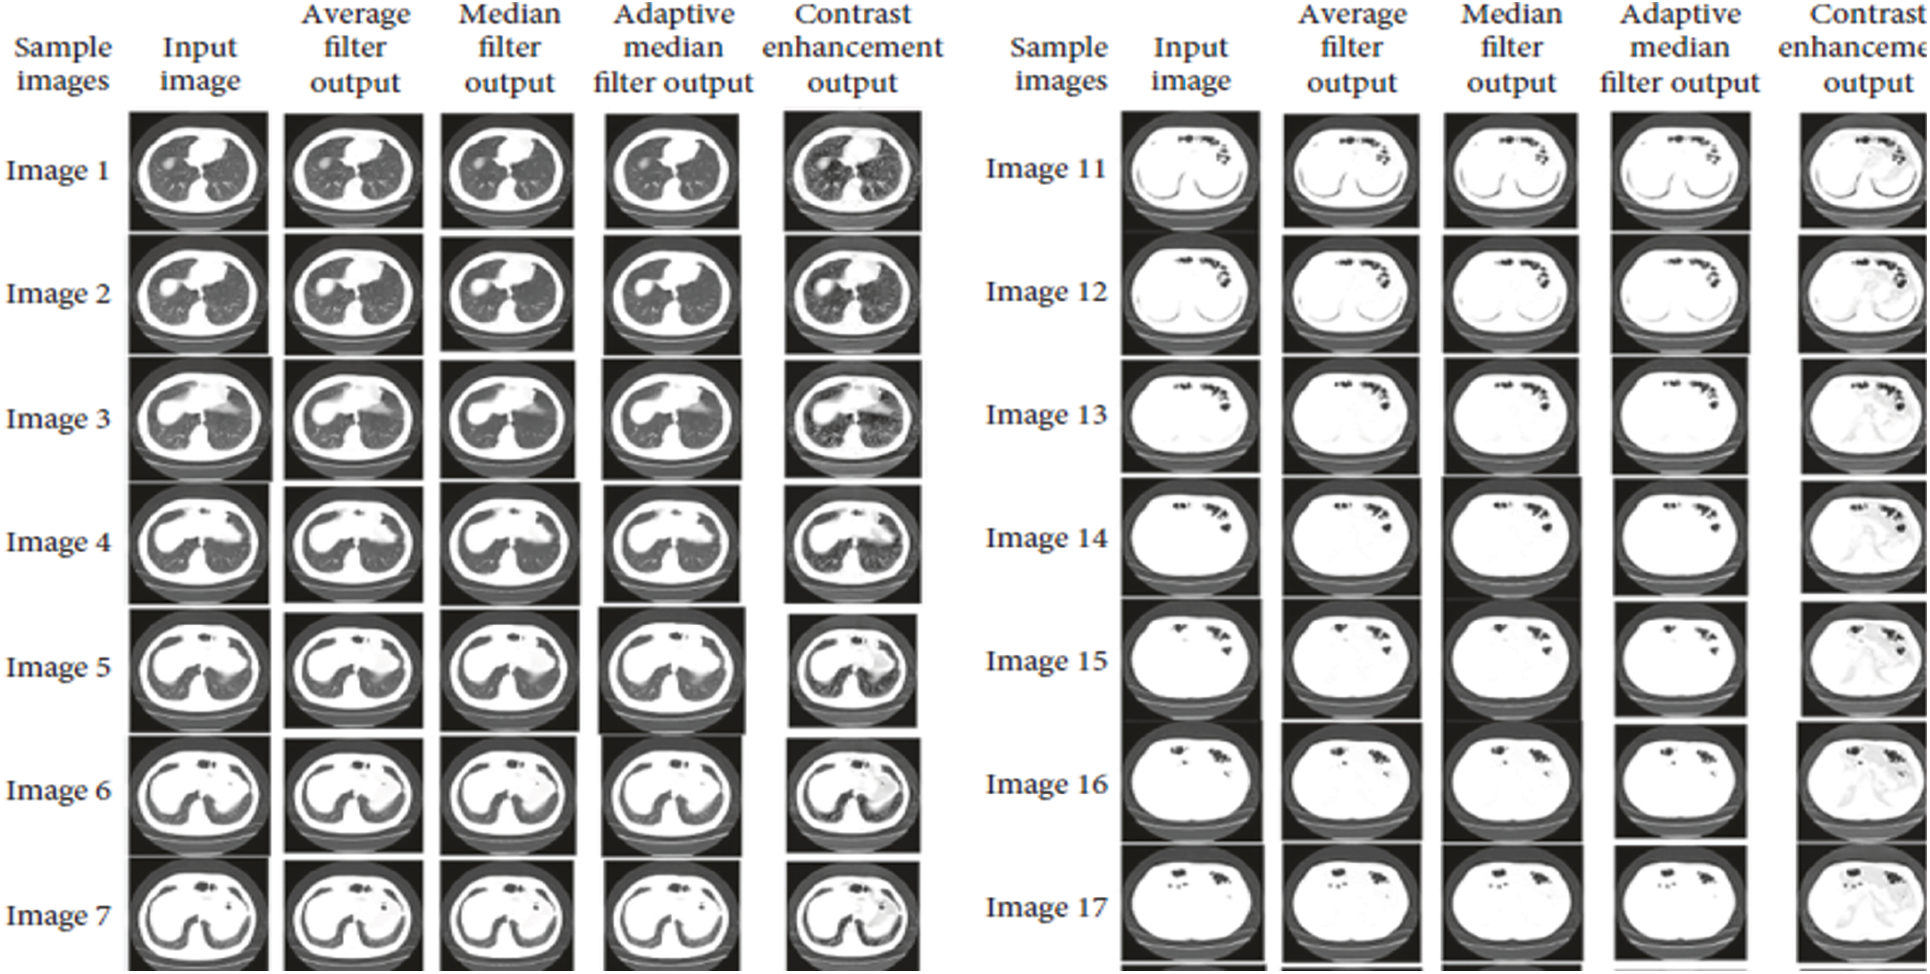
Figure 11: Results after image enhancement
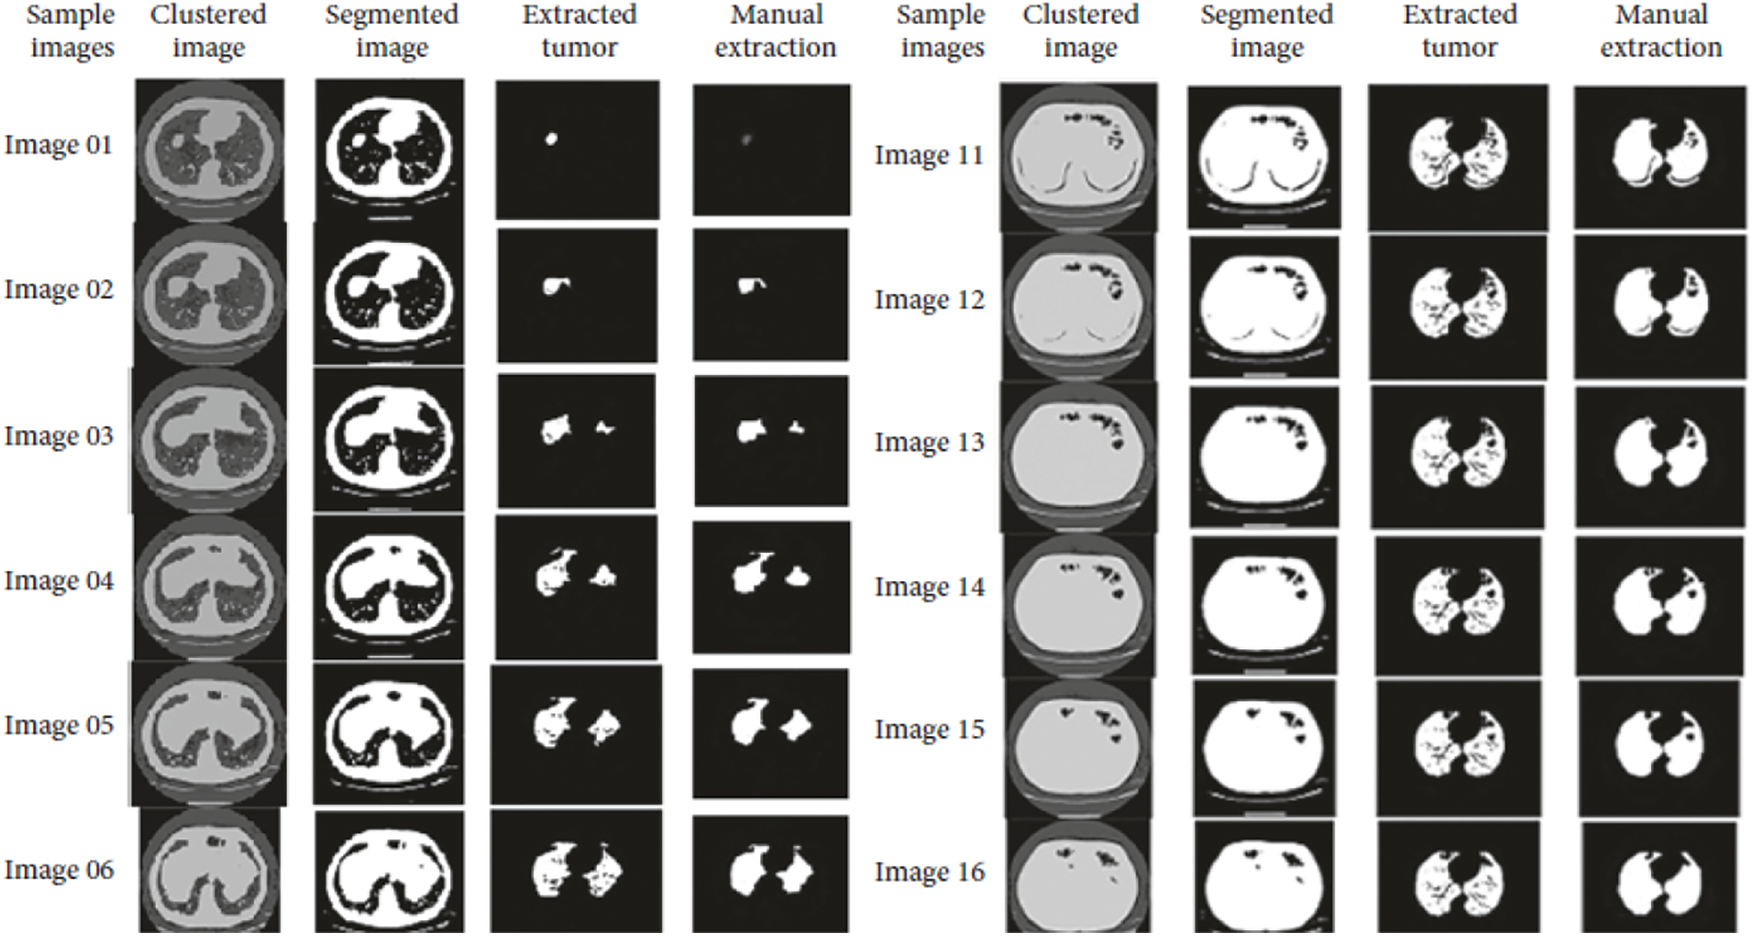
Figure 12: Results obtained from image segmentation
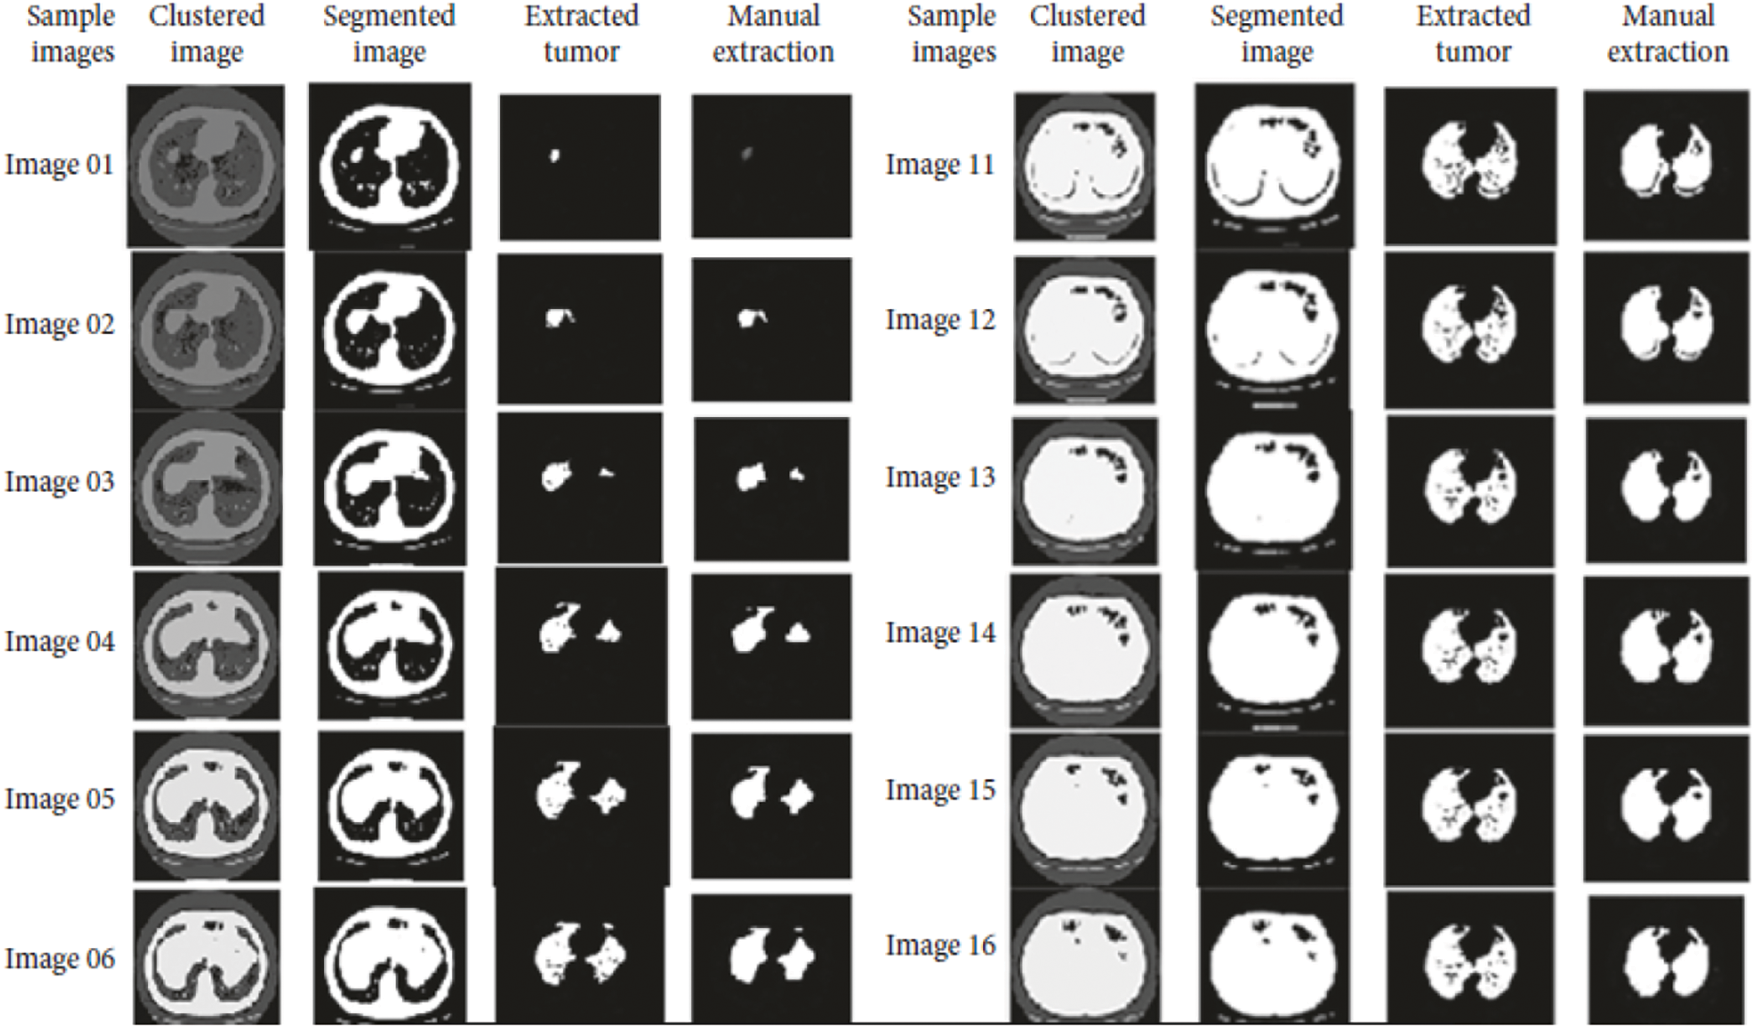
Figure 13: Final classification results with PNN
In this paper, improved model for lung cancer segmentation and classification using genetic algorithm (IM-LCSC) is proposed for accurately diagnosing lung cancer from CT images. The model utilizes two filters, Median and Average Filter for eliminating noise from input CT images and enhanced with histogram equalization to improve image quality. The enhanced image is further processed with Guaranteed Convergence based Particle Swarm Optimization to segment the cancer image. Based on the segmentation results, PNN is used for training and classifying CT images under CANCEROUS and NON-CANCEROUS classes. The evaluation results show that the IM-LCSC produced 95.88% which is greater than the other works in cancer diagnosis. Moreover, the model produces minimal rate of false classification. Hence, the proposed model is more efficient and outperforms other techniques.
The proposed technique achieves better efficiency with noise cancellation filters and the expected results of image enhancement, classification and segmentation. This research work aims to propose a better genetic algorithm that overcomes existing techniques that provides assessment during lung cancer detection, diagnosis, and therapy, as a result accurate classification results with minimal processing time is obtained. The work can be improved with efficient algorithms such as machine learning and Deep Learning to improve result accuracy and the tumor can be categorized based on stages for providing exact results to the radiologists, in future.
Funding Statement: The authors received no specific funding for this study.
Conflicts of Interest: The authors declare that they have no conflicts of interest to report regarding the present study.
References
1. K. Punithavathy, M. M. Ramya and P. Sumathi, “Analysis of statistical texture features for automatic lung cancer detection in PET/CT images,” International Conference on Robotics, Automation,” Control and Embedded Systems (RACE), vol. 1, pp. 18–20, 2015. [Google Scholar]
2. P. Gawade Prathamesh and R. P. Chauhan, “Detection of lung cancer cells using image processing techniques,” in 1st IEEE Int. Conf. on Power Electronics, Intelligent Control and Energy Systems, Delhi, India, vol. 1, pp. 75–90, 2016. [Google Scholar]
3. C. Anita and S. Sonit,“Lung cancer detection on CT images using image processing,” in Computing Sciences 2012 Int. Conf., IEEE, Phagwara, India, pp. 518–532, 2012. [Google Scholar]
4. A. M. Badrul and Y. Mohammad Abu, “Detection of lung cancer from CT image using image processing and neural network,” in Int. Conf. on Electrical Engineering and Information Communication Technology (ICEEICTIEEE, May, Savar, Bangladesh, pp. 1–13, 2015. [Google Scholar]
5. A. M. Gindi, T. A. Al Attiatalla and M. M. Sami, “A comparative study for comparing two feature extraction methods and two classifiers in classification of earlystage lung cancer diagnosis of chest x-ray images,” Journal of American Science, vol. 10, no. 6, pp. 13–22, 2014. [Google Scholar]
6. X. Jin, Y. Zhang and Q. Jin, “Pulmonary nodule detection based on ct images using convolution neural network,” in 9Th Int. Symp. on Computational Intelligence and Design (ISCID), Hangzhou, China, pp. 258–269, 2016. [Google Scholar]
7. P. Sangamithraa and S. Govindaraju, “Lung tumour detection and classification using EK-mean clustering,” in Int. Conf. on Wireless Communications, Signal Processing and Networking (Wispnet), Chennai, India, pp. 789–798, 2016. [Google Scholar]
8. T. Roy, N. Sirohi and A. Patle, “Classification of lung image and nodule detection using fuzzy inference system,” in Int. Conf. on Computing, Communication & Automation, Greater Noida, India, pp. 564–578, 2015. [Google Scholar]
9. S. Ignatious and R. Joseph, “Computer aided lung cancer detection system,” Global Conference on Communication Technologies (GCCT), vol. 2015, pp. 78–89, 2015. [Google Scholar]
10. E. Rendon Gonzalez and V. Ponomaryov, “Automatic lung nodule segmentation and classification in CT images based on SVM,” in 9Th Int. Kharkiv Symp. on Physics and Engineering of Microwaves, Millimeter and Submillimeter Waves (MSMW), Kharkiv, Ukraine, pp. 458–472, 2016. [Google Scholar]
11. Y. Lee, T. Hara, H. Fujita, S. Itoh and T. Ishigaki, “Automated detection of pulmonary nodules in helical CT images based on an improved template-matching technique,” IEEE Transactions on Medical Imaging, vol. 20, pp. 595–604, 2001. [Google Scholar]
12. K. Hyoungseop, M. Seiji, I. Yoshinori, S. Ishikawa, Y. Akiyoshi et al., “Automatic detection of ground-glass opacity shadows by three characteristics on MDCT images,” World Congress on Medical Physics and Biomedical Engineering, IFMBE Pro2, vol. 14, no. 4, pp. 89–103, 2007. [Google Scholar]
13. M. G. Penedo, M. J. Carreira, A. Mosquera and D. Cabello, “Computer-aided diagnosis: A neural-network-based approach to lung nodule detection,” IEEE Transactions on Medical Imaging, vol. 1, pp. 872–880, 1998. [Google Scholar]
14. S. Hu, E. A. Hoffman and J. M. Reinhardt, “Automatic lung segmen-tation for accurate quantitation of volumetric X-ray CT images,” IEEE Transactions on Medical Imaging, vol. 20, no. 6, pp. 490–498, 2001. [Google Scholar]
15. X. Ye, X. Lin, J. Dehmeshki, G. Slabaug and G. Beddoe, “Shape-based computer-aided detection of lung nodules in thoracic CT images,” IEEE Transactions on Biomedical Engineering, vol. 56, no. 7, pp. 1810–1820, 2009. [Google Scholar]
16. S. Parveen Shaik and C. Kavitha, “Detection of lung cancer nodules using automatic region growing method,” in Int. Conf. on Computing, Communications and Networking Technologies IEEE – ICCCNT, Thirunchengode, India, pp. 234–247, 2013. [Google Scholar]
17. S. Kenji, A. Hiroyuki, M. Heber MacMahon and D. Kunio, “Image-processing technique for suppressing ribs in chest radiographs by means of massive training artificial neural network (MTANN),” IEEE Transactions on Medical Imaging, vol. 25, no. 4, pp. 406–416, 2006. [Google Scholar]
18. D. Emre, C. Murat, E. Ziya, O. Murat and C. Arzu, “Artificial neural network-based classification system for lung nodules on computed tomography scans,” in 6th Int. Conf. of Soft Computing and Pattern Recognition (SoCPaR), Tunis, Tunisia, pp. 382–386, 2014. [Google Scholar]
19. P. Afshar, A. Ahmadi and M. H. F. Zarandi, “Lung tumor area recognition in CT images based on gustafson-kessel clustering,” in IEEE Int. Conf. on Fuzzy Systems (FUZZ-IEEE), Vancouver, BC, Canada, pp. 2302–2308, 2016. [Google Scholar]
20. M. Suren, P. W. C. Prasad, A. Abeer and A. K. Singh, “Lung cancer detection using CT scan images,” Procedia Computer Science, vol. 125, pp. 107–114, 2018. [Google Scholar]
21. K. Senthil Kumar, K. Venkatalakshmi and K. Karthikeyan, “Lung cancer detection using image segmentation by means of various evolutionary algorithms,” Computational and Mathematical Methods in Medicine, vol. 2019, pp. 1–16, 2019. [Google Scholar]
22. S. G. Armato, G. McLennan and L. Bidaut, “The lung image database consortium (LIDC) and image database resource initiative (IDRIA completed reference database of lung nodules on CT scans,” Medical Physics, vol. 38, pp. 915–931, 2011. [Google Scholar]
23. A. Rehman, M. Kashif, I. Abunadi and N. Ayesha, “Lung cancer detection and classification from chest ct scans using machine learning techniques,” IEEE Xplore, vol. 4, pp. 345–356, 2021. [Google Scholar]
24. S. A. Khan, M. Nazir, M. A. Khan, T. Saba, K. Javed et al., “Lungs nodule detection framework from computed tomography images using support vector machine,” Microscore Resourse Technique, vol. 82, no. 8, pp. 1256–1266, 2019. [Google Scholar]
25. T. Saba, A. Sameh, F. Khan, S. A. Shad and M. Sharif, “Lung nodule detection based on ensemble of hand crafted and deep features,” Journal of Medical Systems, vol. 43, no. 12, pp. 332–345, 2019. [Google Scholar]
26. S. Kamalakannan and P. Kalpana, “Medical data transmission using the product of tldpc and bch error control coding systems with two interleavers,” International Journal of Communication Systems, vol. 33, no. 12, pp. 1–11, 2020. [Google Scholar]
27. T. Saba, “Automated lung nodule detection and classification based on multiple classifiers voting,” Microscore Resourse Technique, vol. 82, no. 8, pp. 1–9, 2019. [Google Scholar]
28. X. R. Zhang, X. Sun, W. Sun, T. Xu and P. P. Wang, “Deformation expression of soft tissue based on bp neural network,” Intelligent Automation & Soft Computing, vol. 32, no. 2, pp. 1041–1053, 2022. [Google Scholar]
29. X. R. Zhang, J. Zhou, W. Sun and S. K. Jha, “A lightweight cnn based on transfer learning for covid-19 diagnosis,” Computers, Materials & Continua, vol. 72, no. 1, pp. 1123–1137, 2022. [Google Scholar]
Cite This Article
 Copyright © 2023 The Author(s). Published by Tech Science Press.
This work is licensed under a Creative Commons Attribution 4.0 International License , which permits unrestricted use, distribution, and reproduction in any medium, provided the original work is properly cited.
 Downloads
 Citation Tools