
 Submit a Paper
 Propose a Special lssue
 Open Access
ARTICLE

Micro Calcification Detection in Mammogram Images Using Contiguous Convolutional Neural Network Algorithm
1 Selvam College of Technology, Namakkal, 637003, Tamil Nadu, India
2 Knowledge Institute of Technology, Kakapalayam, 637504, Tamil Nadu, India
3 KSR College of Engineering, Tiruchengode, 637215, Namakkal, India
* Corresponding Author: P. Gomathi. Email:
Computer Systems Science and Engineering 2023, 45(2), 1887-1899. https://doi.org/10.32604/csse.2023.028808
Received 18 February 2022; Accepted 12 April 2022; Issue published 03 November 2022
 View Full Text
 Download PDF
Abstract
The mortality rate decreases as the early detection of Breast Cancer (BC) methods are emerging very fast, and when the starting stage of BC is detected, it is curable. The early detection of the disease depends on the image processing techniques, and it is used to identify the disease easily and accurately, especially the micro calcifications are visible on mammography when they are 0.1 mm or bigger, and cancer cells are about 0.03 mm, which is crucial for identifying in the BC area. To achieve this micro calcification in the BC images, it is necessary to focus on the four main steps presented in this work. There are three significant stages of the process assigned to find the BC using a thermal image; the image processing procedures are described below. In the first stage of the process, the Gaussian filter technique is implemented to magnify the screening image. During the second stage, BC detection is separated from the pre-processed image. The Proposed Versatile K-means clustering (VKC) algorithm with segmentation is used to identify the BC detection form of the screening image. The centroids are then recalculated using proposed VKC, which takes the mean of all data points allocated to that centroid’s cluster, lowering the overall intra-cluster variance in comparison to the prior phase. The “means” in K-means refers to the process of averaging the data and determining a new centroid. This process eliminates unnecessary areas of interest. First, the mammogram screening image information is taken from the patient and begins with the Contiguous Convolutional Neural Network (CCNN) method. The proposed CCNN is used to classify the Micro calcification in the BC spot using the feature values is the fourth stage of the process. The assess the presence of high-definition digital infrared thermography technology and knowledge base and suggests that future diagnostic and treatment services in breast cancer imaging will be developed. The use of sophisticated CCNN techniques in thermography is being developed to attain a greater level of consistency. The implemented (CCNN) technique’s performance is examined with different classification parameters like Recall, Precision, F-measure and accuracy. Finally, the Breast Cancer stages will be classified based on the true positive and true negative values.Keywords
Many researchers working on cancer diagnosis have implemented research design in the past decade, implementing its proposed techniques. This section is dedicated to summarizing some existing research and strategic analysis to identify breast cancer. The system’s evaluations are based on the optimized algorithm inspired by nature and do not improve the extracted features’ performance. Finally, the best selected hybrid Extreme Learning Machine (ELM) classification feature is utilized to find micro calcifications in digital breast images. In detecting BC, the first stage is to extract the strangely part using the ROI technique Melekoodapattu et al. 2020, Shen et al. 2019, Sechopoulos et al. 2020 [1–3]. The next stages of processing evaluate the BC stages using Convolutional Neural Network (CNN). Micro calcifications (MC) were diagnosed with breast cancer’s surrounding tissue Fanizzi et al. 2020, Reis et al. 2016 [4,5] breast X-ray photographs. The ability to recognize each feature Wavelet transform using benign and malignant tissues is a set of recognition using probabilistic neural networks.
The essential processing of the system is to improve the digital images using the filtrations; in this process, a Gaussian filter is utilized for removing noise in the image. The most common way to calculate these measures is to use the classification’s built-in statistics Ganesh Kumar et al. 2016, Pacile et al. 2016, Chen et al. 2019, Wang et al. 2020. [6–9]. Supervision and participatory approach carefully identified ROI data sets on the label study. To detect the probability of each detected object, the Poisson binomial probability is utilized Cruz-Bernal et al. 2018, Zheng et al. 2019, Hofener et al. 2018, Basile et al. 2019, Mabrouk et al. 2019, Anuradha et al. 2016 [10–15]. Implementing a logistic regression model is based on the characteristics released by the detected object’s inventor.
Finally, the bosom’s ionization, high weight, and pressure are not required in the thermal image, so there is no break hazard in this work Udupi et al. 2011, Suganthi et al. 2014 [16,17]. The extraction of divided ROI from the thermal image is an important advancement in any BC recognition framework. The initial ROI divides the concentrate and separates the breast area’s thermal image from the alternative main body member. It is a complete programming process that can go from a manual. A highlight extraction process should be possible; once the breast area is separated from any remaining arms in the thermal image. There are several works of breast thermal image segmentation to seek regions. The segmentation analysis embrace was completed before the physical investigation Lipari et al. 1997 [18]. It shows each of the arms in a convention division part into four quadrants. There are four partitions concerning the button focus chest, left side, right side, and bottom of the breast. The image is separated into the areola by Srinivasan et al. 2014, Zhoupp et al. 2015, Kostopoulos et al. 2007 [19–21] of the four focus associated with four different quadrants. A positive estrogen receptor evaluation utilizing a color texture characteristic on IHC images the computer method for determining positive ER receptor status consists of two stages: stage I is nucleus segmentation using Otsu’s global image threshold method and morphology operation, and stage II is nucleus classification based on brown and blue color using feature selection and K-Nearest Neighbors weighted averages Bozkurt et al. 2021, Peng et al. 2016, Sainz et al. 2017, Rana et al. 2019, Xing et al. 2015, Mordang et al. 2018, Suhail et al. 2017, Wu et al. 2019, Bellizzi et al. 2018 [22–30].
The above analysis considering the similar drawback like Precision (%), Re-call (%) and F-measure (%) of the previous system. Implementing Contiguous Convolutional Neural Network (CCNN) the algorithm provides an efficient way of analyzing Breast cancer with an accurate Feature extraction.
In this section, the working principle for diagnosing breast cancer in thermal images is based on Contiguous Convolutional Neural Network (CCNN) algorithm. Fig. 1 shows the proposed block diagram for Breast Cancer (BC) in digital mammogram images, and the operation process is given below;
i) Gaussian median filter Pre-processing
ii) Versatile K-means clustering (VKC) algorithm
iii) Contiguous Convolutional Neural Network (CCNN)
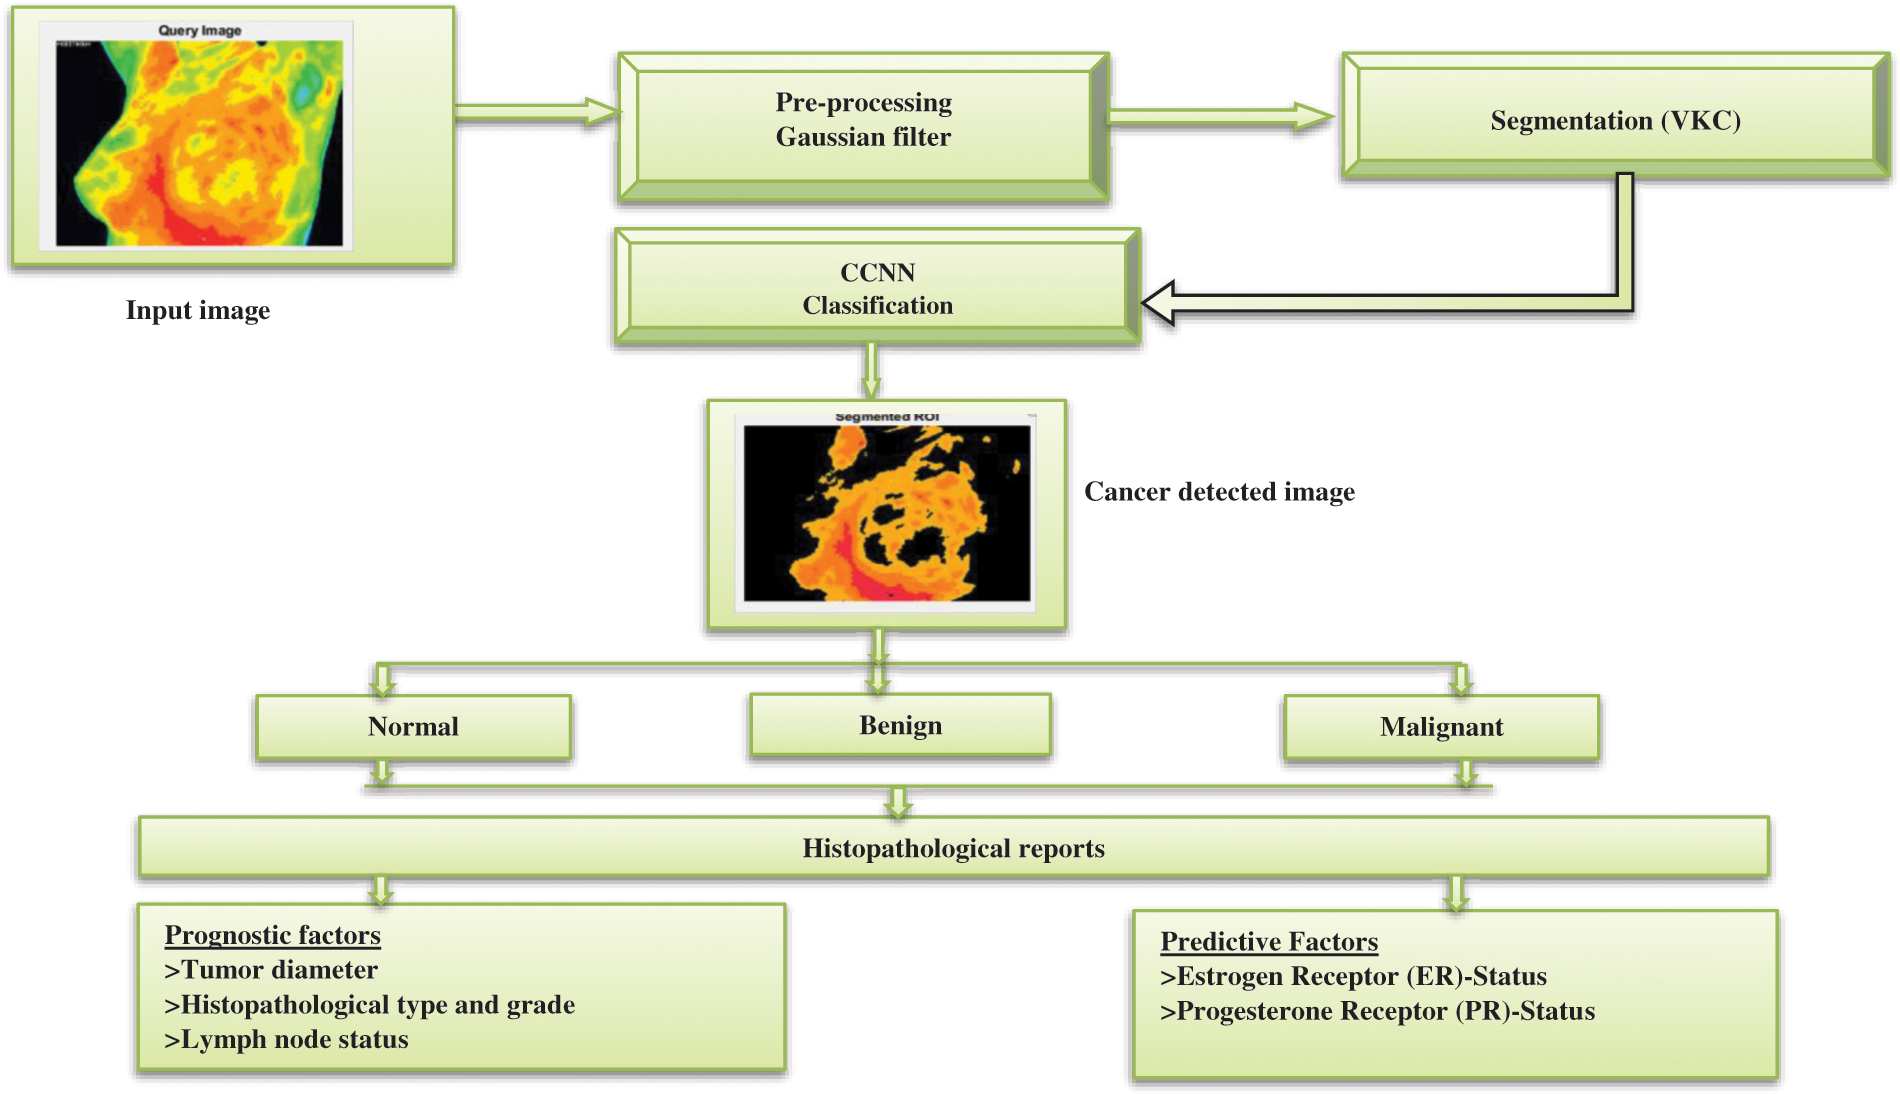
Figure 1: Proposed block diagram for CCNN based Mammogram cancer detection
Fig. 1 describes the functional block of the CGCNN based Mammogram cancer detection. Initial in this system utilized a Database for Research Mastology with 500 Infrared Image (DMR-IR) for the training function. For detecting the Mammogram cancer detection in the image processing system, the four steps are followed during the initial stage pre-processing of the image (In this system, the thermal images are extracted from the DMR-IR dataset noise be removed using the Gaussian median filter. The second stage is the segmentation analysis for detecting breast cancer; the proposed system Versatile K-means clustering (VKC) algorithm is utilized to detect BC. In the third stage, multi-model feature extraction techniques evaluate the different feature values like mean, entropy, standard deviation, variance and dimension. Finally, the Contiguous Convolutional Neural Network (CCNN) classifier will analyze the True positive/negative and false positive/negative values based on the classification’s output evaluation. NN is divided into two categories: benign and malignant. The objectives were to investigate the proportions of true and missed screen-detected breast cancers and explore whether mammographic findings, density, or histopathological characteristics of the BC. They hypothesized that these three aspects differed between true and missed screen-detected breast cancers diagnoses.
3.1 Pre-processing Gaussian Filter
The impulse response of a Gaussian filter is a Gaussian function (or an approximation to it). The features of Gaussian filters are that they have no overshoot to a step function input while reducing the rise and fall time.
In this scenario, let can assume that the parameter a—also known as the distribution means or statistical expectation—responsible for distribution shifting down the x-axis is zero: a = 0; and it can deal with the simpler form.
After the computation multiplies, the multiplicative image value is the RGB value of the pixel corresponding to the Gaussian membership function-based filter operation is described below.
The proposed system’s input image pre-processing result employing the Gaussian Filter is shown in Fig. 2a shows the image’s input, whereas Fig. 2b represents the image’s output after pre-processing.
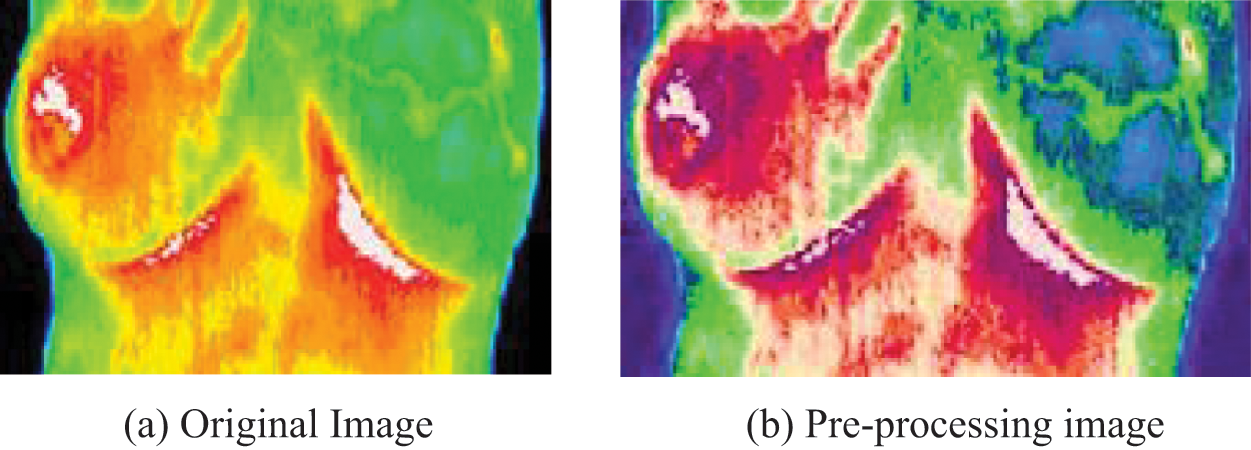
Figure 2: (a) Original image. (b) Pre-processing image
Step 1: Begin
Step 2: Initialize the input breast image data
Step 3: When processing (a, b) pixel
Step 4: Calculate all pixels in the filter scale’s membership function value (
where
Step 5: Calculate the RGB value of each pixel
Step 6: Get the average value for
Stage 7: Calculate the objective function
Stage 8: End.
3.2 Versatile K-Means Clustering (VKC) Algorithm
Clustering techniques are frequently used to segment data inside a user-defined cluster. Because of its simplicity and short computation time, the proposed Versatile K-Means Clustering (VKC) algorithm is used for breast cancer detection in the thermal image. The three regions in the segmented breast cancer region are soft tissue, mammography boundary area, and micro clarification. Cluster image with the least probability cluster from the division except for cancer, the other two areas are more likely to cover a wider area. The centroids are then recalculated using suggested VKC, which takes the mean of all data points assigned to that centroid’s cluster, reducing total intra-cluster variation compared to the previous step. The process of averaging the data and finding a new centroid is referred to as “means” in K-means.The segmentation vector is then transformed into three-dimensional image data. Fig. 3 shows the segmented image.
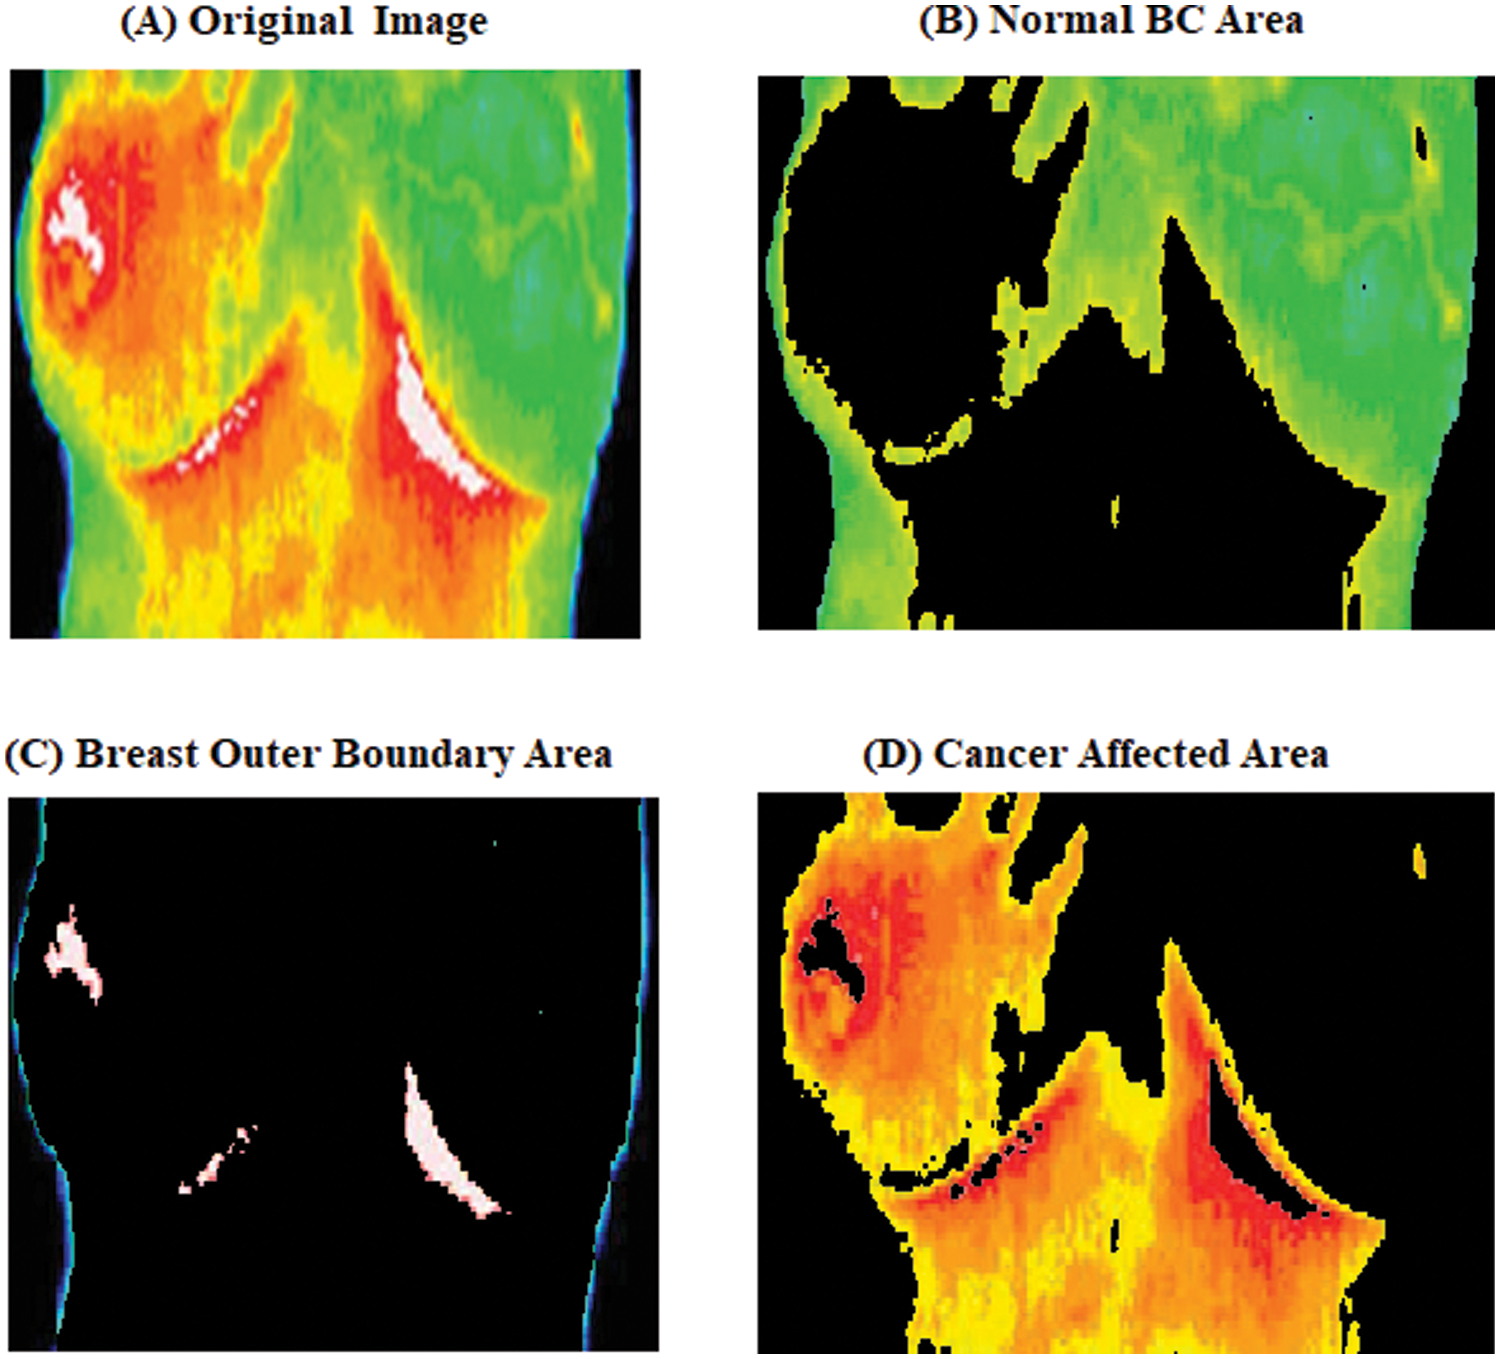
Figure 3: Versatile K-Means Clustering malignant image
Fig. 3 shows the output of the Versatile K-Means Clustering malignant image as a single image of malignant breast cancer. From the image Fig. 3 four different cluster images of the first image are the (original image), the second cluster is the (outer boundary region), the third cluster is the (cluster the breast for the outer boundary), and the fourth cluster is the (Suspicious mass region) respectively, using suboptimal clustering to generate mammograms of malignant breast cancer image the whiter visible, which is a larger BC mass.
Versatile K-Means Clustering (VKC) Algorithm
The Versatile K-means clustering (VKC) technique may be modified to utilize the vector measure to create a versatile iterative refinement clustering algorithm, which is named after the algorithm’s vector operations are all on the unit sphere. The sphere takes advantage of the spherical and efficient vector space since it leverages cosine similarity.
Step 1: Start with a partitioning
Step 2: For each document vector
Step 3: Next compute the new partitioning
Step 4: The calculation corresponds to the new concept vector calculate in (7) partition;
Step 5: If
The above algorithm is a gradient ascending technique, as shown in (5); the objective function value is increased from one iteration to the next. Like any gradient ascent implementation, the Versatile K-means clustering (VKC) technique is prone to local maxima.
3.3 Contiguous Convolutional Neural Network (CCNN) Classifier
A medical diagnostic input feature might be used with a set or subset of pattern recognition and BC classification in digital BC images. The feed-forward neural network utilized in the information processing system example has 500 training sets when training is required. It employs the Contiguous Convolutional Neural Network (CCNN) approach to decrease actual and erroneous output weights. The average square error neuron set then continues the training cycle until the feature extraction level is reached. At this point, the assorted feature is placed in the structure’s extraction input layer. The CCNN algorithm is represented below the fundamental structure of Fig. 4 Only one neuron in the output layer, whose output is 0 or 1, is discarded, representing the benign and malignant classes, and accomplishes the so-called two-class classification.
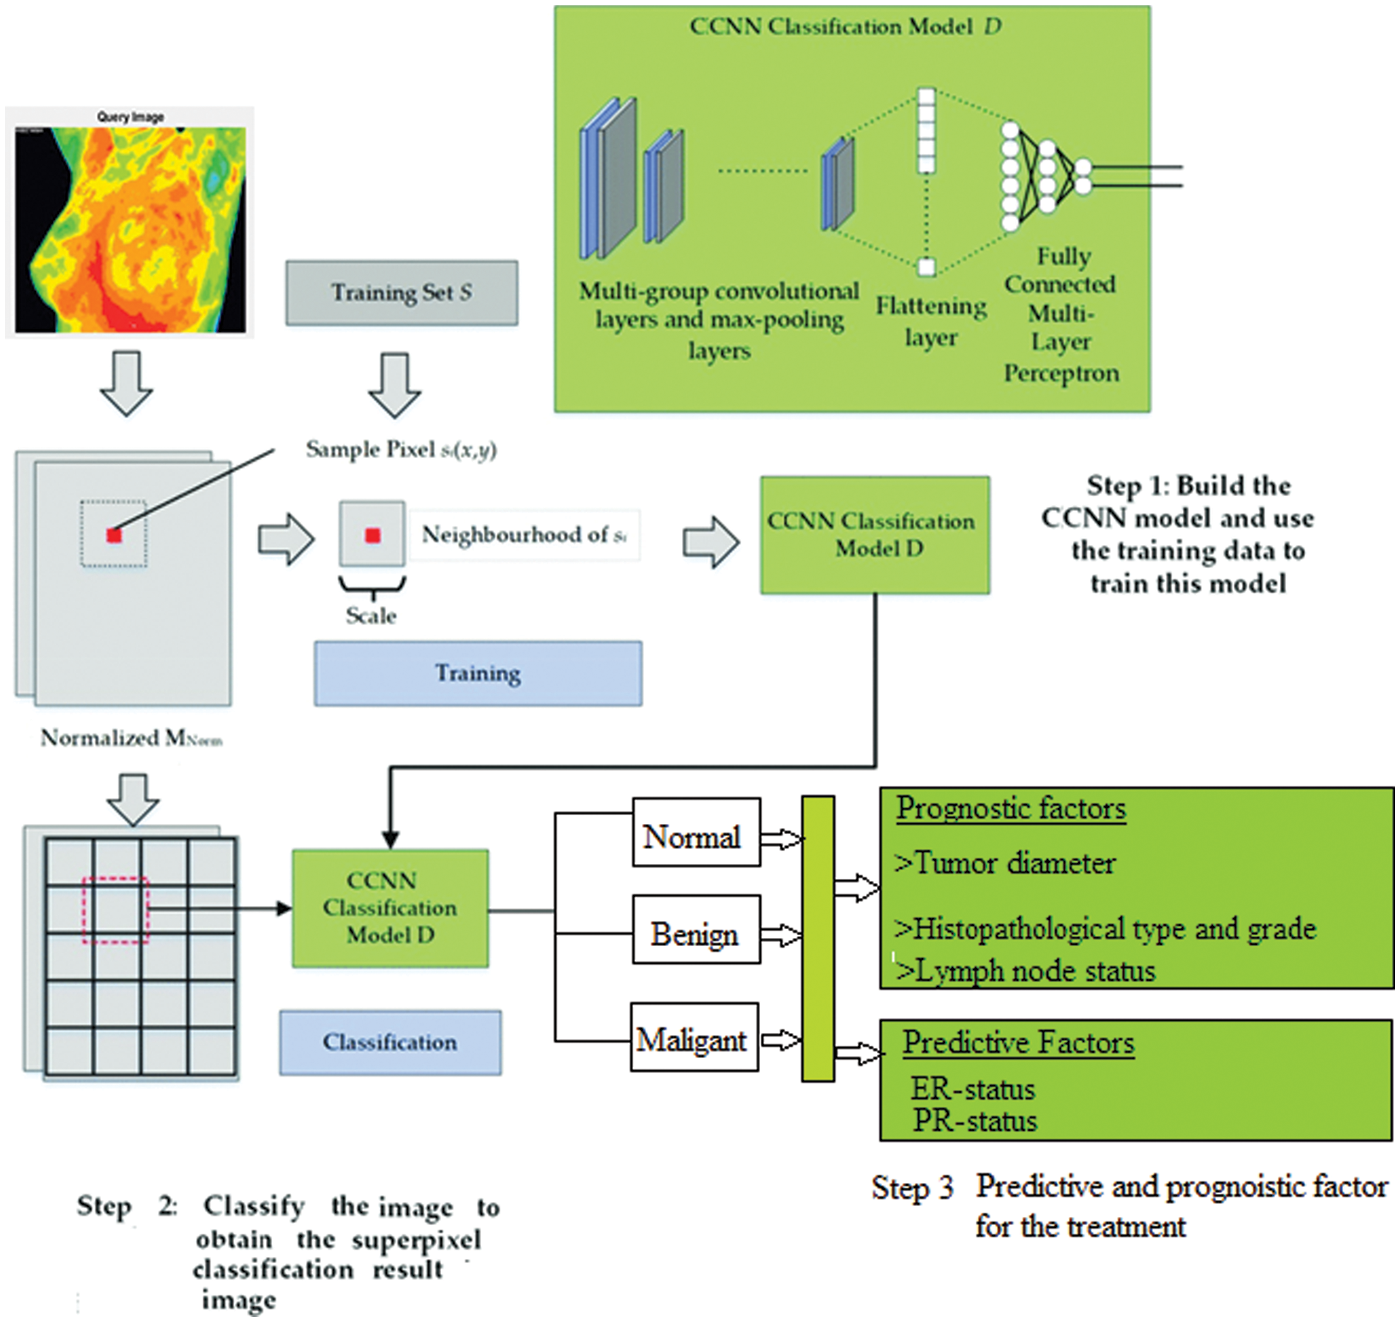
Figure 4: CCNN architecture diagram
Contiguous Convolutional Neural Network (CCNN) Algorithm:
Step 1: The model parameters are being initialized or re-estimated.
Step 2: The image is pre-processed and enhance image quality using Gaussian filter.
Step 3: compute the cluster image ratio of n = 1, containing the initial number of blocks C1…Cn, the initial image group contains a least probability used to initialize a set of multiple sizes.
Step 4: Input the data from the prepared data set and convert the signal vector into a matrix.
Step 5: To compute the second-order statistic features of breast cancer thermal images, use covariance pooling.
Step 6: Let
where
Step 7: The covariance differentiation is then included into the deep learning network, and the covariance matrix F is created.
where
Step 8: Because the covariance matrix is symmetric positive semi positive, Singular Value Decomposition (SVD) or Eigenvalue Decomposition (EIG) can be used:
where
Step 9: To speed up the computation of covariance normalization, use Newton-Schulz iteration. In further, the Z =
Eq. (13) may be calculated using simply the matrix product, making it more suited for Graphics Processing Unit (GPU) implementation. Meanwhile, with a limited number of iterations, the iteration can obtain an approximation answer. The number of iterations in this system.
Step 10: To ensure that the Newton-Schulz iteration is covered, the F must first pass through.
where tr(.) indicates the matrix’s trace. It also employ a post-compensation to adjust for the data magnitudes generated by Eq. (14).
Step 11: Calculate the error signal based on the output error and determine the pre-defined output layers’ weight.
Step 12: Regulate the weight of the network until it becomes small.
Step 13: Finally, the classification NN’s output evaluation is divided into benign and malignant categories.
Step 14: End.
4 Experimental Setup and Results
Due to its enhanced efficiency and ease of execution, the suggested approach is useful for helping a diagnosis before surgery. By obtaining accuracy, our proposed Contiguous Convolutional Neural Network (CCNN) classification approach outperforms another standard classifier. The expected outcomes of the improved algorithm are compared to the approaches. The performance of the proposed system is evaluated using the MATLAB 2017b software. The methods utilized to realize the invention’s progress relate to various approaches for examining and evaluating simulation outcomes in image processing, depending on the activity and scenario.
Fig. 5 represents the GUI simulation model for the proposed Breast Cancer (BC) analysis. In the examination the BC is analyzed in three different stages like (i) preprocessing (ii) VKC clustering segmentation and (iii) CCNN based classification which is illustrated in above GUI model. Based on the Precision (%), Recall (%) and F-measure (%) the proposed CCNN based classification actuary is analyzed with different images.
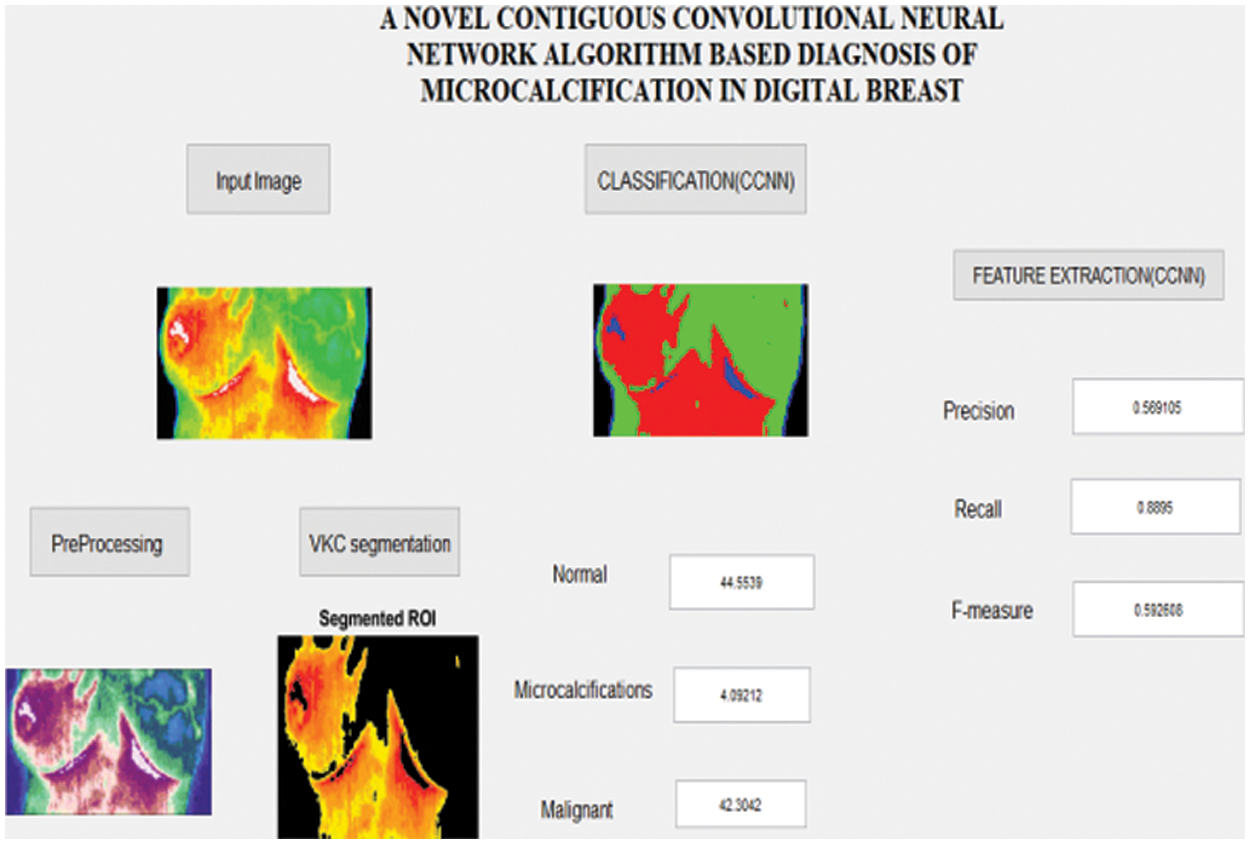
Figure 5: Simulation result for the micro calcifications image analysis
Fig. 6 shows the grouping division process steps for the primary dataset. In this work, clustering image are obtained during the evaluation process image (a) is the original image, and the image (b) is the pre-processing image, and the (c, d) image shows the different clusters are utilized for VKC clustering segmentation technique segmentation by which the primary data is separated and after that distinguishing the distinctive parts are classified using Contiguous Convolutional Neural Network (CCNN).
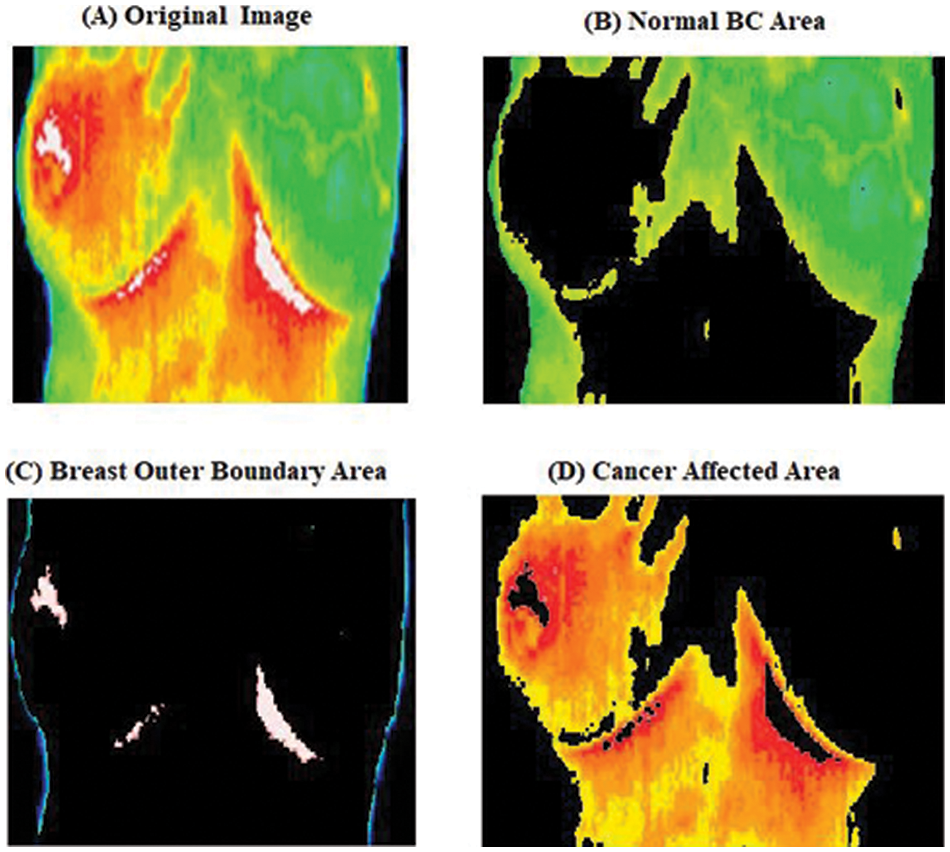
Figure 6: Clustering image
Tab. 1 represents the breast cancer detection based on different BC stage analysis. By analyzing the five different normal breast image the cancer stages are predicted which is described in the above table. This work also analyses the ER and PR based on the color texture analysis which is obtained in classification results.
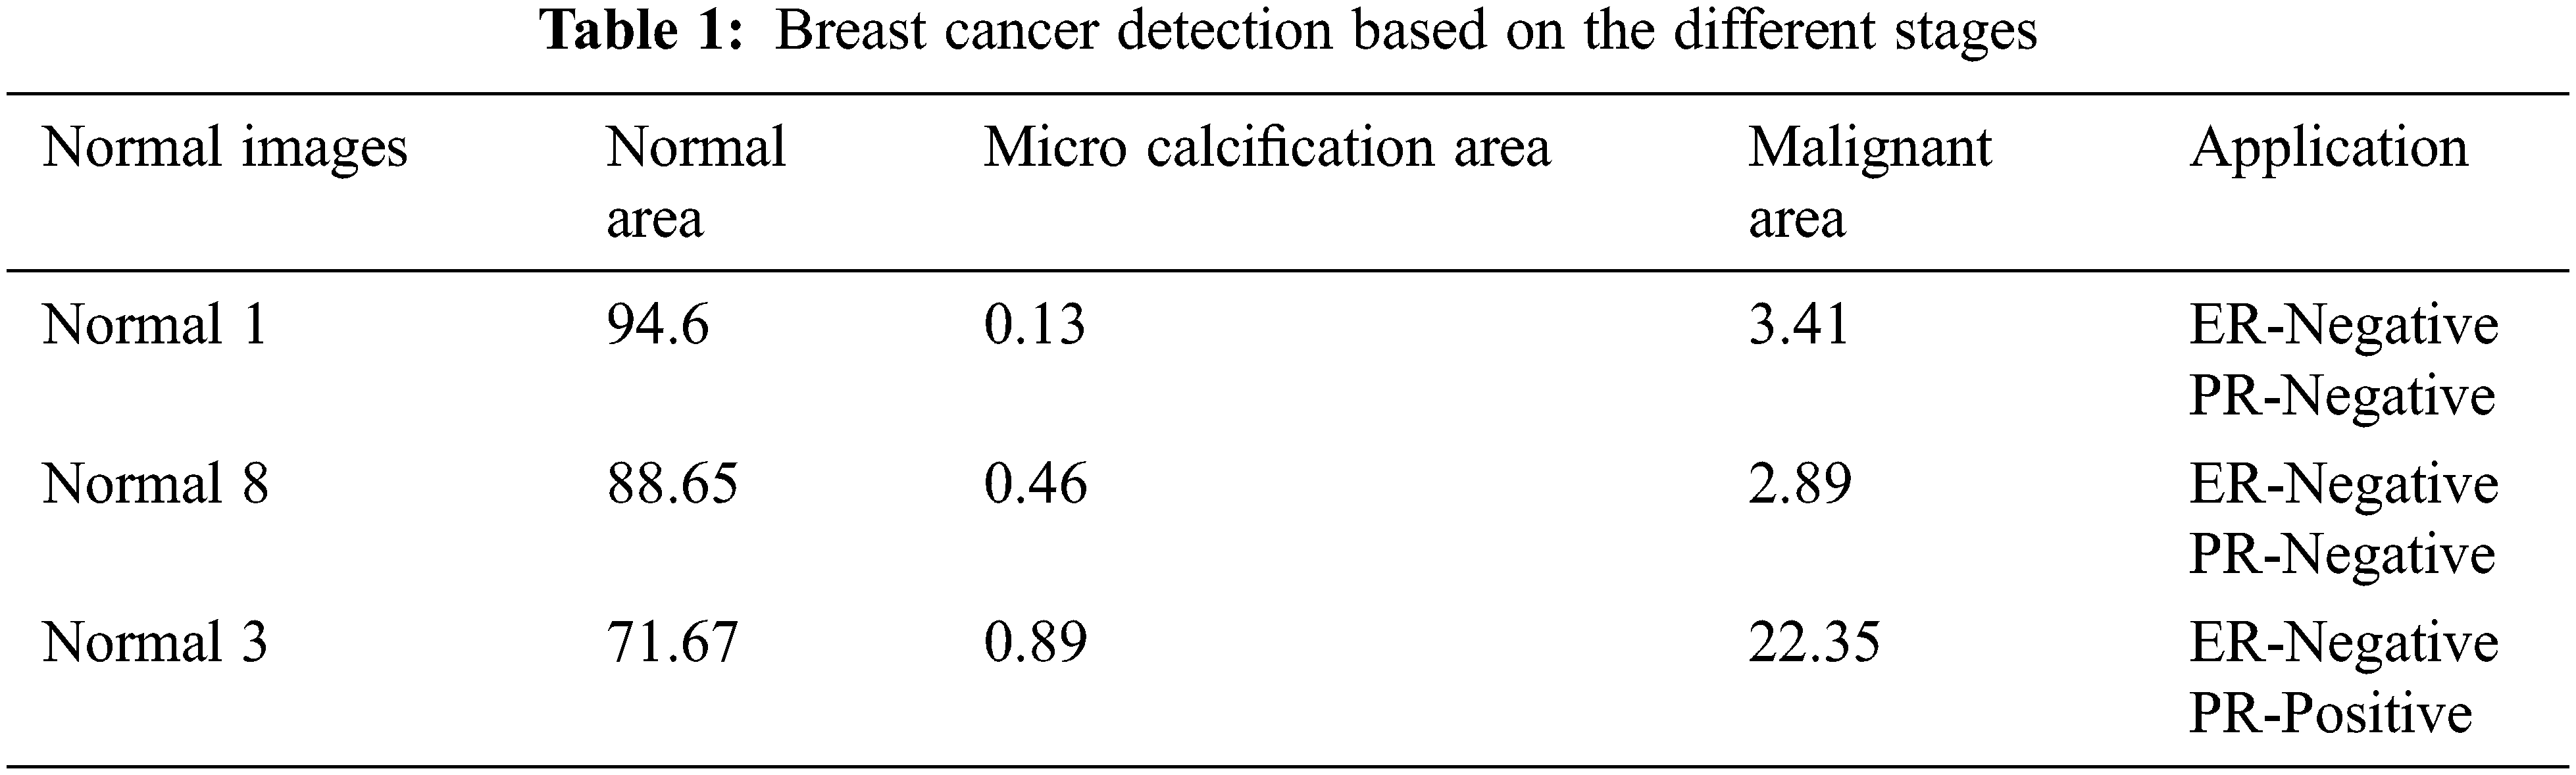
Fig. 7 illustrate the breast cancer detection stages for normal, using five different normal images the breast cancer stages like normal, Micro calcification and Malignant area values described in above graph.
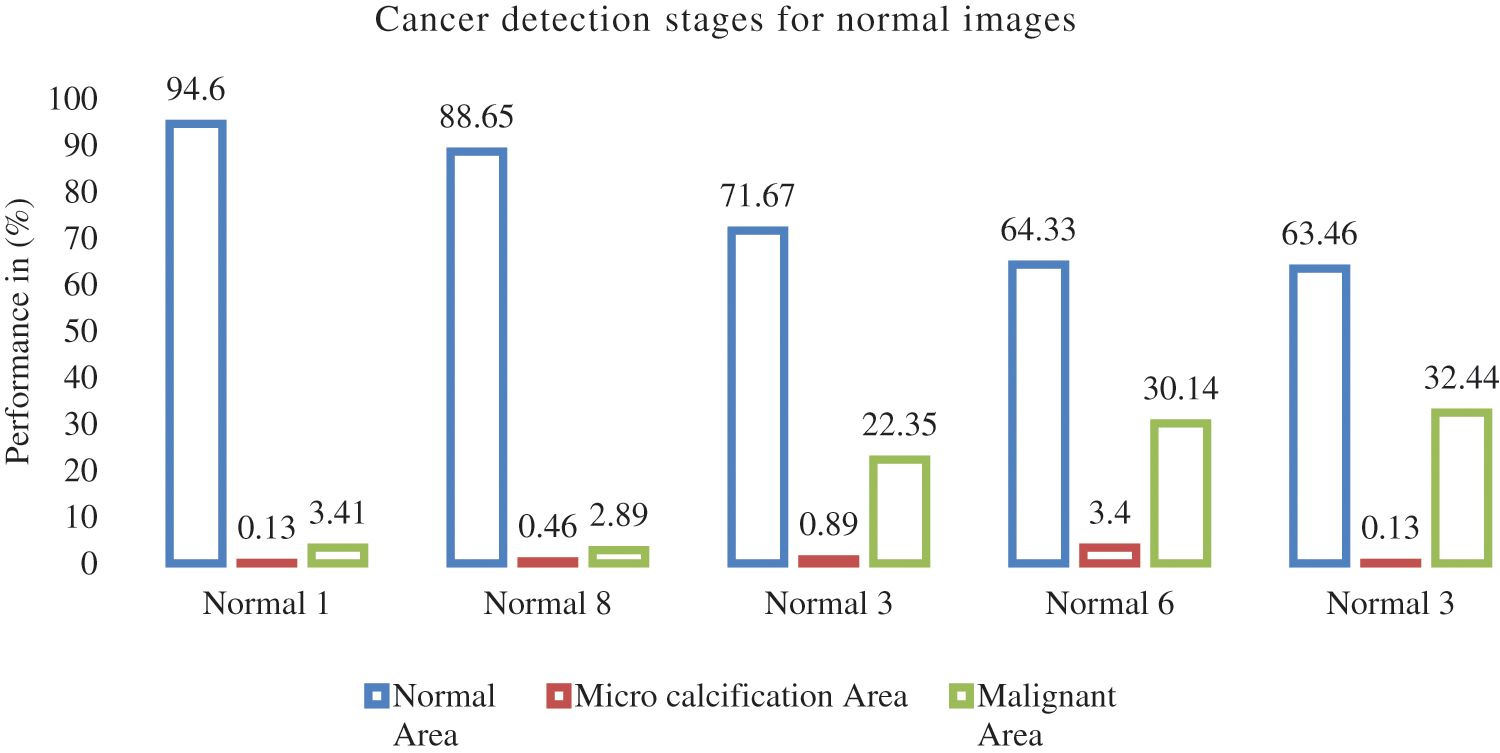
Figure 7: Breast cancer detection stages for normal images
Fig. 8 compares several malignant models, focusing on the functions of various classifications like precision, recall and F-measure.
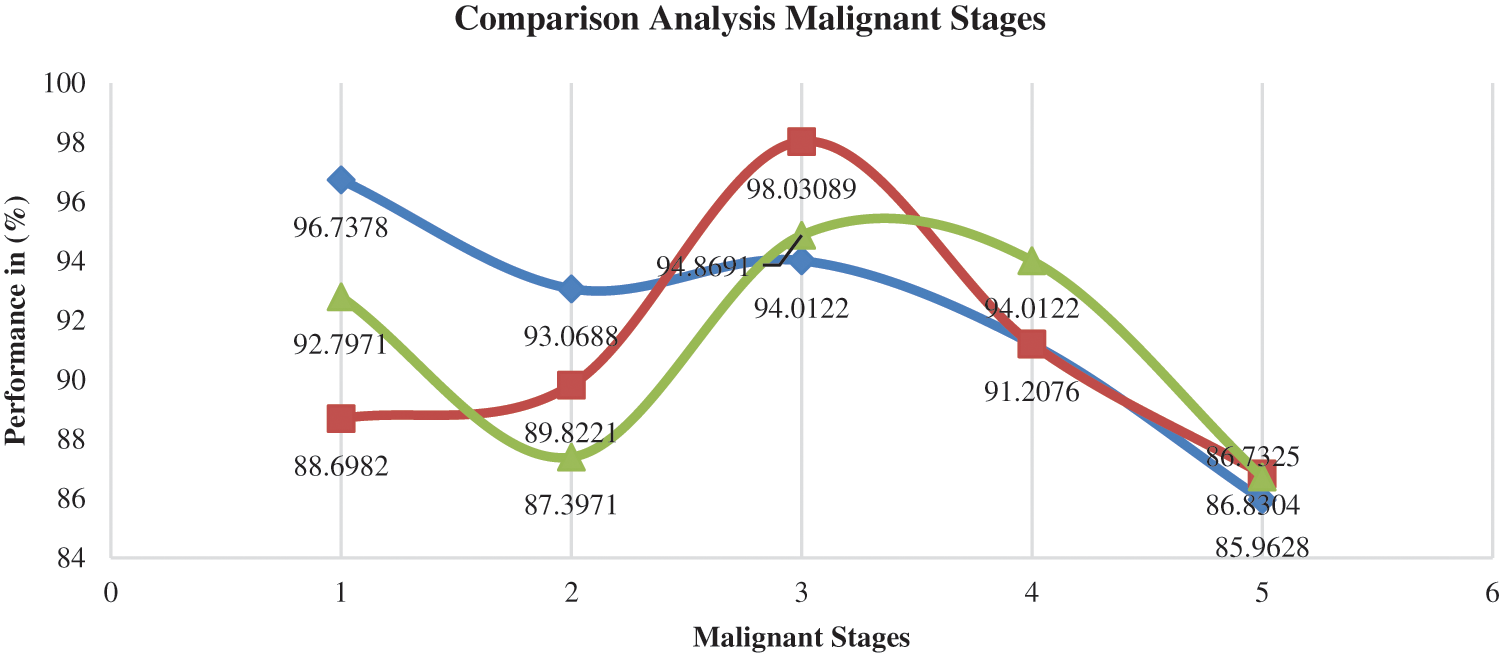
Figure 8: Comparison analysis for different malign sample
Fig. 9 shows the comparison result on false classification rate produced by three methods: Artificial Neural Network (ANN), Convolutional Neural Network Dynamic Multi-Layer Perceptron Feed Forward Neural Network-FFNN) As a result, the proposed CCNN produces less false ratio compared with other techniques.
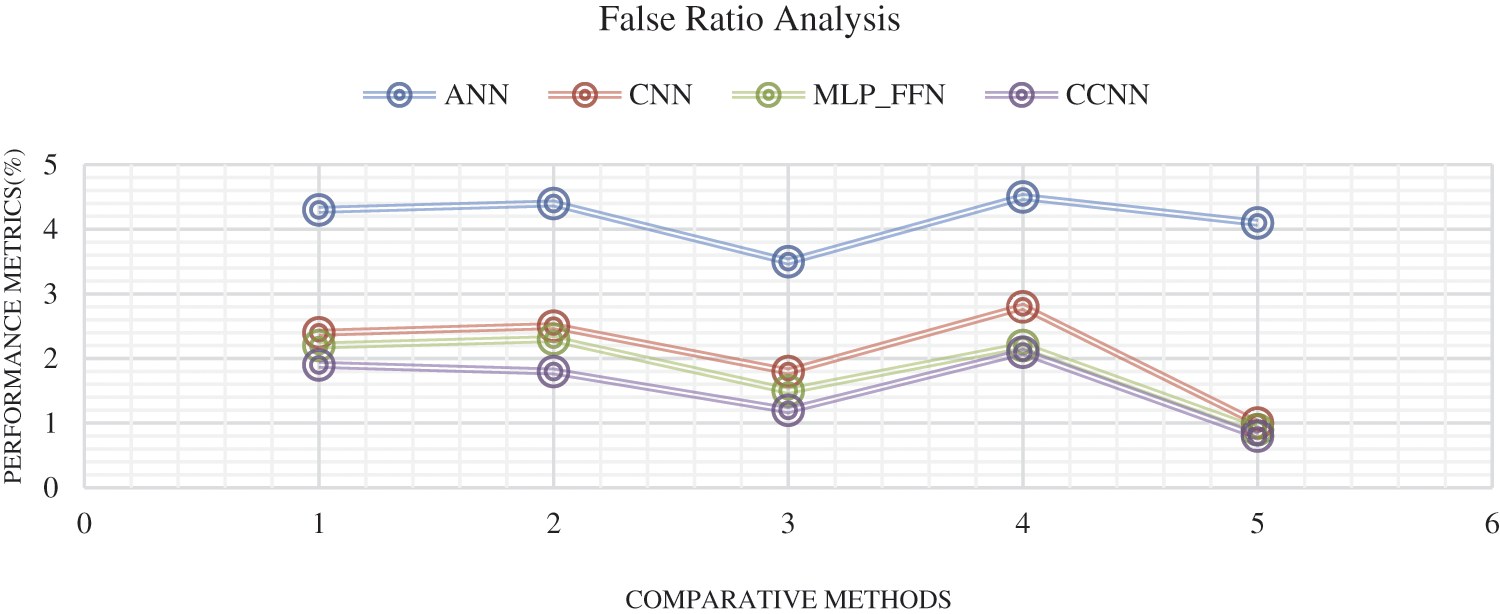
Figure 9: False classification ratio
In this work, MATLAB Simulation 2017b software effectively explores the early stages of breast cancer. Mammogram images are classified according to different images: benign, malignant, normal and highly suspicious. After obtaining the original image, it will be a pre-processing technique that will reduce noise; in the mammogram image. The second stage can use the advanced Versatile K-means clustering (VKC) algorithm segmentation-based detection of a suspicious mass area. The different features are then analyzed in the segmentation images. The feature values are provided as the Versatile K-means clustering (VKC) segmentation algorithm for cancer detection in the breast area. The different features are then analyzed in the segmentation images, and the values are provided as the trained Contiguous Convolutional Neural Network (CCNN) classifier. Based on the (true/false positive and negative) ratio, the normal (non-cancerous) and malignant (cancerous) categories will be identified. The performance analysis of the proposed CCNN strategy achieved 97.56% success and the combination of features to provide the lowest error rate of 0.8%. Future work will concentrate on the classification neural network structure and reduce the error ratio and improved accuracy and also improve into the dataset’s values and producing more enhanced. This research may aid in the development of more effective and reliable illness prediction and diagnostic systems, which will help with the development of a better healthcare system by decreasing overall costs, time, and death rates.
Funding Statement: The authors received no specific funding for this study.
Conflicts of Interest: The authors declare that they have no conflicts of interest to report regarding the present study.
References
1. J. G. Melekoodapattu, P. S. Subbian and M. P. F. Queen, “Detection and classification of breast cancer from the digital mammogram using hybrid extreme learning machine classifier,” International Journal of Imaging Systems and Technology, vol. 32, no. 2, pp. 564–574, 2021. [Google Scholar]
2. L. Shen, L. R. Margolies and J. H. Rothstein, “Deep learning to improve Breast cancer detection on screening mammography,” Scientific Reports, vol. 9, no. 1, pp. 12495, 2019. [Google Scholar]
3. I. Sechopoulos, J. Teuwen and R. Mann, “Artificial intelligence of breast cancer detection in mammography and digital breast tomosynthesis: State of the art,” Seminars in Cancer Biology, vol. 72, pp. 214–225, ISSN 1044-579X, 2020. [Google Scholar]
4. A. Fanizzi, T. M. Basile and L. Losurdo, “A machine learning approach on multi-scale texture analysis for breast micro calcification diagnosis,” BMC Bioinformatics, vol. 21, no. 91, pp. 25–27, 2020. [Google Scholar]
5. S. Reis, P. Gazinska, J. H. Hipwell, T. Mertzanidou, K. Naidoo et al., “Classification of breast cancer stroma as a tool for prognosis,” Medical Imaging 2016: Digital Pathology, Proc. of SPIE, vol. 9791, pp. 979105, 2016. [Google Scholar]
6. P. Ganesh Kumar, M. S. Kavitha and B. C. Ahn, “Automated detection of cancer associated genes using a combined fuzzy-rough-set-based F-information and water swirl algorithm of human gene expression data,” PLOS ONE, vol. 9, no. 12, pp. e0167504, 2016. [Google Scholar]
7. S. Pacile, J. Lopez, P. Chone, T. Bertinotti, J. M. Grouin et al., “Improving breast cancer detection accuracy of mammography with the concurrent use of Artificial Intelligence tool,” Radiology: Artificial Intelligence, vol. 2, no. 6, pp. e190208, 2016. [Google Scholar]
8. Y. Chen, M. Ali, S. Shi and U. K. Cheang, “Bio sensing-by-learning direct targeting strategy for enhanced tumor sensitization,” IEEE Transition on Nano Bioscience, vol. 18, no. 3, pp. 1, 2019. [Google Scholar]
9. X. Wang, G. Liang, Y. Zhang, H. Blanton, Z. Bessinger et al., “Inconsistent performance of deep learning model on mammogram classification,” Journal of the American College of Radiology, vol. 17, no. 6, pp. 796–803, 2020. [Google Scholar]
10. A. Cruz-Bernal, M. M. Flores-Barranco, D. L. Almanza-Ojeda, S. Ledesma and M. A. Ibarra-Manzano, “Analysis of the cluster prominence feature for detecting calcifications in mammograms,” Journal of Healthcare Engineering, vol. 2018, pp. 1–11, 2018. [Google Scholar]
11. B. Zheng, Y. Qiu, F. Aghaei, S. Mirniaharikandehei, M. Heidari et al., “Developing global image feature analysis models to predict cancer risk and prognosis,” Visual Computing for Industry, Biomedicine, and Art, vol. 2, no. 1, pp. 17, 2019. [Google Scholar]
12. H. Hofener, A. Homeyer, N. Wesis, J. Molin, C. F. Lundstrom et al., “Deep learning nuclei detection: A simple approach can deliver state-of-the-art results,” Computerized Medical Imaging and Graphics, vol. 70, pp. 43–52, 2018. [Google Scholar]
13. T. M. A. Basile, A. Fanizzi, L. Losurdo, R. Bellotti, U. Bottigli et al., “Micro calcification detection in full-field digital mammograms: A fully automated computer-aided system,” Physical Medical, pp. 1–9, ISSN 1120-1797, 2019. [Google Scholar]
14. A. C. Phadke and P. P. Rege, “Fusion of local and global features for classification of abnormality in mammograms,” Indian Academy of Sciences, vol. 41, no. 4, pp. 385–395, 2016. [Google Scholar]
15. V. R. Udupi, S. S. Tamboli, V. A. Patil and A. S. Tamboli, “Histopathological image analysis for BC diagnosis: A review,” IEEE Reviews in Biomedical Engineering, vol. 2, no. 4, pp. 164–170, 2011. [Google Scholar]
16. S. Suganthi and S. Ramakrishnan, “Semi-automatic segmentation of breast thermal images using the variation level set method,” in 15th Int. Conf. on Biomedical Engineering, Singapore, Springer, vol. 43, pp. 231–234, 2014. [Google Scholar]
17. C. Lipari and J. Head, “Advanced infrared image processing for BC risk assessment,” in Proc. 19th Int. Conf. IEEE/EMBS, Chicago, IL, pp. 673–676, 1997. [Google Scholar]
18. S. S. Srinivasan and R. Swami Nathan, “Segmentation of breast tissues in infrared images using modified phase-based level sets,” in Biomedical Informatics and Technology, Berlin: Springer, pp. 161–174, 2014. [Google Scholar]
19. Q. Zhou, Z. Li and J. K. Aggarwal, “Boundary extraction in thermal images by edge map,” in ACM Symp. on Applied Computing, Nicosia, Cyprus, pp. 254–258, 2004. [Google Scholar]
20. S. Kostopoulos, D. Cavouras, A. Daskalakis, P. Bougioukos, P. Georgiadis et al., “Color-texture based image analysis method for assessing the hormone receptors status in breast tissue sections,” in 29th Annual Int. Conf. of the IEEE Engineering in Medicine and Biology Society, Lyon, France, pp. 4985–4988, 2007. [Google Scholar]
21. H. Bozkurt and A. Taşyapi Celebi, “Gaussian filter based digital detail enhancement in thermal images,” in 29th Signal Processing and Communications Applications Conf., Istanbul, Turkey, pp. 1–4, 2021. [Google Scholar]
22. M. V. Sainz de Cea, R. M. Nishikawa and Y. Yang, “Estimating the accuracy level among individual detections in clustered micro calcifications,” IEEE Transactions on Medical Imaging, vol. 36, no. 5, pp. 1162–1171, 2017. [Google Scholar]
23. S. Rana, R. Hampson and G. Dobie, “Breast cancer: Model reconstruction and image registration from segmented deformed image using visual and force based analysis,” IEEE Transactions on Medical Imaging, vol. 39, no. 5, pp. 1–11, 2019. [Google Scholar]
24. F. Xing, F. Xie and L. Yang, “An automatic learning-based framework for robust nucleus segmentation,” IEEE Transactions on Medical Imaging, vol. 35, no. 2, pp. 550–566, 2015. [Google Scholar]
25. J. Mordang, A. Gubern-Mérida, A. Bria, F. Tortorella, R. Mann et al., “The importance of early detection of calcifications associated with breast cancer in screening,” Breast Cancer Research and Treatment, vol. 167, no. 2, pp. 451–458, 2018. [Google Scholar]
26. Z. Suhail, E. Denton and R. Zwiggelaar, “Classification of micro-calcification in mammograms using scalable linear fisher discriminant analysis,” Medical and Biological Engineering & Computing, vol. 56, no. 8, pp. 1475–1485, 2017. [Google Scholar]
27. N. Wu, J. Phang, J. Park, Y. Shen, Z. Huang et al., “Deep neural networks improve radiologists performance in breast cancer screening,” IEEE Transactions on Medical Imaging, vol. 20, no. 11, pp. 1–11, 2019. [Google Scholar]
28. G. Bellizzi, O. M. Bucci, L. Crocco, M. Helbig, S. Ley et al., “Optimization of the working conditions for magnetic nanoparticle-enhanced microwave diagnostics of breast cancer,” IEEE Transactions on Biomedical Engineering, vol. 65, no. 7, pp. 1607–1616, 2018. [Google Scholar]
29. W. Sun, G. Z. Dai, X. R. Zhang, X. Z. He and X. Chen, “TBE-Net: A three-branch embedding network with part-aware ability and feature complementary learning for vehicle re-identification,” IEEE Transactions on Intelligent Transportation Systems, pp. 1–13, 2021. [Google Scholar]
30. W. Sun, L. Dai, X. R. Zhang, P. S. Chang and X. Z. He, “RSOD: Real-time small object detection algorithm in UAV-based traffic monitoring,” Applied Intelligence, vol. 92, no. 6, pp. 1–16, 2021. [Google Scholar]
Cite This Article
 Copyright © 2023 The Author(s). Published by Tech Science Press.
This work is licensed under a Creative Commons Attribution 4.0 International License , which permits unrestricted use, distribution, and reproduction in any medium, provided the original work is properly cited.
 Downloads
 Citation Tools