
 Submit a Paper
 Propose a Special lssue
 Open Access
ARTICLE

Intelligent Home Using Fuzzy Control Based on AIoT
1 Department of Information Technology, Takming University of Science and Technology, Taipei City, 11451, Taiwan
2 Department of Electrical Engineering, National Chin-Yi University of Technology, Taichung, 411030, Taiwan
* Corresponding Author: Wen-Tsai Sung. Email:
Computer Systems Science and Engineering 2023, 45(2), 1063-1081. https://doi.org/10.32604/csse.2023.028438
Received 10 February 2022; Accepted 30 March 2022; Issue published 03 November 2022
 View Full Text
 Download PDF
Abstract
The Internet of Things has grown rapidly in recent years, and the technologies related to it have been widely used in various fields. The idea of this paper is to build a set of Internet of Things systems in a smart home wireless network environment, with the purpose of providing people with a more comfortable, convenient, and safe life. In the sensing layer of the Internet of Things, we discuss the uses of common sensing technologies on the Internet and combine these with Arduino microprocessors to integrate temperature sensing modules, humidity sensing modules, gas sensing modules, and particulate matter 2.5 (PM2.5) sensing modules. In the network layer, we discuss using the Wi-Fi wireless networking function composed of a home router and a wireless Wi-Fi chip Espressif system 8266 (ESP8266) to transmit the collected home-sensing data to the ThingSpeak cloud database. Finally, in the application layer part, the system uses a mobile device with fuzzy calculation optimization software. The system is also connected remotely for home environment monitoring, so the home environment can be optimized anytime, anywhere.Keywords
With the continued growth of the Internet and various information and communication technologies, it is now possible to use sensing technology combined with network technology to collect various relevant data, for example about geology, water quality, vehicles, harmful suspended particles and harmful gases in the air, etc. The data collected can be integrated into a database, and all information can then be analyzed through big data techniques to inform responses or create applications. This is the concept of the Internet of Things (IoT). The IoT can make things easier and faster to manage. Microsoft founder Bill Gates mentioned the idea of the Internet of Things in his book “The Road to the Future” in 1995 and IBM also proposed the concept of “Smart Earth” in 2009. Countries and large enterprises have successively invested in and promoted the research on the IoT. As various advanced countries and large enterprises have joined the promotion of the IoT industry, the business opportunities of the IoT have emerged in many areas. Forrester Research, a market research organization, predicts that the business opportunities brought by the IoT in the future will exceed the current Internet output value by more than 30 times [1,2].
The content of this paper is roughly divided into three parts: sensor modules, software interface development and design of the app, and intelligent load control. The connection part uses a wireless network for data transmission. The sensor module uses an Arduino Mega 2560 as the main development board and the ATmega2560 chip as the core design module, combined with temperature and humidity sensor, gas sensor, suspended particulate PM2.5, and a fire sensor. These collect various environmental sensing data in the home, and transmit the relevant data to ThingSpeak (a cloud database platform) through the wireless communication module ESP8266 and the home router. In the software development and design part, the proposed method is to use the development environment of Massachusetts Institute of Technology (MIT) App Inventor 2 and use the simulator MIT AI2 Companion to simulate the application under design, so that users can view real-time information through mobile devices at any time, and the user can also use mobile devices to control the home load items in the home environment anytime, anywhere [3,4].
Finally, looking at intelligent load control, in addition to using the environmental protection agency (EPA) air quality website and related literature as the basis for air quality and comfort standards, this research also uses the theory of fuzzy control. The proposed system uses the collected home environment data to optimize the system by using the pre-built fuzzy rule database, and then automatically controlling the home appliances. For example, when the temperature at home is too hot, it will turn on the air conditioner or fan to cool down; when the indoor humidity is too high, it will turn on the dehumidifier; when it detects that the concentration of suspended particles in the air is too high, it will turn on the air purifier; when it detects that the concentration of carbon monoxide is too high, it will activate the buzzer and exhaust fan; and when a flame is detected, in addition to activating the buzzer, a warning message will also be sent to the mobile phone to notify the user [5,6].
2.1 Internet of Things Architecture
The IoT is a new network architecture based on the Internet combined with traditional networks to connect sensor technology, independent devices, and other items. In the IoT, the security of data, the management of the system, and the formulation of related communication standards can allow developers to use it as a design basis and reference. Therefore, the three layers of the sensing layer, network layer, and application layer are roughly defined in the IoT architecture, as shown in Fig. 1. At present, it has been widely used in areas such as IoT smart monitoring, aquaponics, real-time water quality monitoring, home care monitoring, smart grid, etc. The following will introduce the characteristics of the IoT layer model [7].

Figure 1: IoT architecture
The sensing layer is mainly composed of identification technologies such as radio frequency identification (RFID), near field communication (NFC), barcode, quick response code (QR code), etc.; wired sensors, such as temperature, humidity, gas, smoke, etc.; and wireless sensing devices, such as ultrasonic, infrared, etc. As the technology matures, the sensor usually has the advantages of small size, low cost, long life, and good function. The above-mentioned sensors are usually integrated with microprocessors and wireless communication chips, and the data collected by the sensors are transmitted to a cloud database through network transmission. The goal of the IoT is to bring convenience and provide services to users. IoT is a rapidly developing field, and, in particular, software innovation in the application layer is driving this. The application layer is where the application of data processing and human-computer interaction largely happens. Through software technology, combined with the information collected by the sensing layer and then transmitted from the network layer, the data is analyzed and processed to help users to make judgments and control systems; to realize intelligent management and operation; and to provide users with intelligent services. The fields of IoT applications are shown in Fig. 2 below:

Figure 2: IoT application areas
Wang et al. proposed the adaptive backstepping fuzzy neural controller method [8]. Fei et al. published related research on fuzzy multiple hidden layers neural [9]. Hou et al. proposed the study of adaptive type-2 fuzzy neural network [10]. Yu et al. propose a fuzzy system with data loss and bounded disturbance [11]. Kang et al. published papers on fuzzy and IoT [12]. Zhang et al. presented a study of robust 3-D medical watermarking data protection by wavelet transform [13], and at the same time they presented a robust reversible audio watermarking scheme for telemedicine and privacy protection [14].
The air quality index (AQI) is based on collecting data about concentrations of primary pollutants and derivative pollutants, such as that generated by transportation, surface dust, construction site dust, industrial emissions, agricultural animal husbandry, sand dust, and overseas migration in the air on that day [15]. The harm caused by various pollutants to human health is calculated individually and the index value is then set. In Fig. 3, the index value is shown along with the harm and impact of AQI value on human health.

Figure 3: The range value of AQI harm to human health
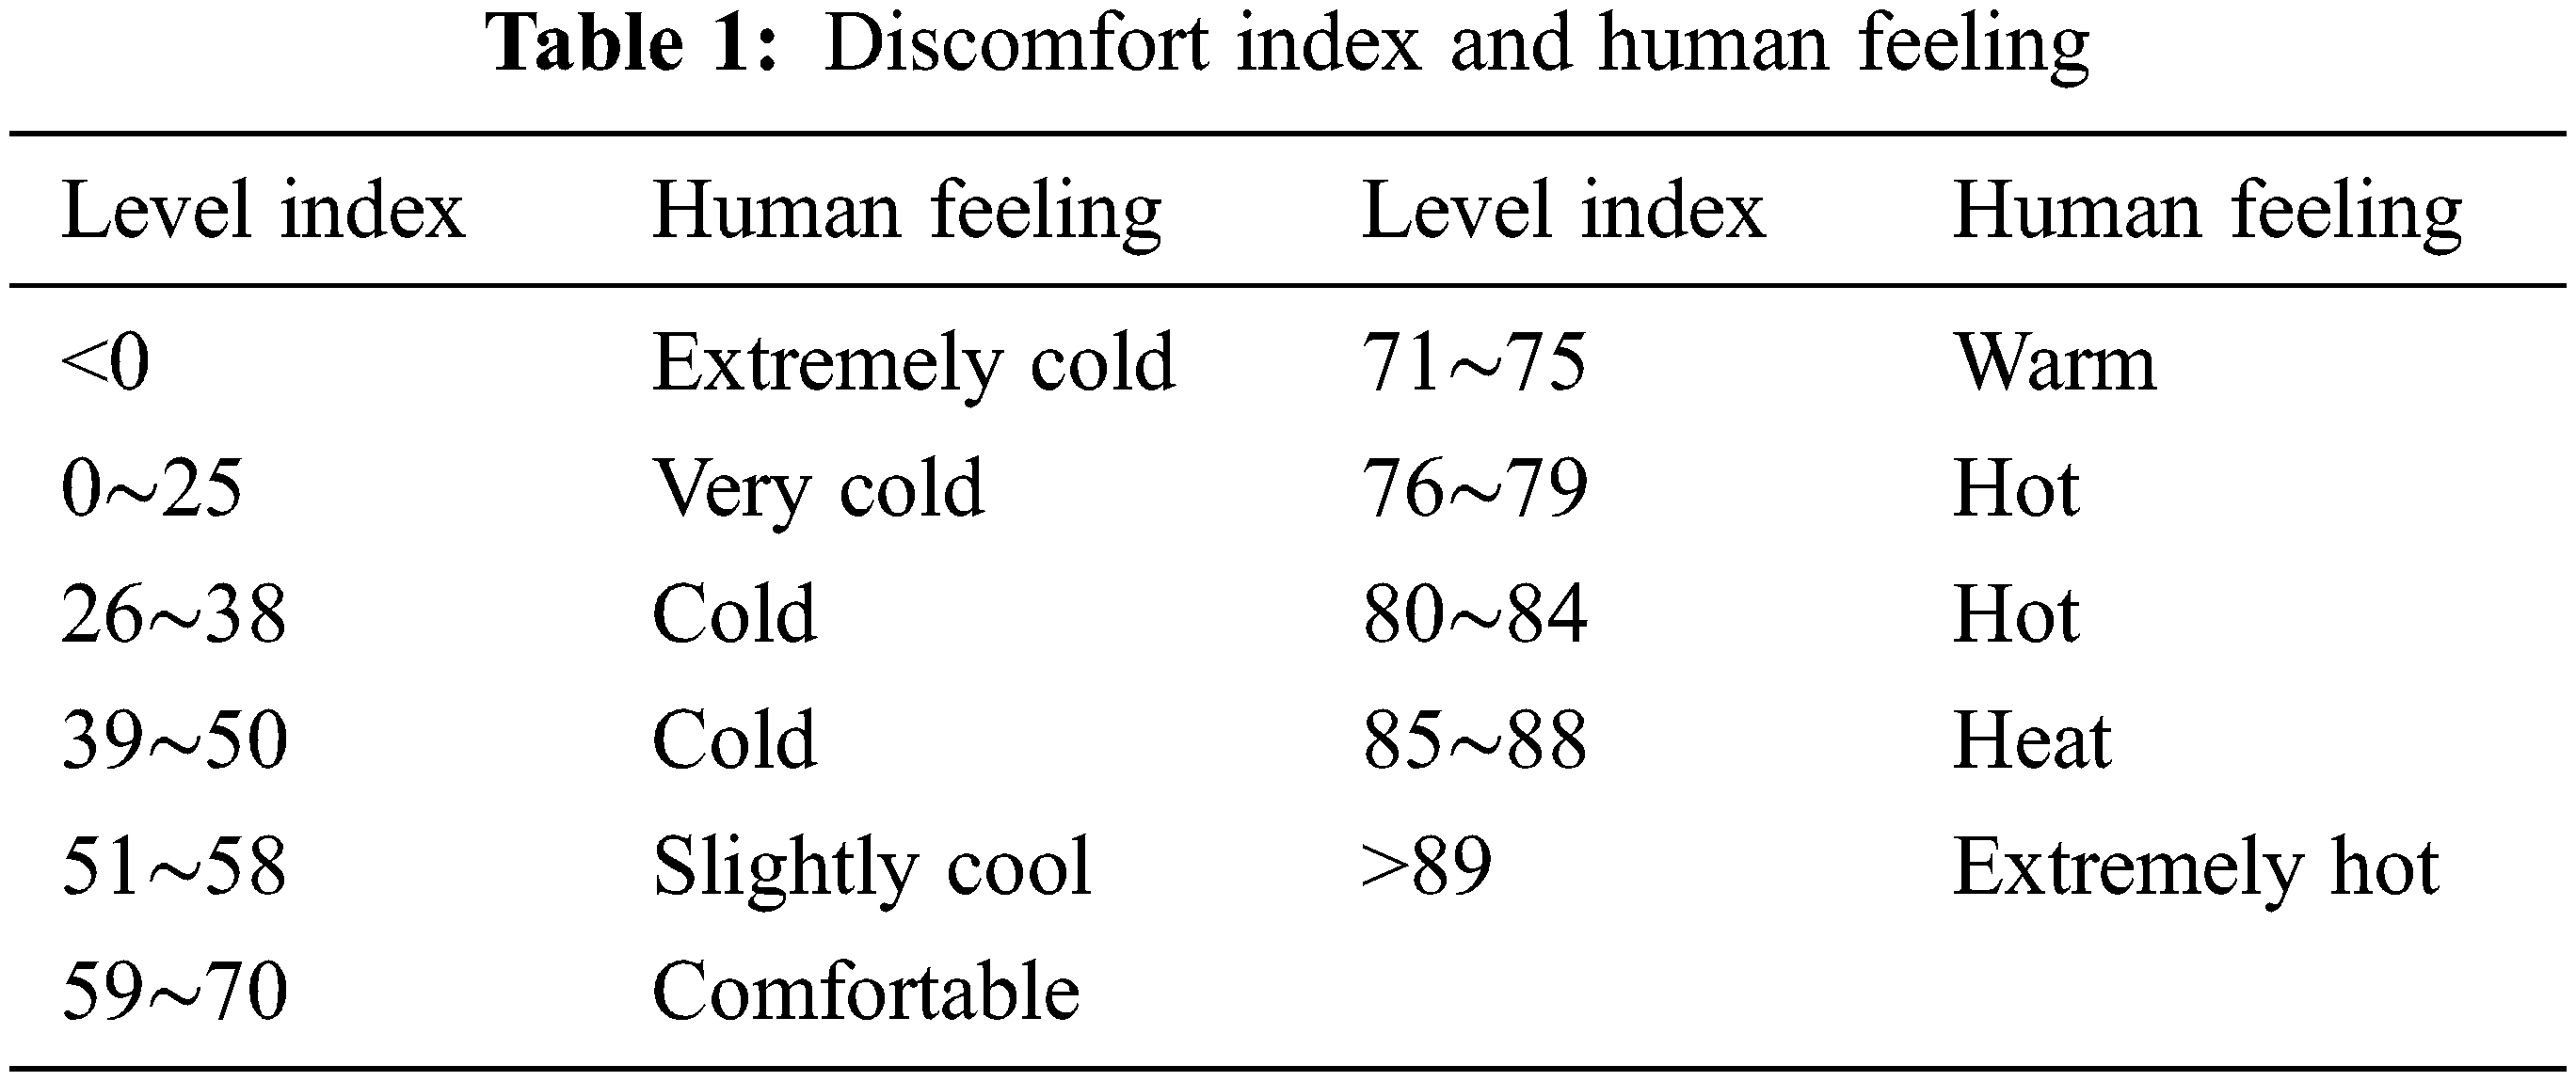
Humans are creatures with a constant body temperature. The temperature of the surrounding environment is the most important factor to enable the human body to maintain a constant temperature. Within a fixed range of temperature conditions, the body will adjust or adapt itself according to the changes in the surrounding temperature. Discomfort Index (DI) is advocated by American researchers Thom and Bosen, mainly for the design of indoor air conditioners. It indicates the degree of discomfort felt by the human body with changes in indoor ambient temperature and humidity. The calculation formula is as follows Eq. (1):
In the above formula, T is the ambient temperature (°C), RH is the relative humidity in the air (%), and DI is the combined effect of temperature and humidity on the human body. The DI index of each level and how this feels to us (human feeling) are shown in Tab. 1:
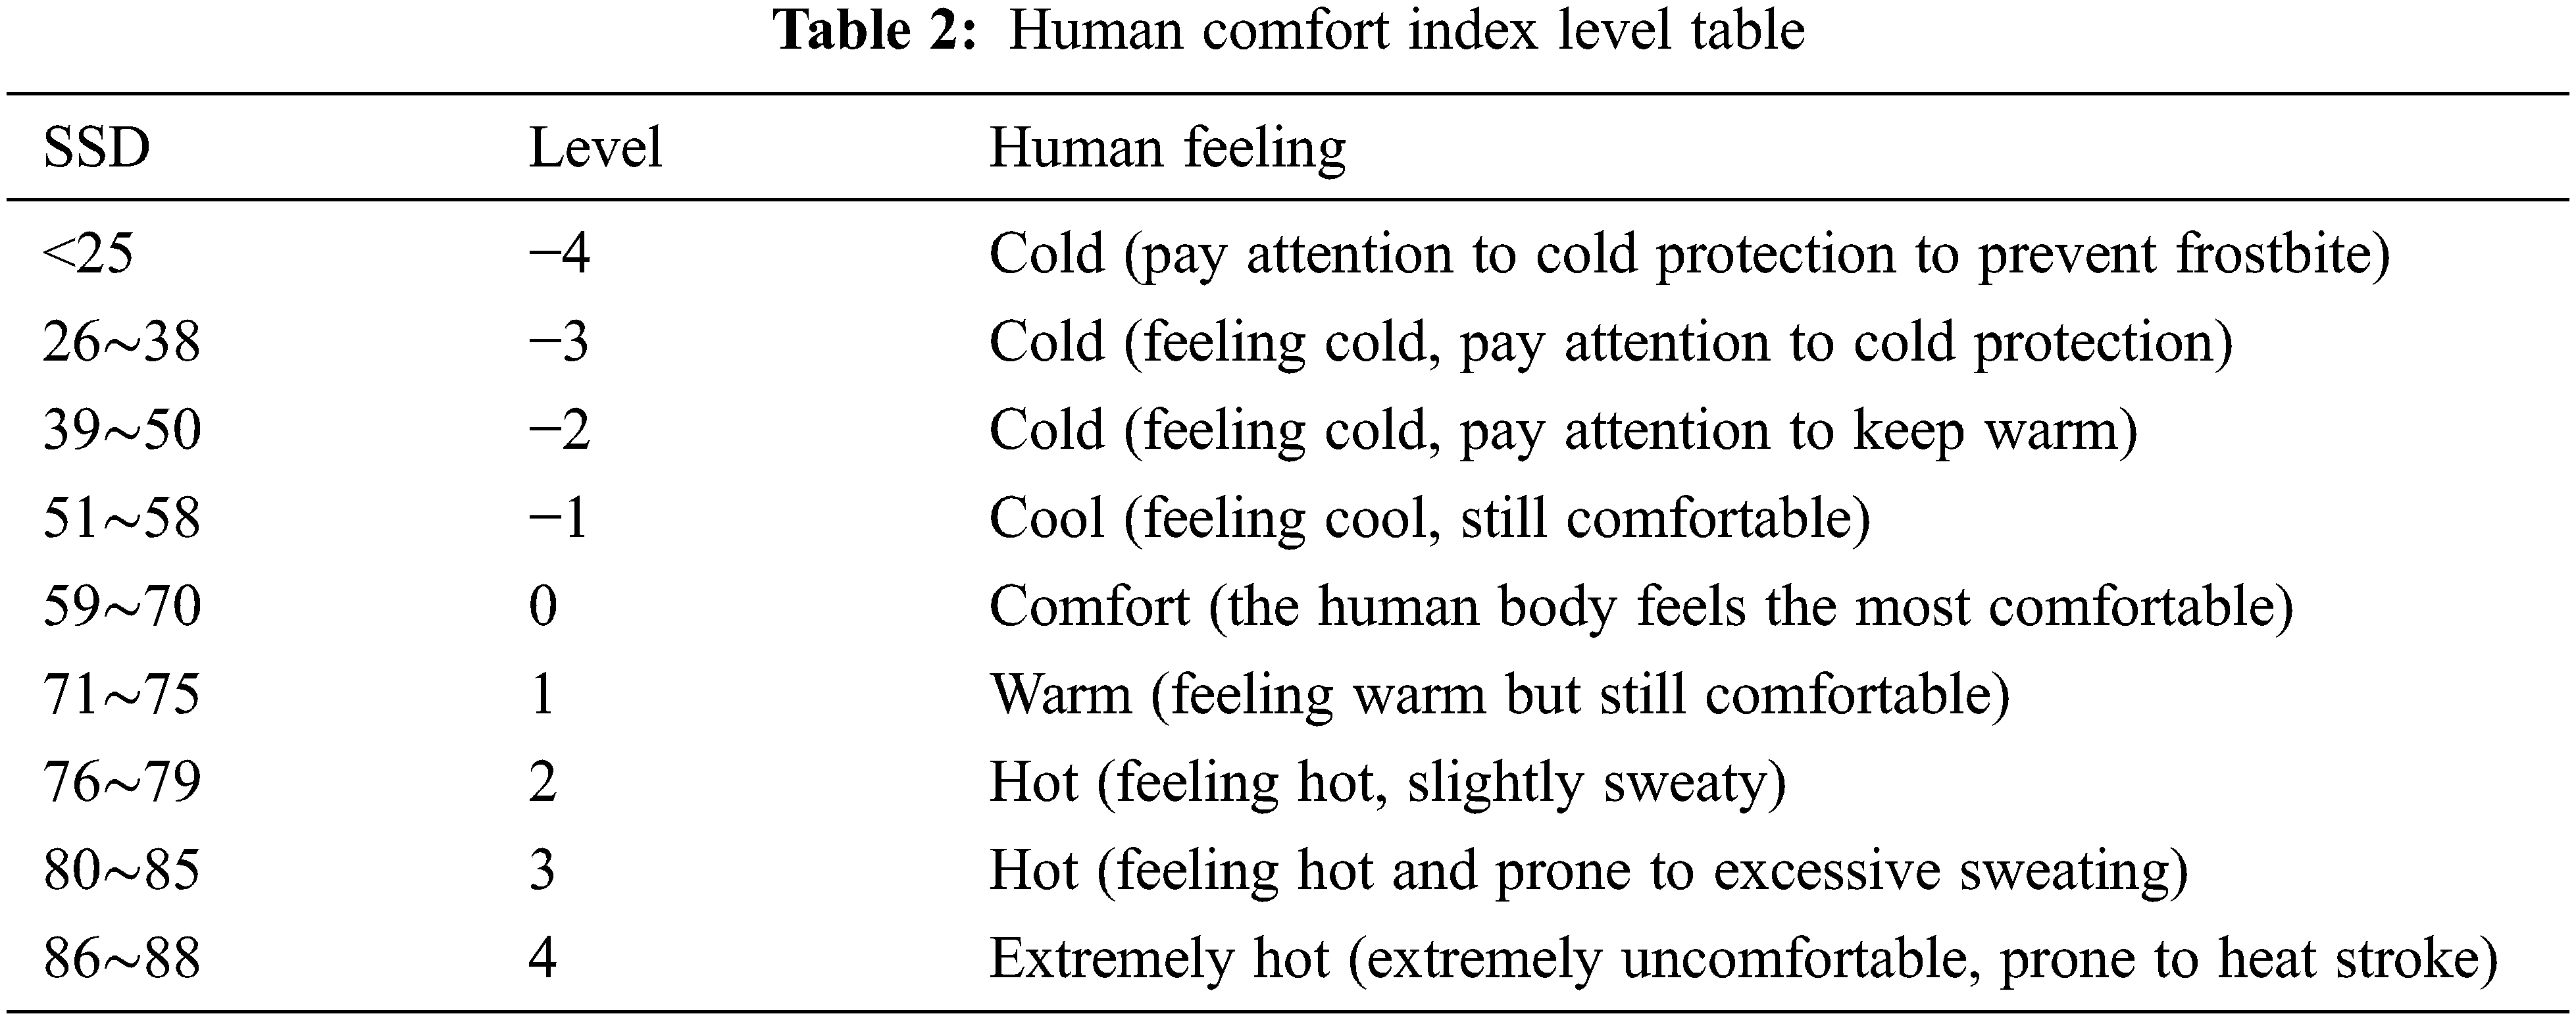
The comfort index of the human body is called SSD. SSD is a commonly used comfort calculation formula, which is mainly based on weather forecast data. The SSD value is calculated using climate factors such as weather temperature, humidity and average wind speed, and reflects the comfort level of the human body to the climate environment. The formula is as follows Eq. (2):
In the above formula, T is the weather temperature (°C.), RH is the humidity (%), and v is the average wind speed (m/sec). Human comfort can be divided into 9 levels as shown in Tab. 2 The further from zero the level value, the greater the impact of climate conditions on human comfort, and the greater the physical discomfort: the nearer to zero the level value, the better the physical comfort.
The most common comfort index in weather forecasts is the comfort index, which takes into account the relationship between the human body’s thermal balance and calculates the changes in temperature and dew point temperature into a comfort index. The calculation formula for temperature humidity index (THI) is as follows Eq. (3):
In the above formula, T represents the temperature in Celsius, and Td represents the dew point temperature as Eq. (4).
The ThingSpeak cloud computing platform used in this study allows users to build a cloud database to suit their needs and upload the data generated by the sensors to this through the Internet to allow resource sharing, as shown in Fig. 4. In addition to reducing hardware costs, storing data in a cloud database can also reduce the possibility of data loss. It can also allow monitoring websites or mobile applications to use home temperature and humidity, gas concentration, suspended particles in the air, and other data from ThingSpeak. For example, the cloud analysis feature of the platform MATLAB is used here to automatically convert the sensor data uploaded to the database into graphs to help users understand the changes in the data. When there is a value to be updated in the cloud, the chart will also be automatically synchronized to the latest data [16].
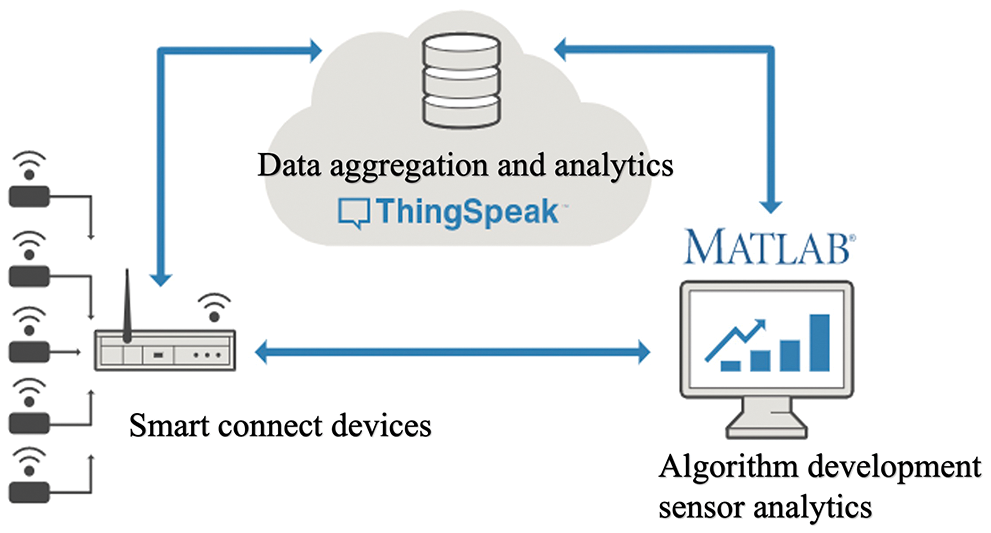
Figure 4: Cloud database diagram
If This, Then That (IFTTT) is an integrated network automation platform that has emerged in recent years. It can combine various APPs, connected devices and service software to complete many actions by linking various accounts (for example, community data, synchronization, information transmission, etc.), which can reduce the time for users to repeat operations or set the service content of a specific network according to user preferences. After a sensor in the system reaches a certain value or when the system status reaches the set condition value, the system will trigger another network service to respond. Since IFTTT can be flexibly set and applied in the context of the Internet according to the user’s preference, it has become a very practical application software. Its application architecture is shown in Fig. 5 below.
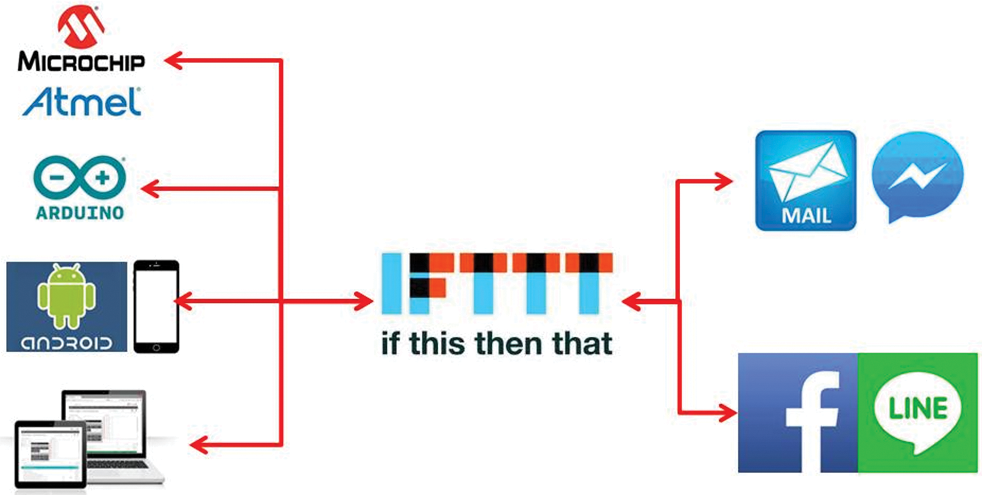
Figure 5: IFTTT application architecture diagram
This research will use PM2.5 and flame sensors to collect data and set when the detection data is too high and may cause harm to the body or a disaster, and using IFTTT, send a message to the communication platform LINE to notify users.
The overall architecture of the system in this paper is designed according to the three major layers of the IoT: the sensing layer, network layer, and load application control layer of home indoor (outdoor) environment monitoring, as shown in the system architecture diagram in Fig. 6. In the indoor (outdoor) environmental monitoring part, common sensors on the market such as a PM2.5 sensor (PMSA003), a temperature and humidity sensor (DHT22), a gas sensor (MQ-4), and a flame sensor are used, to collect indoor (outdoor) home environment monitoring data. At the network transmission level, the wireless communication chip ESP8266 is used to connect the microcontroller (Arduino Mega development board) and the home router. The system transmits the collected environmental monitoring data to the cloud server.
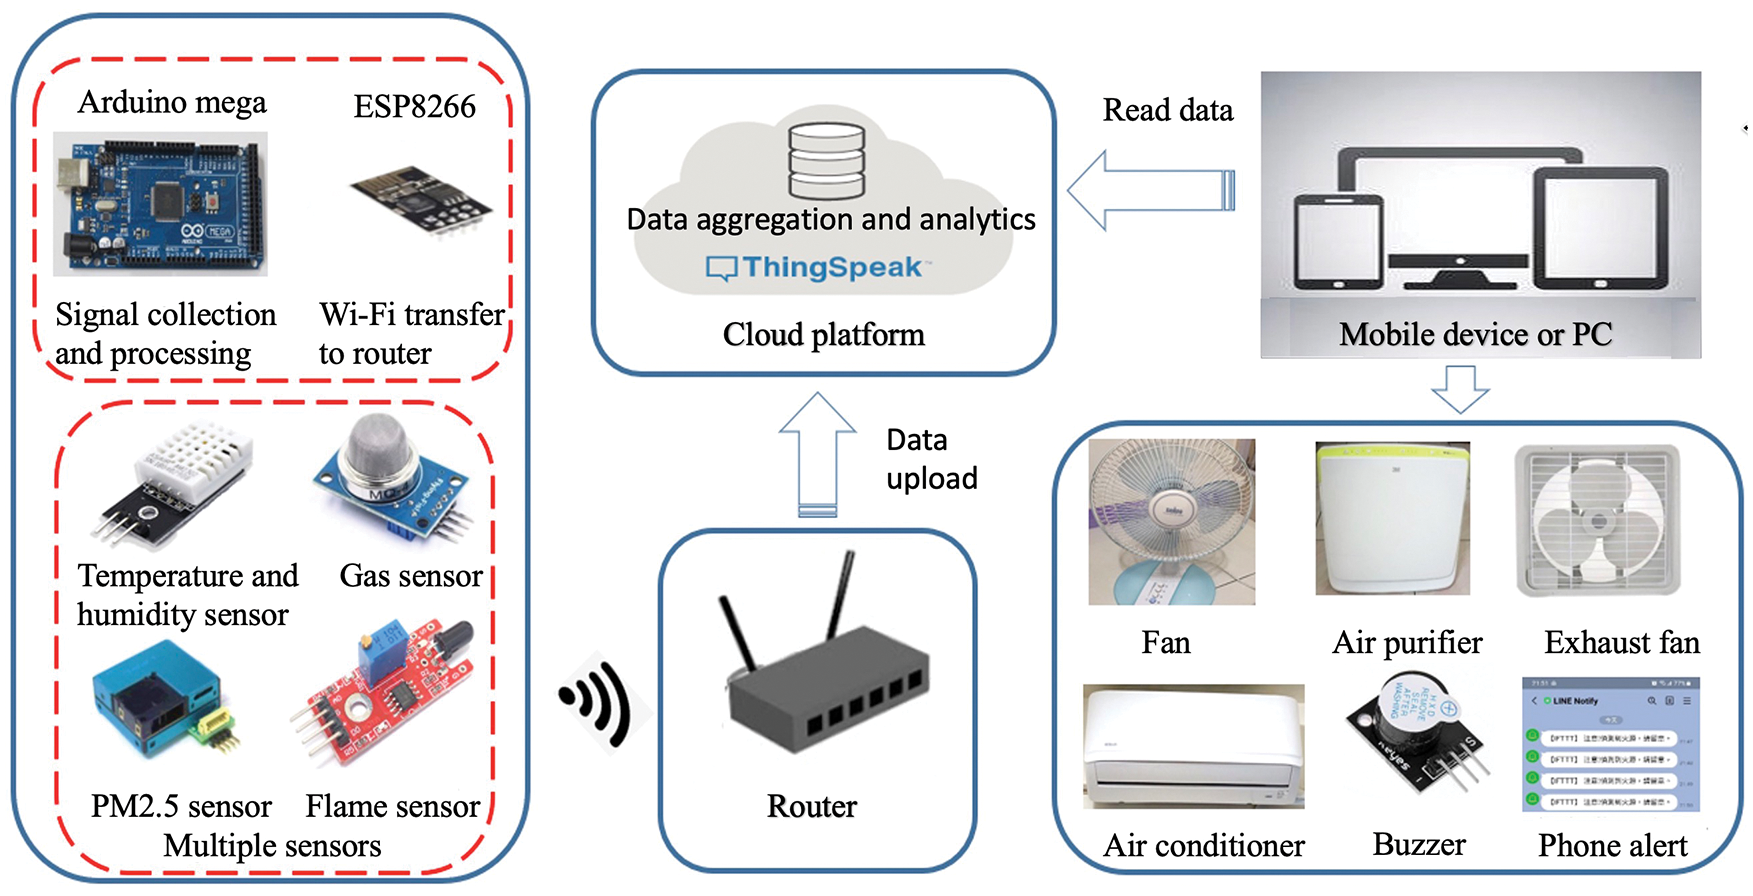
Figure 6: System architecture diagram
In the application layer part, there are data such as temperature and humidity changes, gas sensing, and so on. The system transmits data to the cloud database using the sensing layer and the network layer. The system uses the cloud analysis function of the ThingSpeak platform to perform calculations and create graphs. The data collected by the entire system can be automatically processed and updated according to the operator’s settings. Users can also use the mobile device app to monitor real-time data changes. Users can also control various devices, to better tailor the comfort of their homes to their needs [17].
The process of system environmental monitoring starts with the acquisition of home environmental data by the various sensors (temperature and humidity, gas, PM2.5, and flame), and then the Arduino development board will collect the environmental data through wireless communication. The chip ESP8266 is sent to the cloud database [18,19]. The ThingSpeak database is analyzed through the platform’s MATLAB software. The system automatically converts the data into a data map, and users can keep track of the changes in the data through their mobile device and this can also be used as a reference for improving the home environment, as shown in Fig. 7a.
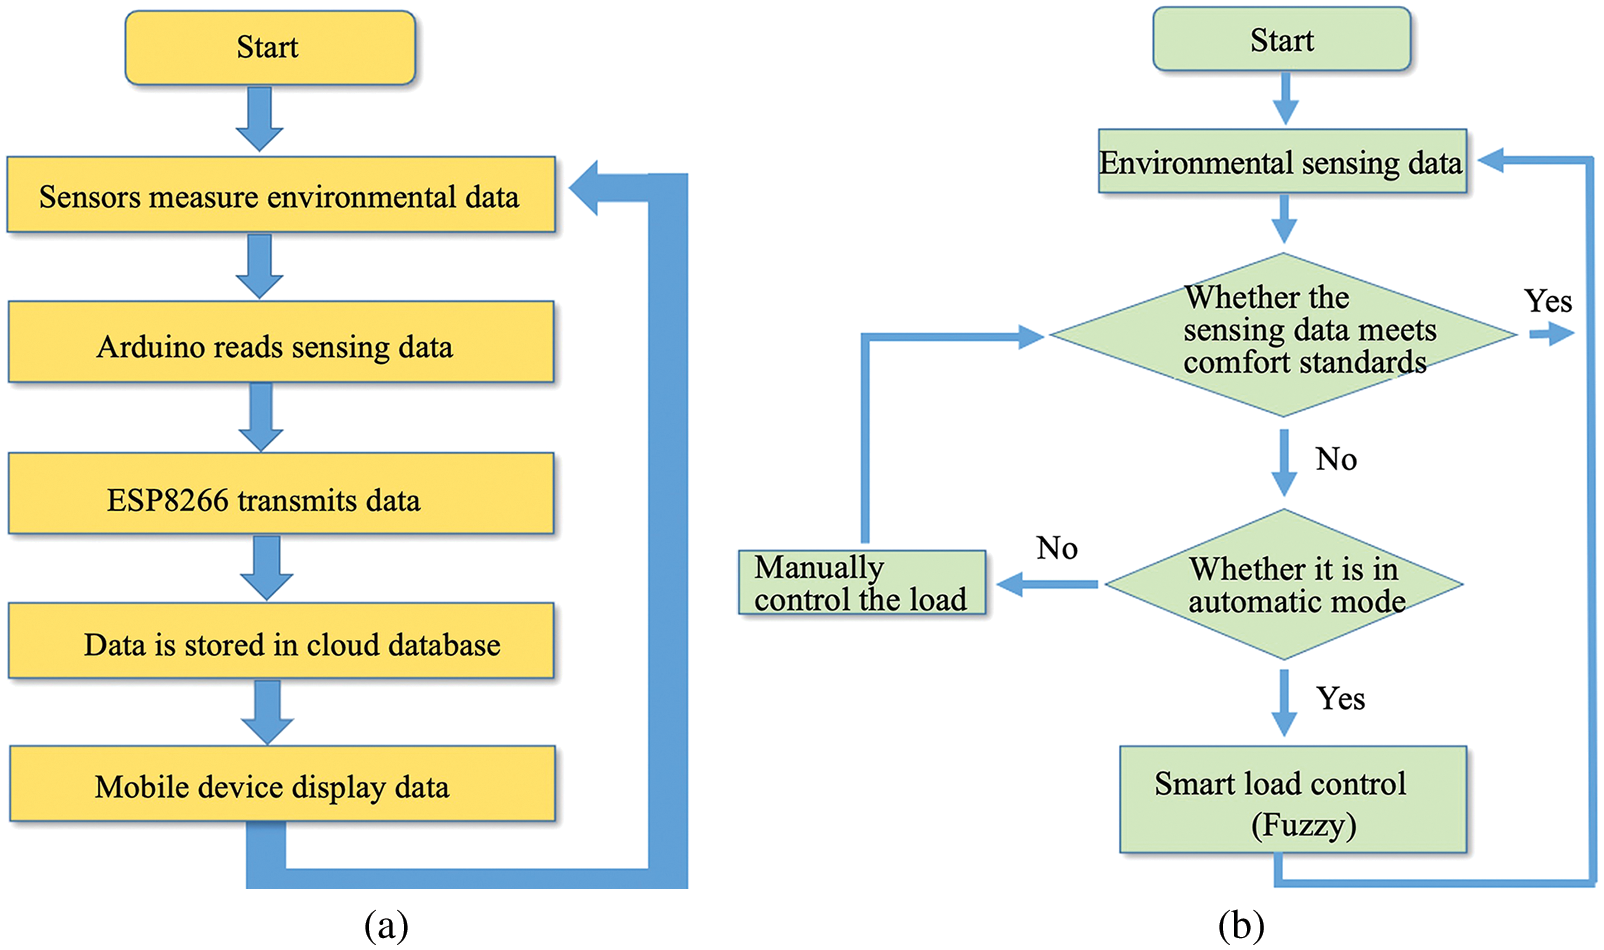
Figure 7: (a) Monitoring flow chart (b) Control flow diagram
The system control process, in addition to automatically managing the monitoring of the home environment through the ThingSpeak platform, allows users to control the changes in the comfort level of the home through the mobile device. In the automatic mode, the system in this paper uses the concept of fuzzy control as the reference for the setting of load activation. When the sensing data of the home environment does not meet the setting, the load will be automatically activated to achieve the ideal comfort level. The user manually controls the startup load, and the overall process is shown in Fig. 7b.
In this study, The Arduino Mega 2560 is used as the main development board. As shown in Fig. 8, this is built around an ATmega2560 chip that can support the connection of multiple devices, such as: computer, USB external power supply, sensors, communication modules, etc. The program development environment can be obtained from the official website, and the version can be selected according to user needs.
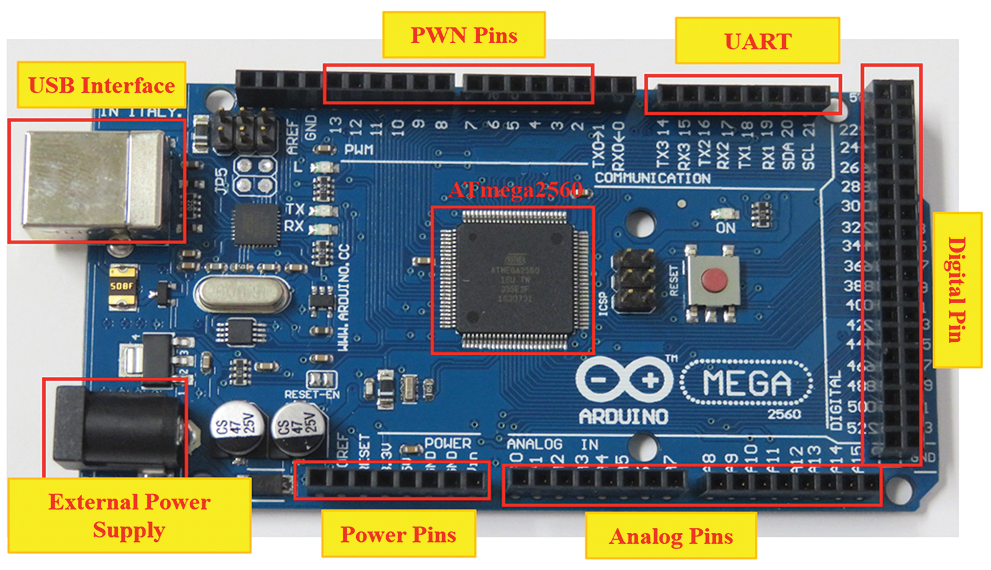
Figure 8: Arduino Mega 2560
The wireless communication module, ESP8266, used in this paper is shown in Fig. 9a. In use, ESP8266 has two modes: general mode and programming mode. The main difference is the wiring method of GPIO0 and GPIO2. It should be noted that ESP8266 uses 3.3 V voltage. If 5 V voltage is used, it will cause the module to overheat and burn. The ESP8266 is used to create a Wi-Fi interface for the Arduino and allow it to transfer data to the ThingSpeak database.
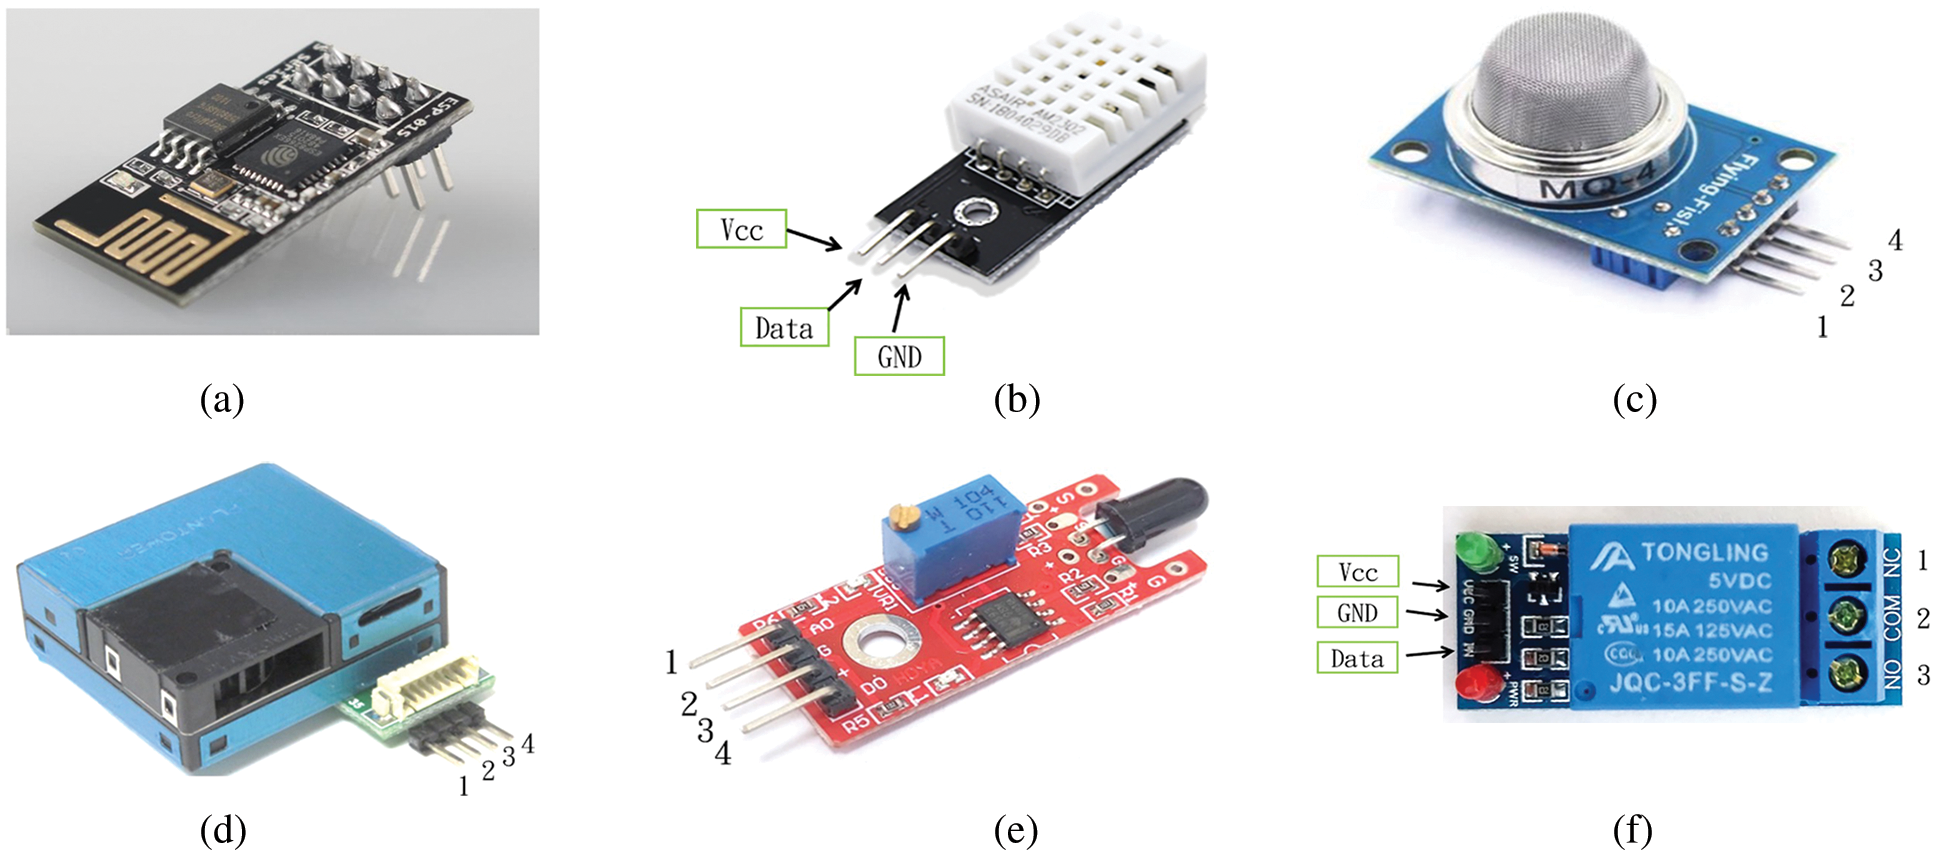
Figure 9: (a) ESP8266 wireless communication module (b) DHT22 sensor module (c) Gas sensor module (d) PMSA003 PM2.5 sensor module (e) Flame sensor module (f) Relay module
The DHT22 is a calibrated composite sensor that outputs a digital signal. DHT22 contains capacitive humidity sensing elements and high-precision temperature measuring elements and uses precise digital module collection technology to ensure better reliability and stability of the sensor. The temperature measurement range of DHT22 is between −40°C∼−80°C ± 0.5°C. The humidity measurement range of DHT22 is 0%∼100% RH ± 2%. The operating voltage of DHT22 is 3.3 V∼5.5 V. Compared with DHT11, it has the advantages of high accuracy, fast response speed, and good anti interference. The sensor is shown in Fig. 9b. The MQ-4 gas sensor used in this paper is an electrochemical type, as shown in Fig. 9c. Its operating principle uses the electrochemical oxidation and reduction reaction characteristics of toxic gases and flammable gases to detect the concentration of the gas to be measured. It can detect harmful gases such as carbon monoxide, hydrogen sulfide, hydrogen, and ammonia, and is also suitable for home methane leakage sensing. The suspended particulate sensor used in this paper is produced by PANTOG Company, the PMSA003 PM2.5, as shown in Fig. 9d. It can sense not only PM2.5 (fine suspended particles) but also PM1.0 (ultrafine suspended particles), PM10 (suspended particles), and dust particle concentration. These devices are multifunctional high-precision sensors. PMSA003 uses the laser scattering to detect the concentration of harmful particles in the air. It can continuously collect and calculate the number of suspended particles and particle concentration distribution of different particle sizes in the air per unit volume, further convert them into mass concentrations, and use general numbers. Fig. 9e shows the appearance of the flame sensor. The flame sensor can sense light sources with wavelengths ranging from 760 nm to 1100 nm. The distance measured with a lighter is about 80 cm. The farther away.
In this study, four groups of relay modules are used to perform the control of the related load equipment. When the relay is high, the green light will go out. This module has good anti interference, so it is often used for the control of electrical appliances in writers. The maximum output of the relay is 30 V/10A for DC and 250 V/10A for AC. This is shown in Fig. 9f.
4.1 Application of Fuzzy Control Theory
In environmental monitoring, if you want to achieve an ideal comfortable environment, the most important thing is to use the sensed environmental parameters and match the controllable load. Therefore, this study refers to the concept of fuzzy control to control the relevant load, and uses the Fuzzy function in the MATLAB software Multi-input Multi-output (MIMO) model. The system fuzzy structure diagram is shown in Fig. 10.
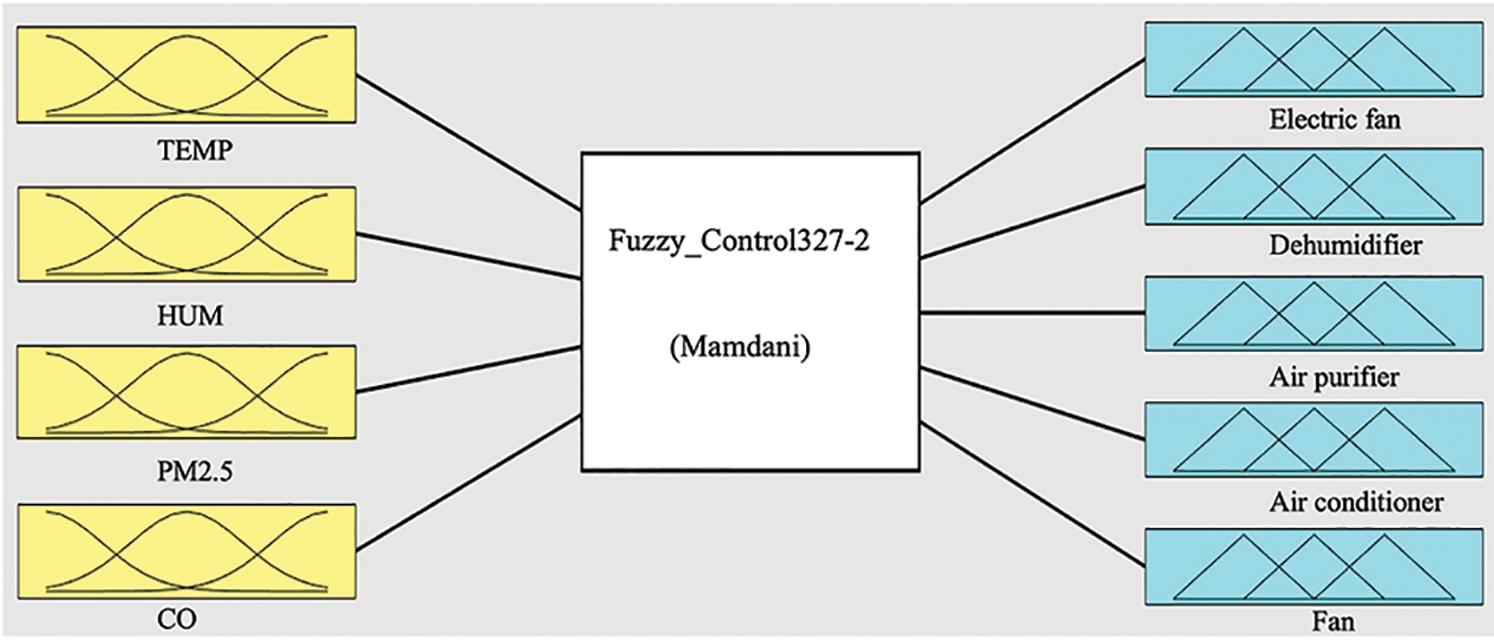
Figure 10: Fuzzy structure diagram
According to relevant references and comfort index data, the optimal comfort temperature range is 20°C to 26°C, so the system controls the comfort value within this range by means of fuzzy control. In the input part, according to the real-time collected temperature and humidity data, it is matched with the indoor air conditioner at the output end to control the temperature, and the electric fan can also be used to quickly cool down and help the indoor air circulation; when the indoor humidity is too high, a dehumidifier will come on to adjust the humidity; when the indoor (outdoor) PM2.5 suspended particulate concentration is too high, the home air purification equipment will be activated; and when the indoor carbon monoxide (CO) concentration is too high, the exhaust fan is activated, removing the harmful gas [20]. The fuzzy control flow chart is shown in Fig. 11.
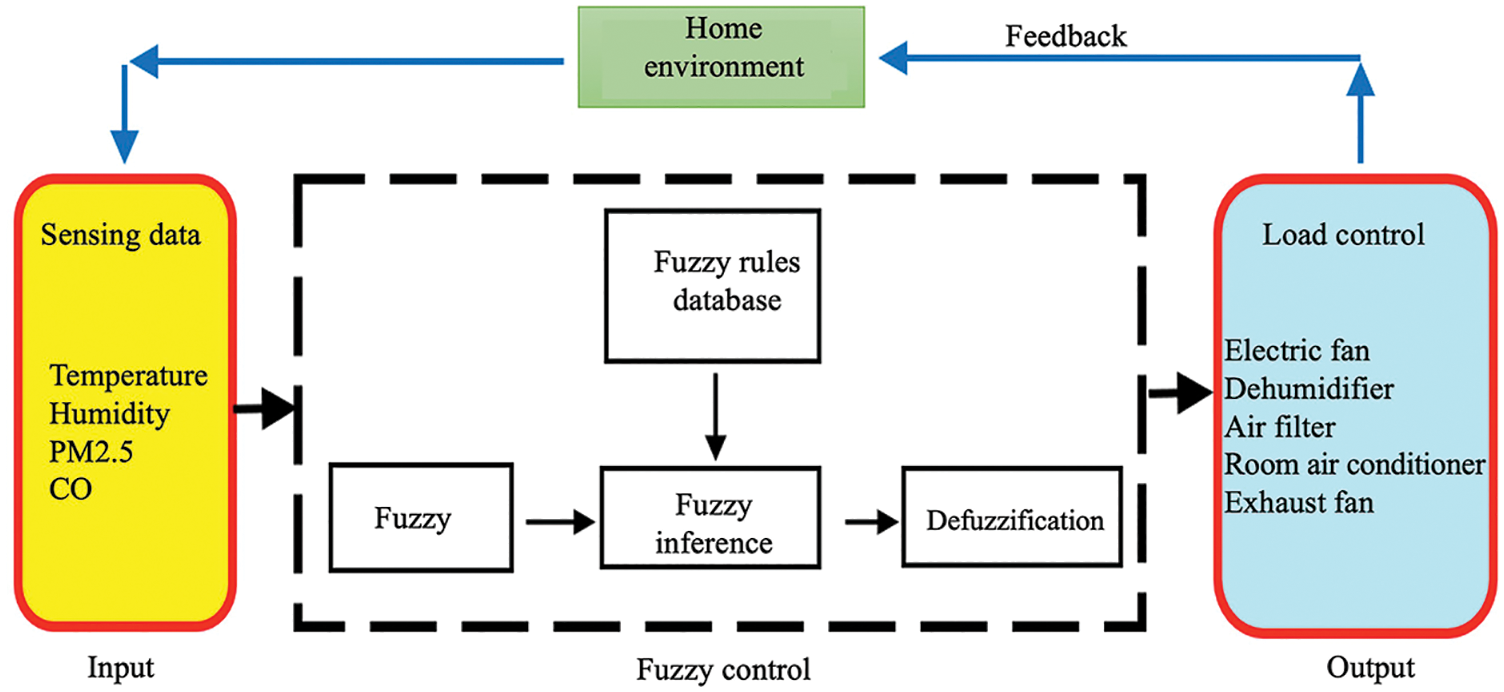
Figure 11: Fuzzy control flow chart
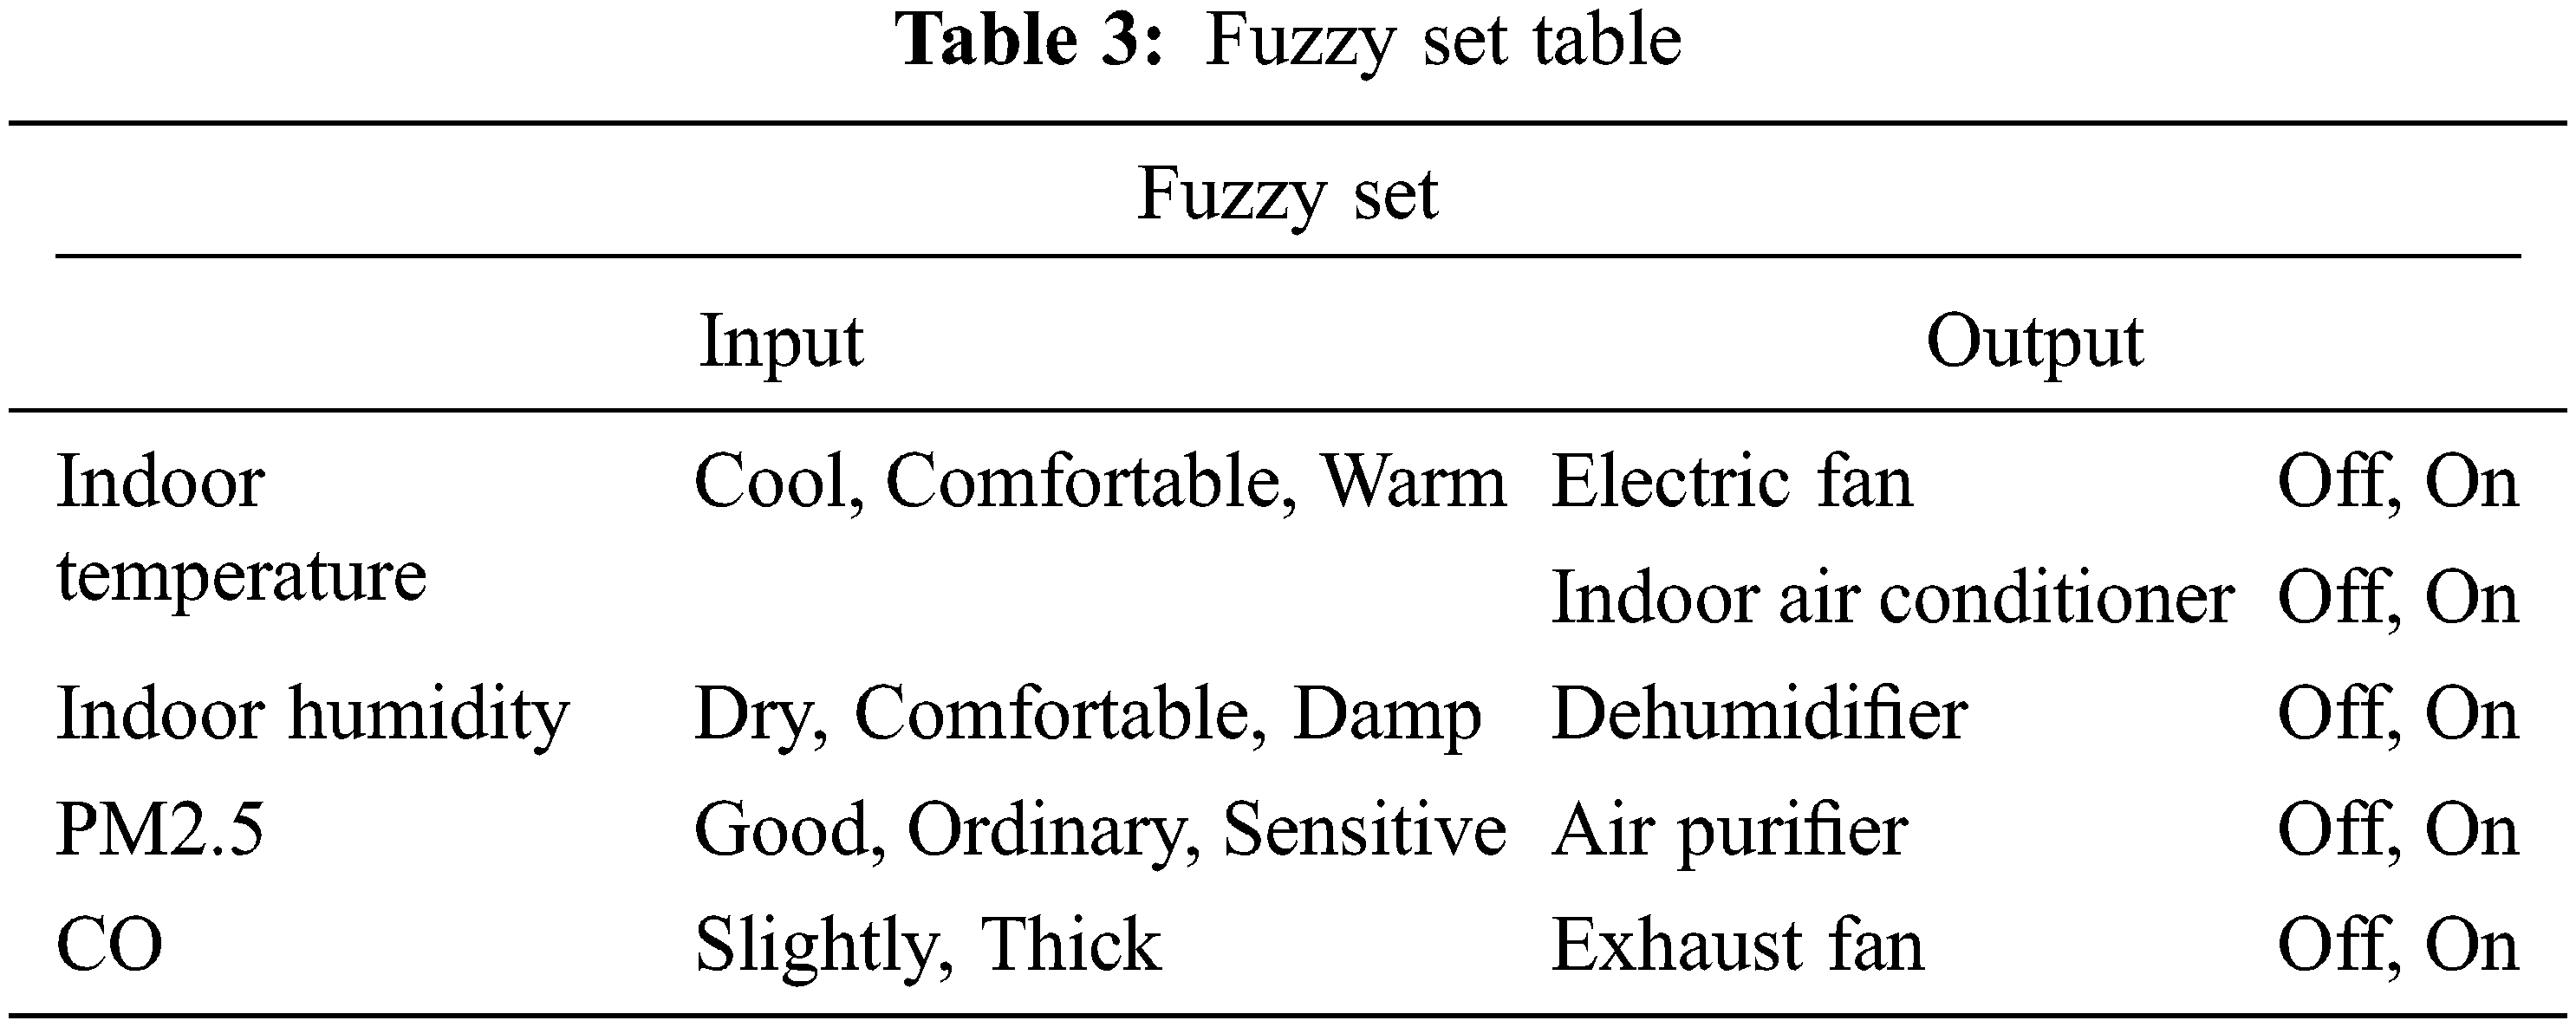
To enable the system to decide the timing of starting the controllable load, it must first use the Fuzzy Logic Designer in MATLAB to define the input and output ends of the fuzzy control in the fuzzy set data, as shown in Tab. 3.
Using the fuzzy set data of the input and output ends of the fuzzy membership function editor, we define the input and output membership function graphs, with the input part including the indoor temperature and PM2.5 function graphs, as shown in Figs. 12 and 13. The output part ownership function diagrams of the air purifiers are shown in Fig. 14.

Figure 12: Indoor temperature attribution function diagram (input)
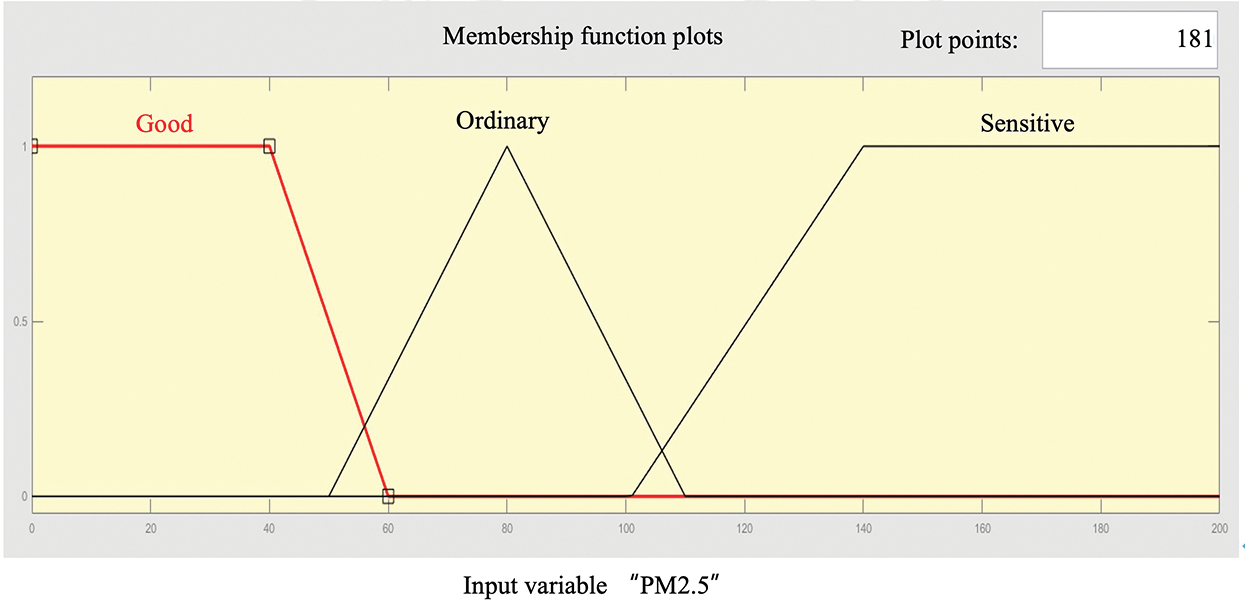
Figure 13: PM2.5 attribution function diagram (input)
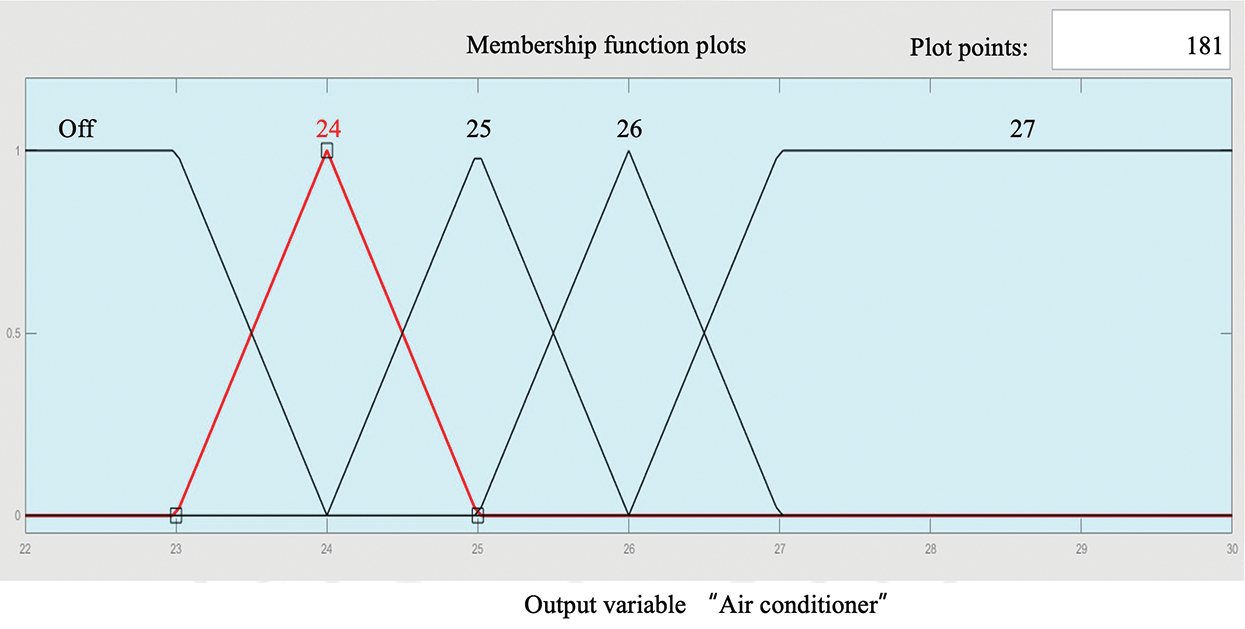
Figure 14: Room air conditioning ownership function graph (Output)
After the system defines the input and output attribution function data, the system can use the Fuzzy Logic Designer to set Mamdani’s inference method, and in the Rule Editor, use ‘If-Then’ with ‘and’ to determine the system fuzzy control rules, as shown in Fig. 15 It is expected that after the system is started, the set rule base can be referenced to maintain the THI value of the home environment within an ideal range. After completing the fuzzy rule base, the Rule Editor will automatically use the defuzzification method preset by the fuzzy membership function editor to create a fuzzy rule viewer, as shown in Fig. 16.
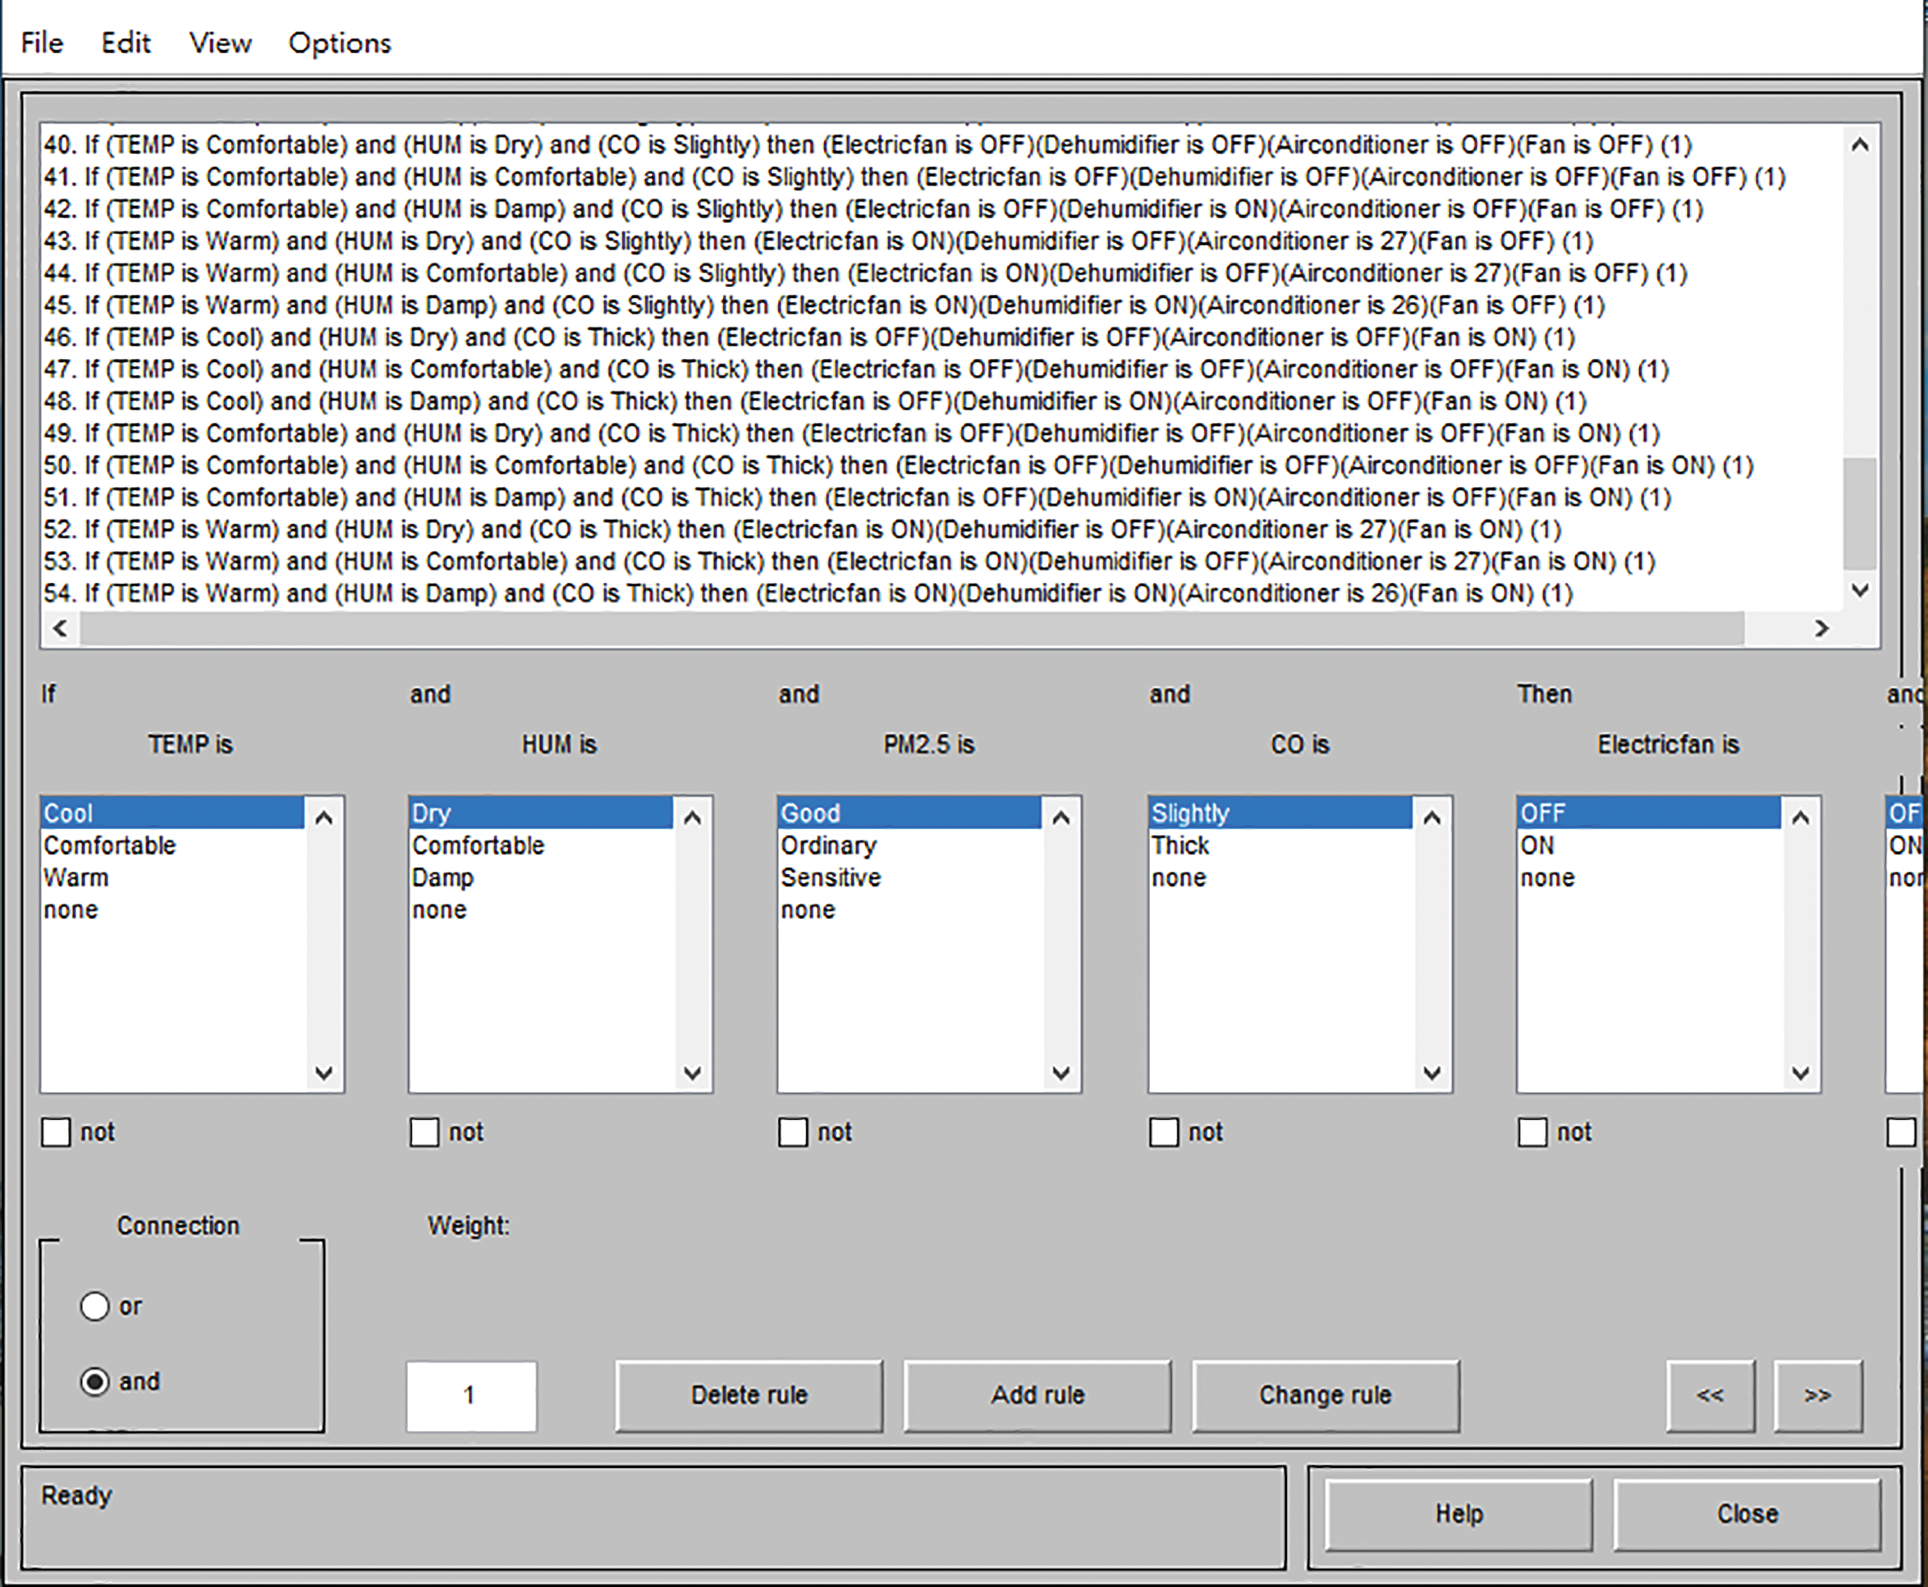
Figure 15: Fuzzy rule base
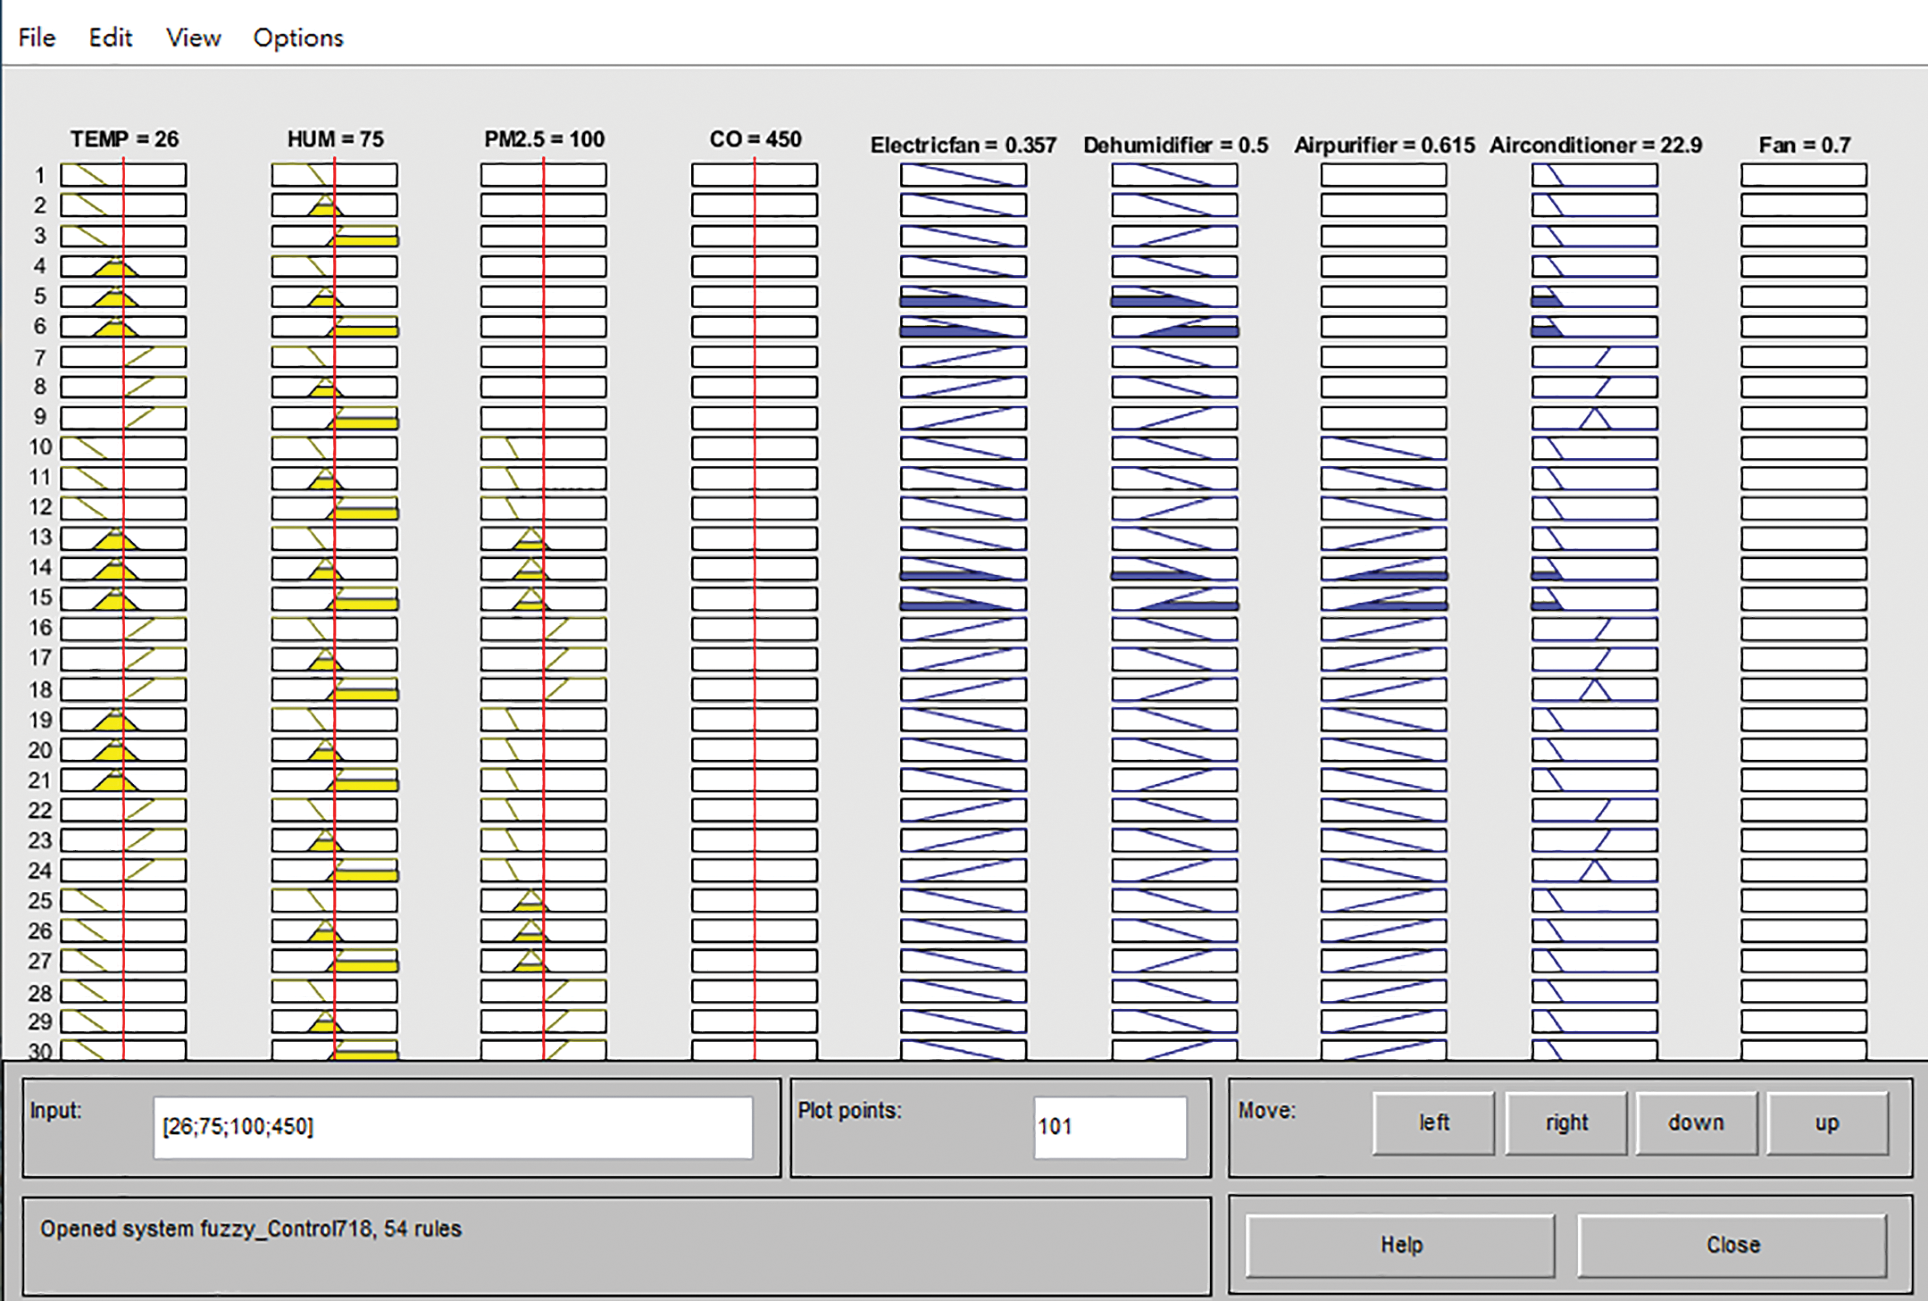
Figure 16: Fuzzy rule viewer
Further, you can also use the fuzzy surface viewer to view the set data and optimize the start-up timing of the controllable load, as shown in Figs. 17a and 17b, which show temperature, humidity, and blurred surface display of room PM2.5 and air purifiers.
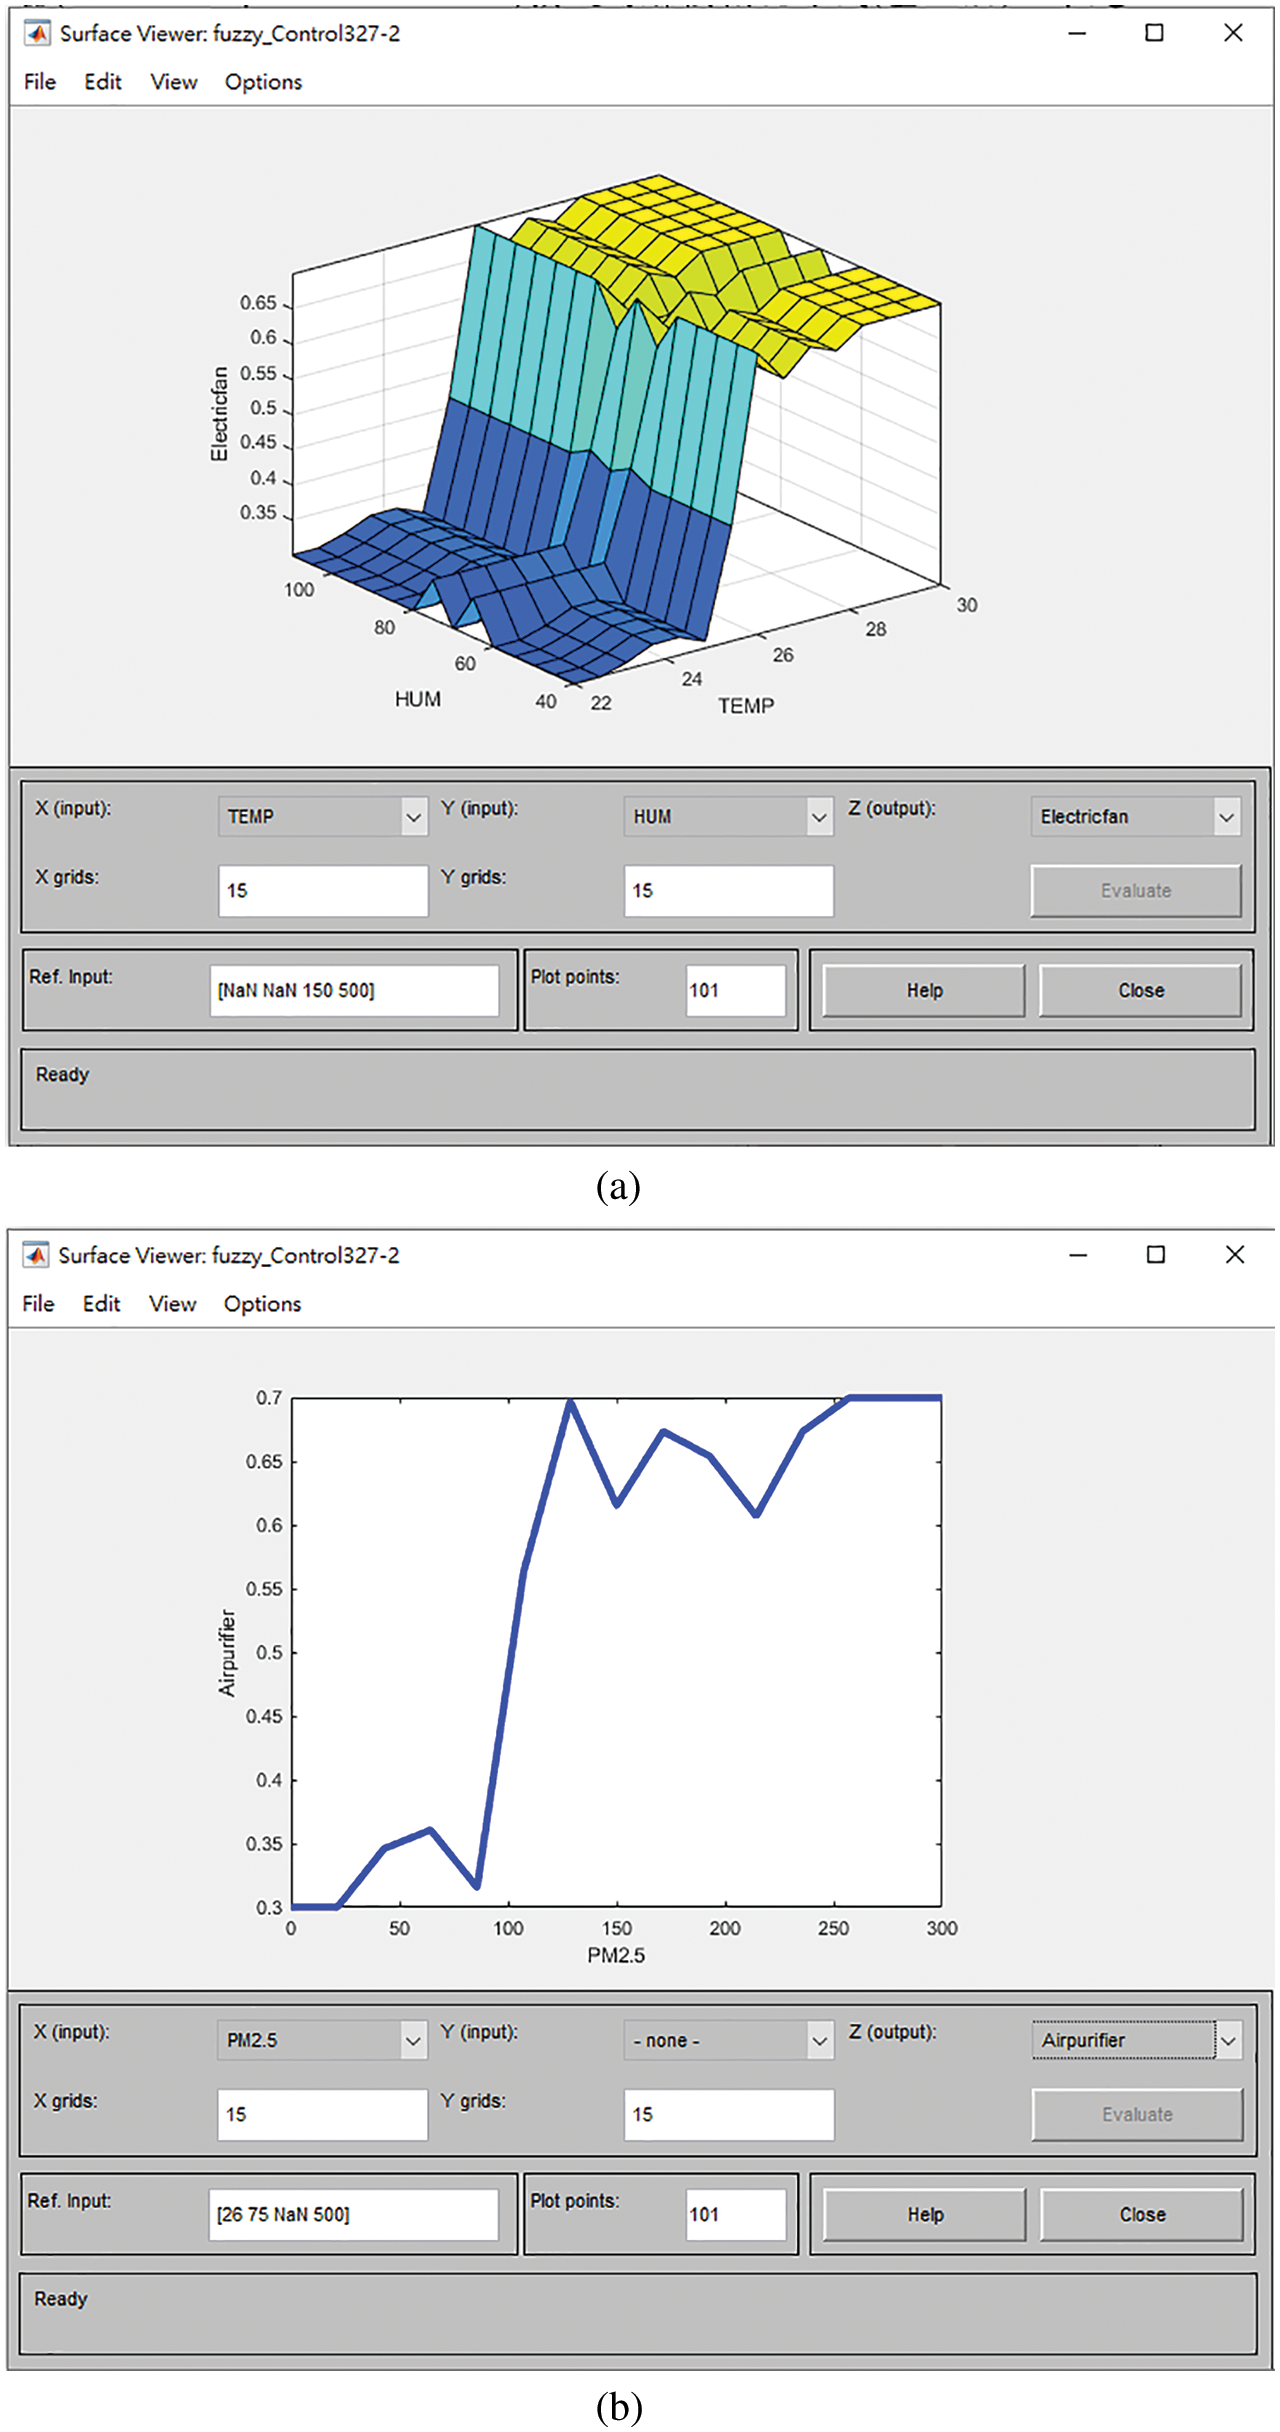
Figure 17: (a) Surface viewer (temperature, humidity and fan) (b) Surface viewer (PM2.5 and air purifier)
4.2 Monitoring Interface Implementation
This system transmits the data collected by each environmental sensing module to ThingSpeak and to the mobile app through Wi-Fi. For security, the design requires users to enter their account number and password when logging in to ensure personal privacy and system security, as shown in Fig. 18a.
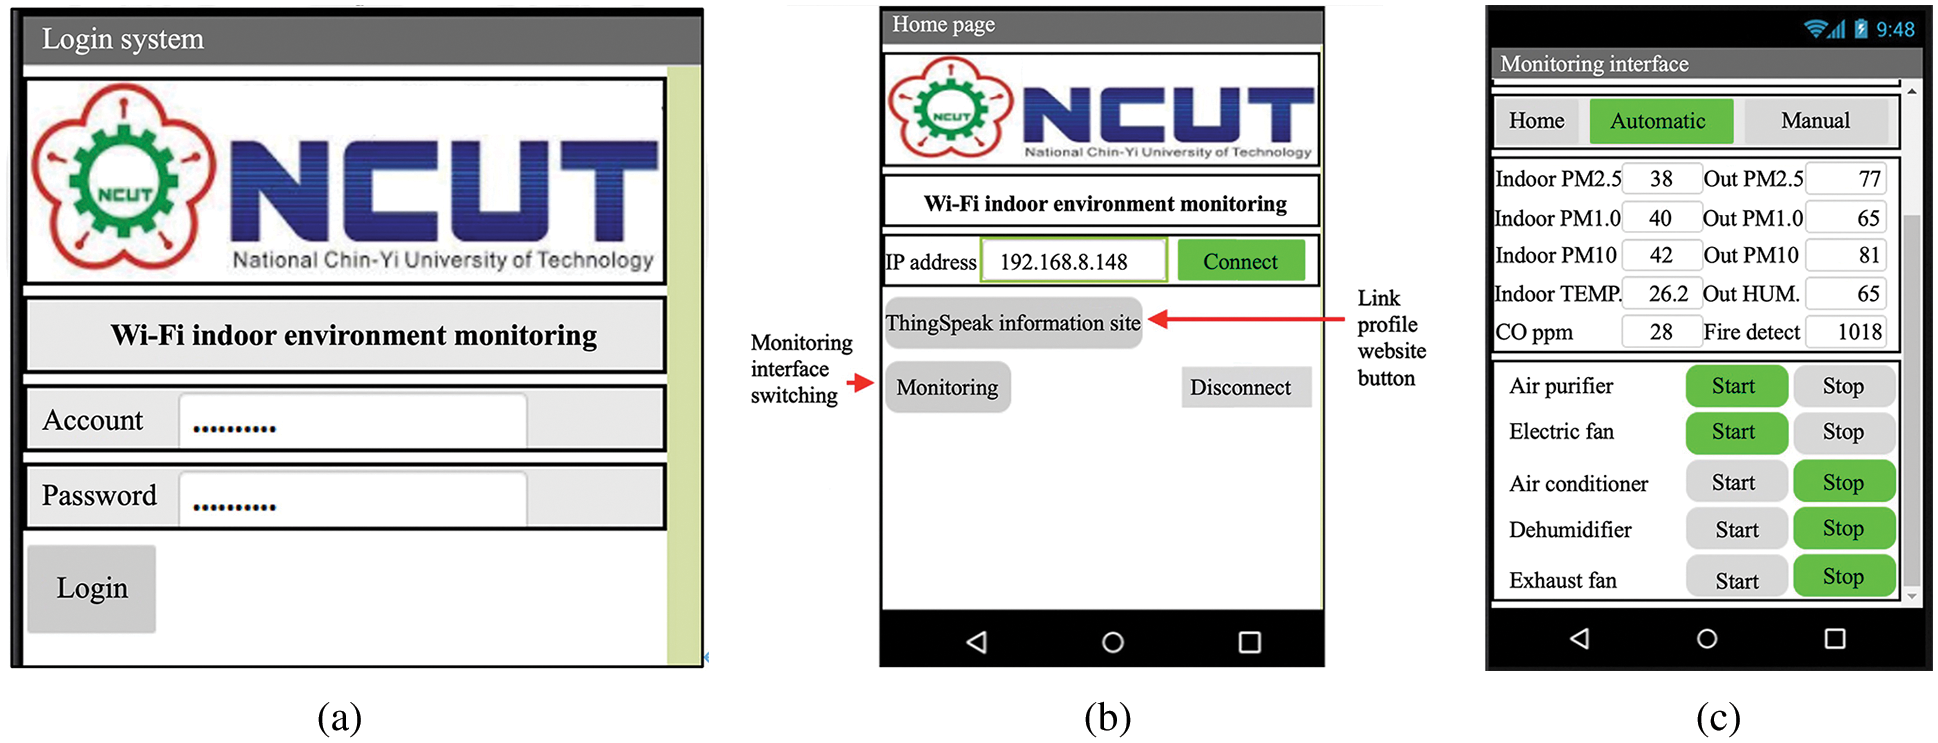
Figure 18: (a) Mobile device login screen in indoor environmental monitoring system (b) Indoor environment monitoring home (c) Indoor environment monitoring interface
After logging in, the operator can enter the homepage of the Wi-Fi indoor environment monitoring. In addition, the operator needs to enter the IP address of the ESP8266 chip in the home page before connecting. The operator also designs a button to link to the ThingSpeak data website and a button to switch to the monitoring interface in the monitoring homepage, as shown in Fig. 18b.
The monitoring interface is shown in Fig. 18c. This interface has three buttons across the top: the home page, automatic mode and manual mode. After entering this page, you can also see the relevant indoor (outdoor) environmental data collected by the sensing modules set in the home environment: suspended particles, temperature and humidity, CO gas, and fire. When the detected value exceeds the set value, the corresponding load equipment will be automatically activated to maintain indoor comfort and air quality, and the state of these devices can be seen in other bottom part of the screen. In addition, when the outdoor air quality is poor and the indoor flame is detected, the system combined with IFTTT will automatically send a warning message to LINE to notify the user. The experimental results will be presented in the next section [21,22].
4.3 Experimental Results and Analysis
When the AQI is in the range of 51∼100, it will have a slight impact on extremely sensitive groups, such as children and the elderly. In our indoor AQI experiment, with Fuzzy analysis when indoor PM2.5 is detected at a value greater than 75, the system will activate the air purifier to maintain the indoor air quality. The relevant sensing data and graphs are shown in Figs. 19 to 20.
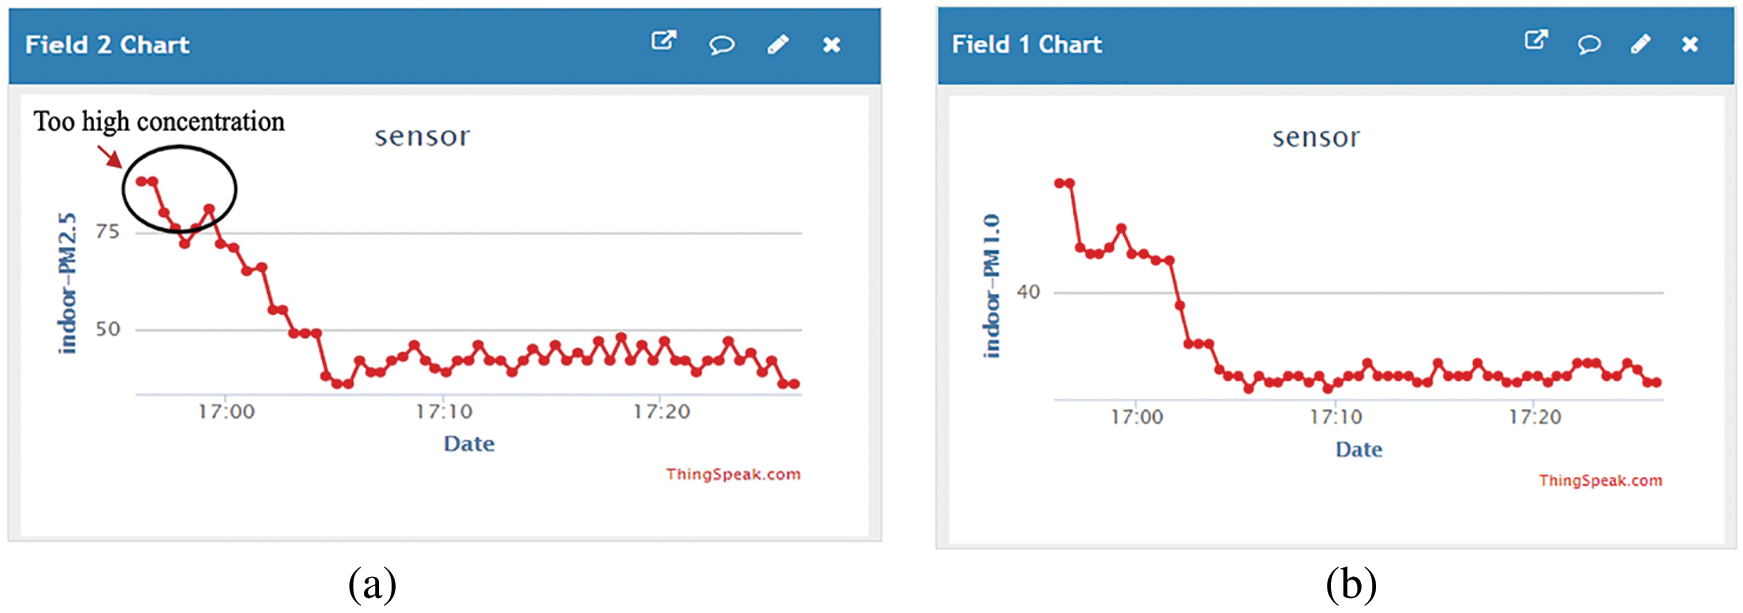
Figure 19: (a) Indoor PM2.5 (b) Indoor PM1.0
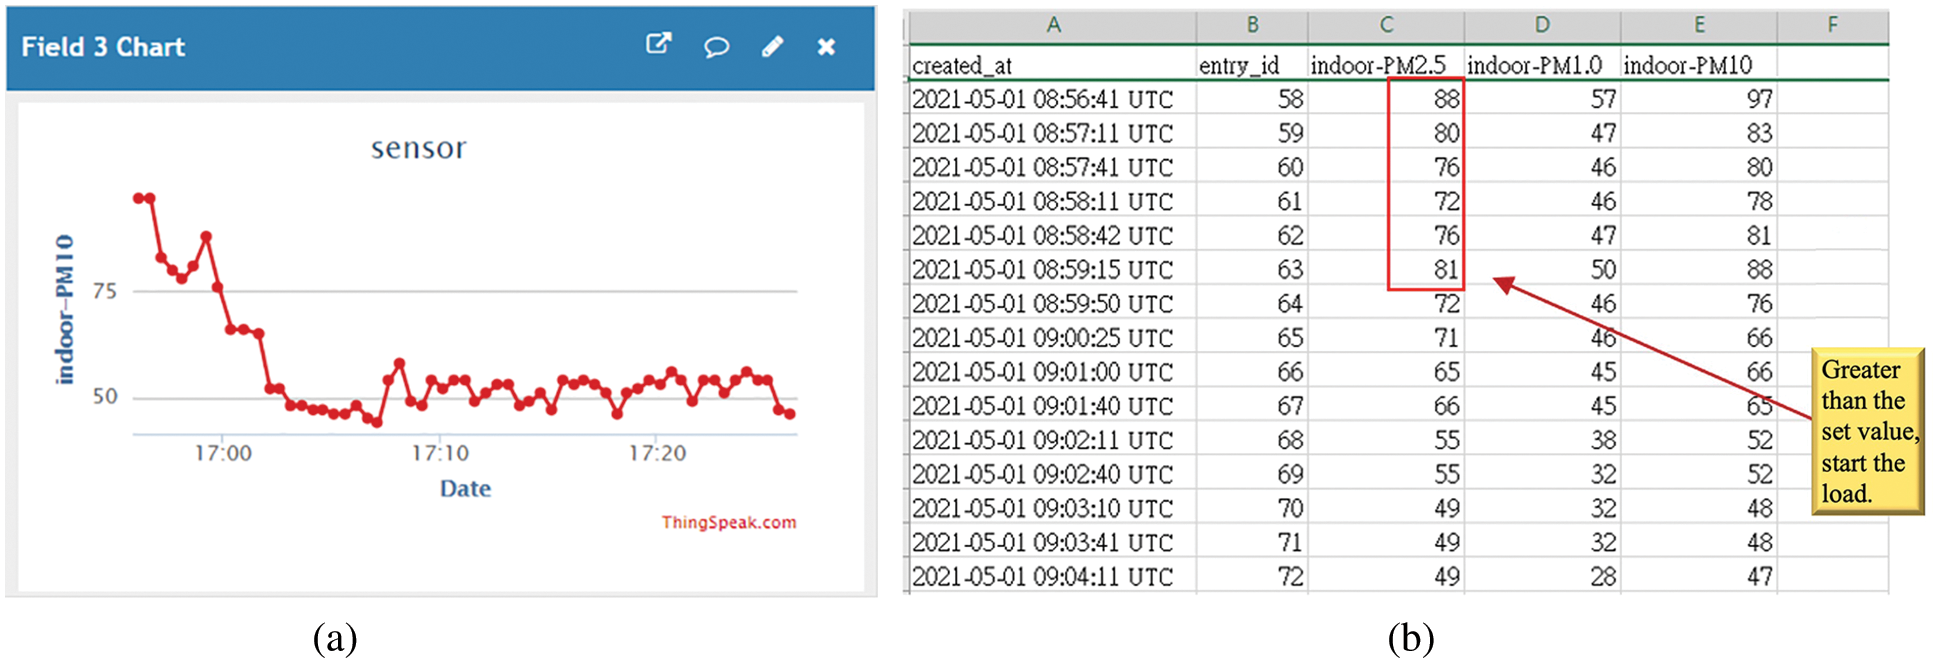
Figure 20: (a) Indoor PM10 (b) Indoor PM2.5, PM1.0 and PM10 sensing chart
The system will also monitor the outdoor PM2.5 value. When the AQI is in the range of 101∼200, it will affect the health of sensitive groups and all healthy people. Therefore, when the outdoor PM2.5 value is greater than 101, IFTTT is used with the LINE push function to send a warning. Please refer to Figs. 21 to 22.
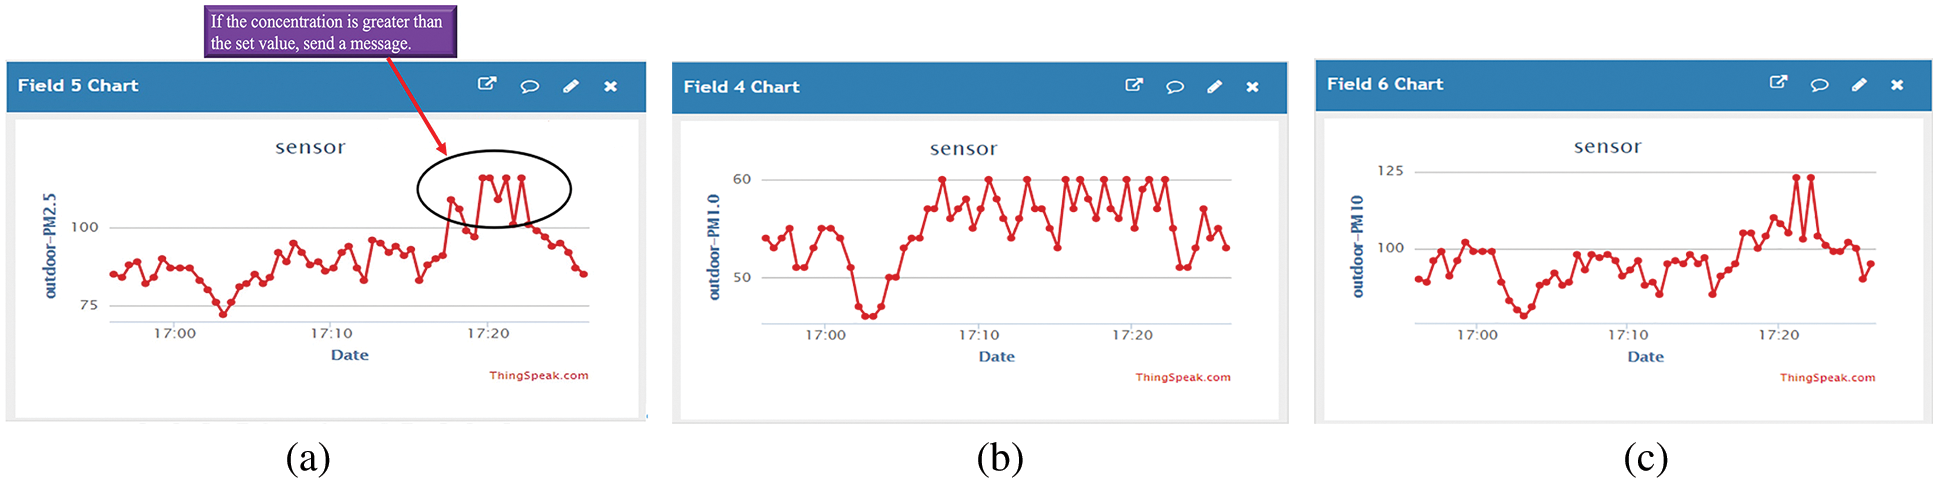
Figure 21: (a) Outdoor PM2.5 sensing chart (b) Outdoor PM1.0 (c) Outdoor PM10
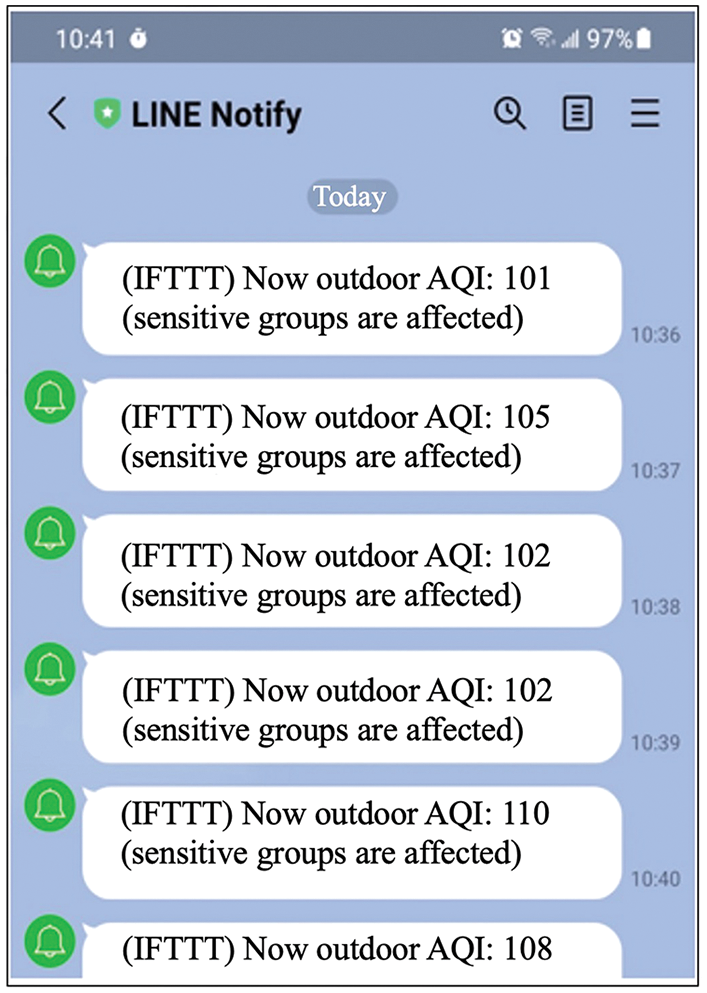
Figure 22: Outdoor AQI sensing LINE Notify
The comfort level index (THI) defines the range of 20∼26 as the most comfortable range for the human body. To reach this ideal range, both temperature and humidity are controlled, and controlling humidity is found to be more effective. The THI value of 20∼26 is converted by the calculation formula, to show the best temperature range is 19°C∼27°C, and the humidity range is 40%∼75%. The fans or indoor air conditioners are used to adjust the temperature, and when the indoor humidity is greater than 70%, the dehumidifier is activated to keep the reduce it. The experiment uploads the sensing chart and database data to the ThingSpeak database. Please refer to Fig. 23.
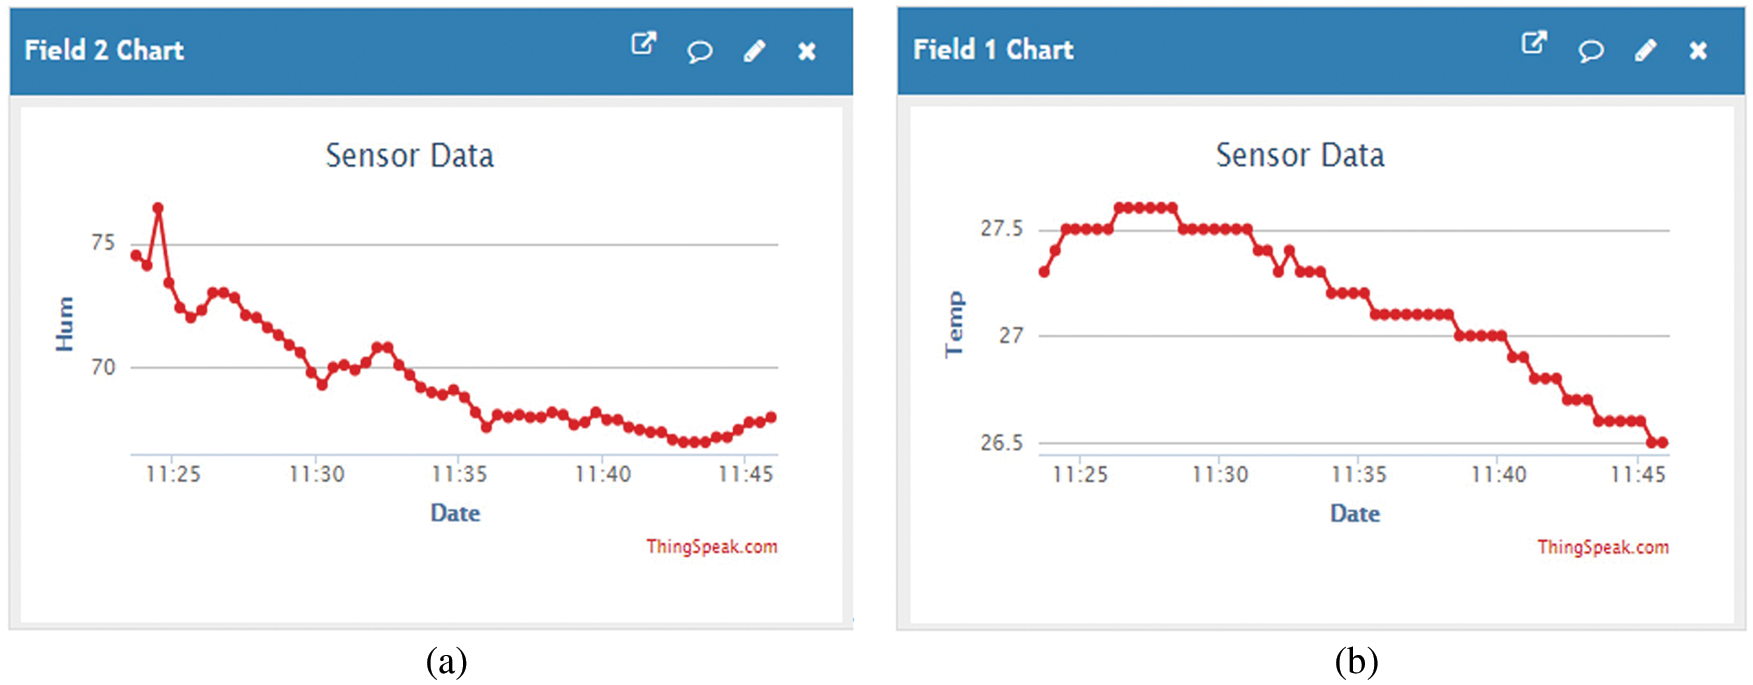
Figure 23: Temperature and humidity sensing chart
In the indoor harmful gas sensing part, the MQ-4 gas sensor is used to detect carbon monoxide in the environment. According to the literature in the second chapter, we know that when the concentration of carbon monoxide in the air is greater than 400 ppm, it will have an impact on the human body and cause headaches and the feeling of vomiting. When carbon monoxide is detected in the air at a concentration greater than 400 ppm, the buzzer will be activated to notify users, and the exhaust fan will be activated to help discharge harmful gases. The CO sensing chart is shown in Fig. 24a. The flam sensing chart is shown in Fig. 24b.
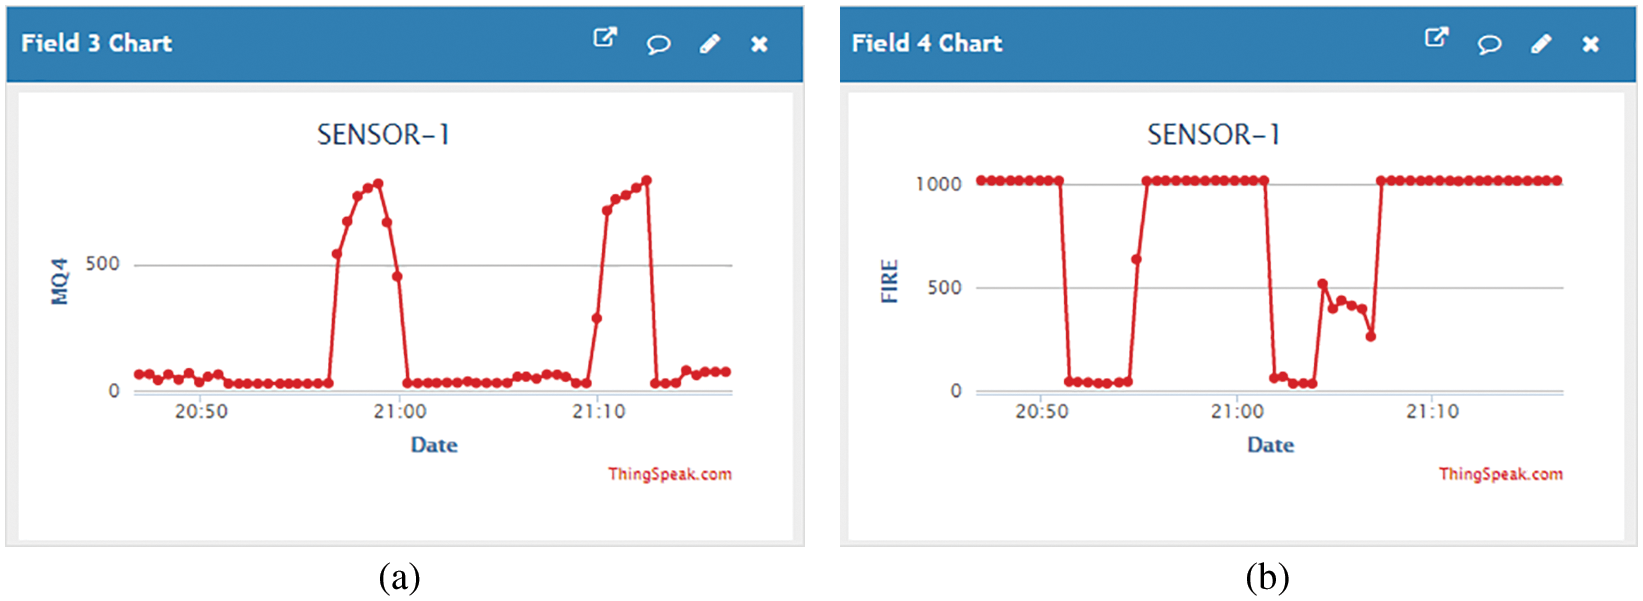
Figure 24: (a) CO sensing chart (b) Flame sensing chart
This study uses the AQI value, defined by the air quality monitoring website, and sets it according to the index value, in order to maintain the indoor air quality in a good state at all times. In terms of environmental comfort, it uses the THI index level to set an acceptable level of personal comfort. The system aims to maintain the indoor THI value at a comfortable level of 20∼26. In addition, the system also adds harmful gas CO and flame sensing modules to provide a part of home security detection applications for the overall system.
The system is equipped with a microcontroller combined with a Wi-Fi chip (ESP8266) and a router. The system transmits relevant environmental data to the ThingSpeak database. Through the development and application of the mobile app, the system allows users to immediately see the environmental sensing data, and at the same time, users can easily view the changes as graphics and historical data. This study also uses the integrated services of IFTTT to send the fire detection signal to the LINE app group through IFTTT’s connected service, so that users can respond immediately and avoid major losses.
Acknowledgement: This research was supported by the Department of Electrical Engineering, National Chin-Yi University of Technology. The authors would like to thank the National Chin-Yi University of Technology, Takming University of Science and Technology, Taiwan, for financially supporting this research.
Funding Statement: The authors received no specific funding for this study.
Conflicts of Interest: The authors declare that they have no conflicts of interest to report regarding the present study.
References
1. U. Kim and J. Kim, “A stabilized feedback episodic memory (SF-EM) and home service provision framework for robot and IoT collaboration,” IEEE Transactions on Cybernetics, vol. 50, no. 5, pp. 2110–2123, 2020. [Google Scholar]
2. T. Kim, S. Bae and Y. An, “Design of smart home implementation within IoT natural language interface,” IEEE Access, vol. 8, pp. 84929–84949, 2020. [Google Scholar]
3. N. Ghosh, S. Chandra, V. Sachidananda and Y. Elovici, “Softauthz: A context-aware, behavior-based authorization framework for home IoT,” IEEE Internet of Things Journal, vol. 6, no. 6, pp. 10773–10785, 2019. [Google Scholar]
4. G. Bedi, G. K. Venayagamoorthy, R. Singh, R. R. Brooks and K. Wang, “Review of internet of things (IoT) in electric power and energy systems,” IEEE Internet of Things Journal, vol. 5, no. 2, pp. 847–870, 2018. [Google Scholar]
5. Y. Lin, Y. Lin, C. Hsiao and Y. Wang, “IoTtalk-RC: Sensors as universal remote control for aftermarket home appliances,” IEEE Internet of Things Journal, vol. 4, no. 4, pp. 1104–1112, 2017. [Google Scholar]
6. A. Zielonka, M. Woźniak, S. Garg, G. Kaddoum, M. J. Piran et al., “Smart homes: How much will they support us? a research on recent trends and advances,” IEEE Access, vol. 9, pp. 26388–26419, 2021. [Google Scholar]
7. A. Zielonka, A. Sikora, M. Woźniak, W. Wei, Q. Ke et al., “Intelligent internet of things system for smart home optimal convection,” IEEE Transactions on Industrial Informatics, vol. 17, no. 6, pp. 4308–4317, 2021. [Google Scholar]
8. Y. Fang, J. Fei and T. Wang, “Adaptive backstepping fuzzy neural controller based on fuzzy sliding mode of active power filter,” IEEE Access, vol. 8, pp. 96027–96035, 2020. [Google Scholar]
9. J. Zhuo, C. An and J. Fei, “Fuzzy multiple hidden layer neural sliding mode control of active power filter with multiple feedback loop,” IEEE Access, vol. 9, pp. 114294–114307, 2021. [Google Scholar]
10. S. Hou, Y. Chu and J. Fei, “Adaptive type-2 fuzzy neural network inherited terminal sliding mode control for power quality improvement,” IEEE Transactions on Industrial Informatics, vol. 17, no. 11, pp. 7564–7574, 2021. [Google Scholar]
11. X. Tang, L. Deng, N. Liu, S. Yang and J. Yu, “Observer-based output feedback MPC for T–S fuzzy system with data loss and bounded disturbance,” IEEE Transactions on Cybernetics, vol. 49, no. 6, pp. 2119–2132, 2019. [Google Scholar]
12. D. Choi, S. Seo, Y. Oh and Y. Kang, “Two-factor fuzzy commitment for unmanned IoT devices security,” IEEE Internet of Things Journal, vol. 6, no. 1, pp. 335–348, 2019. [Google Scholar]
13. X. R. Zhang, W. F. Zhang, W. Sun, X. M. Sun and S. K. Jha, “A robust 3-D medical watermarking based on wavelet transform for data protection,” Computer Systems Science & Engineering, vol. 41, no. 3, pp. 1043–1056, 2022. [Google Scholar]
14. X. R. Zhang, X. Sun, X. M. Sun, W. Sun and S. K. Jha, “Robust reversible audio watermarking scheme for telemedicine and privacy protection,” Computers, Materials & Continua, vol. 71, no. 2, pp. 3035–3050, 2022. [Google Scholar]
15. Y. Luo, L. Cheng, H. Hu, G. Peng and D. Yao, “Context-rich privacy leakage analysis through inferring apps in smart home IoT,” IEEE Internet of Things Journal, vol. 8, no. 4, pp. 2736–2750, 2021. [Google Scholar]
16. Y. Lin, M. Yang and Y. Lin, “Low-cost four-dimensional experience theater using home appliances,” IEEE Transactions on Multimedia, vol. 21, no. 5, pp. 1161–1168, 2019. [Google Scholar]
17. L. Liu, J. Xu, Y. Huan, Z. Zou, S. Yeh et al., “A smart dental health-IoT platform based on intelligent hardware, deep learning, and mobile terminal,” IEEE Journal of Biomedical and Health Informatics, vol. 24, no. 3, pp. 898–906, 2020. [Google Scholar]
18. Y. Hsieh and Y. Jeng, “Development of home intelligent fall detection IoT system based on feedback optical flow convolutional neural network,” IEEE Access, vol. 6, pp. 6048–6057, 2018. [Google Scholar]
19. Z. Zhou, H. Yu and H. Shi, “Human activity recognition based on improved Bayesian convolution network to analyze health care data using wearable IoT device,” IEEE Access, vol. 8, pp. 86411–86418, 2020. [Google Scholar]
20. N. Khalid, R. Mirzavand, H. Saghlatoon, M. M. Honari, A. K. Iyer et al., “A batteryless RFID sensor architecture with distance ambiguity resolution for smart home IoT applications,” IEEE Internet of Things Journal, vol. 9, no. 4, pp. 2960–2972, 2022. [Google Scholar]
21. R. Xu, Q. Zeng, L. Zhu, H. Chi, X. Du et al., “Privacy leakage in smart homes and its mitigation: IFTTT as a case study,” IEEE Access, vol. 7, pp. 63457–63471, 2019. [Google Scholar]
22. G. Kaur, P. Chanak and M. Bhattacharya, “Energy-efficient intelligent routing scheme for IoT-enabled WSNs,” IEEE Internet of Things Journal, vol. 8, no. 14, pp. 11440–11449, 2021. [Google Scholar]
Cite This Article
 Copyright © 2023 The Author(s). Published by Tech Science Press.
This work is licensed under a Creative Commons Attribution 4.0 International License , which permits unrestricted use, distribution, and reproduction in any medium, provided the original work is properly cited.
 Downloads
 Citation Tools