
 Submit a Paper
 Propose a Special lssue
 Open Access
ARTICLE

Efficient Authentication System Using Wavelet Embeddings of Otoacoustic Emission Signals
1 Department of Information Technology, Sri Sivasubramaniya Nadar College of Engineering, Chennai, 603110, India
2 School of Computer Science and Engineering, Vellore Institute of Technology, Chennai, 600127, India
* Corresponding Author: A. Shahina. Email:
Computer Systems Science and Engineering 2023, 45(2), 1851-1867. https://doi.org/10.32604/csse.2023.028136
Received 03 February 2022; Accepted 17 June 2022; Issue published 03 November 2022
 View Full Text
 Download PDF
Abstract
Biometrics, which has become integrated with our daily lives, could fall prey to falsification attacks, leading to security concerns. In our paper, we use Transient Evoked Otoacoustic Emissions (TEOAE) that are generated by the human cochlea in response to an external sound stimulus, as a biometric modality. TEOAE are robust to falsification attacks, as the uniqueness of an individual’s inner ear cannot be impersonated. In this study, we use both the raw 1D TEOAE signals, as well as the 2D time-frequency representation of the signal using Continuous Wavelet Transform (CWT). We use 1D and 2D Convolutional Neural Networks (CNN) for the former and latter, respectively, to derive the feature maps. The corresponding lower-dimensional feature maps are obtained using principal component analysis, which is then used as features to build classifiers using machine learning techniques for the task of person identification. T-SNE plots of these feature maps show that they discriminate well among the subjects. Among the various architectures explored, we achieve a best-performing accuracy of 98.95% and 100% using the feature maps of the 1D-CNN and 2D-CNN, respectively, with the latter performance being an improvement over all the earlier works. This performance makes the TEOAE based person identification systems deployable in real-world situations, along with the added advantage of robustness to falsification attacks.Keywords
Biometric identification has seen enormous growth in the past decade, with researchers coming up with novel and innovative approaches. Traditional biometric systems such as passwords and access cards have now been supplanted with advanced systems, utilizing the unique and inborn traits of an individual. Smart phones around the world are now embedded with fingerprint scanners, facial recognition systems and voice recognition systems. The US military uses iris identification to identify their detainees. However, with the rise of advanced forgery techniques, the reliability of such methods is now questioned.
With widespread use of smart phones, the fingerprint of a user can be easily forged using cheap and readily available gelatin and mold [1], from the phone screen of the user. A double-identity fingerprint is a fake fingerprint, created by integrating the features of two fingerprints obtained from two different individuals.
Ferrara et al. [2] in their study evaluated the performance of double-identity fingerprints and elaborated on how effectively these double-identity fingerprints could swindle the fingerprint verification systems. Similarly, researchers at McAfee, the cyber security firm, have been able to trick the facial recognition system to falsely recognize the image of person A that is presented to the system, as that of person B by using an image translation algorithm known as CycleGAN [3]. Iris recognition also falls prey to advanced falsification attacks. There is a need for more secure identification systems using biometrics that are robust to falsification attacks, especially at sensitive places such as banks, jails or airports. One such system was a finger-vein based authentication system proposed by Chen et al. [4], where they used a luminance algorithm to capture high quality finger-vein images.
In our paper, we use low amplitude, low frequency sounds emitted by the cochlea called TEOAE (Transient Evoked Otoacoustic Emission) as a biometric modality. Like finger-vein, TEOAE signals are robust to falsification attacks. A TEOAE is a response to a short click stimulus, and is of about 20 ms duration. Such signals are traditionally used for diagnosing hearing loss in newborns and oldsters. These signals cannot be stolen, as the attacker would require a complete copy of a person’s inner ear which is nearly impossible to obtain using forgery techniques.
TEOAE signals are recorded with an earphone having a built-in microphone. Studies have shown that TEOAE signals show significant differences among individuals [5–7], making it ideal to be considered as a biometric modality. When the external click stimulus induces the cochlea, it triggers active vibration of the outer hair cells, which consequently generate the nearly inaudible sound waves, i.e., TEOAE [8–10]. The resulting TEOAE echoes back to the middle ear and ear canal which is collected by an ear-phone. This process is depicted in Fig. 1. The TEOAE signals show noteworthy differences among distinctive individuals due to the fact that the structure of the inner ear varies for each individual. Fig. 2 depicts the uniqueness of TEOAE signals, and how they vary for four random individuals.
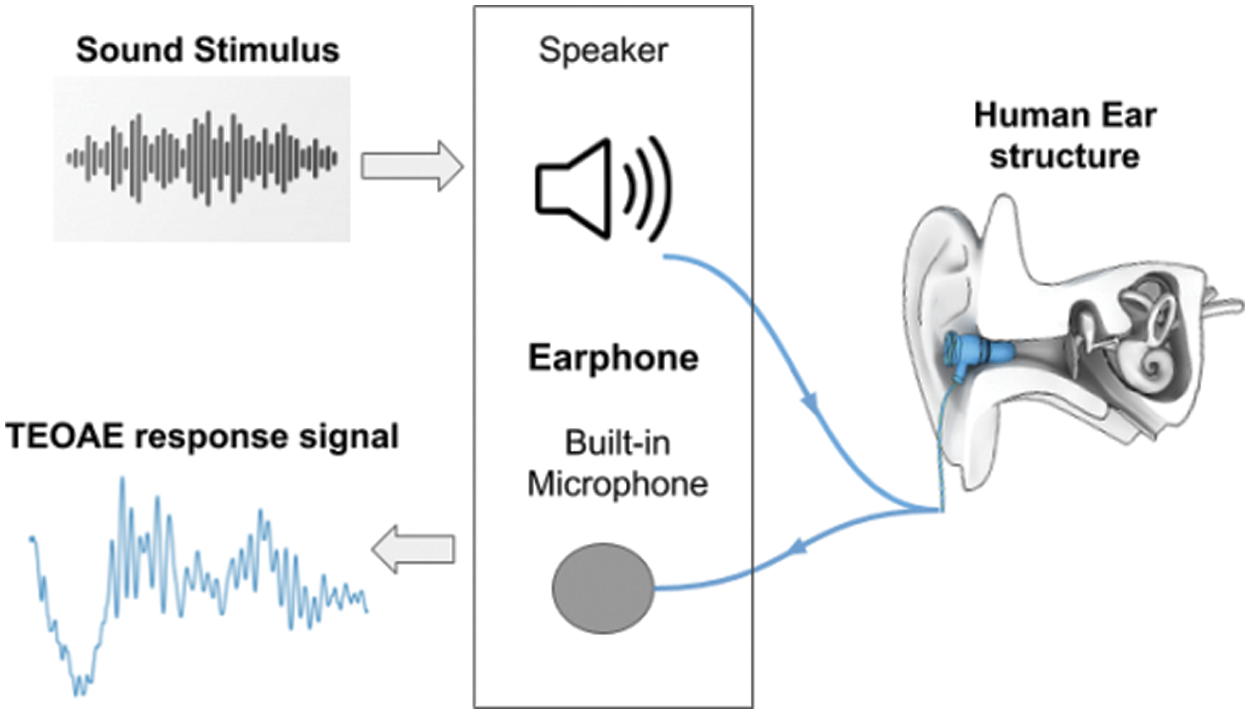
Figure 1: Measuring of TEOAE signals
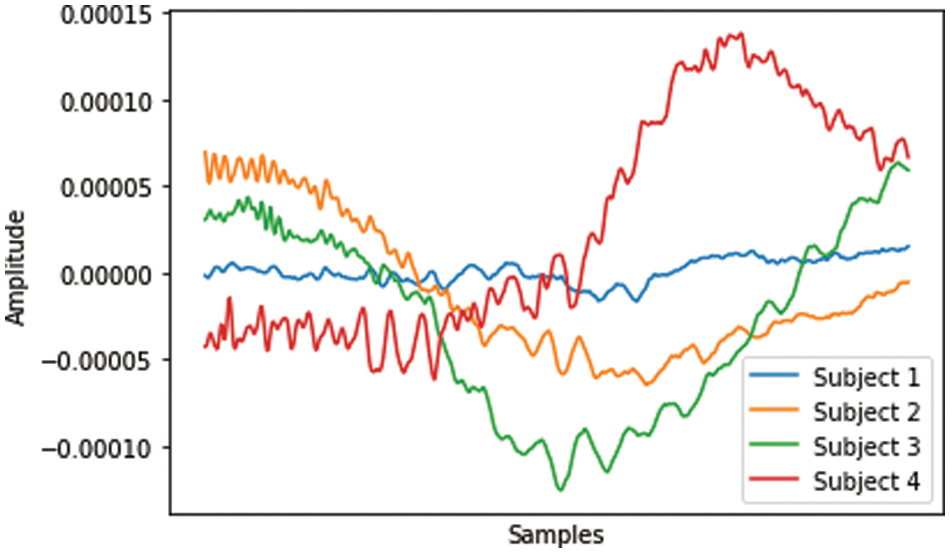
Figure 2: TEOAE signals from 4 random subjects
Since TEOAE signals are immutable and remain stable for a longer period of time [11], it makes them ideal against falsification attacks. Time-frequency analysis by Continuous Wavelet Transform (CWT) reveals the intra-subject stability as well as the inter-subject disparities [12]. Furthermore, Yuxi Liu [12] proved via experimentations and quantitative analysis that this biometric modality achieves substantial results while being robust, irreversible and diverse. Four attacks were simulated by them to verify the robustness of this biometric system.
2.1 Biometric Using Physiological Signals
In recent years, researchers have been exploring various physiological signals for biometric traits in order to build person identification systems that are robust to falsification attacks that the traditional biometric systems are susceptible to. Barra et al. [13] in their work combined the features from both electrocardiogram and ElectroEncephaloGram (EEG) signals simultaneously obtained from the same subject, in order to improve the discriminative capability of a biometric system. Such a system was able to improve the identification performance, even using very basic fusion operators. 32 subjects were considered by Moreno et al. [14] and a comparison among 40 physiological signals (32 EEG signals and 8 peripheral signals) for biometric identification was carried out. Their study concluded that with the combination of all the 40 physiological signals, the performance improves when compared to using only some of the peripheral signals. However, this involved a greater computational cost. BreathPrint [15] for mobile and wearable devices used the audio signatures associated with the three individual gestures: sniff, normal, and deep breathing, which were sufficiently distinguishable among individuals. They achieved an accuracy of 94% for all the three breathing gestures in intra-sessions and found deep breathing gesture to provide the best overall balance between true positives (successful authentication) and false positives (resiliency to directed impersonation and replay attacks).
2.2 Biometric Using TEOAE Signals
The introduction of TEOAE signals as a biometric modality was made by Swabey et al. [16]. This study analyzed the Euclidean distance of the frequency components of the power spectra of these signals. The same group later approximated the probability density function by estimating the inter-class and intra-class distances using maximum likelihood estimation to the time series data. The study concluded that TEOAEs are a stable, repeatable, non-behavioral time series biometric, and can be classified effectively using simple statistical techniques [16]. Further study by Grabham et al. [17] revealed the viability of TEOAE as a biometric modality when combined with other otoacoustic emissions. However, in both these studies, the training and testing were recorded in the same session, thus not capturing the intra-class variability and hence curbing its efficiency as a biometric modality.
To overcome the lack of intra-class variability, the first multi-session dataset was collected in a suitable environment mimicking real life scenarios and evaluated [18]. The author [19] studied person identification with TEOAE by obtaining a time-frequency representation of the signal using CWT to obtain features, followed by dimensionality reduction with Linear Discriminant Analysis (LDA). The study used Pearson correlation coefficient for verification purpose. Their work however did not fit well with real world scenarios. Researchers [20] performed authentication tests on multiple sessions. In this approach, the noise in the dataset was removed by averaging the two recordings. The dataset was then passed to a Convolution Neural Network (CNN) to identify and verify individuals. The results showed an increase in accuracy with the mean template compared to the previous CWT based analysis. In our previous work [21], we proposed EarNet, a deep learning model that is capable of extracting the appropriate filters from TEOAE signals. The features extracted from the EarNet model were then passed on to three classifiers: k-nearest neighbor, random forest and support vector machine, for performance evaluation. We performed identification and verification experiments for single ear as well as fusion of both ears using equal error rate as the performance metric.
In our work on person identification (as opposed to verification), we use a CWT and CNN combined approach for feature extraction. Person identification is done using these features, by employing various machine learning techniques. Our approach achieves a perfect identification accuracy which is an improvement over all previous works, as seen in the results in Section 4.
This section discusses the dataset used, a CWT-CNN approach for extracting the feature maps, obtaining their principal components, and using these principal components of feature maps as features for classification using machine learning techniques. The framework of our proposed methodology is given in Fig. 3.
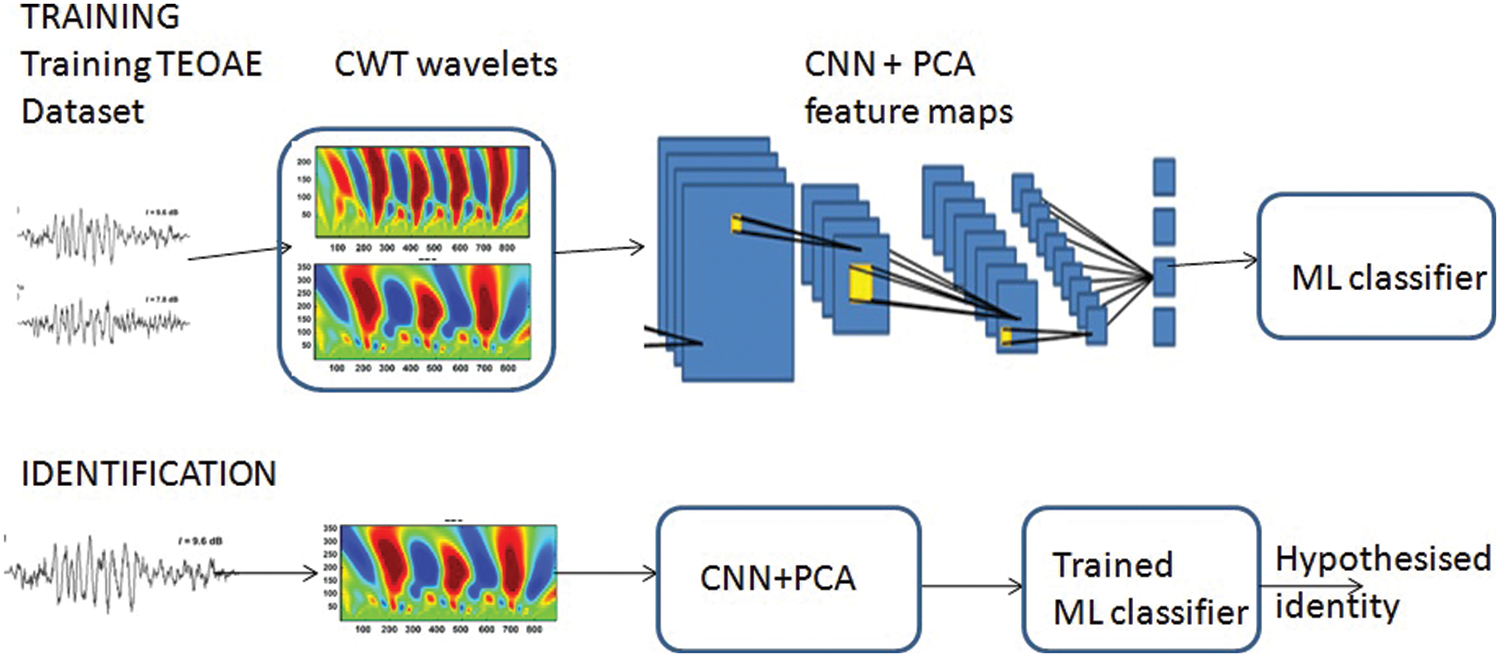
Figure 3: Framework of the proposed method using 2D-CNN based feature vectors and ML classifiers for person identification
This study uses the TEOAE dataset developed by the Biometrics Security Lab (BioSec) at the University of Toronto [18]. The Vivosonic Integrity System has been used for data collection in a regular office environment with people conversing to create a real-world scenario [12]. The protocol used for data collection is shown in Tab. 1. The dataset consists of TEOAE signals which are collected from 54 individuals in two sessions. The maximum time interval between the sessions is at least one week. Two sessions are used in the dataset to achieve intra-class variability, making it a near ideal representation of real-world scenarios. The number of TEOAE responses to a stimulus varies for each individual, from a few scores to more than a hundred. However, the initial responses are unstable, while the last few responses are always stable for all the individuals. These steady responses appear to be unique to individuals [12], as seen in Fig. 4. Hence, for this study, only the last ten responses are considered for each buffer of each ear of an individual. A total of (10 responses × 2 buffers × 2 ears × 2 sessions) 80 TEOAE signals of each of the 54 subjects, summing to 4320 signals are considered. The Vivosonic Integrity System is used to remove the noise in the raw microphone recording signal and no other processing was used.
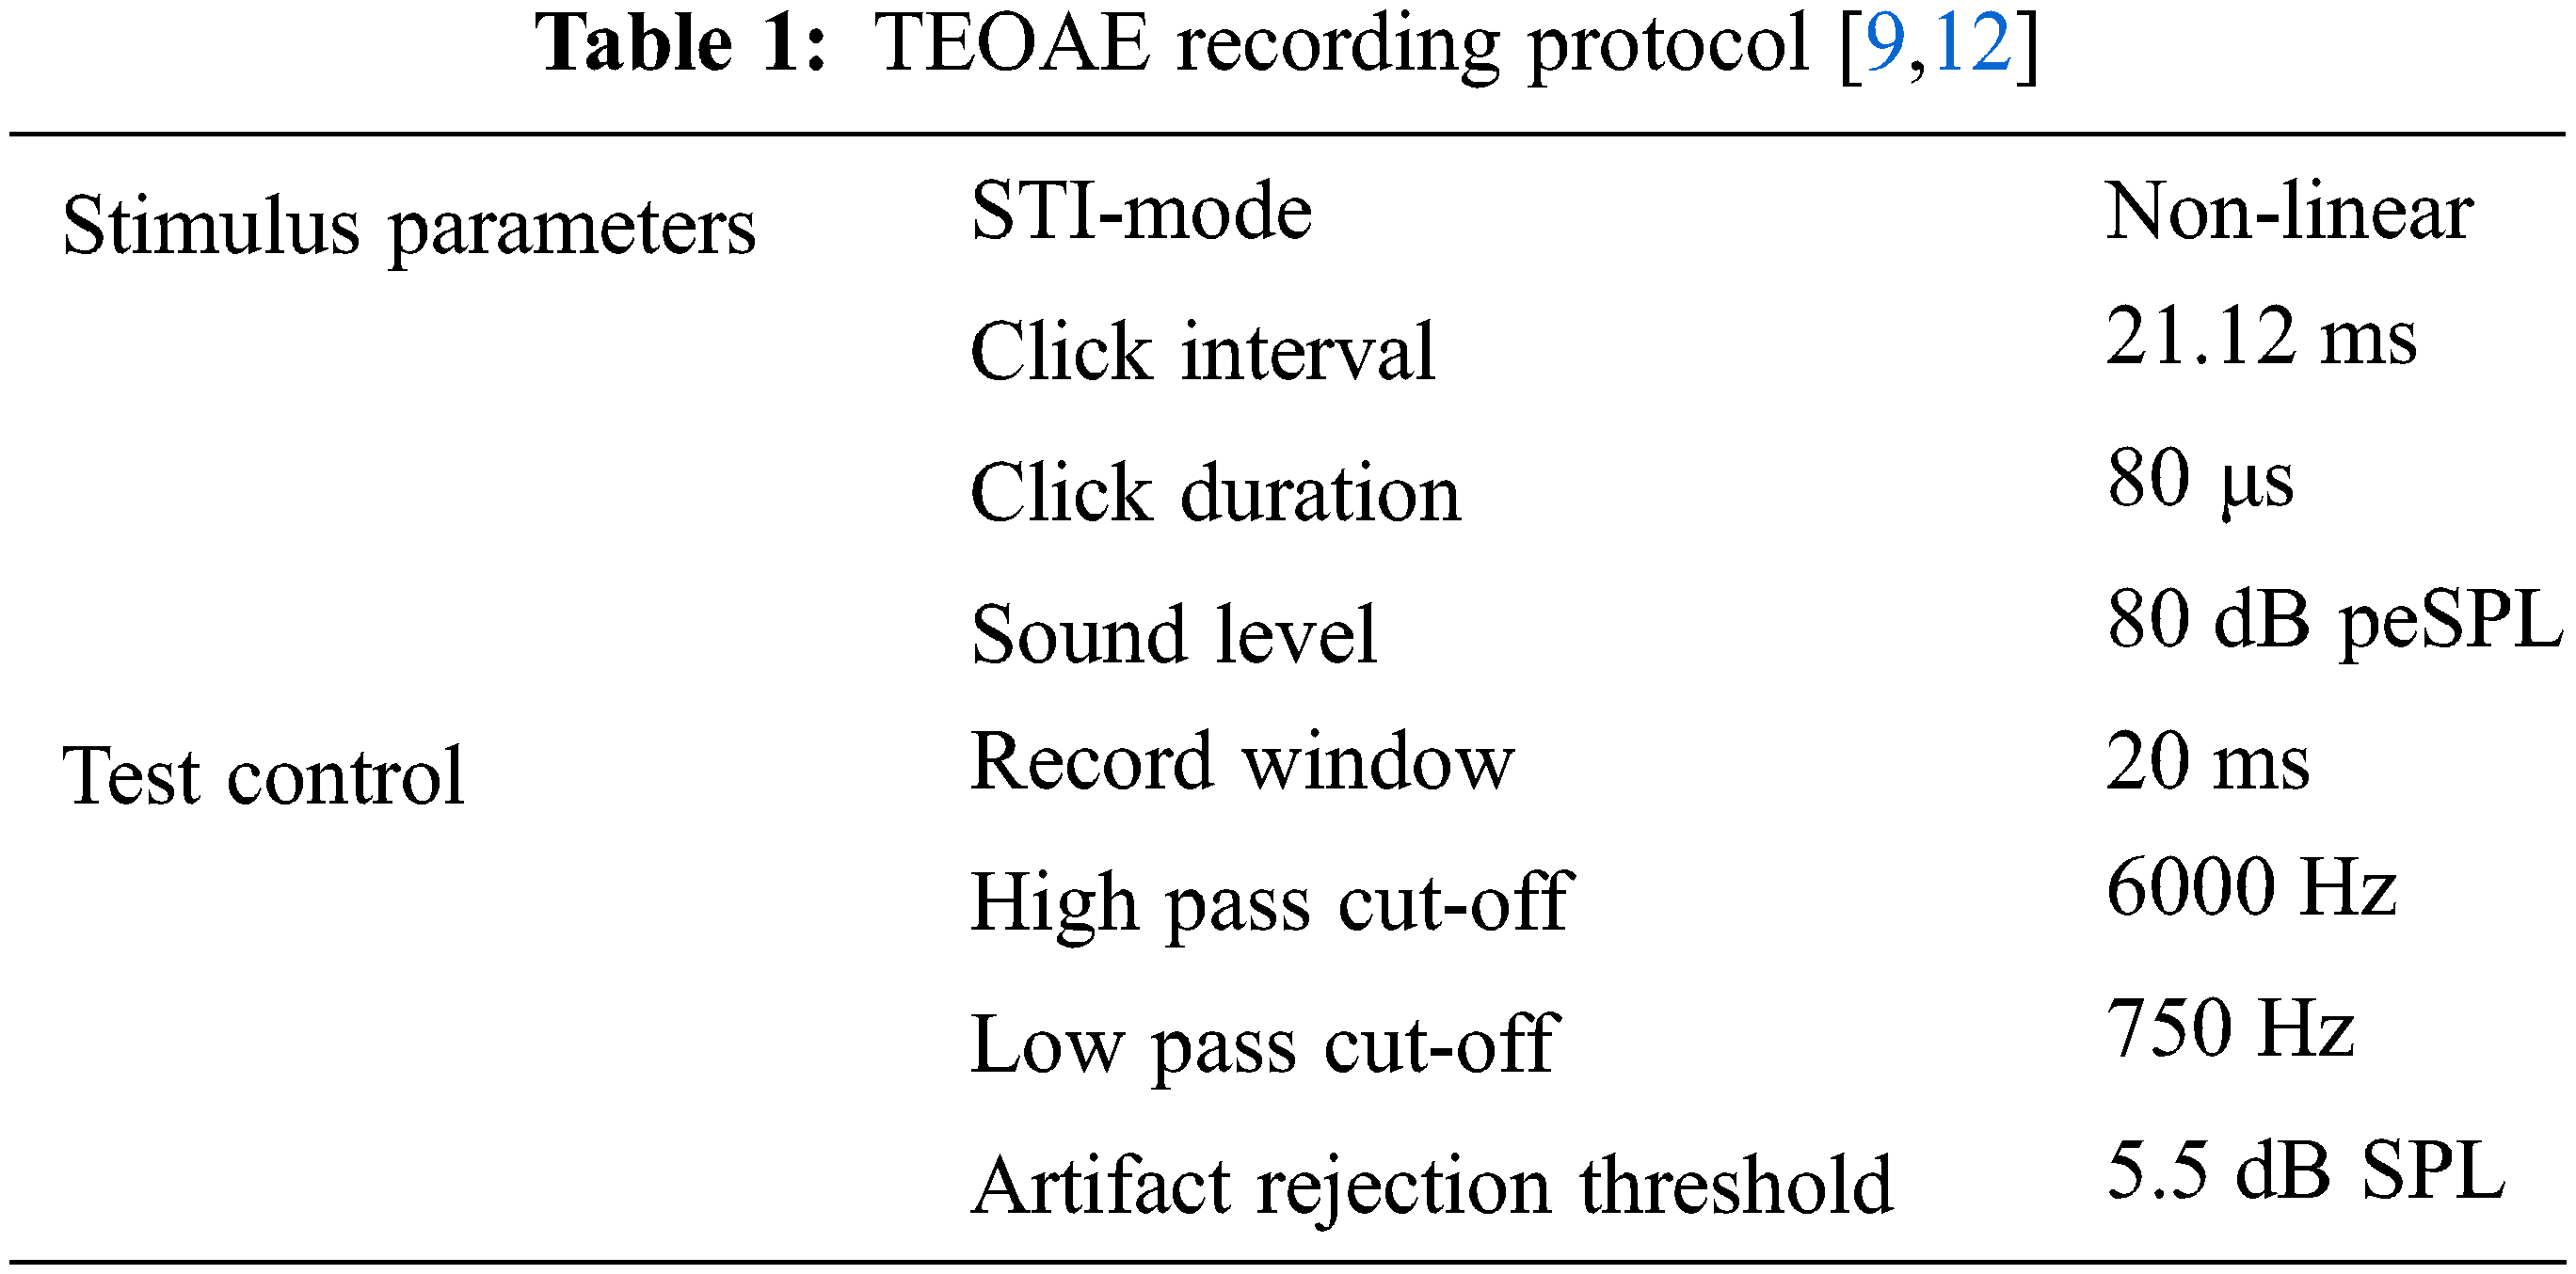
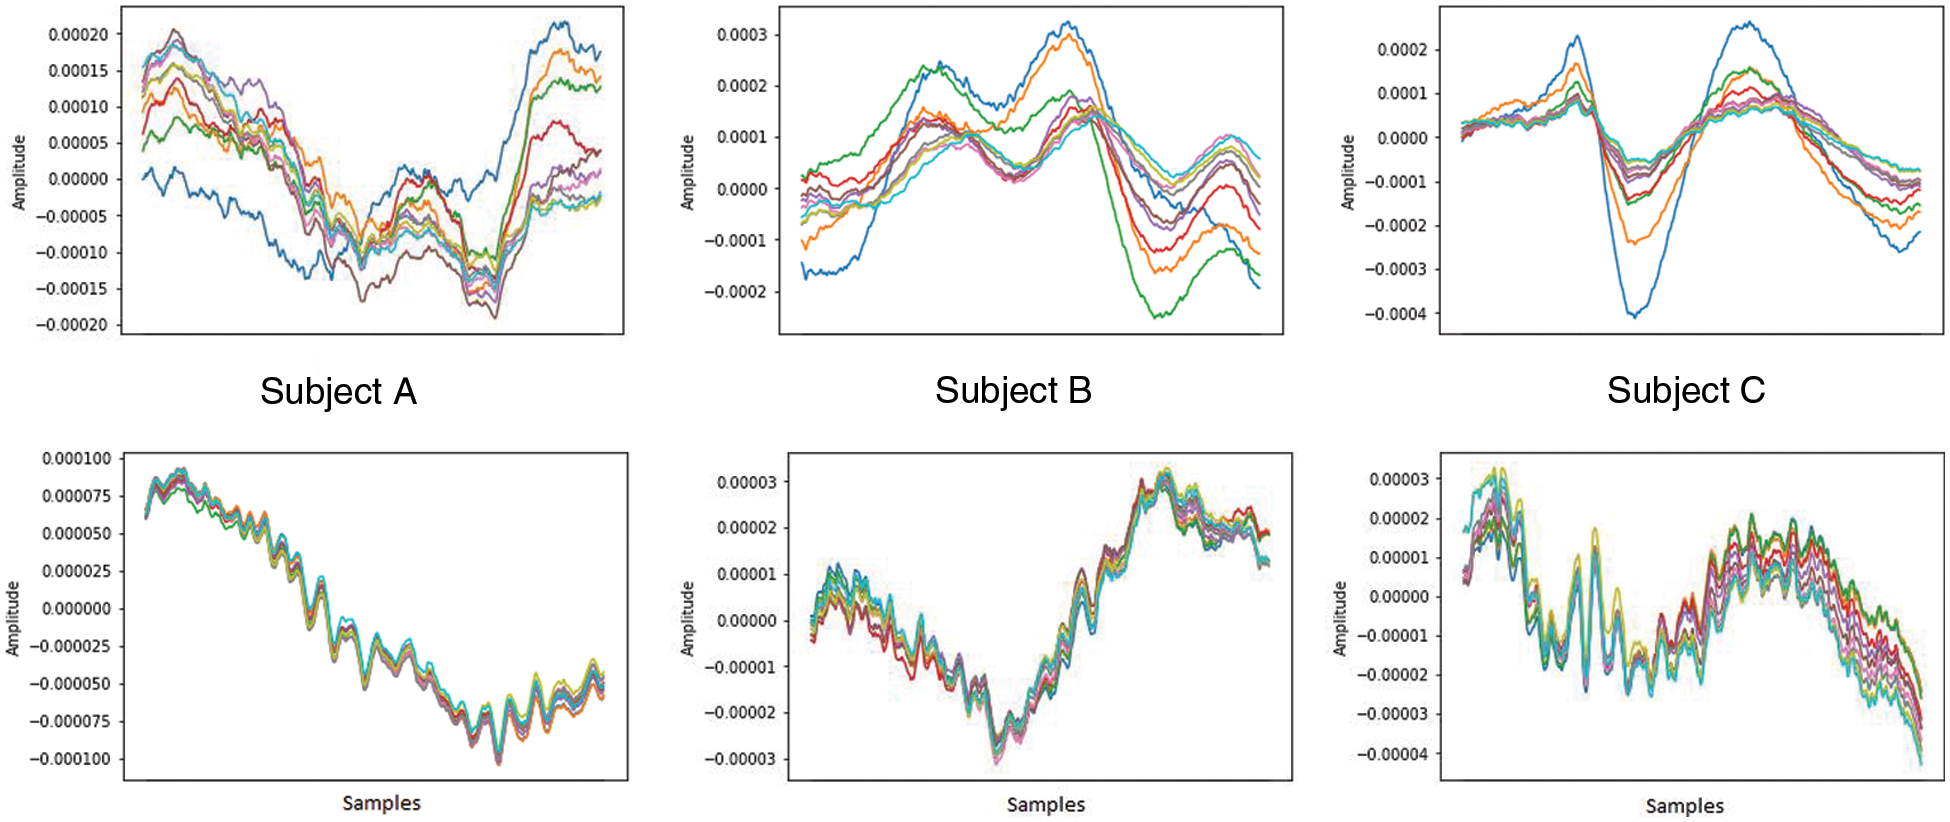
Figure 4: (Top–left to right) Initial 10 TEOAE responses of three different subjects, and (bottom–left to right) the corresponding last 10 TEOAE responses of the respective subjects. The initial responses are unstable, while the last responses are stable, and exhibit patterns unique to subjects, as opposed to the initial responses
TEOAE is generated due to vibrations caused in the basilar membrane in the cochlea, so different frequency components arrive at the ear canal at different times [8,19]. As time-frequency approach is advisable for cochlear mechanisms [20], we use Continuous Wavelet Transform (CWT) to derive a time-frequency representation from the TEOAE signals (refer Fig. 5) as given by Eq. (1):
where ψ(a) is the mother wavelet. s and δ are the scale and time translation factors respectively for the window function
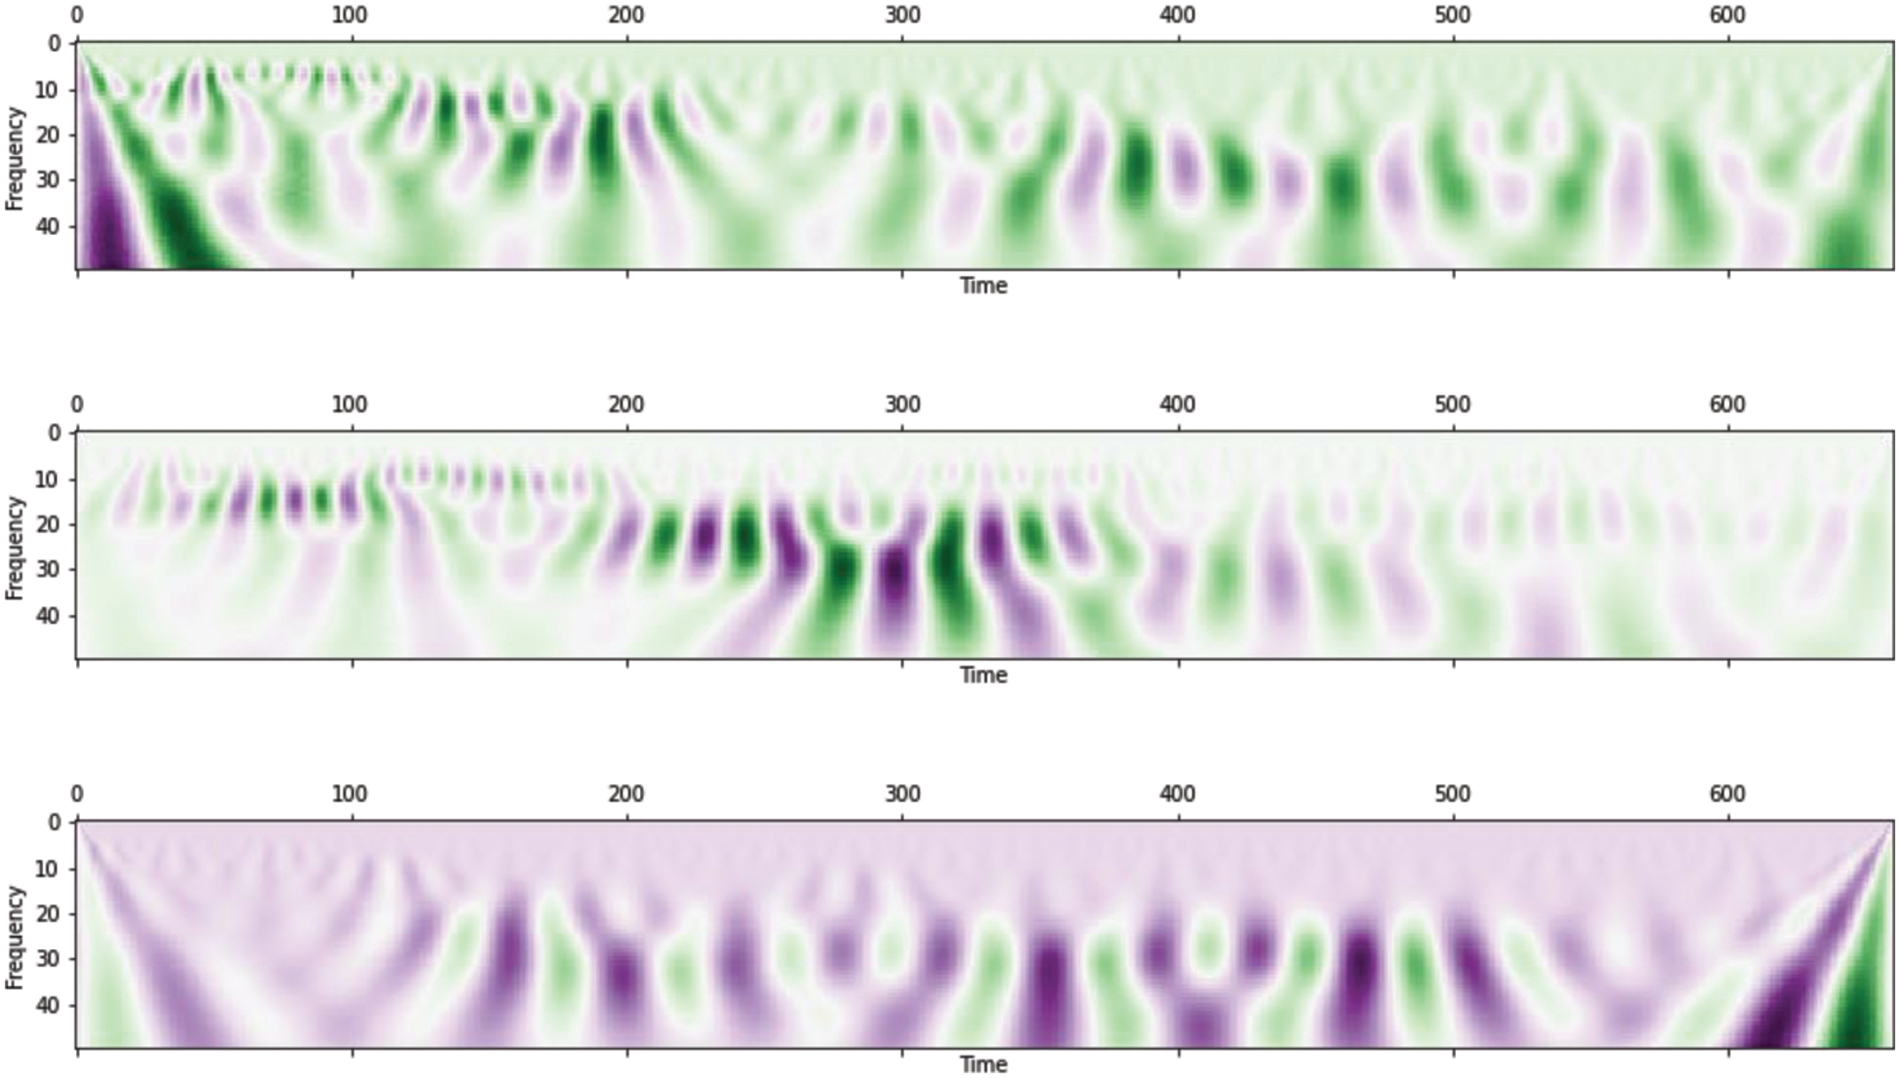
Figure 5: Time-frequency representation of TEOAE signals obtained from 3 different subjects, using CWT
The CWT of TEOAE signals of different subjects is given in Fig. 5. Liu and Hatzinakos in their work, had used a Daubechies 5 wavelet extracted at a scale factor in the range of 5 to 9, which served as a good time-frequency representation from the original signal [8–18]. In our experiment, we employ Morlet wavelet as the mother wavelet, with a scaling factor between 11 to 13, which empirically performs better than Daubechies 5 i.e., it distinguishes individuals with improved accuracy. The Morlet wavelet is given by Eq. (2):
3.3 CNN Based Feature Extractions
Convolutional neural networks are known classifiers that significantly improve the recognition results. State of the art face identification results were achieved by Schroff et al. [19] using a triplet loss network. Kang et al. [9] in their work, used CNN classifier for person identification with TEOAE signals. In our work, we employ various CNN models (refer Tab. 5) for the extraction of feature maps corresponding to the TEOAE signals. These feature maps, representing the TEOAE signals, form the input to the classifiers. The approach of using CNN as a feature extractor (rather than as a classifier) is discussed in Section 4.
CWT of the TEOAE signal as input to a 2D-CNN model. The feature map obtained using the 1D-CNN is given by Eq. (3), fl: ℝm×n×k → ℝP
where bil is the bias of the ith convolutional filter in the final convolutional layer l, sjl-1 is the jth convolutional output of the (l-1th) layer, Wjil-1 is the filter coefficient, and conv1D (Wji, sjl-1) is the one dimensional convolution. The feature map obtained using 2D-CNN is given by Eq. (4):
where the input image is denoted by i and our kernel by k. a and b represent the rows and columns of the resultant matrix while x and y are the rows and columns of the kernel, respectively. Since 2D-CNN based feature extraction gives us higher accuracy, we explore various pretrained networks such as AlexNet, VGG-16, ResNet50 along with a simple 2-layer 2D-CNN model. We then evaluate the performance of the 1D-CNN, the 2D-CNN feature vector and also the concatenated feature arrays of 1D and 2D-CNN models (Multi-headed CNN). The performance results are given in Tabs. 2 and 5.
Since the 1D-CNN and 2D-CNN features extracted earlier have very high dimensions, Principal Component Analysis (PCA) is used to reduce the dimensionality by generating fewer uncorrelated variables that maximize variance.
3.5 Classifiers for Person Identification
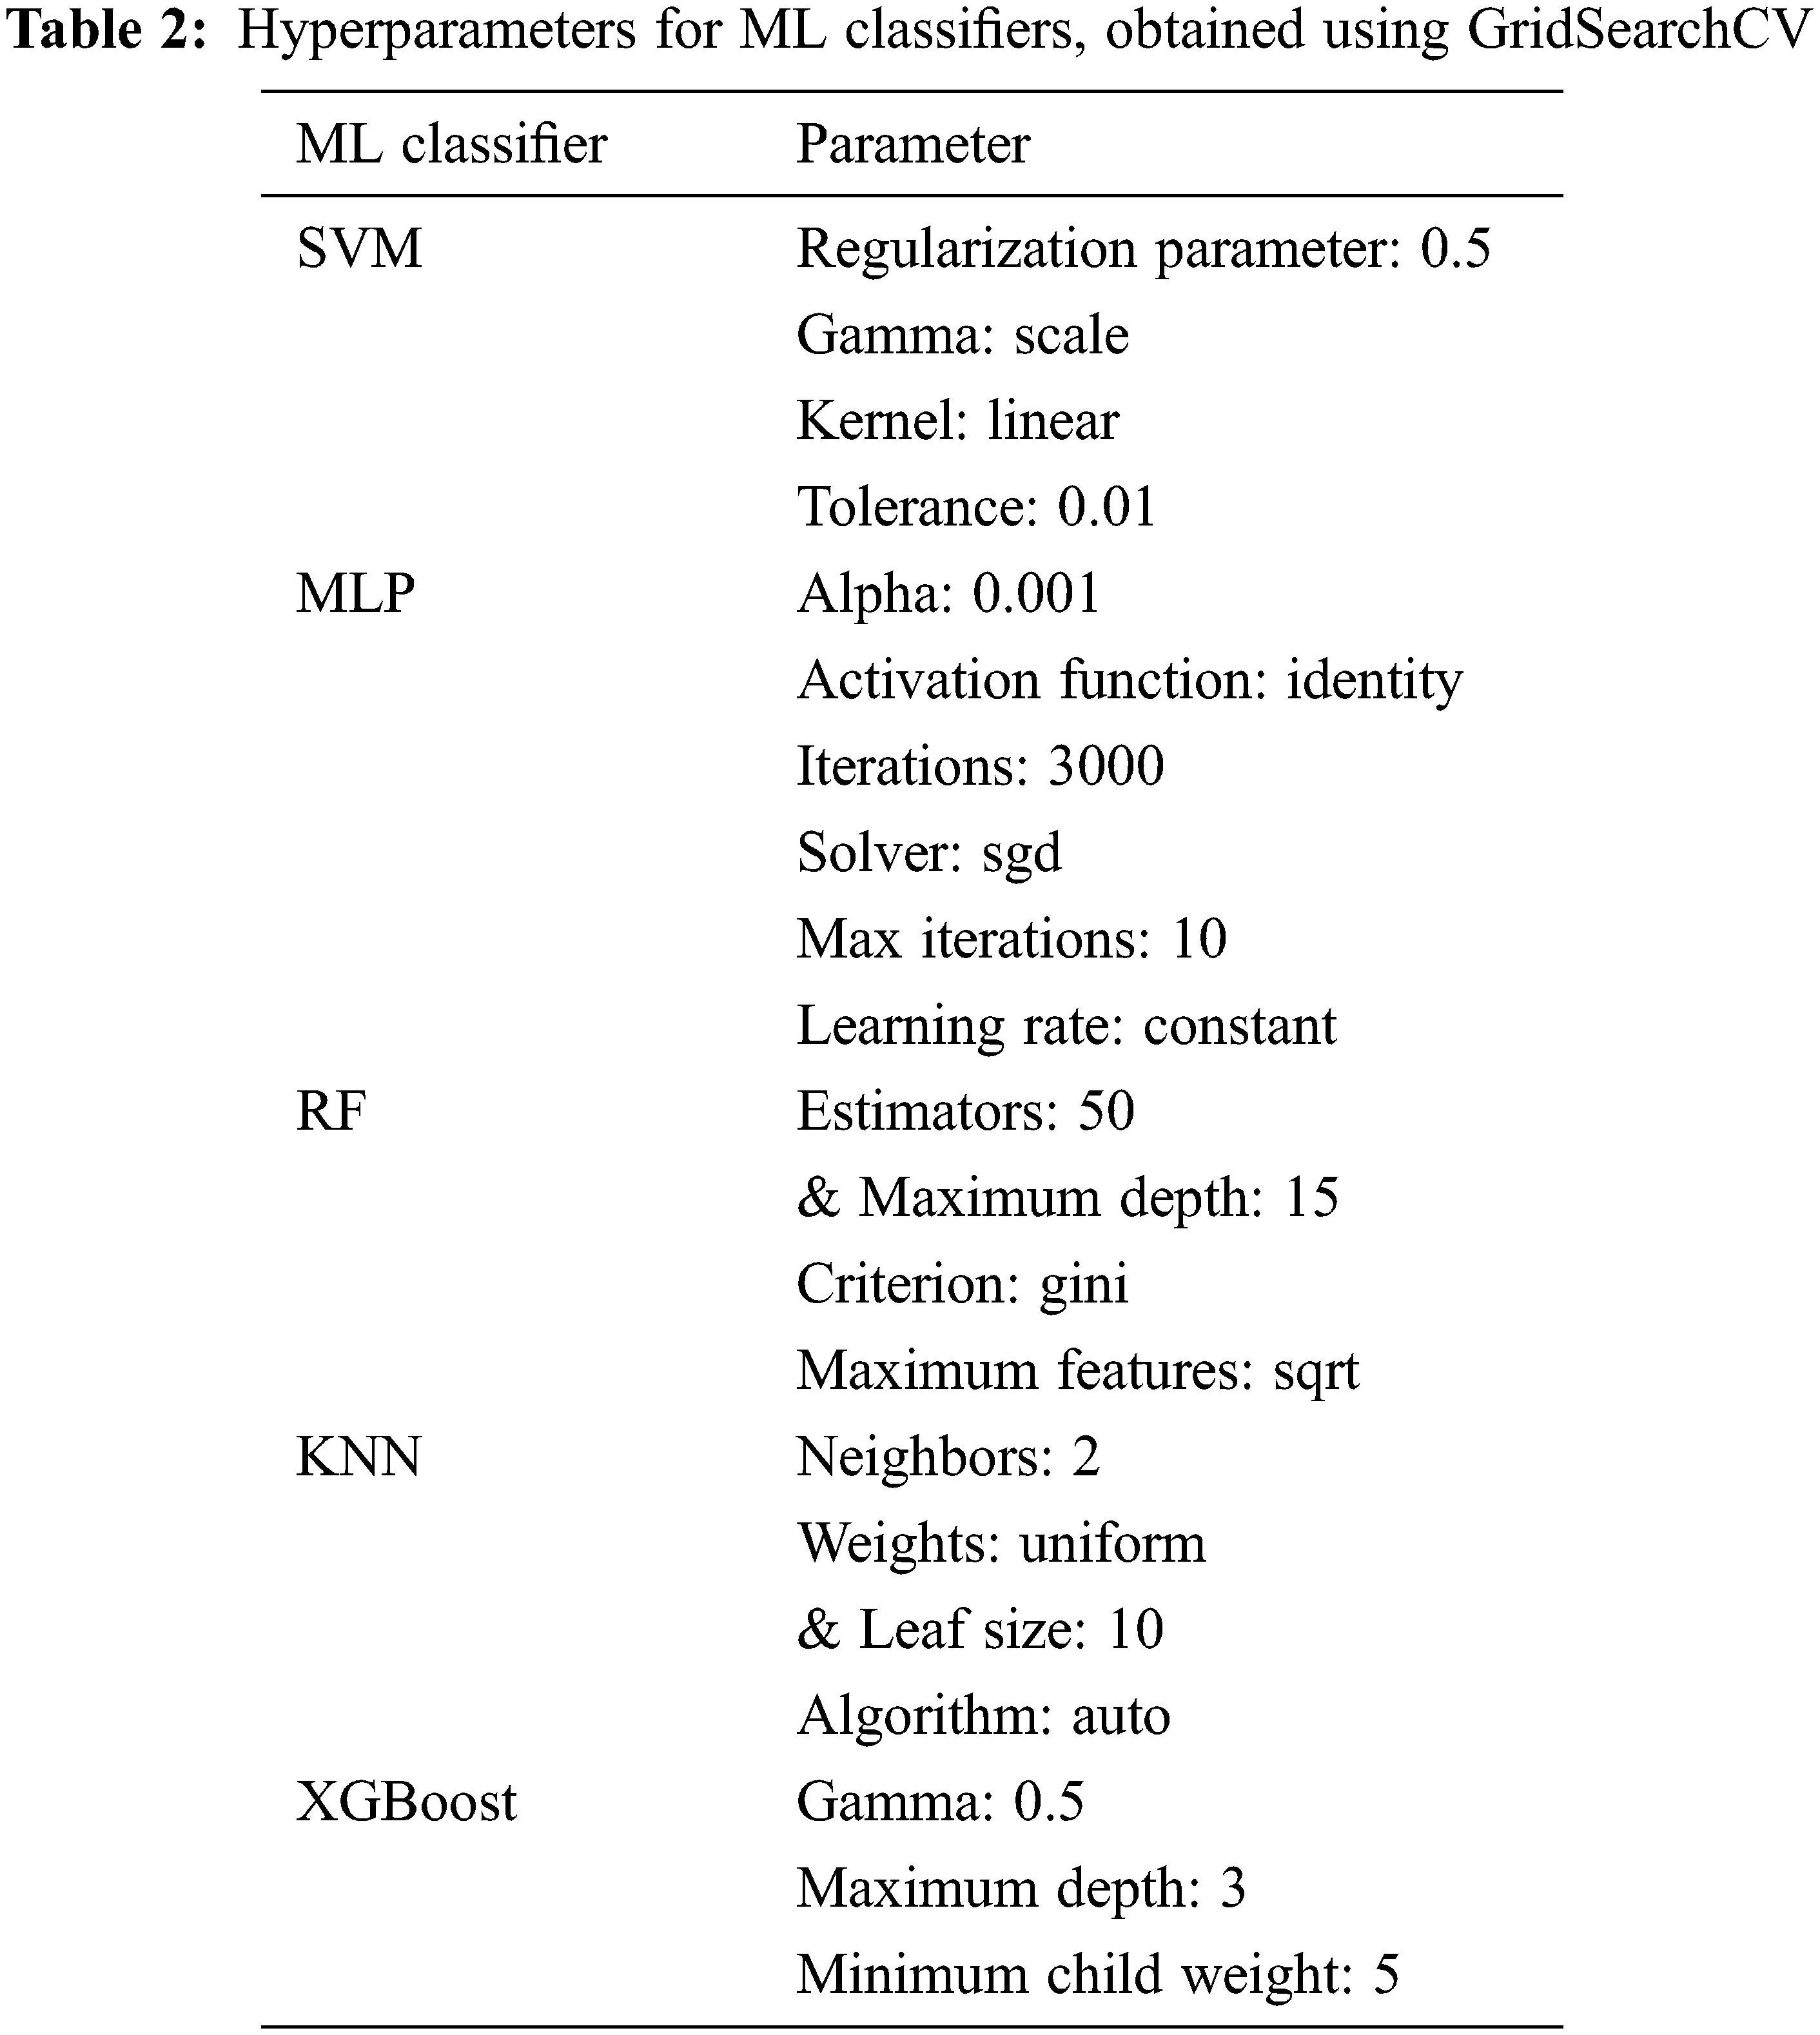
Performance evaluation is done by passing the extracted CNN-based features to various machine learning models. In order to assess the generalizability of the proposed models to unseen TEOAE signals, a K-fold cross-validation (in our case, K = 10) is performed. For this, the dataset is split into K subsets using random sampling (to ensure each part contains samples from all the classes). The identification experiments are run K times, each time using different K-1 subsets for training and the Kth subset for testing. The mean and standard deviation for the 10 iterations are noted. The identification results are discussed in Section 4. The various statistical models used for our evaluation, and the corresponding hyperparameters values used are listed in Tab. 2. To ensure hyperparameter optimization, we make use of grid search for all our classifiers.
3.5.1 Support Vector Machine (SVM)
With the kernel K(a, b) = exp(−γ * || (a − b) || 2), where a, b are the multiplication of each pair of input values, γ is the scale factor in the range 0 to 1 and || (a − b) || represents the Euclidean distance between a and b. The radial basis function is used as a kernel here, with all classes having equal class weights (i.e., 1).
3.5.2 Multilayer Perceptron (MLP)
With three hidden layers, and with 100, 150 and 100 neurons, respectively. We run the MLP for 50 iterations with a learning rate of 0.0001, computed using Adam optimizer, with Rectified Linear Unit (ReLU) as the activation function for all layers given by f (x) = max (0, x).
Using gini index given by Gini = 1 − Σi = 1n (fi) 2. For our classifier, we use 100 trees, where the square root of the number of features determine the split factor.
3.5.4 K-Nearest Neighbor (KNN)
Using Euclidean distances between the unseen data point and the five nearest neighbors, given by Dist (d, d’) =
Using a gradient boosting tree algorithm.
The dataset of eighty TEOAE signal recordings (stable, late responses) of each of the 54 subjects (totaling 4320 signals) are split into train and test sets in various ratios. We consider three train-test split criteria, which are 80–20, 70–30 and 60–40 ratios, respectively. In the 80–20 split, we use 80% of our dataset to train the model and 20% to test the model performance.
Similarly, we split the respective amount of data into train and test sets for the 70–30 and 60–40 splits. The train and test sets are ensured to have no null values, and class imbalance is avoided. The performances for different train-test ratios are tabulated in Tabs. 5 and 6.
4.2 2 D-CNN and 1D-CNN for Extracting Feature Maps
CWT portraits of TEOAE signals are given as input to a 2D-CNN. The corresponding feature maps of this CNN are considered as higher dimensional features representing the TEOAE signal. A 93,312-dimensional feature map is obtained, corresponding to each TEOAE signal. PCA is then performed on these feature maps and the resulting lower dimensional features (in our case, 264 dimensions) are used as input vectors to build machine learning classifiers (using SVM/MLP/RF/KNN/XGBoost). As a comparison, TEOAE signals are directly input to a 1D-CNN, whose feature maps are considered as features representing the TEOAE signals. These features derived from the 1D-CNN are given as input to build machine learning classifiers. In both the cases (2D-CNN and 1D-CNN), the CNN is used as a feature extractor. The PCA on the CNN feature maps result in a lower dimensional feature vector representing the TEOAE signals. The architectural descriptions of our 1D and 2D-CNN models are given in Tabs. 3 and 4.
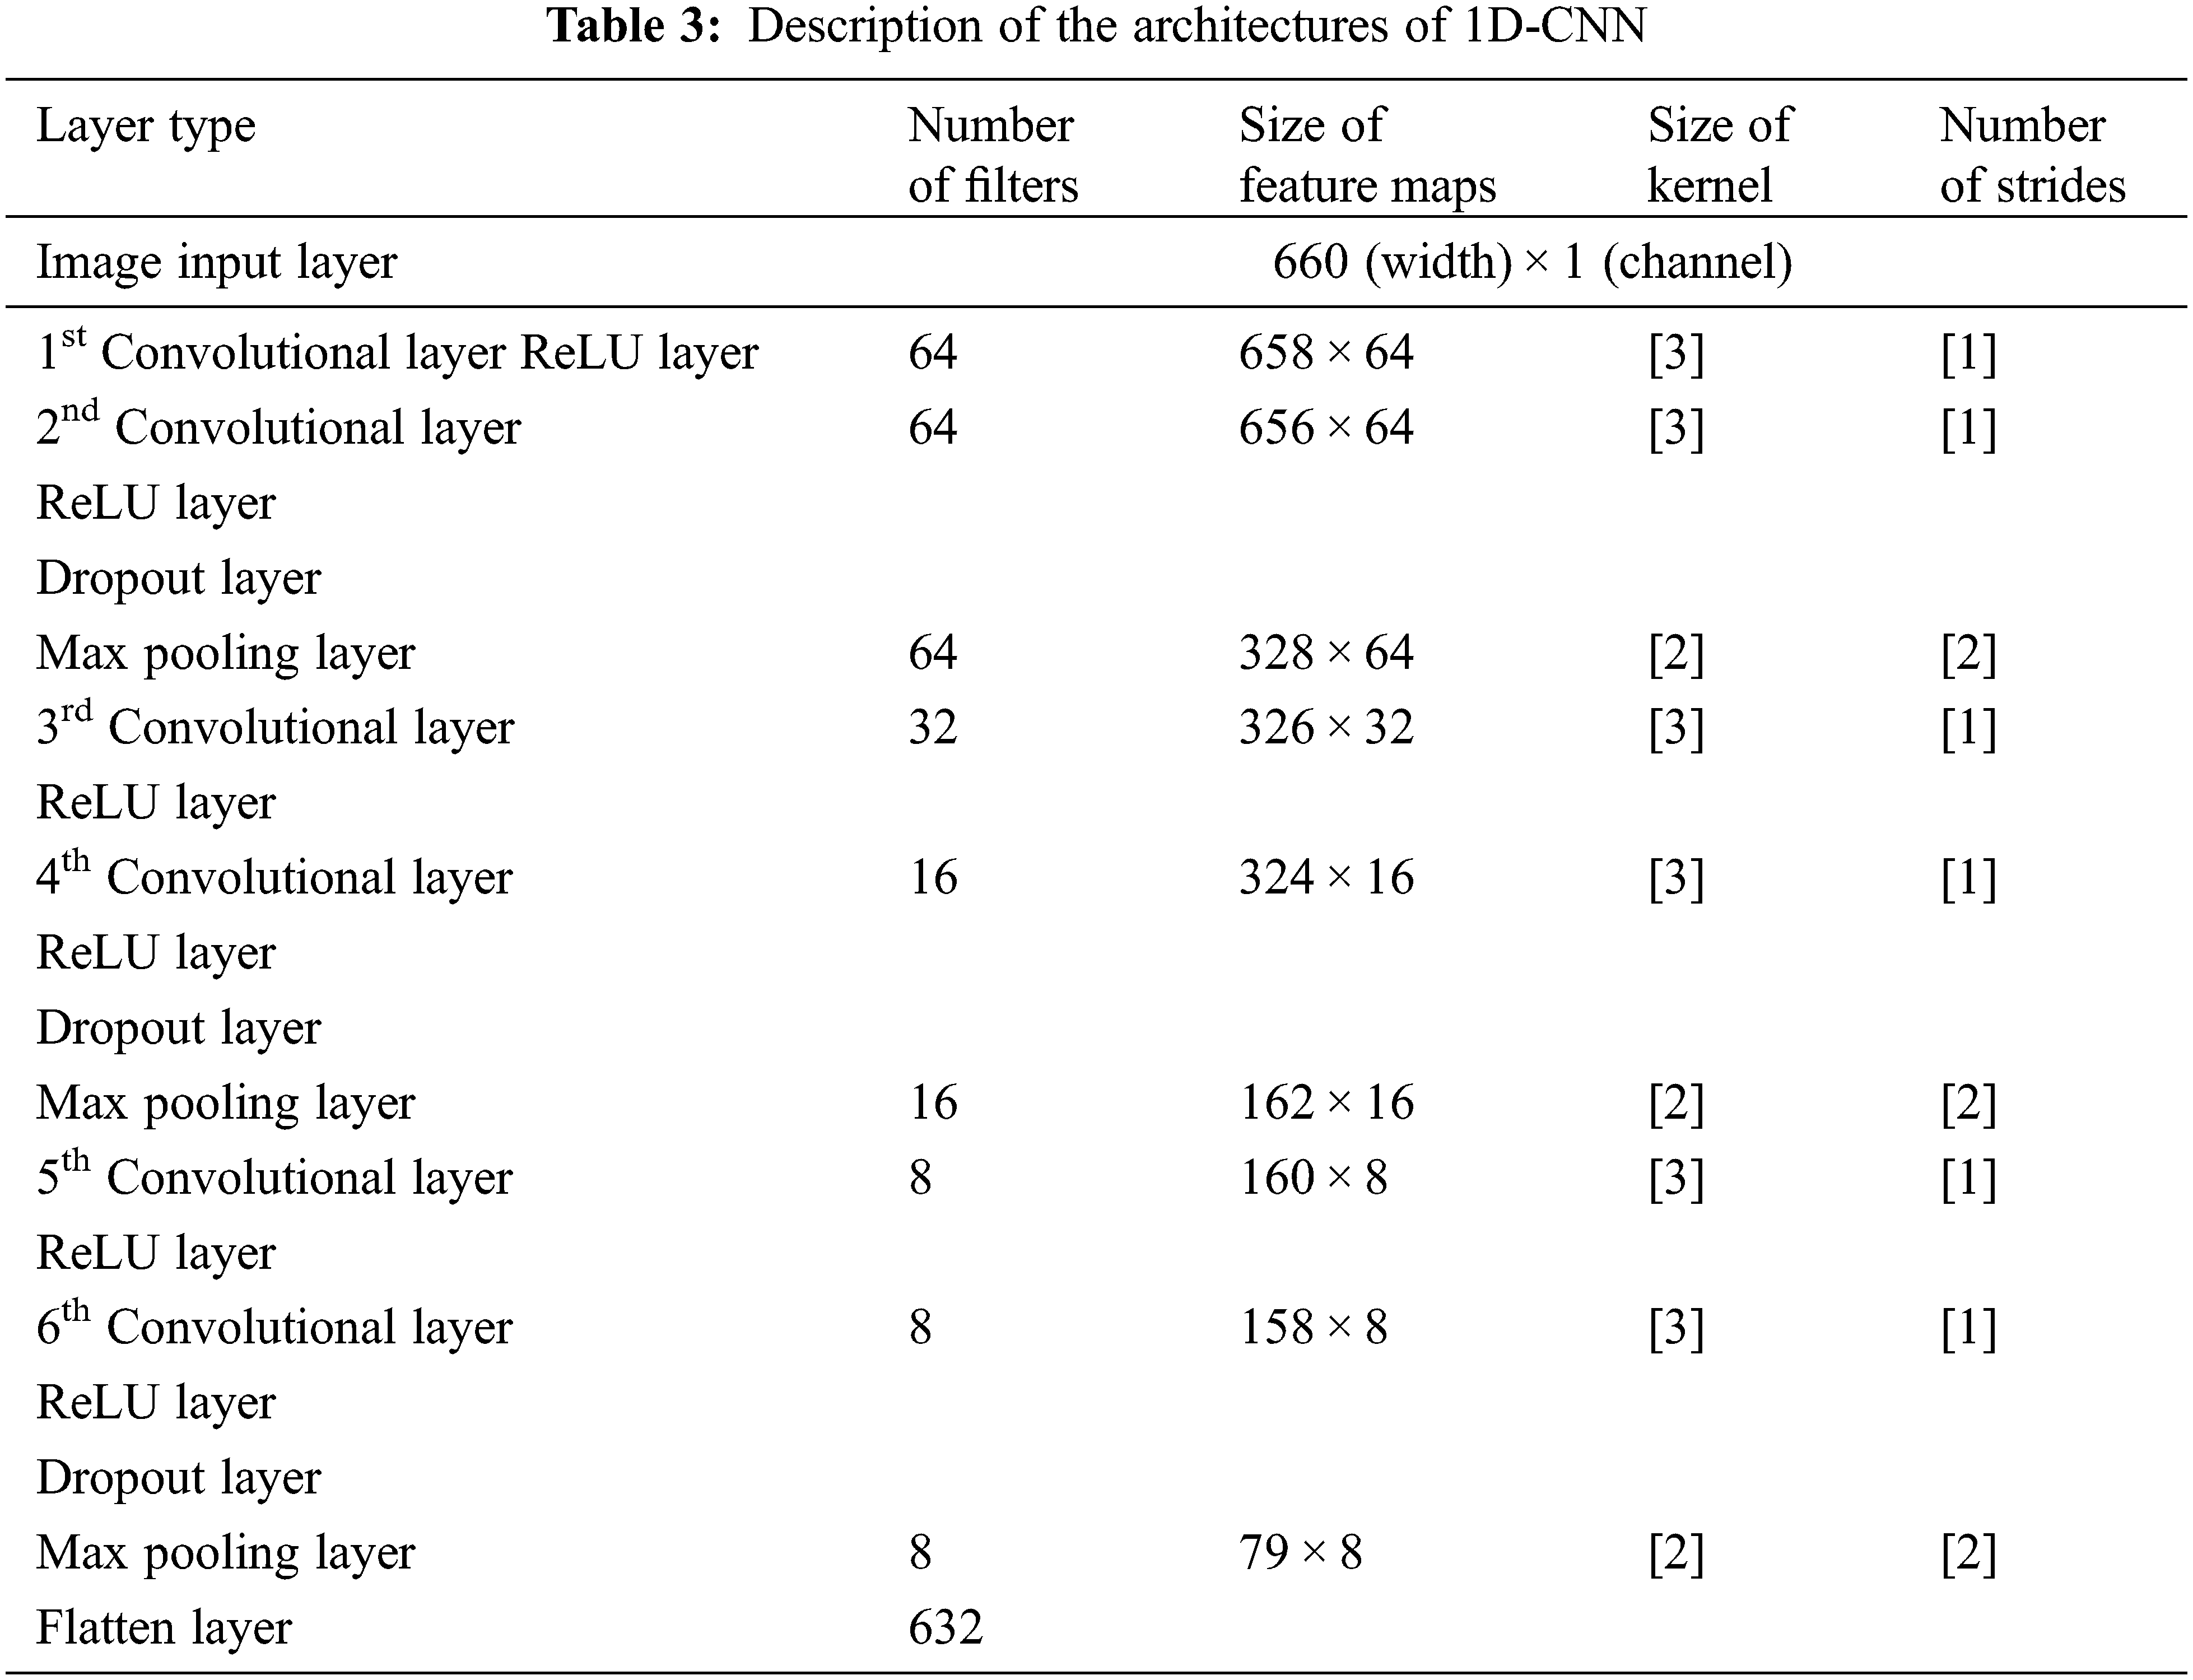
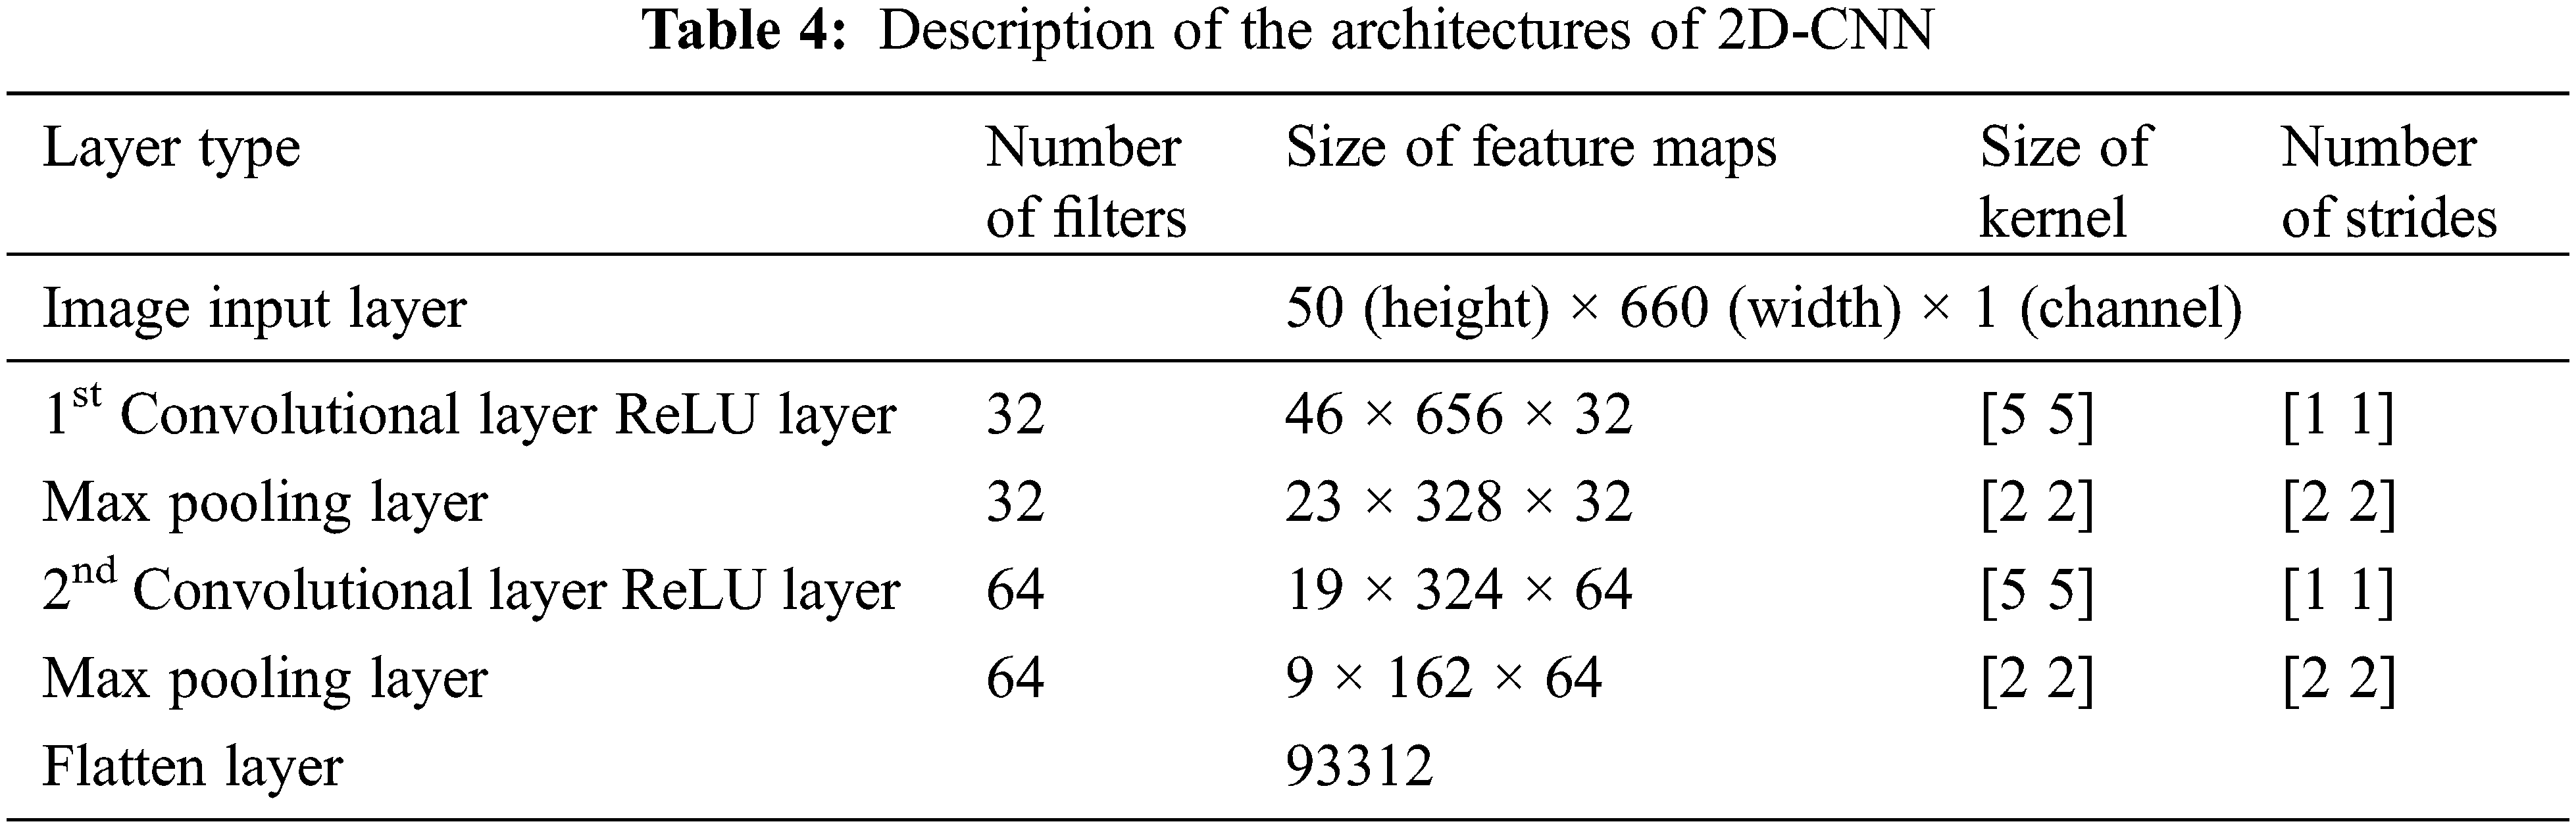
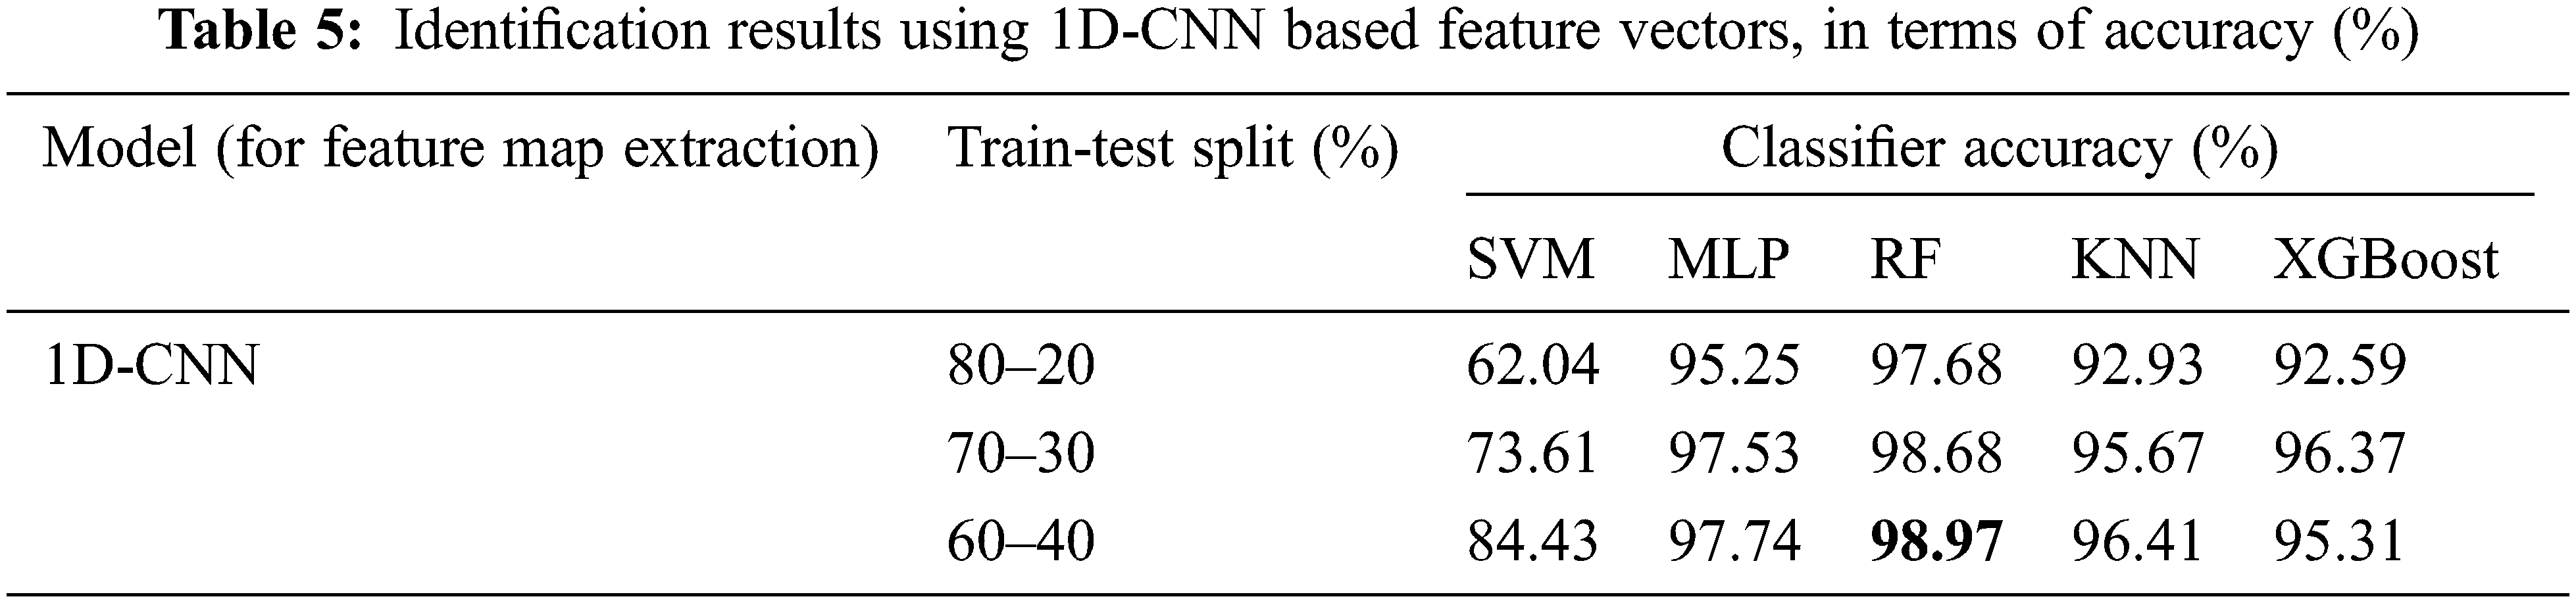
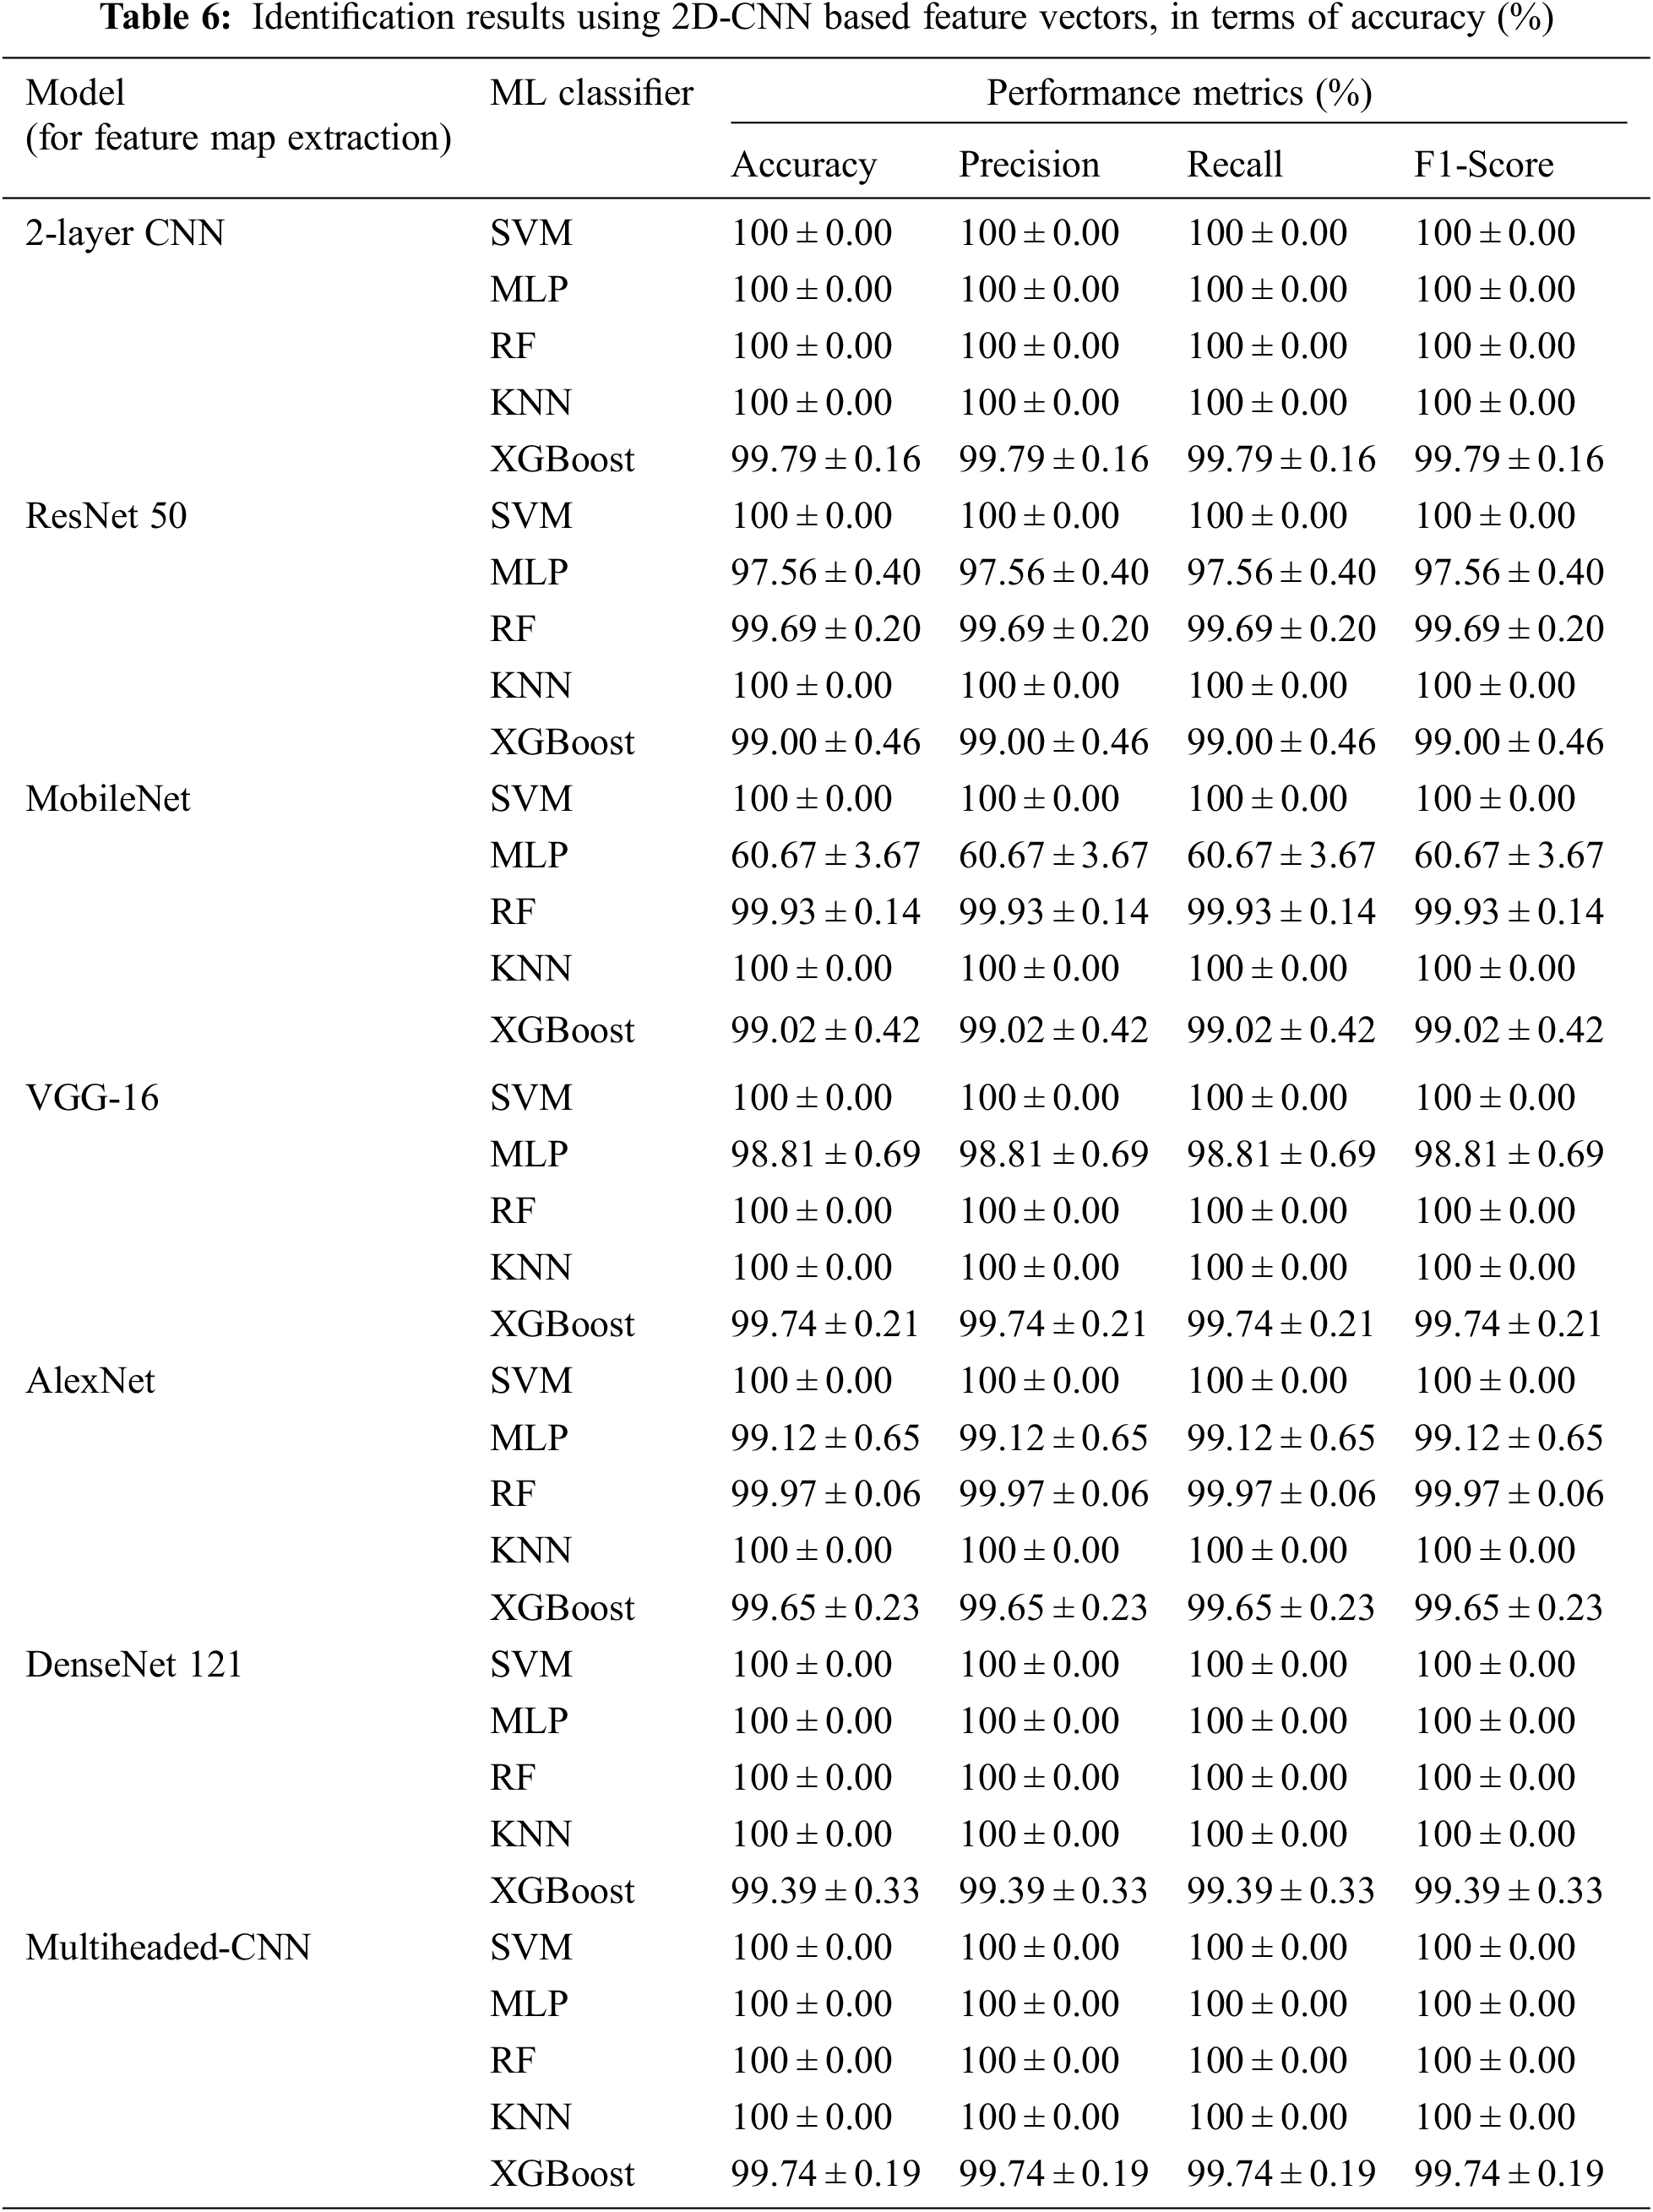
Fig. 6 depicts the t-distributed Stochastic Neighbor Embedding (t-SNE) plots that help in visualization of the feature map representation of the TEOAE signals of the 54 subjects. Each data point in this figure corresponds to the CNN feature map of a TEOAE signal. The intra-class similarity and inter-class variability seen here shows the effectiveness of using CNN-based feature maps as discriminating representations of the TEOAE signals that help in better classification (person identification), rather than the approach of [9] that uses the CNN as a classifier.
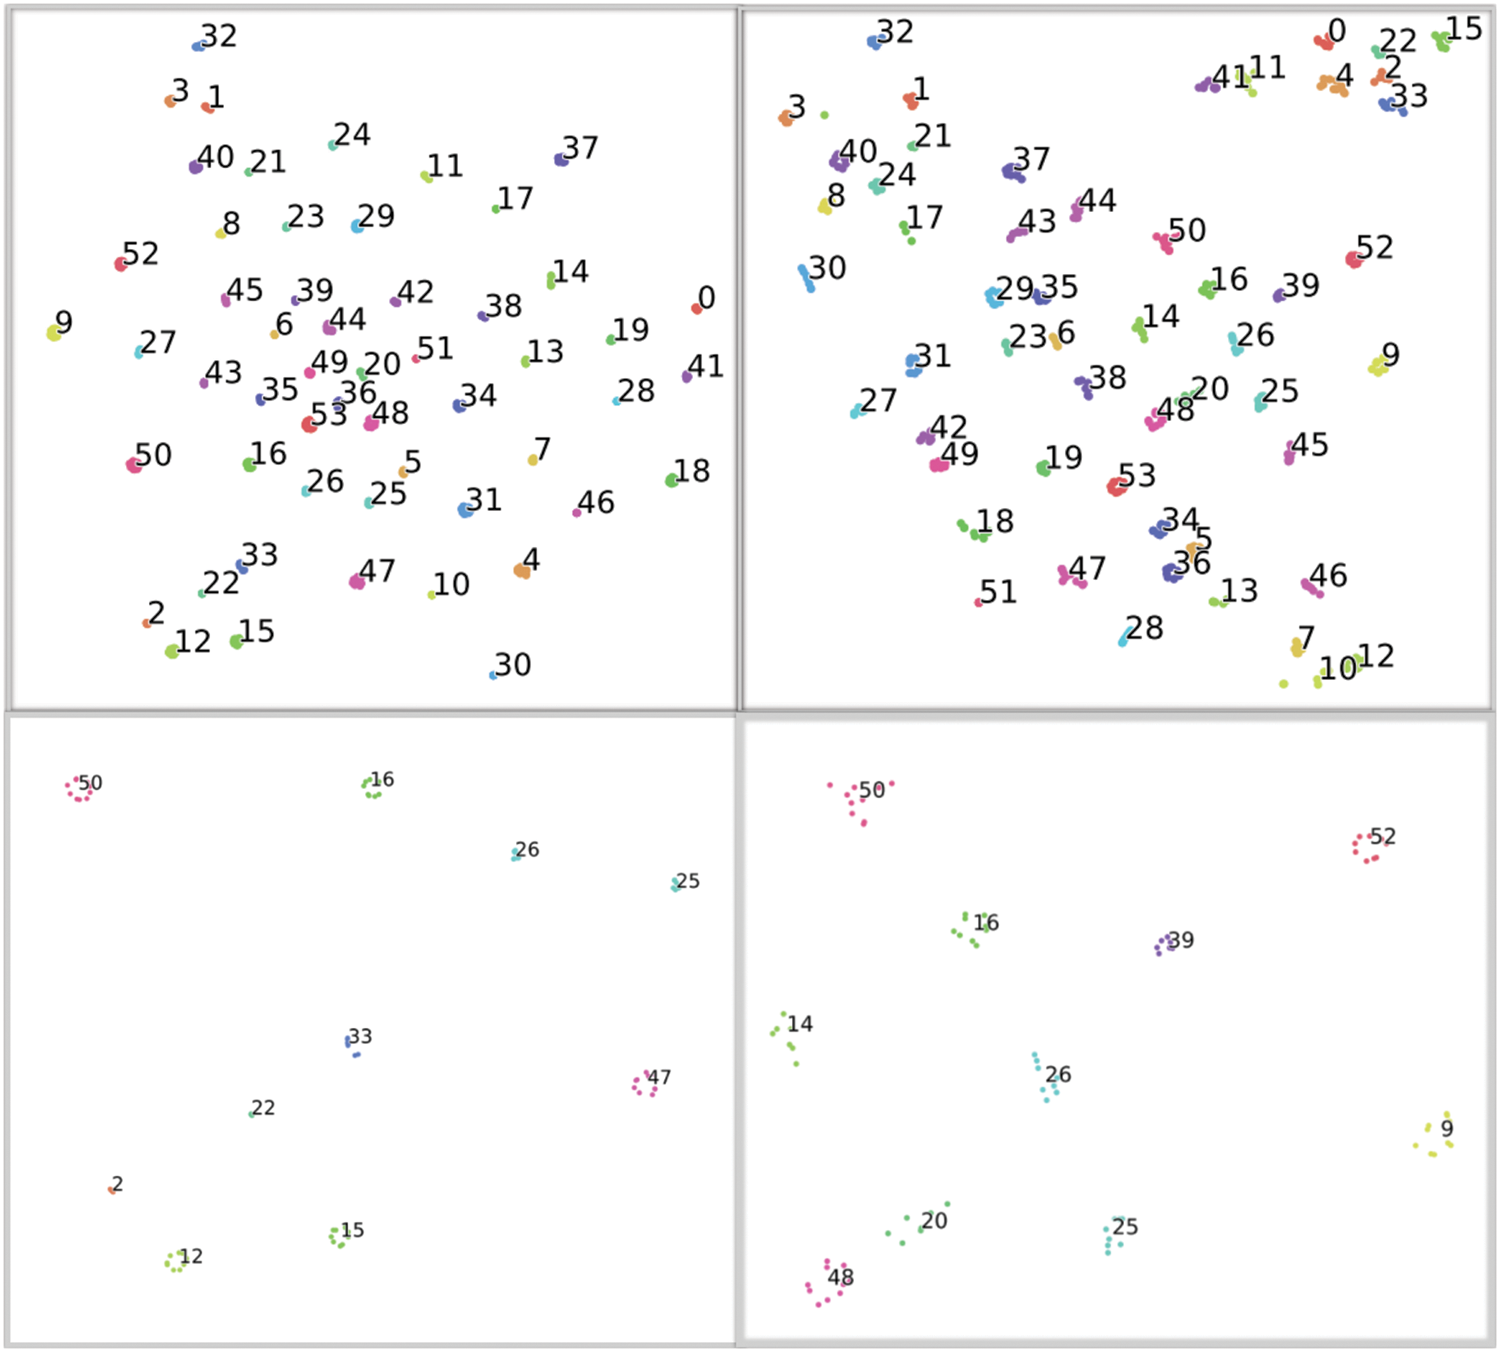
Figure 6: Visualization (using t-SNE) of TEOAE signals (of one ear, one session and one buffer for 54 subjects), represented by CNN-based feature maps, using 2D-CNN (top left) and 1D-CNN (top right). Figures in the bottom left and bottom right depict the corresponding zoomed-in versions for 10 classes (2D-CNN and 1D-CNN, respectively) for better clarity. Each colored cluster represents the data points (feature maps) for one subject
The classifier is evaluated on standard metrics of precision, recall, F1-score, and accuracy. The outcome of the classification could be True Positives (TP), True Negatives (TN), False Positives (FP) or False Negatives (FN). True positive refers to the case where subject A is correctly identified as subject A. False positive refers to the case when some other subject is wrongly identified as subject A. True negative is the case where all the subjects other than subject A are correctly identified as “not subject A”. False negative is when subject A is misidentified as some other subject.
i) Precision (as given in Eq. (5)) is the ability of a classifier to predict the positive samples as positive out of all the positive predictions made by the classifier.
ii) Recall (as given in Eq. (6)) is the classifier’s ability to measure the number of correct positive predictions made out of all predictions thatcould have been made.
iii) F1 score (as given in Eq. (7)) is the harmonic mean of Precision and Recall and provides a better measure of the incorrectly classified cases.
iv) Accuracy (as given in Eq. (8)) is the ability of the classifier to distinguish classes properly.
Tabs. 5 and 6 depict the results for various models used in our experiment. When the 1D-CNN based features are used (derived by directly giving the TEOAE signals as input), SVM classifier gives the higher performance, with an F1-score of 99.3. However, there is a boost in performance when 2D-CNN based feature vectors are used (derived by giving the continuous wavelet transform of the TEOAE signals as input). The 10-fold cross validation shows that SVM, KNN, RF and (for some CNN models) MLP classifiers give an average F1-score of 100. Here, the assumption is that the test set, given by the randomly selected samples comprising 1/10th of the data, well represents the unseen data. The data, comprising recordings of the TEOAE signals in two different sessions, separated one week apart, takes into consideration the intra-class variability. With the test set reflecting this intra-class variability, an F1-score of 100 implies that the models have generalized well over the training samples.
On a comparative note, we pass the CWT of the TEOAE signals to a 2D CNN used as a classifier (as opposed to using the CNN as a feature extractor, as we have done so far). The best identification performance of the CNN classifier obtained is 95.8%. Fig. 7 shows the comparison in performance of the proposed 2-layer CNN feature extractor with machine learning classifiers, against the CNN being directly used as a classifier. It is observed that more robust features are captured by the former when compared to the latter. Since better identification rates are assured by using the CNN as a feature extractor, our study adopts this approach.
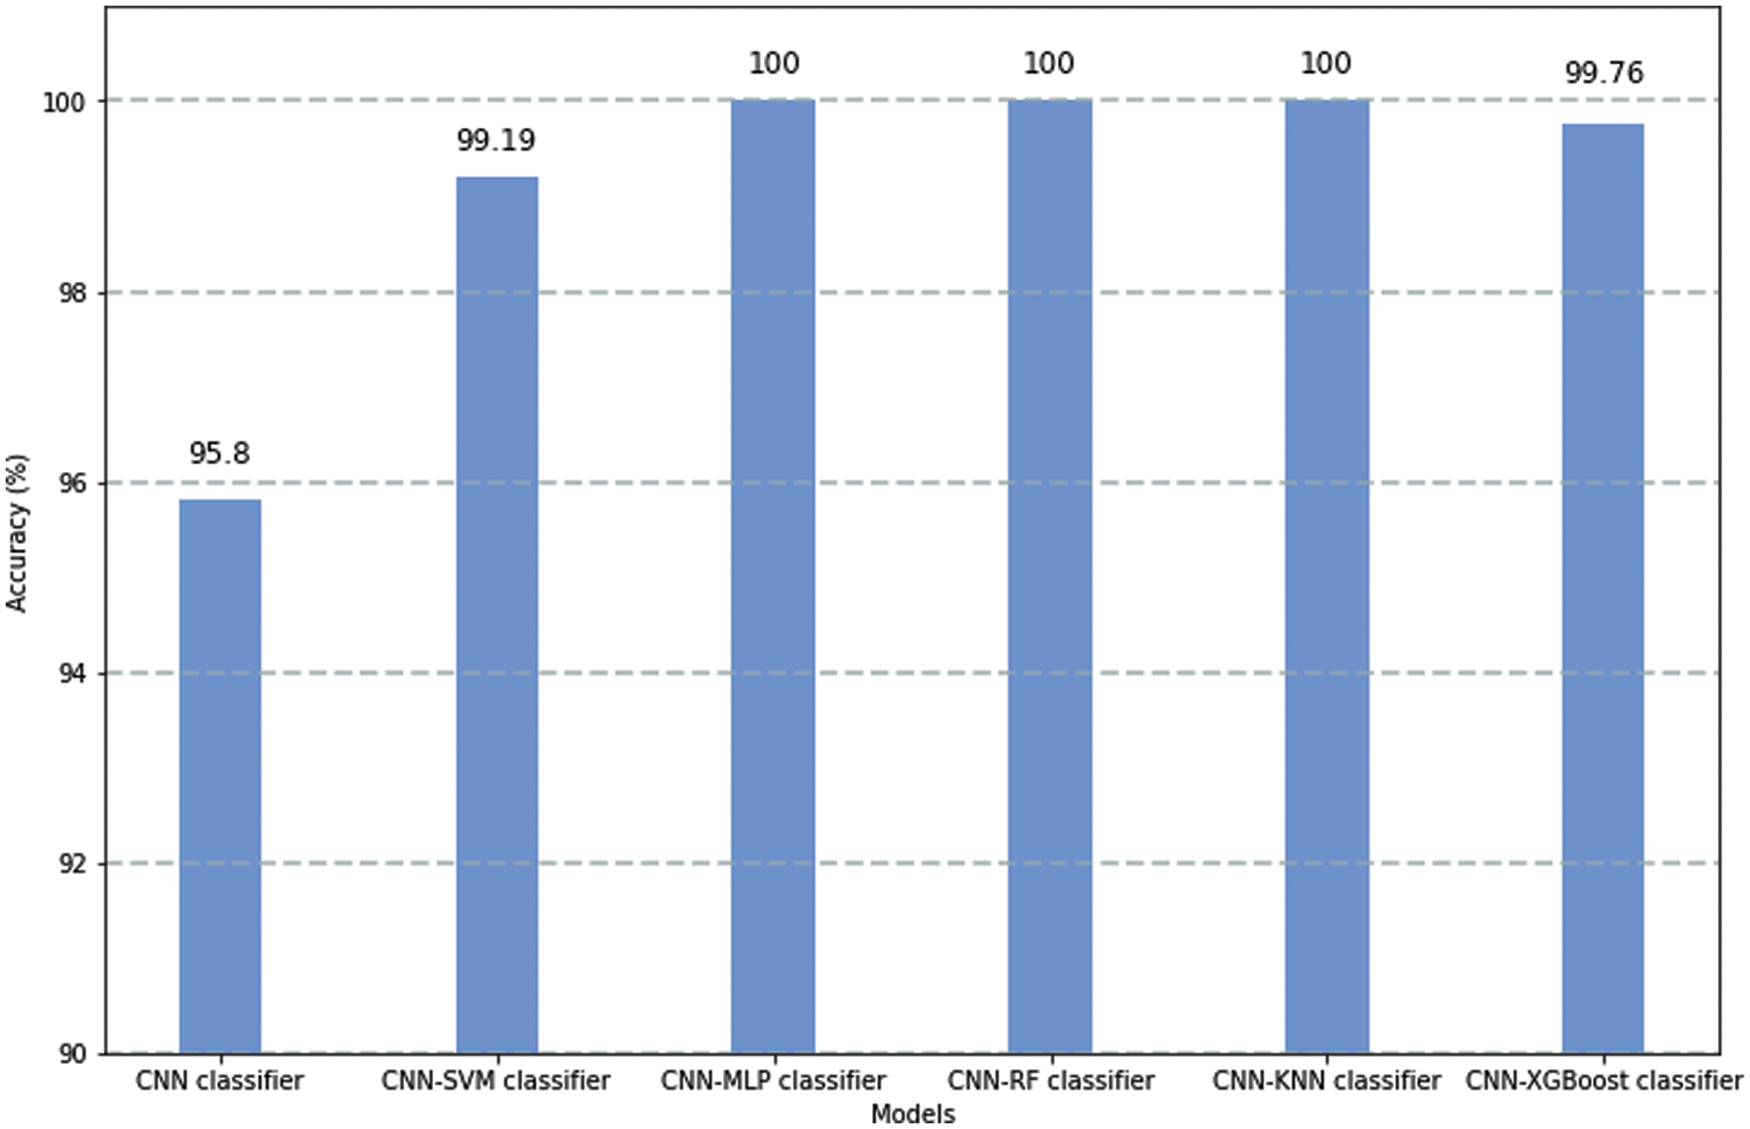
Figure 7: Identification accuracies obtained when CNN is used as a classifier and as a feature extractor
Tab. 7 shows the comparison of the proposed 2D-CNN based identification results with the best performing identification results among previous works reported in literature. We compare our best performing Resnet50-CWT and CNN-CWT models with the CWT/LDA method proposed by Liu and Hatzinakos [18], neural network with SVM and mean templates by Kang et al. [9], and the state-of-the-art EarNet model proposed in our previous work [21]. Our models outperform all the previous works, achieving a perfect identification accuracy of 100 ± 0.00% with bothResNet50 and 2-layer CNN models.
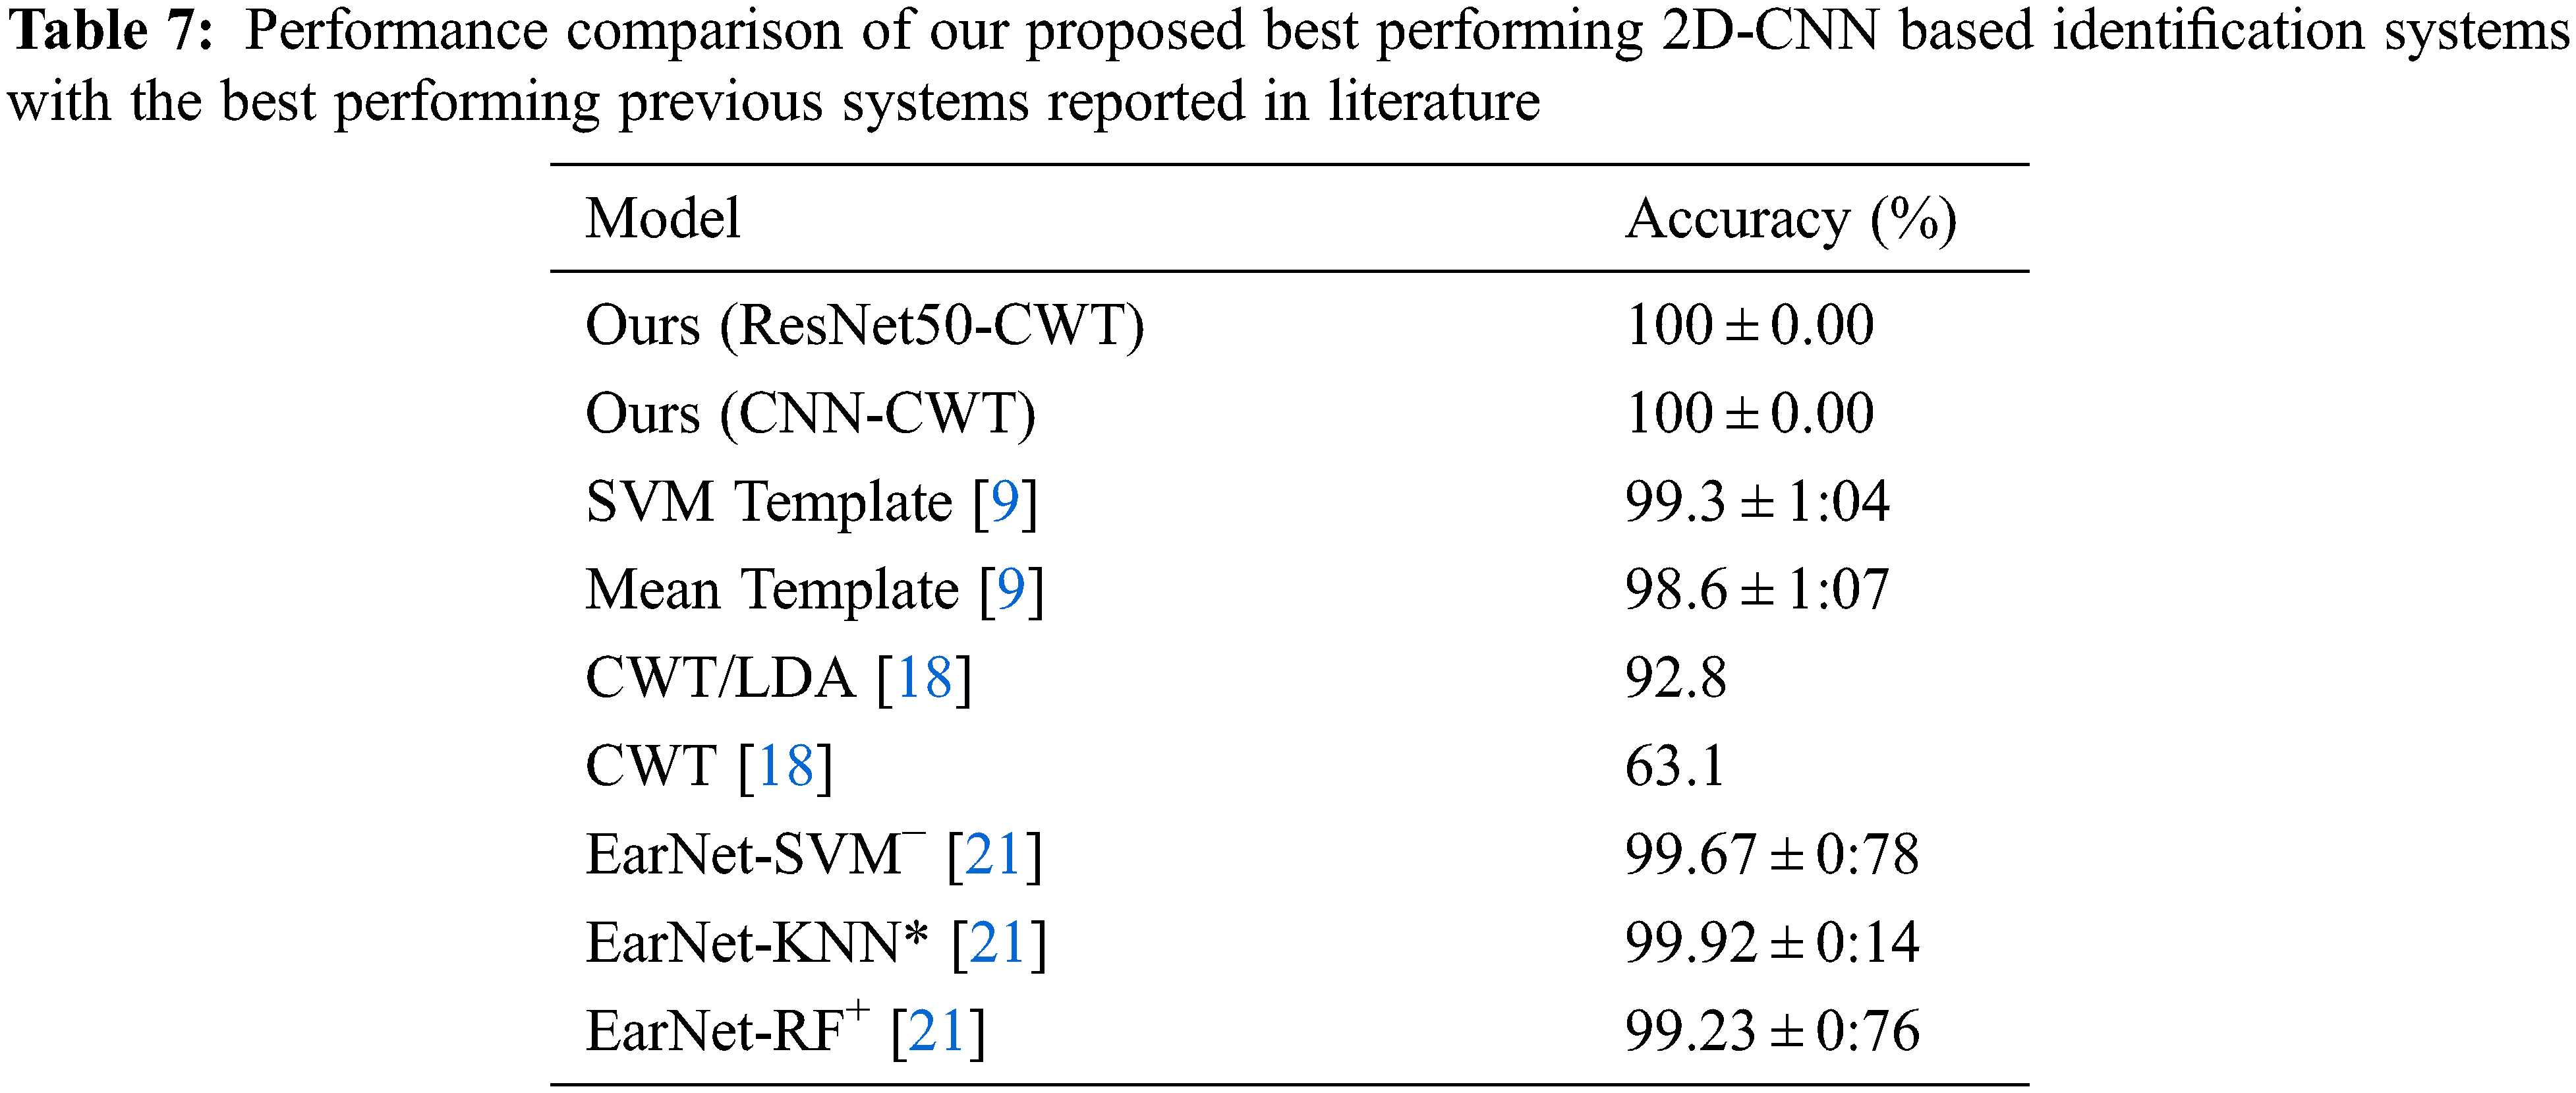
A statistical comparison is done on the proposed technique with the state-of-the-art technique [21], by performing marginal homogeneity tests (Stuart-Maxwell or the generalized McNemar test, and Bhapkar’s test) [22–25]. These tests are chosen since the outcomes of the algorithms are classified into multiple categories (54 in our study). Note that if there are two categories, then McNemar test is sufficient. A Chi-square test is also performed. The p-value obtained in each of the tests is >0.92. Absence of statistically significant difference between the proposed algorithm and the best performing state-of-the-art algorithm is understandable, given that the best accuracy of our study is 100%, while that of the contemporary algorithm being 99.92%. The difference is 0.08%. However, our study introduces CNN embeddings of the CWT of TEOAE signals as features that are rich in inter-class discrimination, and showcases them as a viable alternative to the state-of-the-art EarNet embeddings (refer Tab. 7). The proposed technique is significant, as the unique feature extraction and modeling approach employed here have resulted in a cent percent accuracy, better than any other technique reported in literature.
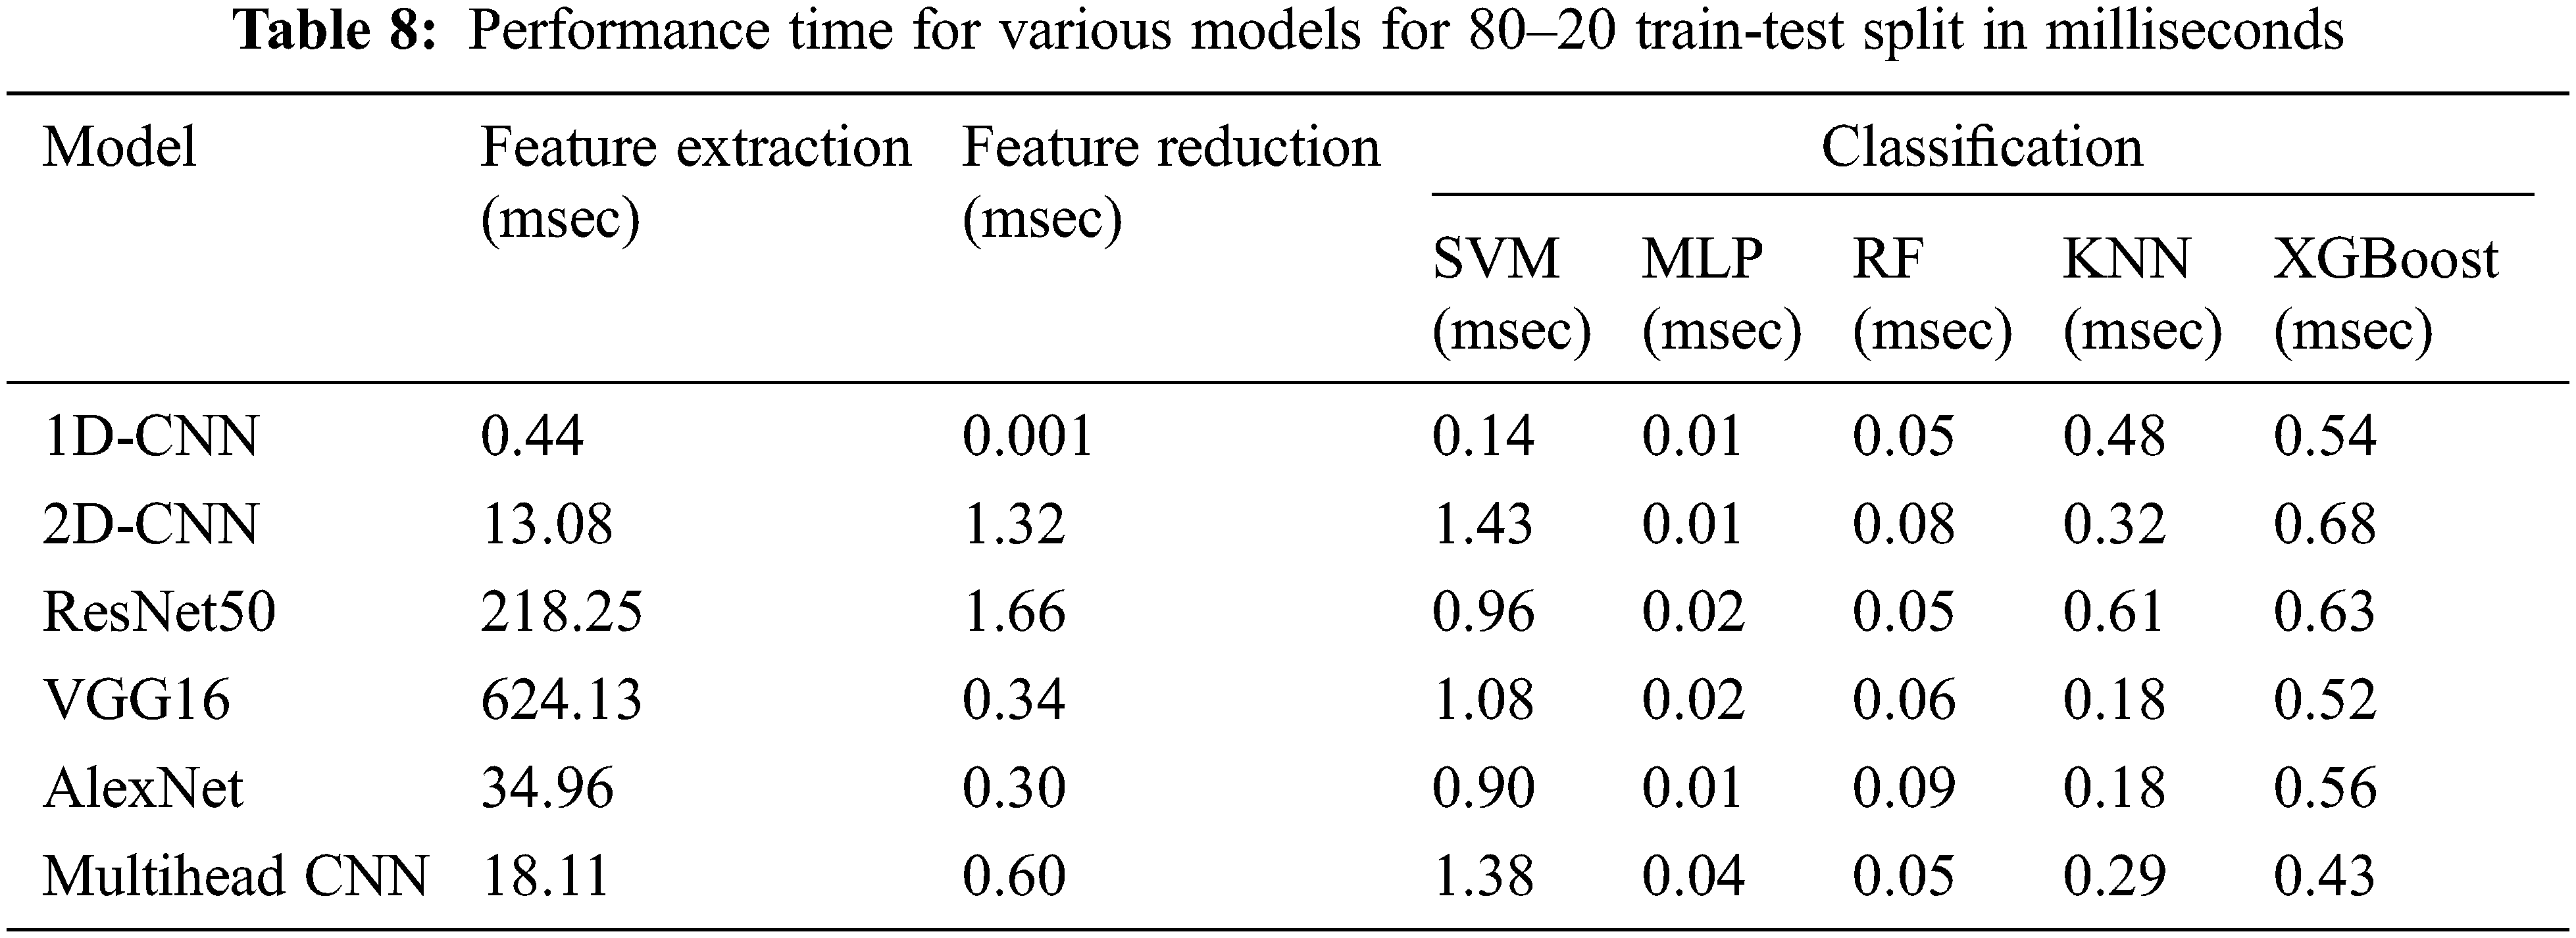
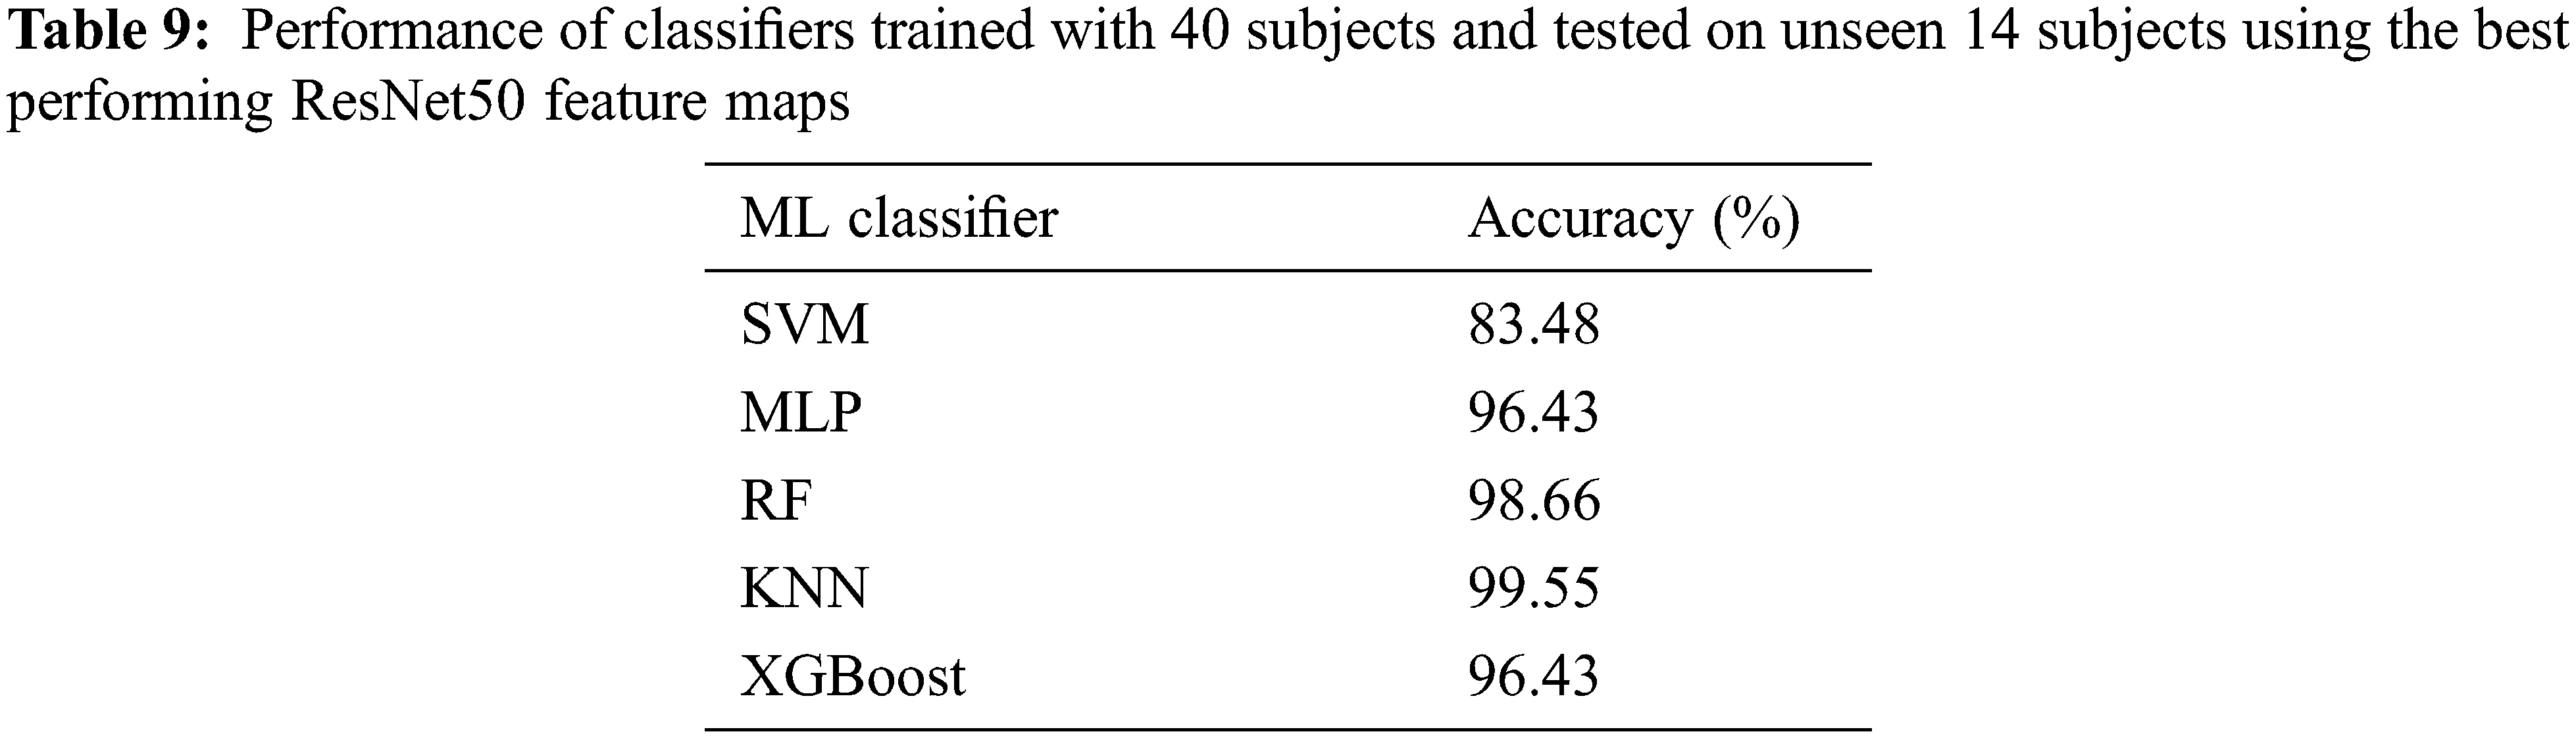
Tab. 8 shows the performance time comparison for our 1D- and 2D-CNN based models. We consider the time taken for feature extraction, feature reduction, and classification using the ML classifiers (SVM, MLP, RF, KNN, XGBoost) for our various CNN models. All the computations are run on Intel i7-7500U CPU. The identification system would be considered to generalize well if it performs well on new subjects, never seen during training. The system would then be considered to be scalable for a real world scenario that would involve large number of subjects. For this purpose, we split the dataset into training and testing sets, with respect to the subjects. The signals from 75% of the subjects are considered for training, and those from the remaining 25% of the subjects are considered for testing. This ensures that the test subjects are not seen during training. The performance of the ResNet50 based identification model (chosen, as it is the best performing model in our study as seen from Tabs. 5 and 6), trained using the 75% subjects and tested on the remaining 25% subjects using various classifiers, is given in Tab. 9. The accuracy of 99.55% (obtained using KNN classifier) shows that the ResNet50-KNN model generalizes well on new subjects. This accuracy, along with an overall performance (including feature map generation, dimensionality reduction and classification) time of 220.52 ms, shows the feasibility of using ResNet50-KNN model for building a real time TEOAE based person identification system.
Since TEOAE signals as a biometric are immune to falsification attacks, in our paper we present a person identification system using these signals. TEOAE responses collected from the University of Toronto’s Biometric Security Lab is used as our dataset. From the dataset, we obtain a time-frequency representation of the signals. Our unique approach of using the principal components of the CNN feature maps, derived from the CWT of the TEOAE signals as feature vectors, for identification using machine learning models yield state-of-the-art accuracy results. Our solution outperforms all previous works. Future studies can be done on a larger dataset, and by exploring alternate feature representations of the TEOAE signal.
Acknowledgement: The authors would like to thank the Biometrics Security Laboratory of the University of Toronto for providing the Transient Evoked Otoacoustic Emissions (TEOAE) dataset.
Funding Statement: The authors received no specific funding for this study.
Conflicts of Interest: The authors declare that they have no conflicts of interest to report regarding the present study.
References
1. T. Matsumoto, H. Matsumoto, K. Yamada and S. Hoshino, “Impact of artificial “gummy” fingers on fingerprint systems,” Optical Security and Counterfeit Deterrence Techniques IV, vol. 4677, no. 1, pp. 275–289, 2002. [Google Scholar]
2. M. Ferrara, R. Cappelli and D. Maltoni, “On the feasibility of creating double-identity fingerprints,” IEEE Transactionson Information Forensics and Security, vol. 12, no. 4, pp. 892–900, 2017. [Google Scholar]
3. J. Zhu, T. Park, P. Isola and A. Efros, “Unpaired image-to-image translation using cycle-consistent adversarial networks,” in Proc. IEEE ICCV, Venice, Italy, pp. 2242–2251, 2017. [Google Scholar]
4. L. Chen, J. Wang, S. Yang and H. He, “A finger vein image-based personal identification system with self-adaptive illuminance control,” IEEE Transactions on Instrumentation and Measurement, vol. 66, no. 2, pp. 294–304, 2017. [Google Scholar]
5. D. McFadden and R. Mishra, “On the relation between hearing sensitivity and otoacoustic emissions,” Hearing Research, vol. 71, no. 1–2, pp. 208–213, 1993. [Google Scholar]
6. D. McFadde and J. Loehlin, “On the heritability of spontaneous otoacoustic emissions: A twins study,” Hearing Research, vol. 85, no. 1–2, pp. 181–198, 1995. [Google Scholar]
7. J. Hall, “Measurement, analysis, and interpretation of OAE data,” in Handbook of Otoacoustic Emission, 1st Ed, Florida, USA, Delmar Cengage Learning, pp. 16–65, 2000. [Google Scholar]
8. Y. Liu and D. Hatzinakos, “Biohashing for human acoustic signature based on random projection,” Canadian Journal of Electrical and Computer Engineering, vol. 38, no. 3, pp. 266–273, 2015. [Google Scholar]
9. J. Kang, Y. Lawryshyn and D. Hatzinakos, “Neural network architecture and transient evoked otoacoustic emission (teoae) biometrics for identification and verification,” IEEE Transactions on Information Forensics and Security, vol. 15, no. 3, pp. 1858–1867, 2020. [Google Scholar]
10. G. Zimatore, A. Giuliani, S. Hatzopoulos, A. Martini and A. Colosimo, “Invariant and subject-dependent features of otoacoustic emissions,” Statistics in Medicine, vol. 12, no. 1, pp. 158–166, 2002. [Google Scholar]
11. D. McFadden, G. Martin, B. Stagner and M. Maloney, “Sex differences in distortion-product and transient-evoked otoacoustic emissions compared,” Journal of Acoustical Society of America, vol. 125, no. 1, pp. 239–246, 2009. [Google Scholar]
12. Y. Liu, “Earprint: Transient evoked otoacoustic emission for biometrics,” M. S. Thesis, Department of Electrical and Computer Engineering, University of Toronto, Ontario, Canada, 2014. [Google Scholar]
13. S. Barra, A. Casanova, M. Fraschini and M. Nappi, “Fusion of physiological measures for multimodal biometric systems,” Multimedia Tools and Applications, vol. 76, no. 4, pp. 4835–4847, 2016. [Google Scholar]
14. M. Moreno, M. Ortega, D. H. Peluffo, K. C. Alvarez and M. A. Becerra, “Comparison among physiological signals for biometric identification,” Lecture Notes in Computer Science Intelligent Data Engineering and Automated Learning–IDEAL, vol. 10585, no. 1, pp. 436–443, 2017. [Google Scholar]
15. J. Chauhan, Y. Hu, S. Seneviratne, A. Misra, A. Seneviratne et al., “Breathprint,” in Proc. ACM MobiSys, New York, USA, pp. 278–291, 2017. [Google Scholar]
16. M. Swabey, P. Chambers, M. Lutman, N. White, J. Chad et al., “The biometric potential of transient otoacoustic emissions,” International Journal of Biometrics, vol. 1, no. 3, pp. 349–364, 2009. [Google Scholar]
17. N. Grabham, M. Swabey, P. Chambers, M. Lutman, N. White et al., “An evaluation of otoacoustic emissions as a biometric,” IEEE Transactions on Information Forensics and Security, vol. 8, no. 1, pp. 174–183, 2013. [Google Scholar]
18. Y. Liu and D. Hatzinakos, “Earprint: Transient evoked otoacoustic emission for biometrics,” IEEE Transactions on Information Forensics and Security, vol. 9, no. 12, pp. 2291–2301, 2014. [Google Scholar]
19. F. Schroff, D. Kalenichenko and J. Philbin, “FaceNet: A unified embedding for face recognition and clustering,” in Proc. IEEE CVPR, Boston, USA, pp. 815–823, 2015. [Google Scholar]
20. G. Tognola, F. Grandori and P. Ravazzani, “Wavelet analysis of click-evoked otoacoustic emissions,” IEEE Transactions on Biomedical Engineering, vol. 45, no. 6, pp. 686–697, 1998. [Google Scholar]
21. A. Varugeese, A. Shahina, K. Nawas and A. Nayeemulla Khan, “Earnet: Biometric embeddings for end to end person authentication system using transient evoked otoacoustic emission signals,” Neural Processing Letters, vol. 54, no. 1, pp. 21–41, 2022. [Google Scholar]
22. K. Dunnigan, “Tests of marginal homogeneity and special cases,” Pharmaceutical Statistics, vol. 12, no. 4, pp. 213–216, 2013. [Google Scholar]
23. Z. Yang, X. Sun, and J. W. Hardin, “Testing marginal homogeneity in matched-pair polytomous data,” Therapeutic Innovation and Regulatory Science, vol. 46, no. 2, pp. 434–438, 2012. [Google Scholar]
24. X. R. Zhang, W. F. Zhang, W. Sun, X. M. Sun and S. K. Jha, “A robust 3-D medical watermarking based on wavelet transform for data protection,” Computer Systems Science & Engineering, vol. 41, no. 3, pp. 1043–1056, 2022. [Google Scholar]
25. X. R. Zhang, X. Sun, X. M. Sun, W. Sun and S. K. Jha, “Robust reversible audio watermarking scheme for telemedicine and privacy protection,” Computers, Materials & Continua, vol. 71, no. 2, pp. 3035–3050, 2022. [Google Scholar]
Cite This Article
 Copyright © 2023 The Author(s). Published by Tech Science Press.
This work is licensed under a Creative Commons Attribution 4.0 International License , which permits unrestricted use, distribution, and reproduction in any medium, provided the original work is properly cited.
 Downloads
 Citation Tools