
 Submit a Paper
 Propose a Special lssue
 Open Access
ARTICLE

Improved Soil Quality Prediction Model Using Deep Learning for Smart Agriculture Systems
1 Department of Information Technology, SNS College of Engineering, Coimbatore, Tamilnadu, India
2 Department of Electrical and Electronics Engineering, SNS College of Technology, Coimbatore, Tamilnadu, India
3 Department of Computer Science & Engineering, SNS College of Technology, Coimbatore, Tamilnadu, India
* Corresponding Author: P. Sumathi. Email:
Computer Systems Science and Engineering 2023, 45(2), 1545-1559. https://doi.org/10.32604/csse.2023.027580
Received 21 January 2022; Accepted 12 May 2022; Issue published 03 November 2022
 View Full Text
 Download PDF
Abstract
Soil is the major source of infinite lives on Earth and the quality of soil plays significant role on Agriculture practices all around. Hence, the evaluation of soil quality is very important for determining the amount of nutrients that the soil require for proper yield. In present decade, the application of deep learning models in many fields of research has created greater impact. The increasing soil data availability of soil data there is a greater demand for the remotely avail open source model, leads to the incorporation of deep learning method to predict the soil quality. With that concern, this paper proposes a novel model called Improved Soil Quality Prediction Model using Deep Learning (ISQP-DL). The work considers the chemical, physical and biological factors of soil in particular area to estimate the soil quality. Firstly, pH rating of soil samples has been collected from the soil testing laboratory from which the acidic range has been categorized through soil test and the same data has been taken as input to the Deep Neural Network Regression (DNNR) model. Secondly, soil nutrient data has been given as second input to the DNNR model. By utilizing this data set, the DNNR method is used to evaluate the fertility rate by which the soil quality has been estimated. For training and testing, the model uses Deep Neural Network Regression (DNNR), by utilizing the dataset. The results show that the proposed model is effective for SQP (Soil Quality Prediction Model) with efficient good fitting and generality is enhanced with input features with higher rate of classification accuracy. The results show that the proposed model achieves 96.7% of accuracy rate compared with existing models.Keywords
The main objective of soil management in the process of agriculture for increasing the yield based on the soil features and quality. The enormous growth of population, global limitations are reducing the soil quality and fertility rate in many places. In cases of modern agriculture, crop health is the important factor to be concerned for increased productivity. Moreover, the considerable growth of crop yield can be achieved by the effective measurement of soil quality and crop health management method. The soil quality can be effectively managed with the efficient resource managements and counteractive measures to supply soil nutrients. The problems are to be detected and addressed in timely manner by the agricultural experts based on analyzing the soil resources and management methods. The soil fertility rate calculation with Artificial Neural Network is done via back propagation neural network model. In this method a feed forwarded architecture with a back propagation weight adjustment algorithm has been used. In KNN(K-Nearest Neighbour) model for soil fertility rate computation, the input dataset were grouped and the calculated factors are limited through model training. From EDL-ASQE Enhanced Deep Learning Model for IoT based Automated Soil Quality Evaluation model, fertility rate of the soil has been identified by pre grouping the soil into high moisture level and low moisture level. Hence initial pre group model is required. Hence a model proposed in this paper uses deep learning methods for solving the problems and enhancing the result accuracy for soil evaluation metrics. The major soil features that are considered in this work are a follows,
1. Chemical Features:
i) Soil Texture: defines the particle size in soil based on the texture
ii) Water Retention Character: measures the water holding capacity of soil after irrigation
2. Physical Features:
i) Extractable N, K, P: denotes the nutrients, productivity and environmental quality
ii) pH: denotes the threshold rate of biological and chemical soil activities.
3. Biological Features:
i) Natural Manure: Natural manure that is available in Soil for plant growth
In present scenario, the prediction and classification problems are effectively processed with the implementation of machine learning and deep learning methods. The general flow of the soil test model with incorporated deep learning methods is presented in Fig. 1.
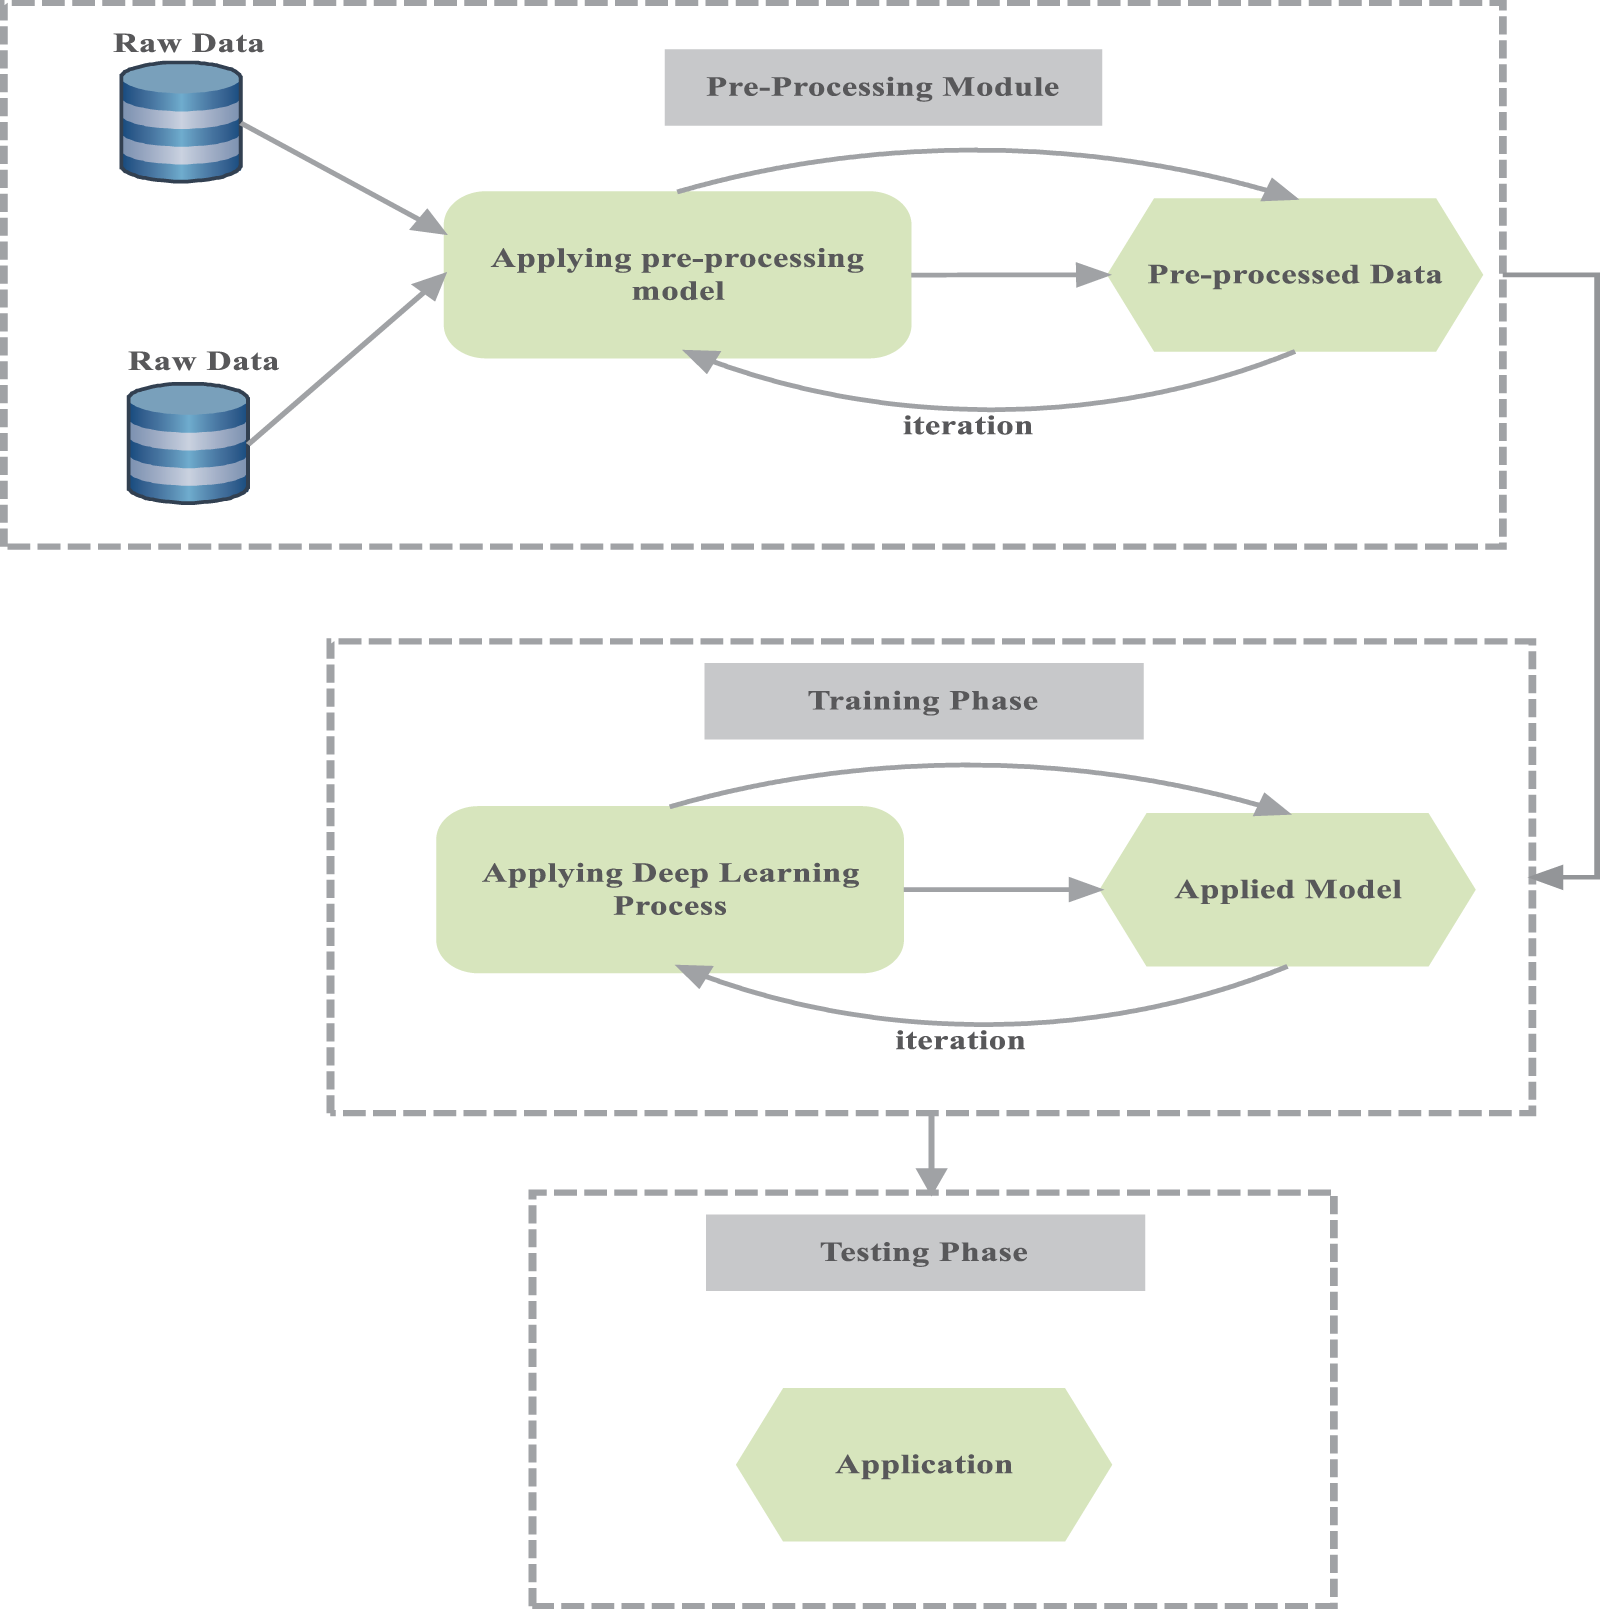
Figure 1: General functions of deep learning in soil quality analysis
The model comprises of phases such as, Pre-processing phase, Training phase and Testing Phase. Additionally, the incorporation of deep learning methods effectively reduces several confrontations that are faced by experts. Previously, Artificial Neural Networks (ANN) is used for determining the soil fertility measures [1]. Some of the soil features such as Electrical Conductivity (EC), water capacity are evaluated based on Partial Least Square Regression is used [2]. Many research works have been done using machine learning techniques for solving the agricultural problems [3]. J48, Apriori and K-Nearest Neighbour (KNN) classifiers are user for classifying the wheat yield in [4]. An unbiased linear prediction technique has been utilized in [5] for determining the organic carbon ratio in Soil. The same soil mineral has been evaluated using boosted regression trees in [6]. Genetic algorithm based feature selection is integrated with random forest for analyzing the rate of organic carbon in [7].
Different ML techniques are incorporated for determining the soil minerals, types, moisture rate [8]. The work presented in [9] classifies the village soil based on their fertility rate using classifiers such as, Random Forest, Support Vector machine, Neural Networks and Bagging. The soil data are classified under the classes such as, low, medium and high rates of fertility. The work in [10] contains the data about the district based soil fertility rate of India, which is feasible for appropriate decision making for the rate of fertilizers to be used and the procedure for distribution.
From the above survey, the following findings are identified.
i) Artificial Neural Network technique takes higher processing time to evaluate the soil quality and it gives lower precision, specificity, recall and F1-Score value of soil samples.
ii) Other techniques like Partial Least Square Regression method, K-Nearest Neighbour method, Unbiased Linear Prediction technique need complex calculations to evaluate the soil fertility rate.
The main objective of this work is to classify the area based soil quality index based on the sample data obtained from the regions in and around Coimbatore and Erode districts, Tamil Nadu, India. Based on the classification results, index report is framed for decision making to provide fertilizer recommendations to the experts. Additionally, the deep learning based soil quality analysis helps in minimizing the unwanted fertilizer usage and measures the soil and environmental quality. The proposed Improved Soil Quality Prediction Model using Deep Learning (ISQP-DL) model aims to classify the soil data indices and pH rates of sample data from Coimbatore and Erode region based on the aforementioned soil factors. The Soil Quality Report (SQR) is further provided for the experimentation and evaluations. And, the fertility rates are categorized over the six levels of soil nutrient rates, as, Very-Less, Less, Medium, Modest, High and Max-rate. For Training and Testing, Deep Neural Network Regression (DNNR) model, which has multiple hidden layers, is used here. The major advantage of the model is that the model can correlate parameter combinations, which may reduce the computational complexities and enhances generalization. Furthermore, the model involves in improving the classification accuracy of quality indices based on the pH rate and nutrients of the sample soil data. The incorporation neural networks operations provides better rate of quality prediction over the statistical techniques. In the scenario of smart agriculture, the earlier prediction of soil quality using the deep learning technique is helpful for the farmers to frame better field for greater yield.
The remainder of this paper is framed as follows: Section 2 contains the works related to various machine learning techniques used for various category of agriculture process and soil quality analysis. Section 3 describes the study state data and the work process of the proposed model with diagrams in detail. The results and comparisons are presented with graphs in Section 4. Finally, Conclusion of the proposed model and future enhancement ideas are given in Section 5.
In recent scenario of agricultural research, myriad researches have been done using machine learning techniques. For determining the soil fertility rate, the work in [11] used different classification methods such as Naive Bayes (NB), Random Forest (RF) and J48. The results stated that the J48 algorithm provided better results than other models. Further, in the study [12], a comparative analysis has been presented for the machine learning models such as NB, JRip and 48 in classifying soil categories. The evaluations have been carried out with 110 input samples and the results stated that the JRip model produced higher rate of accuracy. In [13], data mining method were incorporated for measuring the yield rate and enhancing the gain. Further, a comparative study has been done in [14], between two techniques called Support Vector Machine SVM and Artificial Neural Networks (ANN). The results depicted that Support Vector Machine (SVM) produced better result than ANN. Fuzzy C-Means Clustering has been used in [15] for classification.
In a different manner, Coactive Neuro-Fuzzy Inference System (CANFIS) [16] has been derived for measuring the soil temperature. The results have shown that the model produced maximal error. Furthermore, in [17], Extreme Learning Machine (ELM) and Self-Adaptive Evolutionary (SaE) model are combined to form SaE-ELM algorithm. The model concentrated on measuring the temperature, pressure and solar radiation. Gene Expression Programming (GEP) has been used in [18] for estimating the soil temperature, using the data obtained from 31 regions in Iran.
Different set of soil data with different geographical data were given as input for derivations. The soil data samples from different depths are collected and given to Group Method of Data Handling (GMDH) for estimating the soil temperature in [19]. But, the implementation of those models is not cost effective and there some time complexities [20]. It has been found from the result that the accessibility and reliable soil temperature that are partial and there is a requirement for an effective model. Recently, Fractionally Autoregressive Integrated Moving Average (FARIMA) has been developed for measuring the soil temperature in [21]. The obtained results are compared with the results from GEP and Artificial Intelligence model and found that the FARIMA model is inadequate in determining for the extreme rates of soil temperature [22,23].
The soil sample data are acquired from the region around Coimbatore and Erode as presented in Section 3.1 and the soil features such as, Organic Carbon, pH, Phosphorus and Potassium rates in soil. And, Soil Quality Report is generated based on the derivation of Fertility Rate (FR) of Soil. For performing classification DNNR algorithm is incorporated and the soil data samples are classified under classes such as, Very-Less (A), Less (B), Medium (C), Modest (D), High (E) and Max-rate (F).
In this work, the soil samples are obtained from the two vast of Tamil Nadu, India, such as, Coimbatore and Erode, which is located at, 11°1′6″N 76°58′21″E and 11°21′0″N 77°44′0″E of latitude and longitude respectively. The location maps of the aforementioned two regions are presented in Fig. 2. And, the soil types on those regions are geographically depicted in Fig. 3. Moreover, it is observed from the map that the two regions are majorly comprised of two types of soil such as, black and red soil.

Figure 2: Location map of coimbatore and erode districts

Figure 3: Map representing the soil types of coimbatore and erode
The soil analyses are carried out based on their nutrients for determining and managing the area-wise soil health information. Moreover, the data are obtained during the years 2016–2020 from soil evaluation laboratory. And, the soil data samples are evaluated based on the features such as, soil pH, OC (Organic Carbon), Potassium, Phosphorous and the ranges are classified based on the results given in Tabs. 1 and 2.


3.2 Computation of Fertility Rate (FR) of Soil Samples
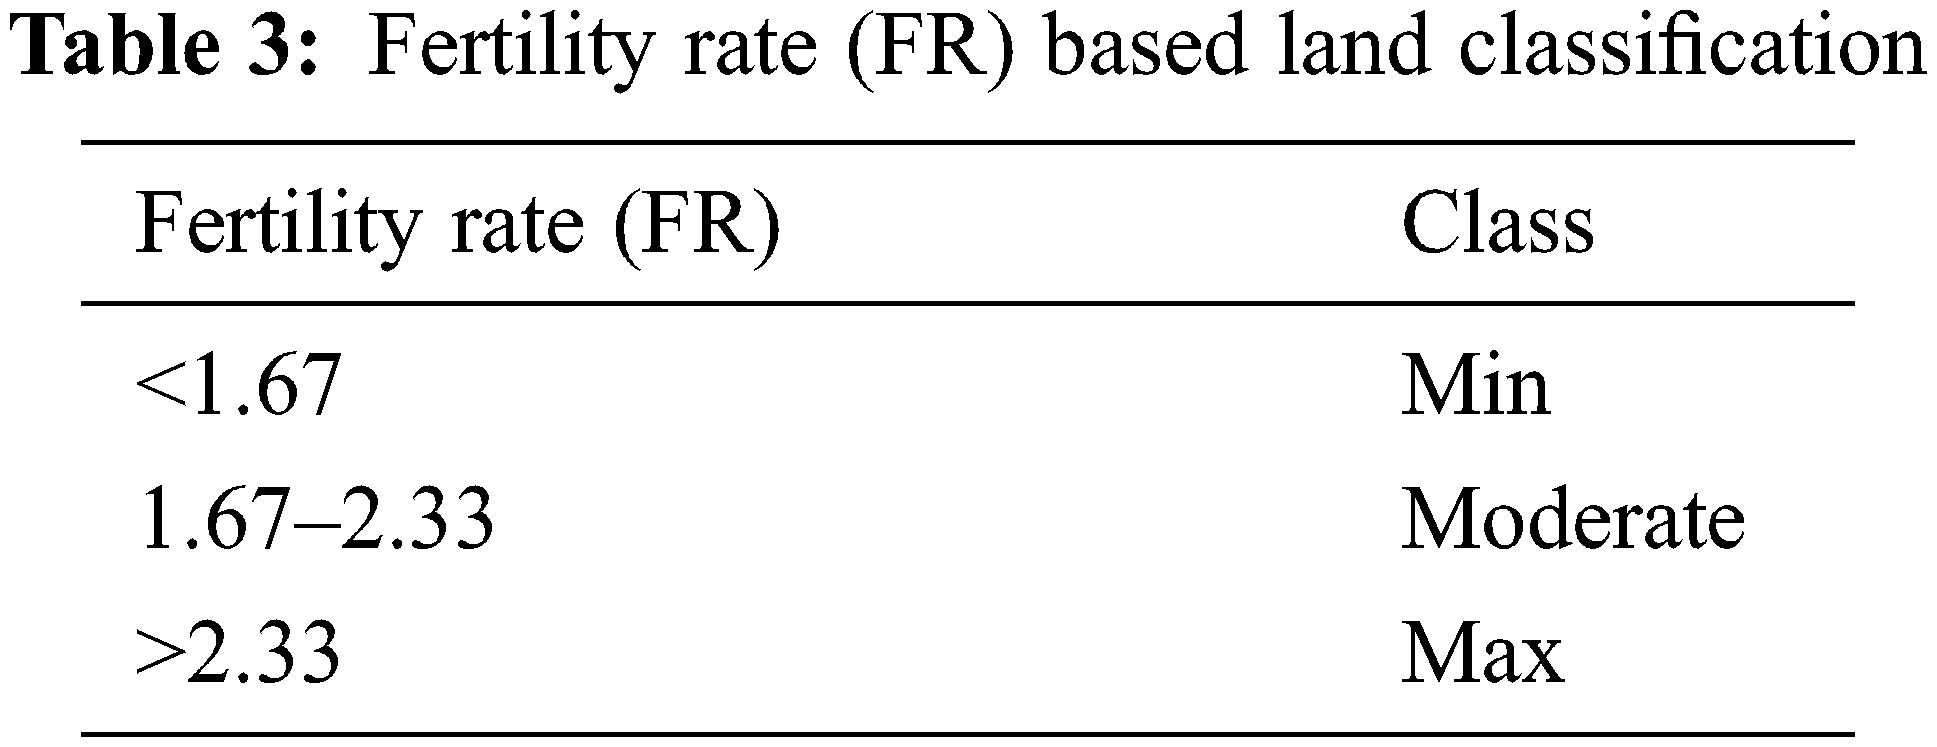
The Fertility Rate is for all the agricultural lands in and around the observed soil regions are computed as follows in Eq. (1)
where, A, B, C, D, E and F, represents the ranges of cultivation as, max-rate, high, modest, medium, less and very-less, respectively, in any particular region. Based on FR, the soil rates are classified under 3 classes as in Tab. 3.
3.3 Procedure of Improved Soil Quality Prediction Model (ISQP)
The procedure of ISQP is presented in Fig. 4 for the classification of soil data. The sample soil data for each classification process are randomly organized and 80% of data are utilized for training and validation, and 20% of data are given for testing. Here, the ten-fold cross validation process is utilized for training and data validation, in that, 90% of data are provided for training and 10% is provided for validation. The classification model is trained based on the soil features computed in the computation phase. Moreover, for the process of classification, the features of soil nutrients are considered in the range [10,150] and the pH classification is defined as, [10,200]. In particular, the classification process is carried out with respect to the FR and the other features defined in the previous section.

Figure 4: Workflow of the proposed model
3.4 Classification Model Construction
In the proposed model, DNNR is used for classification of soil samples. This is a multi-hidden layer containing minimal two hidden levels of regression NN. The Network structure of DNNR is depicted in Fig. 5. The benefit of the incorporation of DNNR is the model can combine the varied feature combinations that perform amalgamation of hidden attributes. This effectively reduces the computational complexities and enhances the generalization ability. Moreover, the network structure comprises of three layers such as, input layer, hidden layers and output layer, in which the nodes are connected with each other. Based on the number of soil samples, the number of hidden layers is varied. And, the operations are explained as below.

Figure 5: Structure of DNNR
1. The number of soil features determines the number of input layers in the DNNR structure. The increasing hidden layers denotes the number of attributes to be reduced for effectively avoiding the overfitting problems
2. Neurons are presented in hidden layers, to perform aggregation operation and the process of rectifier activation. And, Rectified Linear Activation Function (RLAF) is determined to enhance the network depth and increases the training speed. The formula for computing RLAF is given as Eq. (2),
3. In DNNR, the output layer is different from the traditional model for classification. And, the regression function for deriving the output is given as Eq. (3),
4. The functional expression of DNNR can be defined as in multi-tier nester pattern and the overall function is computed in Eq. (4), where, ‘b’ and ‘a’ represents the bias rates.
5. Finally, the optimization function is derived with the RLAF, where,
3.5 Performance Evaluation Metrics
The proposed model is evaluated based on the following metrics.
i) Mean Absolute Error (MAE) is derived in Eq. (6),
ii) Mean Square Error (MSE) is computed in Eq. (7),
iii) Root Mean Square Error (RMSE) is calculated in Eq. (8),
And, the implementation of classification model requires evaluation based on classification accuracy based on the results of True Positive (A), True Negative (B), False Positive (C) and False Negative (D). The mathematical computations are provided in Eqs. (9)–(11),
iv. Sensitivity Rate:
v. Specificity Rate:
vi. Precision Rate:
vii. Accuracy Rate of Classification:
The efficiency of the proposed model is derived by rate of classification accuracy, which is formulated based in Eq. (12).
iii. F1-Score:
F1 score can be computed as the harmonic mean of precision and recall values, which can be measured in Eq. (13),
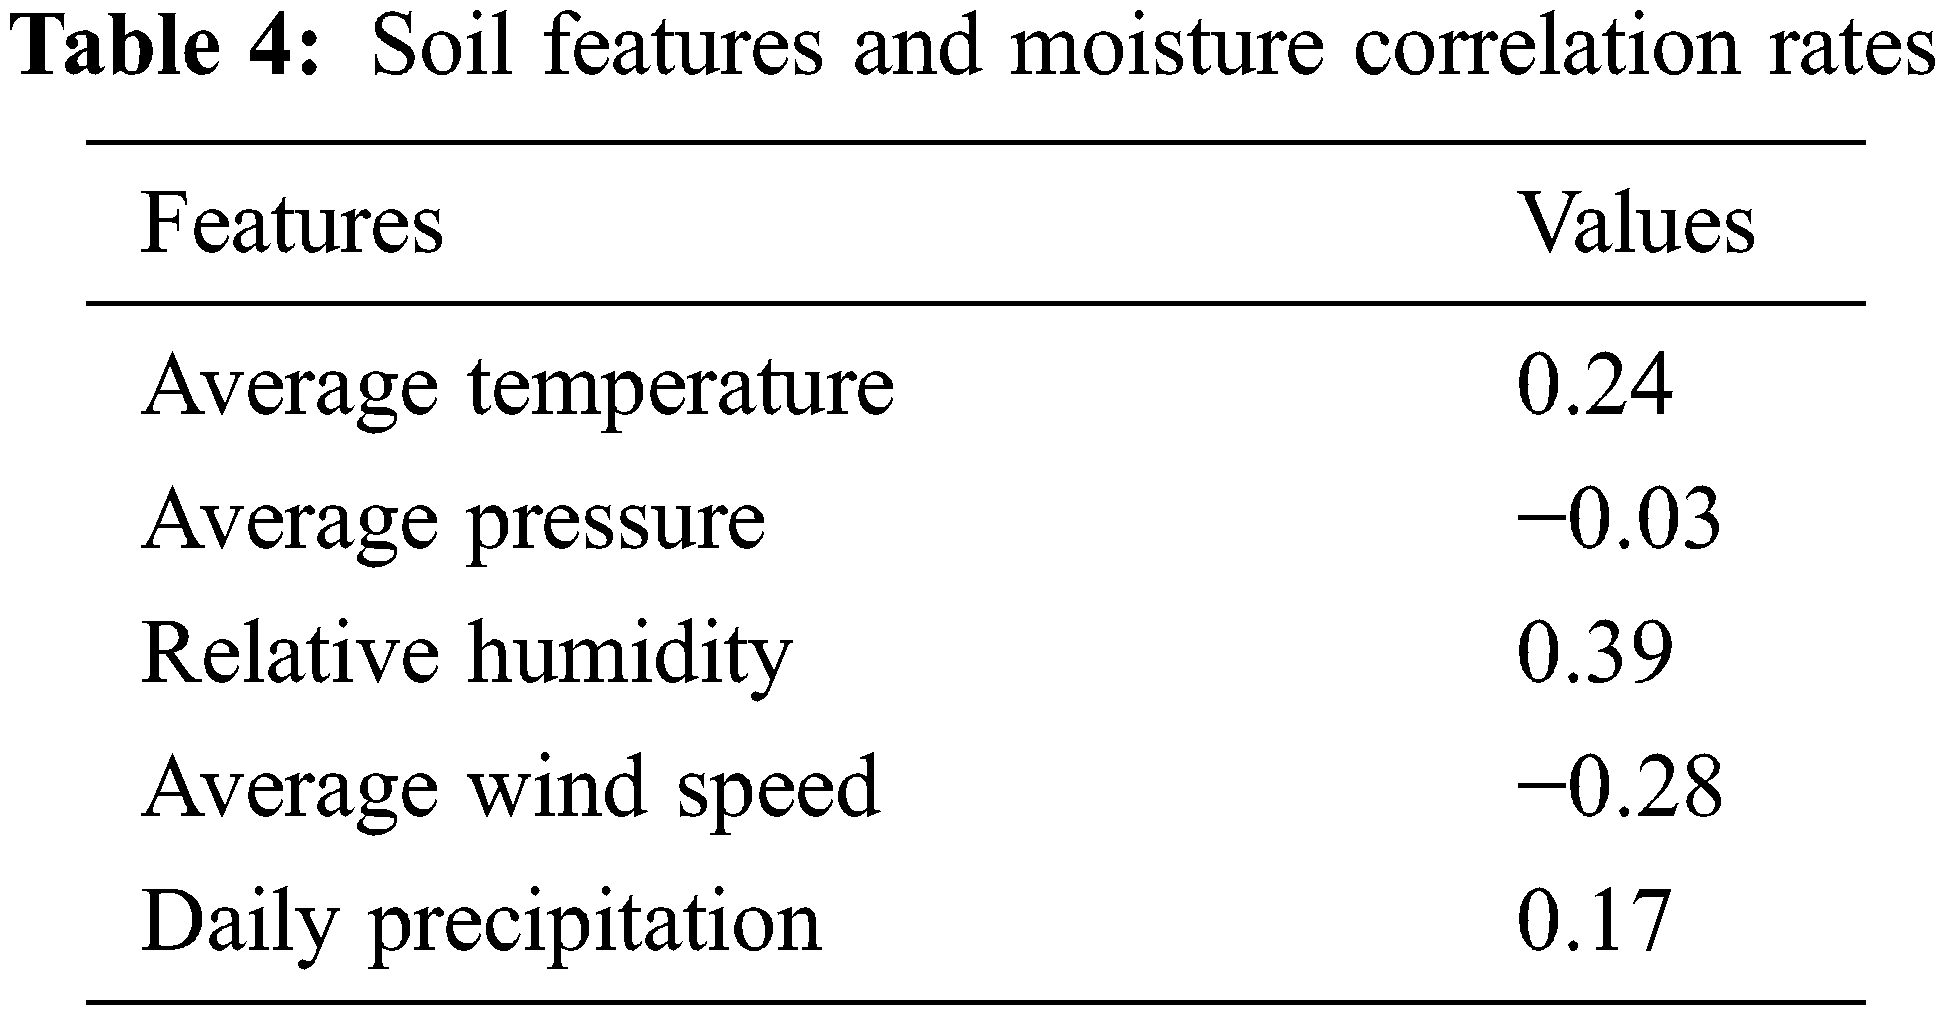
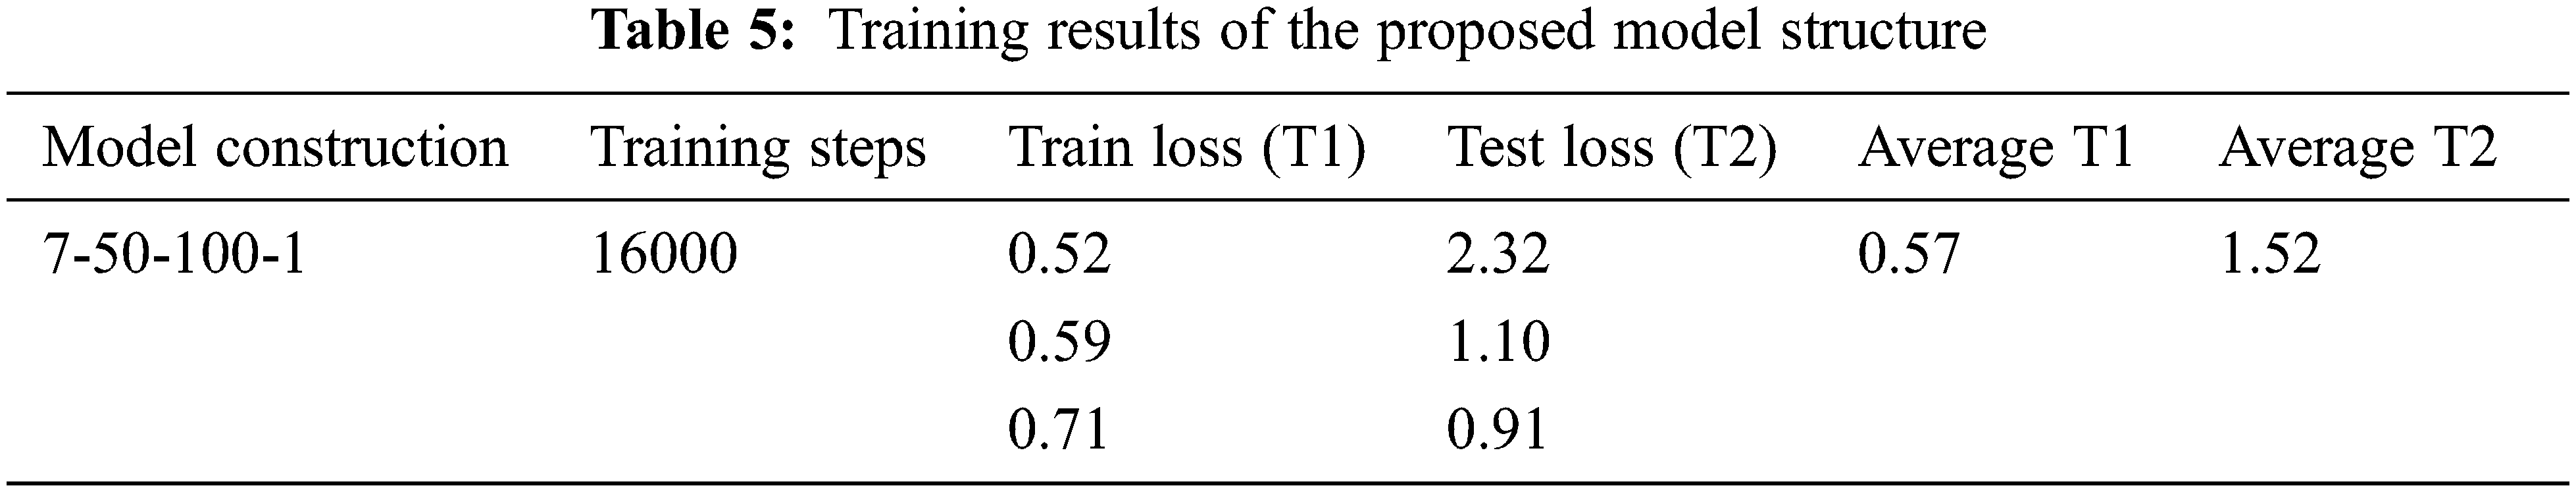
The proposed Improved Soil Quality Prediction Model using Deep Learning (ISQP-DL) model is implemented with WEKA tool with the obtained soil samples. Based on the analysis with respect to the considered soil features, the results are provided under six classes of soil quality as, Very-Less (A), Less (B), Medium (C), Modest (D), High (E) and Max-rate (F). Furthermore, it is to be stated that the model is embedded with the IoT devices and connected with the cloud server. The Soil Quality Report is provided based on the classification results. The obtained results are compared with the results of the existing models such as, Artificial Neural Networks, K-Nearest Neighbour (KNN) and Enhanced Deep Learning Model for IoT based Automated Soil Quality Evaluation (EDL-ASQE). Further, the soil feature and their moisture rates are presented in Tab. 4. And, the training results are provided in Tab. 5.
Using the collected values from the sensor and IoT devices from soil samples, the training and testing process are carried out using the Deep Learning model. The data from the samples contains missing and duplicate data, which are removed at the pre-processing phase and then, given for training, can effectively reduce the classification errors. As mentioned above, the results are derived from the soil samples collected in the period 2016 to 2020 in the time interval of four months. As presented in the study site, the evaluations are carried with the samples from two regions such as, Coimbatore and Erode. The Figs. 6 and 7 portray the results obtained for soil fertility rate using the proposed model with 10 samples. It can be observed from the figures that the higher rate of fertility is occurred at the third phase of evaluation, since it has high rate of soil moisture.

Figure 6: Fertility rate observed for the samples around coimbatore region

Figure 7: Fertility rate observed for the samples around erode region
As per the evaluation metrics provided in Section 3.5, the model efficiency is measured. Moreover, in the following Fig. 8, the results obtained for the parameters Precision, Specificity, Recall and F1-Score of the proposed and the compared works are presented. It is explicitly shown in the Fig. 8. that the proposed ISQP model achieves higher results than the compared neural networks and machine learning models.
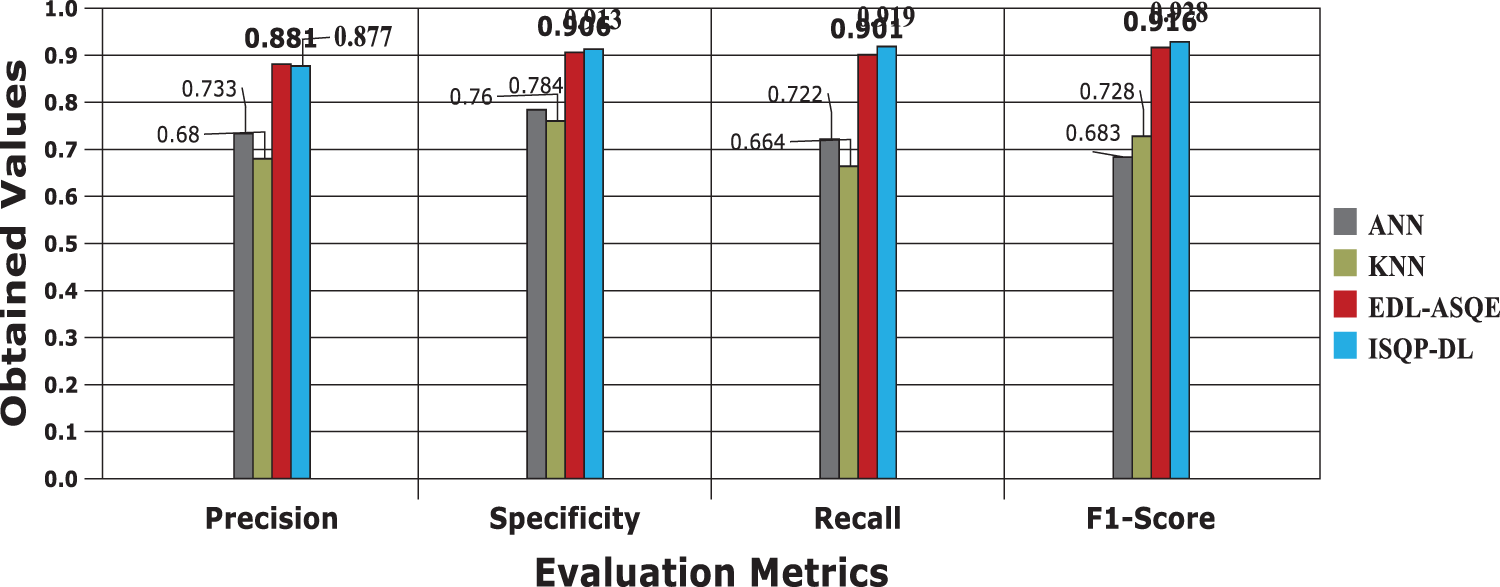
Figure 8: Result comparisons based on evaluation metrics
For any classification model, the model efficiency is completely based on the accuracy rate of classification and the formula for computation is presented in Section 3.5. Here, the average rate of accuracy for the evaluation of 10 samples for both Coimbatore and Erode regions and the values are plotted with respect to models. It is clearly observed from the following Fig. 9. the proposed model achieves higher rate of accuracy in classifying the soil samples under their exact category.

Figure 9: Accuracy rate comparison
The following graphs given in Figs. 10 and 11. displays the results obtained for the evaluation of fertility rate of soil samples in and around the regions of Coimbatore and Erode, respectively. The results are analysed and compared between the predicted fertility score with the proposed model and the real values from the available sources. From that, the analysis shows that there is not a greater deviation for both values in all comparisons.

Figure 10: Rate of soil fertility (Coimbatore region)

Figure 11: Rate of soil fertility (Erode region)
By the effective implementation of DNNR, the proposed model reduces the computational and time complexities. Previously, the missing values and duplications of input data are also effectively handled before training. Hence, the proposed model provides results of the soil quality in minimal time than other compared models and the results are provided in Fig. 12.

Figure 12: Time based evaluations and results
The pie charts that are shown in Figs. 13 and 14 displays the final classification results of soil samples of Coimbatore and Erode regions, respectively. Based on that results, the Soil Quality Report is generated and submitted for further references and proceedings on to the cloud server. The results are shown that the proposed model achieves 96.7% of accuracy rate in classification accuracy, which can help the agricultural experts in better manner.
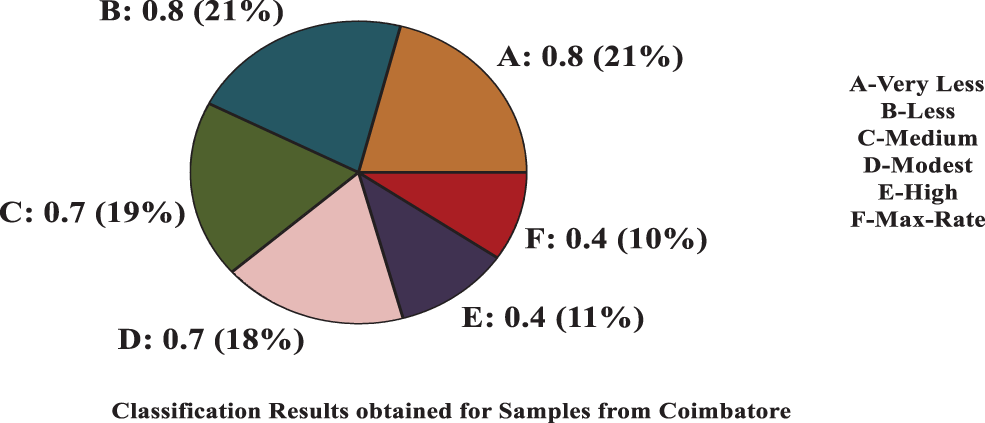
Figure 13: Final classification results (Coimbatore region)
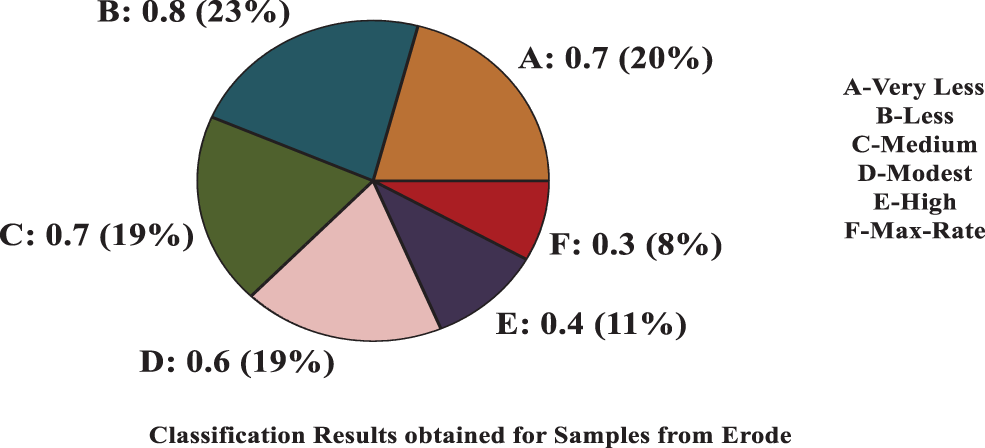
Figure 14: Final classification results (Erode region)
This paper develops a novel model called, Improved Soil Quality Prediction Model using Deep Learning (ISQP-DL) for soil quality evaluation and defining better soil and crop management patterns. By effective analysis, the excessive utilization of fertilizers can also be avoided and the soil nutrients can be effectively preserved and utilized. For that, initially, the model analyzes the soil features, such as, OC, Potassium, Phosphorous, pH, Temperature, and soil moisture. Based on the values and thresholds, the results are classified under six classes as, Very-Less (A), Less (B), Medium (C), Modest (D), High (E) and Max-rate (F), using the Deep learning technique called DNNR. By the classification results, the better decision making can be processed by the farmers or the agricultural experts, regarding soil resource management and fertilizer recommendations. Moreover, the model provides 97% of accurate results with minimal computational and time complexities than the compared works.
In future, the work can be further enhanced to support automated irrigation process with IoT implementations.
Funding Statement: The authors received no specific funding for this study.
Conflicts of Interest: The authors declare that they have no conflicts of interest to report regarding the present study.
References
1. P. J. Sheela, K. Sivaranjani and M. Phil, “A brief survey of classification techniques applied to soil fertility prediction,” in Int. Journal of Engineering Trends Science & Humantics, pp. 80–93, 2015. [Google Scholar]
2. V. De Paul Obade and R. Lal, “Towards a standard technique for soil quality assessment,” Geoderma, vol. 265, pp. 96–102, 2016. [Google Scholar]
3. A. Mucherino, P. Papajorgji and P. M. Pardalos, “A survey of data mining techniques applied to agriculture,” Operating Research International Journal, vol. 9, no. 2, pp. 121–140, 2009. [Google Scholar]
4. J. R. Romero, P. F. Roncallo, P. C. Akkiraju, I. Ponzoni, V. C. Echenique et al., “Using classification algorithms for predicting durum wheat yield in the province of buenos aires,” Computer Electronic Agriculture, vol. 96, pp. 173–179, 2013. [Google Scholar]
5. C. Ritz, E. Putku and A. Astover, “A practical two-step approach for mixed model-based kriging, with an application to the prediction of soil organic carbon concentration,” European Journal of Soil Science, vol. 66, no. 3, pp. 548–554, 2015. [Google Scholar]
6. C. Schillaci, M. Acutis, L. Lombardo, A. Lipani, M. Fantappie et al., “Spatio-temporal topsoil organic carbon mapping of a semi-arid Mediterranean region: The role of land use, soil texture, topographic indices and the influence of remote sensing data to modelling,” Science on Total Environment, vol. 601, pp. 821–832, 2017. [Google Scholar]
7. B. Wang, C. Waters, S. Orgill, A. Cowie, A. Clark et al., “Estimating soil organic carbon stocks using different modelling techniques in the semi-arid rangelands of eastern Australia,” Ecol. Ind., vol. 88, pp. 425–438, 2018. [Google Scholar]
8. S. J. Reashma and A. S. Pillai, “Edaphic factors and crop growth using machine learning—A review,” in: Int. Conf. on Intelligent Sustainable Systems (ICISS), IEEE, Jaipur, pp. 270–274, 2017. [Google Scholar]
9. M. S. Sirsat, E. Cernadas, M. Fernández-Delgado and R. Khan, “Classification of agricultural soil parameters in India,” Comput. Electron. Agric., vol. 135, pp. 269–279, 2017. [Google Scholar]
10. M. S. Sirsat, E. Cernadas, M. Fernández-Delgado and S. Barro, “Automatic prediction of village-wise soil fertility for several nutrients in India using a wide range of regression methods,” Comput. Electron. Agric., vol. 154, pp. 120–133, 2018. [Google Scholar]
11. V. Bhuyar, “Comparative analysis of classification techniques on soil data to predict fertility rate for aurangabad district,” International Journal of Emerging Trends & Technology in Computer Science, vol. 3, no. 2, pp. 200–203, 2014. [Google Scholar]
12. V. Rajeshwari and K. Arunesh, “Analyzing soil data using data mining classification techniques,” Indian Journal of Science and Technology, vol. 9, pp. 1–4, 2016. [Google Scholar]
13. R. Sujatha, “A study on crop yield forecasting using classification techniques,” in Int. Conf. on Computing Technologies and Intelligent Data Engineering (ICCTIDE'16), IEEE, Bangalore, vol. 1, pp. 568–570, 2016. [Google Scholar]
14. N. Awasthi and A. Bansal, “Application of data mining classification techniques on soil data using R,” International Journal of Advances in Electronics and Computer Science, vol. 4, pp. 33–37, 2017. [Google Scholar]
15. A. Verma, A. Jatain and S. Bajaj, “Crop yield prediction of wheat using fuzzy C means clustering and neural network,” International Journal of Applied Engineering Research, vol. 13, no. 11, pp. 9816–9821, 2018. [Google Scholar]
16. P. H. Talaee, “Daily soil temperature modeling using neuro-fuzzy approach,” Theor. Appl. Climatol., vol. 118, no. 3, pp. 481–489, 2014. [Google Scholar]
17. B. Nahvi, J. Habibi, K. Mohammadi, S. Shamshirband and O. S. Al Razgan, “Using self-adaptive evolutionary algorithm to improve the performance of an extreme learning machine for estimating soil temperature,” Comput. Electron. Agric., vol. 124, pp. 150–160, 2016. [Google Scholar]
18. S. Mehdizadeh, J. Behmanesh and K. Khalili, “Evaluating the performance of artificial intelligence methods for estimation of monthly mean soil temperature without using meteorological data,” Environ. Earth Sci., vol. 76, no. 8, pp. 325–330, 2017. [Google Scholar]
19. H. Ahmadi, M. Mottaghitalab and N. Nariman-Zadeh, “Group method of data handling-type neural network prediction of broiler performance based on dietary metabolizable energy, methionine, and lysine,” Journal of Applied Poultry Research, vol. 16, no. 4, pp. 494–501, 2007. [Google Scholar]
20. D. Zhang, P. Gao, Y. Zhou, Y. Wang and G. Zhou, “An experimental and numerical investigation on temperature profile of underground soil in the process of heat storage,” Renewable Energy, vol. 148, pp. 1–21, 2020. [Google Scholar]
21. S. Mehdizadeh, F. Fathian, M. J. S. Safari and A. Khosravi, “Developing novel hybrid models for estimation of daily soil temperature at various depths,” Soil and Tillage Research, vol. 197, pp. 104–113, 2020. [Google Scholar]
22. H. Haritha and S. K. Thangavel, “A modified deep learning architecture for vehicle detection in traffic monitoring system,” International Journal of Computers and Applications, vol. 43, no. 9, pp. 968–977, 2021. [Google Scholar]
23. T. Amsalu and W. Cornelis, “The potential of termite mound spreading for soil fertility management under low input subsistence agriculture,” Journal of Agriculture, vol. 11, pp. 1–16, 2021. [Google Scholar]
Cite This Article
 Copyright © 2023 The Author(s). Published by Tech Science Press.
This work is licensed under a Creative Commons Attribution 4.0 International License , which permits unrestricted use, distribution, and reproduction in any medium, provided the original work is properly cited.
 Downloads
 Citation Tools