
 Submit a Paper
 Propose a Special lssue
 Open Access
ARTICLE
Distributed Multi-hop Clustering Approach with Low Energy Consumption in WSN
1 Department of Computer Science and Engineering, Vivekananda College of Engineering for Women, Tiruchengode, 637205, Tamil Nadu, India
2 Department of Computer Science, College of Computers and Information Technology, Taif University, P. O. Box 11099, Taif, 21944, Saudi Arabia
3 Department of Computer Engineering, College of Computers and Information Technology, Taif University, P. O. Box 11099, Taif, 21944, Saudi Arabia
4 School of Electrical Engineering, College of Engineering, Universiti Teknologi MARA, 23000, Dungun, Terengganu, Malaysia
* Corresponding Author: R. Nithya. Email:
Computer Systems Science and Engineering 2023, 45(1), 903-924. https://doi.org/10.32604/csse.2023.030749
Received 01 April 2022; Accepted 18 May 2022; Issue published 16 August 2022
 View Full Text
 Download PDF
Abstract
The purpose of sensing the environment and geographical positions, device monitoring, and information gathering are accomplished using Wireless Sensor Network (WSN), which is a non-dependent device consisting of a distinct collection of Sensor Node (SN). Thus, a clustering based on Energy Efficient (EE), one of the most crucial processes performed in WSN with distinct environments, is utilized. In order to efficiently manage energy allocation during sensing and communication, the present research on managing energy efficiency is performed on the basis of distributed algorithm. Multiples of EE methods were incapable of supporting EE routing with MIN-EC in WSN in spite of the focus of EE methods on energy harvesting and minimum Energy Consumption (EC). The three stages of performance are proposed in this research work. At the outset, during routing and Route Searching Time (RST) with fluctuating node density and PKTs, EC is reduced by the Hybrid Energy-based Multi-User Routing (HEMUR) model proposed in this work. Energy efficiency and an ideal route for various SNs with distinct PKTs in WSN are obtained by this model. By utilizing the Approximation Algorithm (AA), the Bregman Tensor Approximation Clustering (BTAC) is applied to improve the Route Path Selection (RPS) efficiency for Data Packet Transmission (DPT) at the Sink Node (SkN). The enhanced Network Throughput Rate (NTR) and low DPT Delay are provided by BTAC. To MAX the Clustering Efficiency (CE) and minimize the EC, the Energy Effective Distributed Multi-hop Clustering (GISEDC) method based on Generalized Iterative Scaling is implemented. The Multi-User Routing (MUR) is used by the HEMUR model to enhance the EC by 20% during routing. When compared with other advanced techniques, the Average Energy Per Packet (AEPP) is enhanced by 39% with the application of proportional fairness with Boltzmann Distribution (BD). The Gaussian Fast Linear Combinations (GFLC) with AA are applied by BTAC method with an enhanced Communication Overhead (COH) for an increase in performance by 19% and minimize the DPT delay by 23%. When compared with the rest of the advanced techniques, CE is enhanced by 8% and EC by 27% with the application of GISEDC method.Keywords
Environmental positions and monitoring of devices and information are sensed by WSN, which is a non-dependent device consisting of a distinct collection of SNs. The conditions of the environment, such as temperature, sound, and pressure, are observed by WSN that contains spatially disseminated sensors and transmit their data to the central location via the network [1–5]. By applying in military and industries like surveillance of war front, industrial process, health etc., there has been promising growth of WSN. The usage of the bi-directional WSN is comprehensive in a global computing environment. Inbuilt processors, memory and transceivers for short-range wireless communication are present in the SN in WSN. The central Base Station (BS) known as SkN receives the sensed data from neighbouring environments that combined SN sends. The path between an S-DP is determined by a method called routing protocol for transmitting the sensed data. The routing protocols are the basis for the lifetime of the network in WSN. With limited resources like power, low communication bandwidth and slow processor, the potential routing protocol enhances the trustworthiness and SN’s lifetime. The choosing of the paths in a network is known as routing. Distinct networks like electronic data, telephone and transportation networks make use of routing. Forwarding the data packets (PKT) and controlling the traffic between networks is where routing is used. The PKT switching technology is utilized by the routing techniques in digital information networks. Through intermediate nodes, the network PKT’s forwarding from the S-DP is controlled in PKT switching networks. The network hardware devices such as gateways, bridges, firewalls/switches and routers are some of the intermediate nodes [6–10].
The routing is performed with least performance value in general-purpose computers. A record of the routes is preserved by the routing tables, and they are forwarded to numerous network destinations involved in the routing process. In the memory of the router, the routing table formation is performed, and for efficient routing, such formation is mandatory. At a time, just one network path is used by several routing algorithms. The routes are identified, and moreover, one path is chosen to a destination by a Multi-Path Routing (MPR) protocol along with effective load balancing [11–15]. Heterogeneous paths are found by the Open Shortest Path’s First Routing, Routing Information and various other protocols, and protocol parameters or administrator’s configuration-based bandwidth is separated by route traffic. Numerous paths for distributing S-DP data are chosen by a new routing method called MPR. The issues related to loading, balancing, trustworthiness, and security are solved by MUR because of the features of MPR in redundant paths [4]. The practical arrangement of small nodes in large quantities to carry out effective RPS for PKT forwarding is the potential of WSN. For an efficient RPS in WSN, clustering plays a pivotal role. The network lifetime in nodes is reduced in clustering networks, for which the unstable EC is the main reason. The main challenge to introduce an EE model for energy preservation when the RPS path along with each SN is constructed is because of the less energy resources available at wireless SN. Several EE techniques failed to support EE routing with MIN-EC in WSN though they concentrated on energy harvesting and reduced EC severely. Either the progressive or cluster algorithm saves communication time and enhances scalability, compromises calculation, and the most well-known clustering methods use the delay factor. The energy savings based on the Multi-Hop Clustering (MHC) are not yet addressed. Based on open and closed-loop parameters, the transmission is carried out to enhance the DPT.
Anyway, no attention was paid to the delay factor related to DPT [5]. On the basis of cluster tree formation, an RPS is built for improving the WSN with the fixed Delay Time (DT). The energy utilized for structuring the RPS and each SN is preserved by the WSN. Also, for improving the EE-RPS with cluster-based SN, the WSN is deployed for maintaining an enormous set. To construct the RPS with cluster-based WSN and evaluate the routing with fixed DT, the main goal of this research work is to conserve energy. The following are the primary goals of the proposed work:
• To curb the EC with different node densities and PKTs during routing and RST for which an HEMUR model is proposed.
• To enhance the efficiency of RPS at the SkN for DPT, BTAC is considered. GFLC is deployed to choose the RPS and minimize the Packet Transmission Delay (PTD).
• To develop MHC with MIN-EC, the GISEDC approach is proposed. On the disseminated SN, the CE is enhanced, and the EC is reduced. With the maximum (MAX)/minimum (MIN) approach, the Entropy Model (EM) is taken into account.
Different types of SN like the BS, data-sensing nodes and the sink that are closely associated with each other are contained in the traditional architecture of WSN, which is inbuilt with a sensing field. The data from all the BS’s SN in the sensing field are collected by the BS, and the data are sent to the SkN. Because of the quick processing, operation and memory, the collection of data by the SkN from all the SNs is efficient. Every SN possesses the necessary components like a microcontroller, battery, sensing unit, and wireless transceiver by assessing the real objects. Using a microcontroller, organizational ability, and processing power, the data are digitalized once the sensing unit is acquired. Through the transceiver, the transferring of data into the other associated SN takes place. Usually, a mobile sensor like intelligence-Mouse is equipped with locomotive platforms, and there are possibilities for them to move after the first installation though the application of static WSN sensors is immobile. The immobile sensors are handled by robots rather than implementing mobile sensors. The immobile sensors are contained in robots within WSN and robot networks (also called carrier-based) as payloads are installed in appropriate areas. Such networks are called WSRNs. Thus, in this situation, various predetermined deployment models are accepted, whereas a route optimization algorithm is used to optimize the mobility of the robot [16–20].
For every individual node, the formation of a data transmission network is the responsibility of the WSN routing protocol. The evolution of the current routing protocol is mandatory because of the WSN routing protocol’s application-related and resource-limited features. This is done following the charging and switching service and smart battery pack function for designing a WSN routing protocol appropriate to the application of smart battery packs. The execution of the panoramic data accumulation for batteries is roughly analyzed, and the results have proved that WSN networking model is predominantly used in the batteries’ storage link and sub-compartments charging mode. Later, there is an acquisition of WSN node distribution features that depend on smart batteries [21–25]. Exclusively, in complicated indoor environments, localization toward WSNs is challenged by Non-Line-of-Sight (LoS) propagation.
Additionally, exact target localisation becomes a challenge when switching between line-of-sight and non-LoS environments occurs. Since the identical function is a fuzzy and soft decision approach resulting in a non-satisfactory network boundary localization, traditional algorithms for tracking non-LoS environments should not have a trusted one. When there is an existence of LoS between a node and one or a small number of adjacent beacon nodes, more efficiency is observed in the traditional methods. Yet, the performance of the traditional algorithms reduces, and the computational difficulties increase in an absolutely non-LoS environment. The computational process and routing should not encounter many intricacies, while a time synchronization scheme is designed for WSN on having a consideration that WSN has inadequate infrastructure, energy, storage and computing power. For updating the clock, several existing synchronization schemes for WSN that are based on linear rules are used. But a non-linear design may be required in numerous practical situations by the algorithms for time synchronization. Hence, an investigation of non-linear average time synchronization schemes is required for WSN and algorithms, which take into account of the wireless channel’s fading and random delays [26–30].
A cluster formation method closely related to overhead information from the SN is known as Proxy-Enable Adaptive Clustering Hierarchy (PEACH) [31–35]. As per this method, the CH node primarily fixes the SkN as its subsequent hop if it becomes an intermediate transmission node. Later, for a pre-specified time, a time is set to obtain and combine heterogeneous packets from the nodes in the cluster set. Whether a short distance prevails between this node and the actual destination node than that of this node and the previously chosen next-hop node is verified using this technique. For multi-hop inter-cluster communication, an adaptive clustering approach known as PEACH is used. But because of the choice of physical propinquity, it faces similar constraints as PEGASIS. The SN’s residual energy that leads to clustering caused by evenly sharing the CH across the WSN is integrated by the Distributed algorithms known as Hybrid Energy-Efficient Distributed Clustering (HEED). According to a hybrid parameter that comprises a fundamental parameter, the node’s residual energy, and a second parameter like node propinquity to its neighbours/node degree, the CHs are selected sporadically. HEED uses low messaging overhead to converge 0/1 iterations and accomplishes even distribution of Cluster Head (CH) around the network. But the prime percentage of CH is randomly chosen by HEED. For this algorithm, this random option is deemed to be an acute constraint [36–40].
The prolonging of the lifetime of a network has been made possible using a practical approach known as Low-Energy Adaptive Clustering Hierarchy (LEACH), which is one of the most frequently used cluster-based routing protocols in WNSs. An absolutely disseminated method that eliminates global network information is the feature of LEACH. The clusters are arranged in the set-up phase, whereas in the steady-state phase, data are delivered to the BS. In order to reduce overhead, the Steady-state phase is usually longer than the set-up phase. The effect of nodes’ heterogeneity with regards to energy in clustered networks can be assessed using the proposed Energy-Efficient Heterogeneous Clustered (EEHC) [41–45].
3 Proposed Multi-User Routing Based on Hybrid Energy
The principles of the Proportional Fairness Multi-User Routing (PFMUR) and the Greedy Instance Fair (GIF), which enhances the instant NTR, are described by the HEMUR model. Ultimately, the RST is reduced substantially in WSN using the efficient construction of BD. To decrease the EC rate and enhance the throughput by MIN amount of interference at the time of routing, it is evident from Fig. 1 that the HEMUR model is divided into three parts. With the designated slots for each SN, PFMUR is designed to achieve this, and the preference value is measured. According to the preference value, the subsequent SN is allocated to a specific slot. Until a slot is allocated with all the SNs, this process continues. And then, the GIF is used to identify the Interference Rate (IR). At last, the best global route is computed according to the traffic and Average Traversing Time (ATT) leading to an EE route [46].
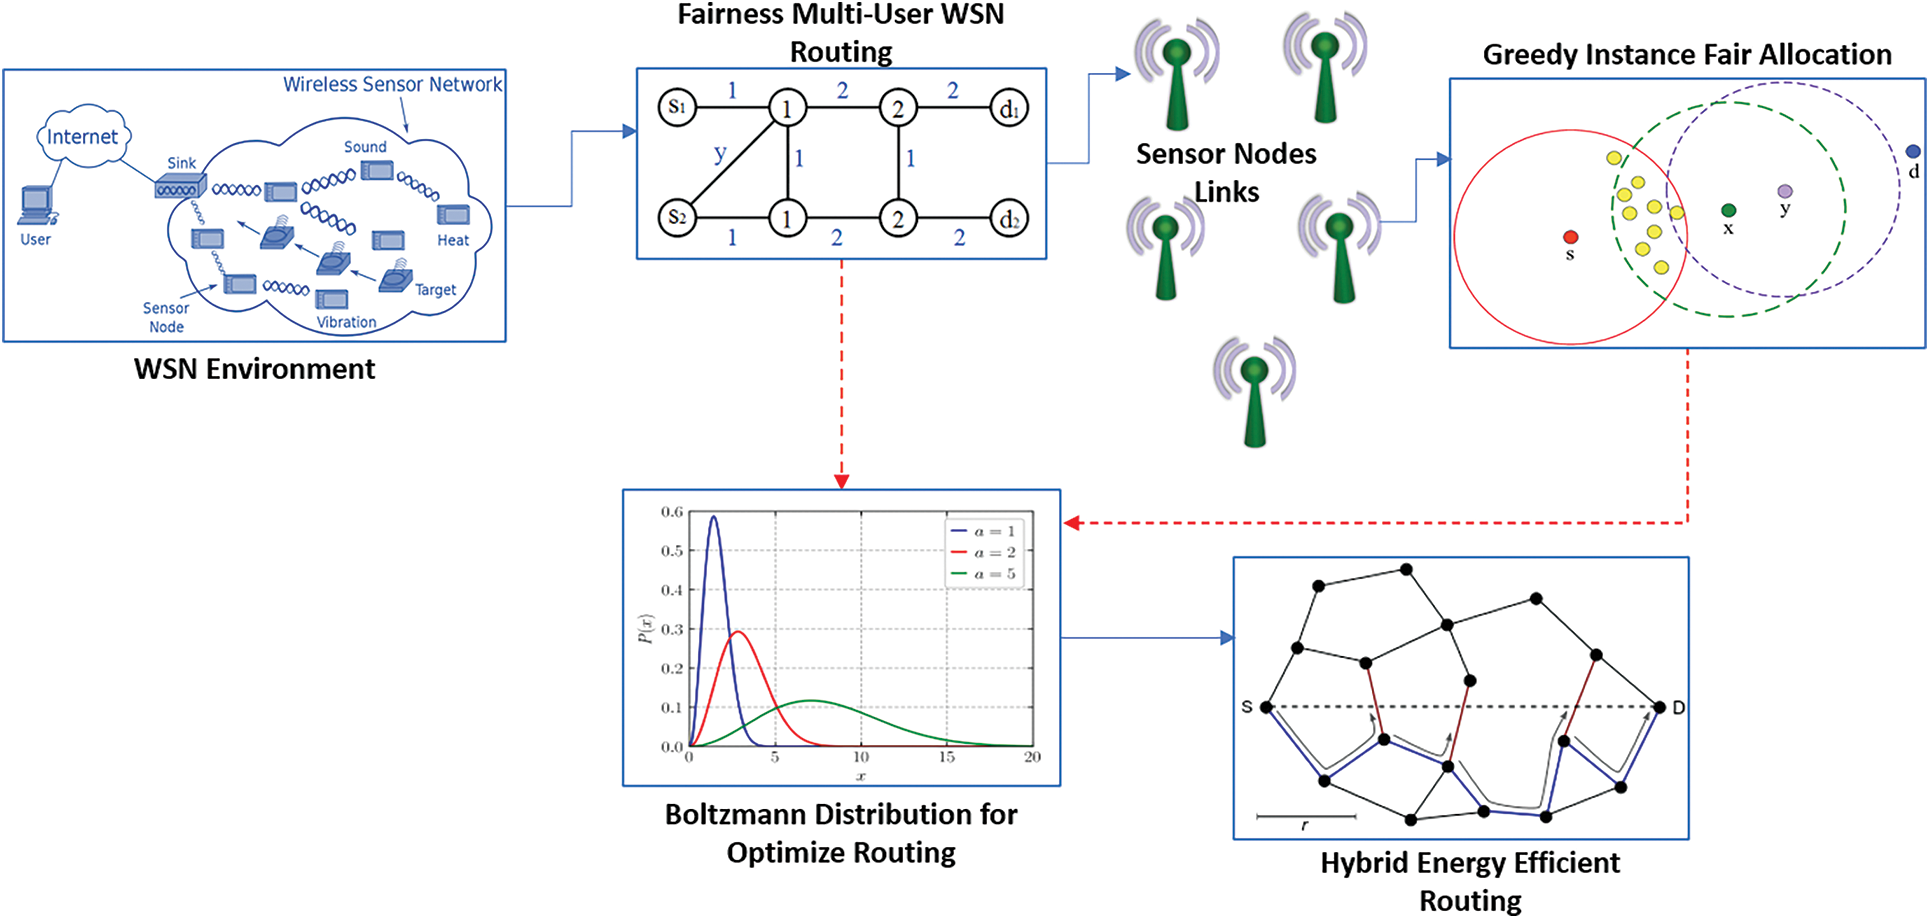
Figure 1: HEMUR model flow
3.1 Proportional Fairness Multi-User Routing (PFMUR)
The EC rate in WSN is reduced by PFMUR, which is primarily designed in the HEMUR model. With the support of request (REQ) time, PFMUR is employed in WSN and functions as the first step in the HEMUR model. The association between the time intervals of REQs is used to perform the PKT flow efficiently. The PRMR design is shown in Fig. 2 with the aid of the HEMUR model design in WSN. Let various SNs be considered as ‘n’ nodes. Here, within the sink ‘S’ served section, the randomly positioned SN in the network is ‘SNi’. Hence, multi-user is invoked by the EPFMUR as mentioned below,
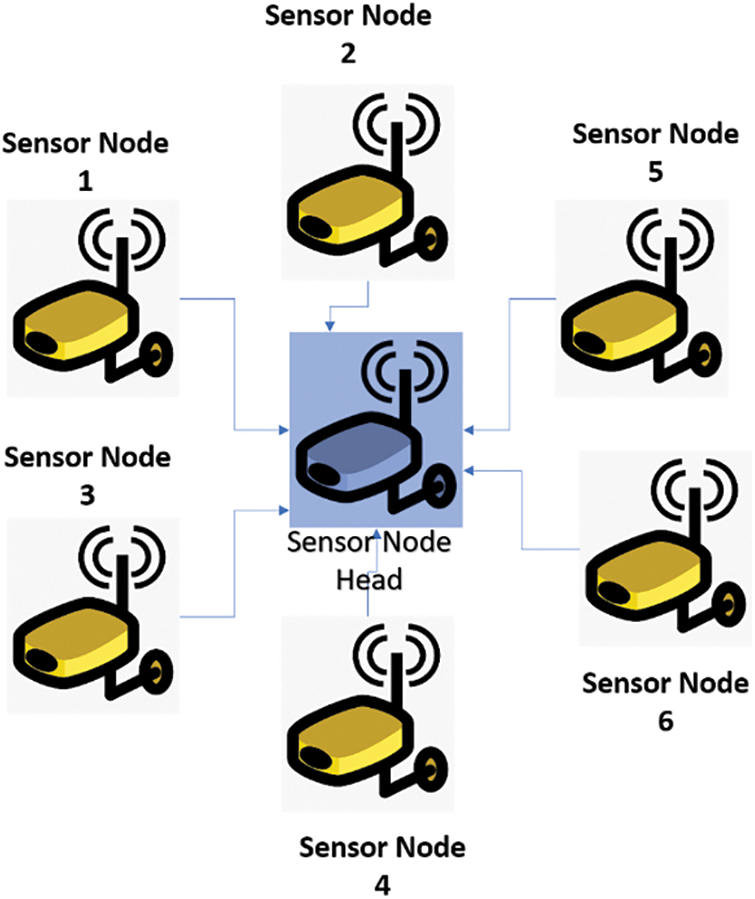
Figure 2: PFMUR design
It is clear from the above Eq. (1) that for the transmission of data PKTs from the SkN ‘S’ to destination nodes ‘n’ with different DPT rates, a propagation is initiated by ‘

Figure 3: Best RPS for S-D pairs

3.2 Greedy Instance Fair Method
During routing, the GIF method is used by the HEMUR model to MIN the number of interferences with the potential RPS action with the help of PFMUR. The SN based EE localized RPS searching probability is developed by the GIF method in HEMUR. In the HEMUR model, the GIF method is deployed to identify RPS discovery successfully. With an implied demand equivalent to the interference-free data PKT, each link with the SNs and the BS is allocated. Then, each link between the SNs and the BS contains the application of the greedy instance. Next, each slot is allocated an SN. Consequently, there is an increase in the NTR of DPT between the SNs. The GIF method’s enhanced throughput occurs using IR. ‘SN2:SN3:SN4’, ‘SN3:SN4’ ‘SN4:SN5:SN6:SN7’ and ‘SN3:SN4:SN5’, 4 routes (viz., hop nodes, each possessed with a distinct inference rate) are identified from a source node ‘SN1’ with destination node ‘SN5’. The NTR is improved by selecting ‘SN1:SN1:SN1’ with MIN-IR ‘105’ after deploying the GIF method.
3.3 Boltzmann Distribution Structure
The HEMUR model is used to design BD for MUR on the basis of the traversing time and traffic volume. Based on the traffic volume, the BD of MUR’s design in WSN aims to update the REQ time. To minimize the RST, the BD is used to design the best global route for an S-DP. The route and time optimality are searched for a given S-DP by updating BD for MUR that involves an iterative ‘0’. ‘0(i, j)’ is the representation of the ‘0’ value for which the MIN traversing time to destination node ‘DNd’ is essential in a presumption that SN crosses from ‘i’ to ‘j’. The formulation of BD for MUR with MIN-RST is given below:
For ‘d’ destination nodes, the traversing time from ‘SNi’ to ‘DNd’ is referred to by ‘t(i, j)’ in Eq. (3). The measuring of ATT for the S-DP is the underlying concept of BD for MUR. The determination of the ATT over the entire S-DP is the fundamental notion of the tactics of traffic assignment. In order to minimize the RST, the GIF method and BD for MUR track an instance RST on WSN. A threshold function ‘α’ is used by the instance RST on WSN. When the density of the node is heavy, a greater value for ‘α’ is allocated, while a low node density has been allocated the lesser value for ‘α’. Hence, based on the node density, the value for ‘α’ is set. But the acquisition is just a tradeoff. Therefore, with the help of a threshold function ‘α’, the delay factor is designed by the HEMUR model using BD for MUR to decrease the RST, and the given below is the formulation:
By acquiring the ratio of MUR with MIN-RST ‘0(SNi,DNd)’ and the nodes’ number in the network ‘ND’, the TV function ‘αi(SNd) is derived from Eq. (4). Consequently, the RST is reduced by the delay factors in tracking the best global route for S-DP.
In order to improve the clustering of multiple nodes, the BTAC is developed. An efficient RPS is provided by the BTAC method’s design that comprises three main parts. Tensor Clustering (TC), AA, and GFLC are the three parts of the BTAC method. The RPS is enhanced due to the TC designed by the BTAC method. Later, the PTD is reduced using the construction of GFLC with DPT through various components. Ultimately, error-free nodes’ clustering aims to improve the NTR and hence, MIN-COH is formed by the Regular Tangent Space Vector Distance (RTSVD) based AA. TC function on multi-sink partitions gives input elements into a rational subpartition to improve the RPS.
The selected route path for packet transmission in BTAC uses the GFLC to reduce the delay factor. The delay factor is reduced while sending the packets through multiple elements in WSN, improving the throughput rate (Fig. 4). The BTAC is the implementation of AA on partitioned elements. Bregman Tensor relies on forming the error-free clustering of nodes based on the RTSVD in BTAC. RTSVD contains the direction of the flow route map for effective clustering of nodes on multi-sink WSN, reducing the communication overhead. TC has been designed in BTAC with the objective of improving the RPS. Next, the GFLC with packet transmission through multiple elements has been constructed, aiming at reducing the packet transmission delay. Finally, the AA based on the RTSVD forms error-free clustering of nodes aiming at improving the throughput rate and therefore minimizes communication overhead.
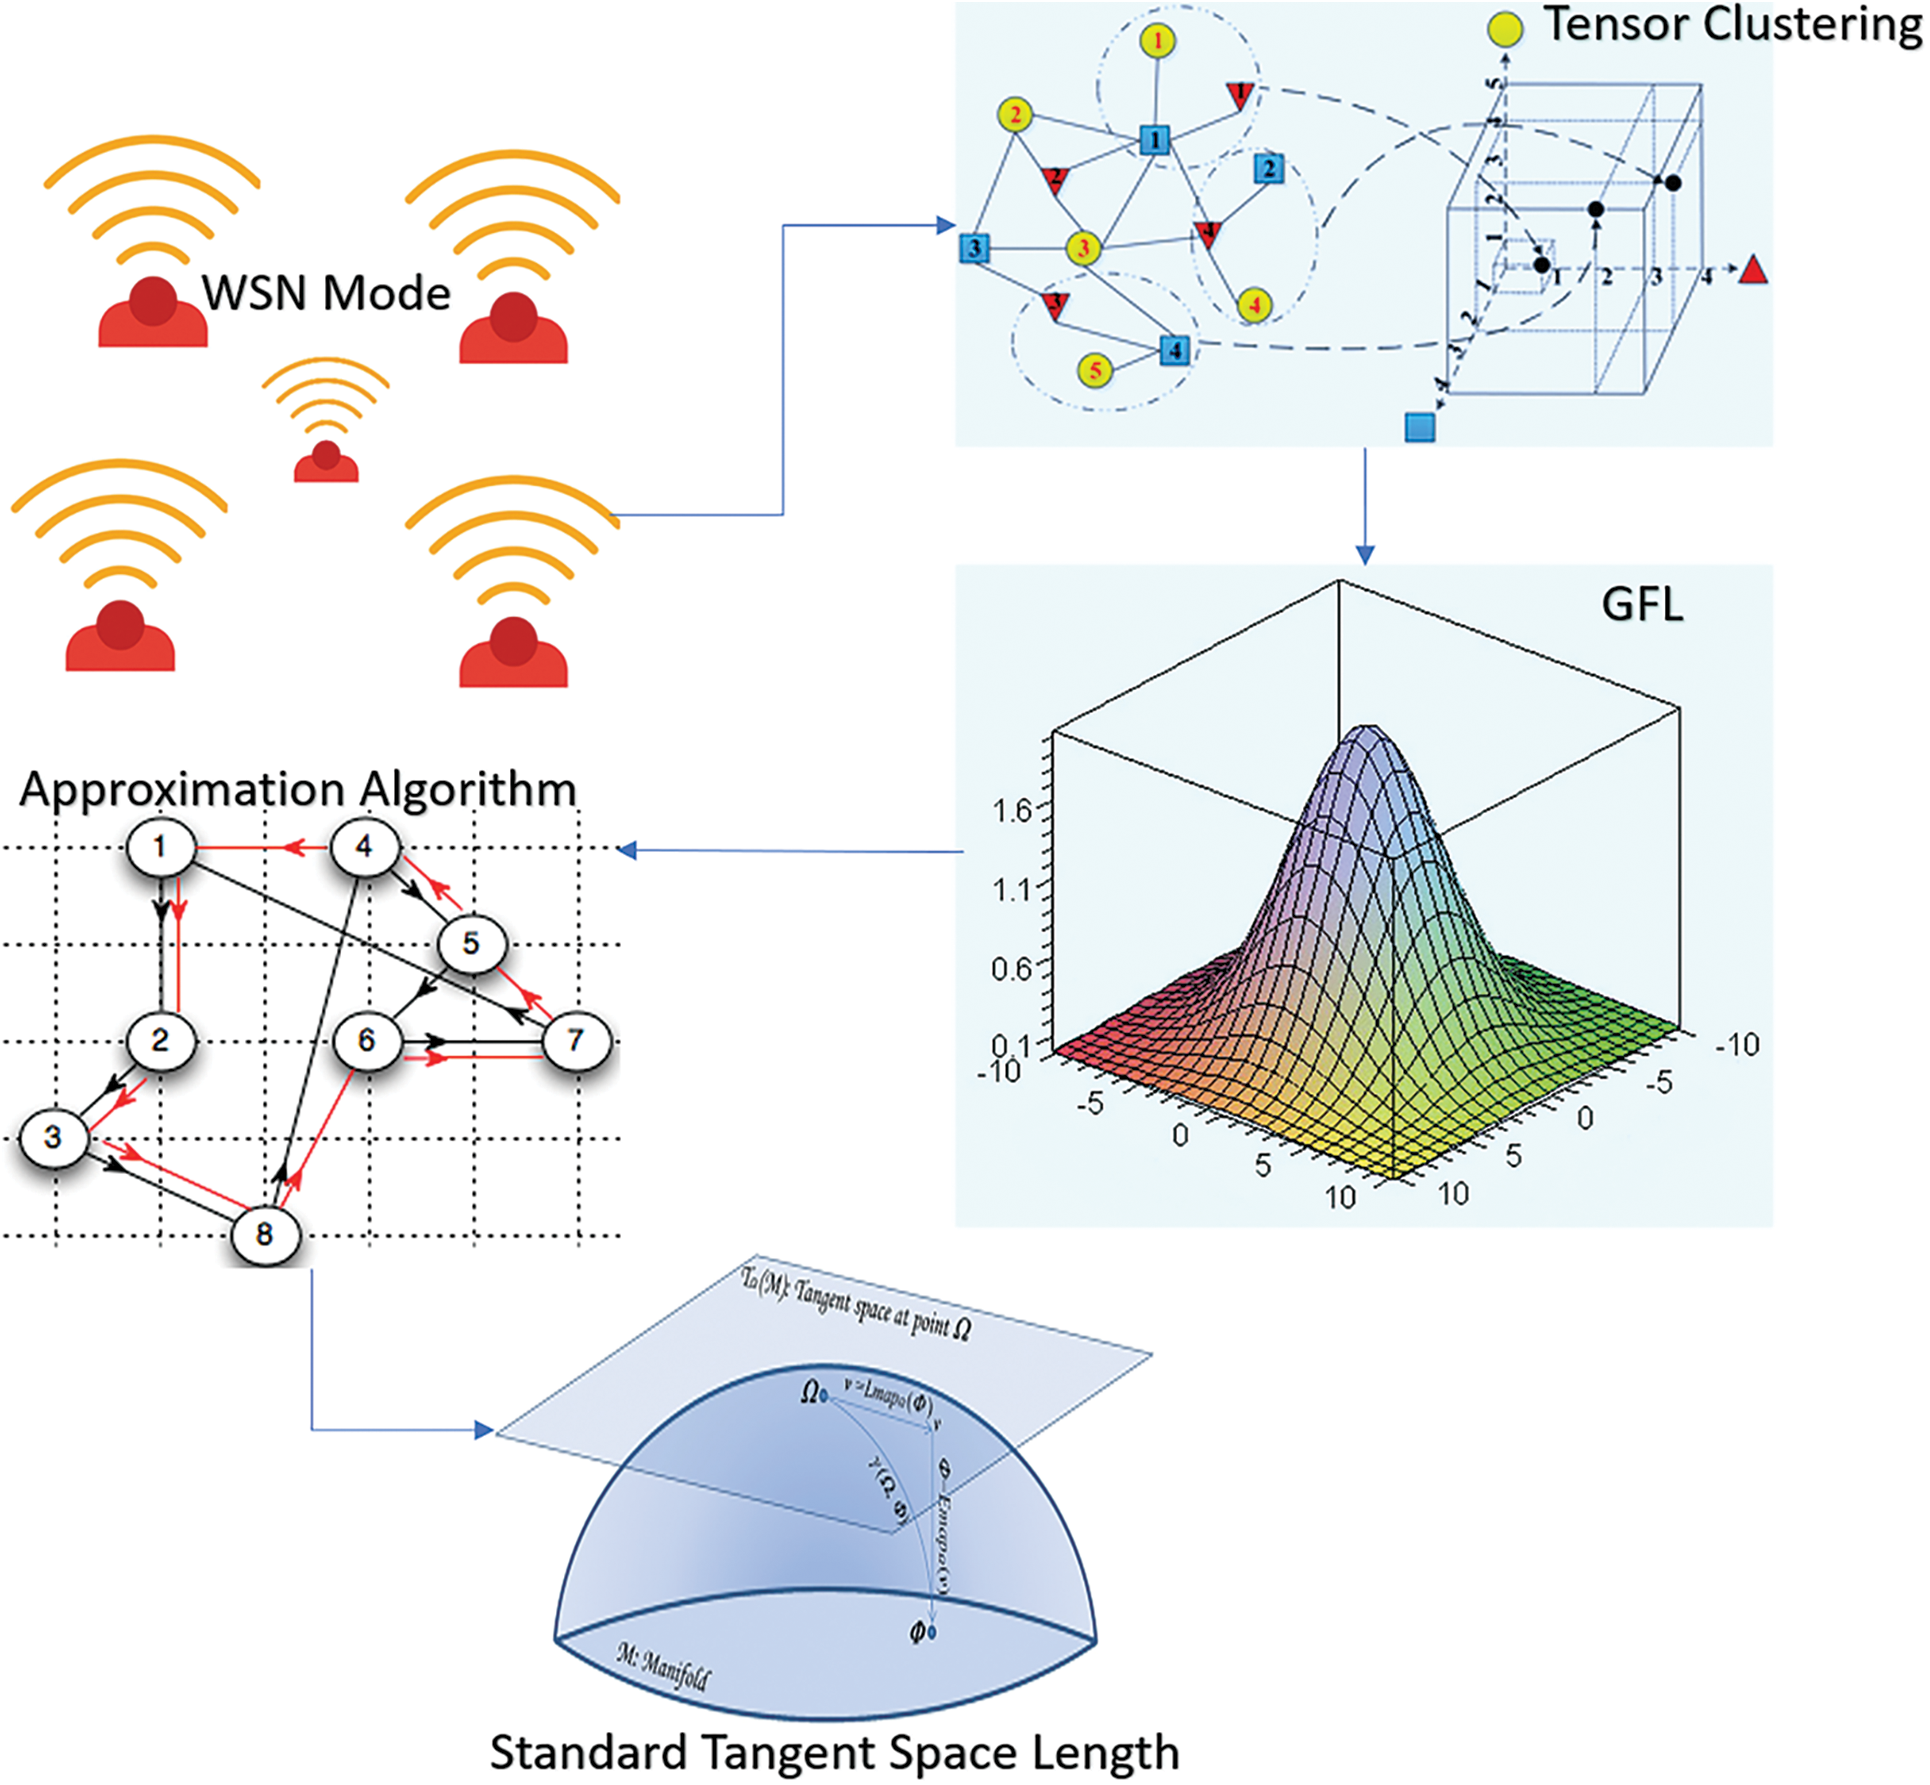
Figure 4: BTAC method’s block diagram
Tensor Clustering Operation (TCA) is the initial step in the design of BTAC method. For developing the RPS, the ‘n’ input elements are divided into rational sub-partitions by TCA on Multi-Sink (MS). The RPS is discovered using the TC in the BTAC method. The structure of TCA is shown in Fig. 5. The ‘n’ input elements (SNs) are the partition of the TC structure. The intermediate SNs (GREEN) and their neighbouring SkNs (WHITE) is found whenever the RPS has to be identified by a source node (BLUR). The performance of the intermediate is the representation of the two arrows, viz., the thick arrow, while the communication between the SkNs in the WSN is the representation of the dotted arrows. At last, the acquisition of RPS and the identification of the destined node are achieved. Let it be assumed that several SNs and communication links within the network range are contained in a WSN. In BTAC method, the network is conceptualized as a graph G = (V, E), where the set of SNs in the network is represented as ‘V = S1, S2,…SN’. The radius R’s communication range is contained in each SN in the network, with ‘E’ being the edge. If ‘U’ is in the communication range of ‘V’ and vice versa, then an edge ‘E = (U, V)’ exists with the bidirectional nature of all links in the graph. Based on TCA, the BTAC assumes a WSN with MS partitions ‘n’. Let an ‘n’ Tensor Input Data Vectors (TIDV) ‘SN = SN1, SN2,…SNn’ be considered, then the formulation of ‘3D’-TIDV is presented as in the following Eq. (5)
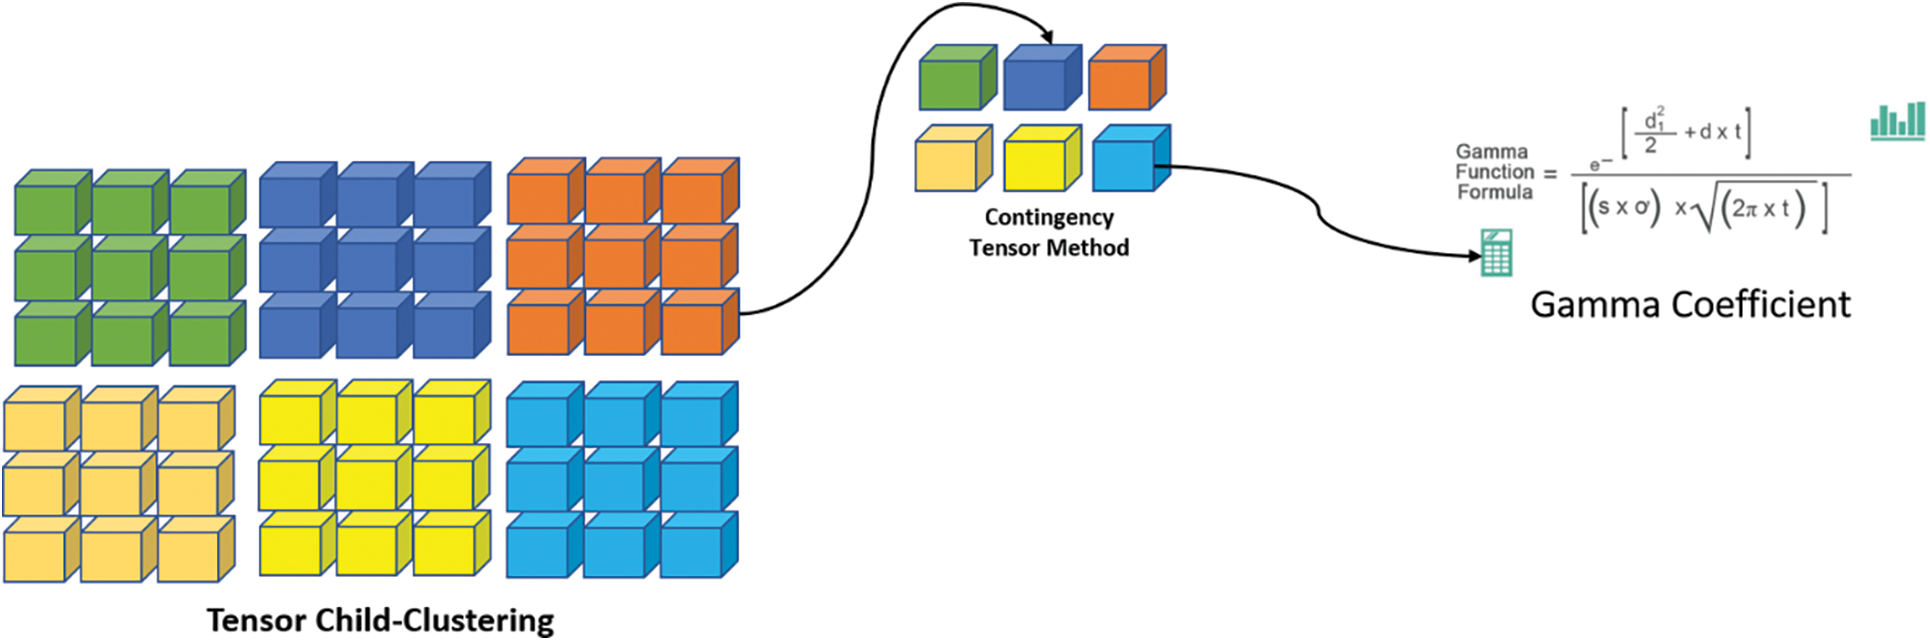
Figure 5: TCA design
To find a ‘n-way’ disjoint partitioning, ‘SN1,…SNn’ is the objective of TCA on MS; the objective in MIN is as follows, Eq. (6)
With the representation of ‘n’ as the number of clusters and symbolization of TCms as the TC for MS operation, the nth cluster centroid is denoted as ‘
SN ‘

Three steps are performed by the Dimensional Tensor Clustering (DTC) algorithm for each TIDV. In the beginning, the input data vectors based on 3D-TIDV are evaluated by the DTC. Then, on the basis of the cluster centroid value, it evolves the TC for MS. Eventually, it enhances the RPS by symbolizing the TC’s MAX formulation.
4.2 Gaussian Fast Linear Combinations
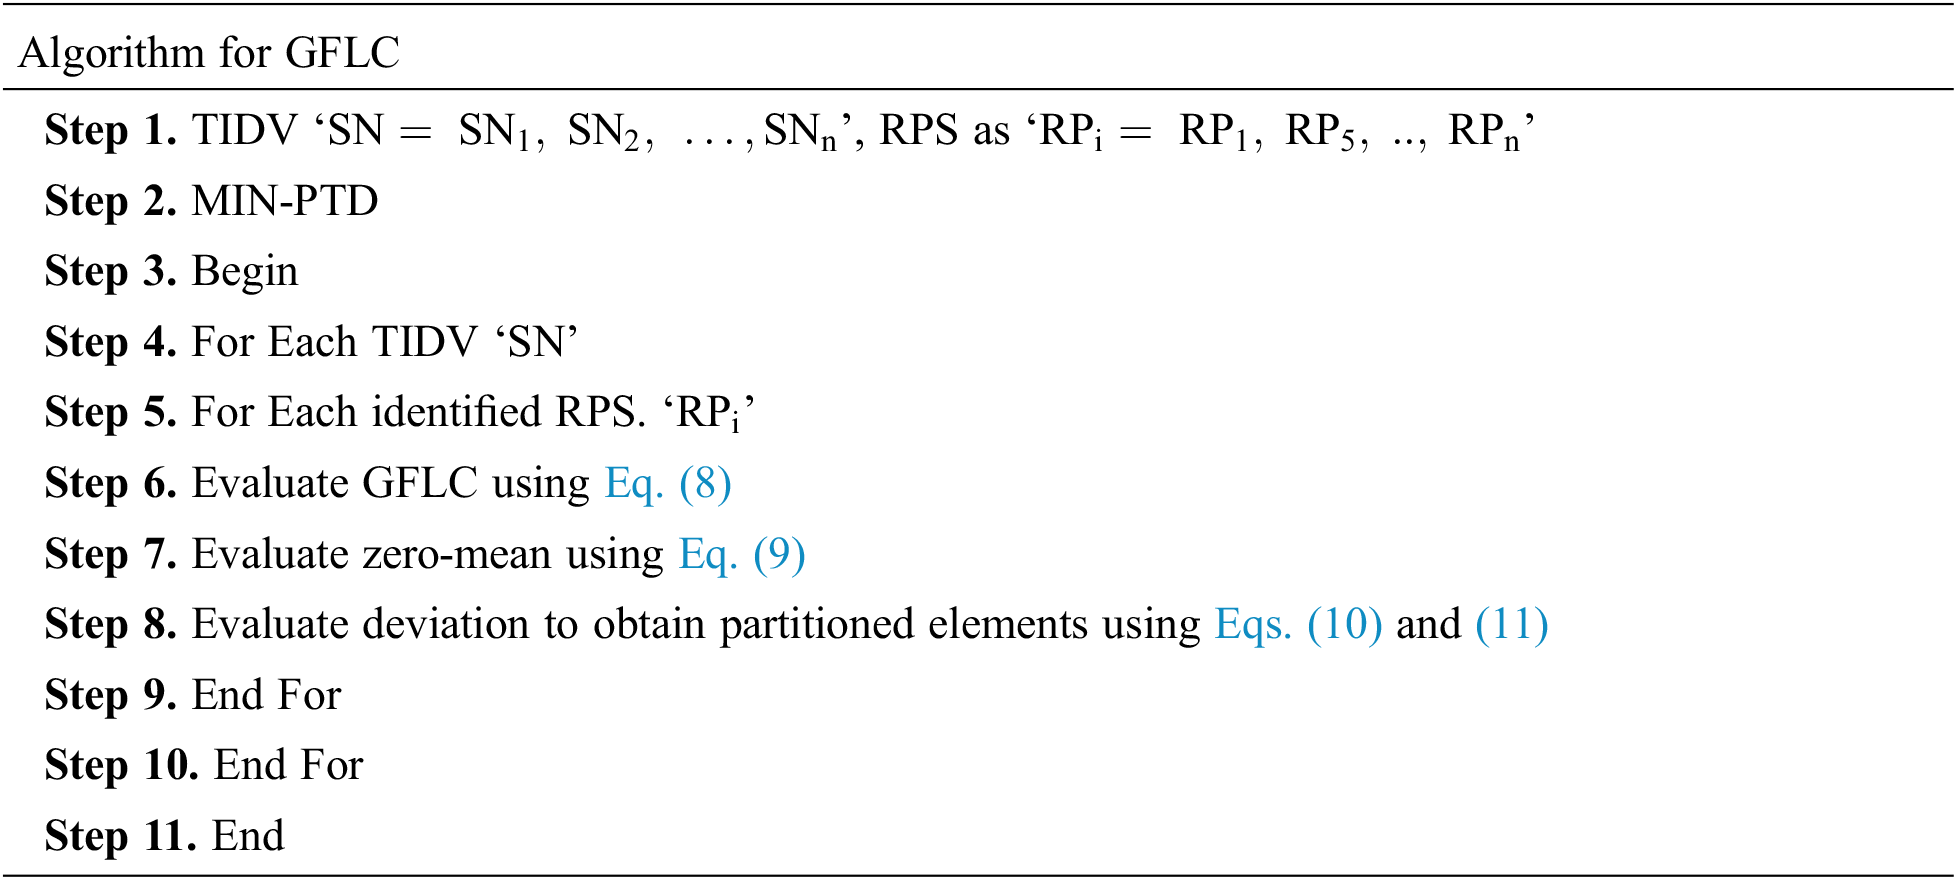
The construction of GFLC model is the second step in the design of BTAC method. The delay factor is reduced by the selected RPS for DPT in BTAC method through heterogeneous elements in WSN using the GFLC. The tensors stimulate Zero-mean Gaussian Distributions (GD) for the purpose of computing the DPT rate with a Linear Combination of Gaussians (LCG). By transmitting the packets via heterogeneous elements like defining zero-mean using GFLC, the delay factor or the PTD is reduced for each observation time ‘t = 1,2,…n’. The representation of the GFLC for each TIDV is given below on considering the selected RPS as TIDV ‘SN = SN1, SN2,…SNn’ and let ‘RPi=RP1, PR5, RPn’.
Using the GFLC, the zero-mean for DPT in BTAC method is identified in Eqs. (8) and (9).
The mean values are symbolized as ‘µi’, and the covariance denoting the deviation values representing the TIDVs is denoted as ‘COV’. Consequently, there is a significant reduction in the PTD for the chosen RPS with a zero mean.
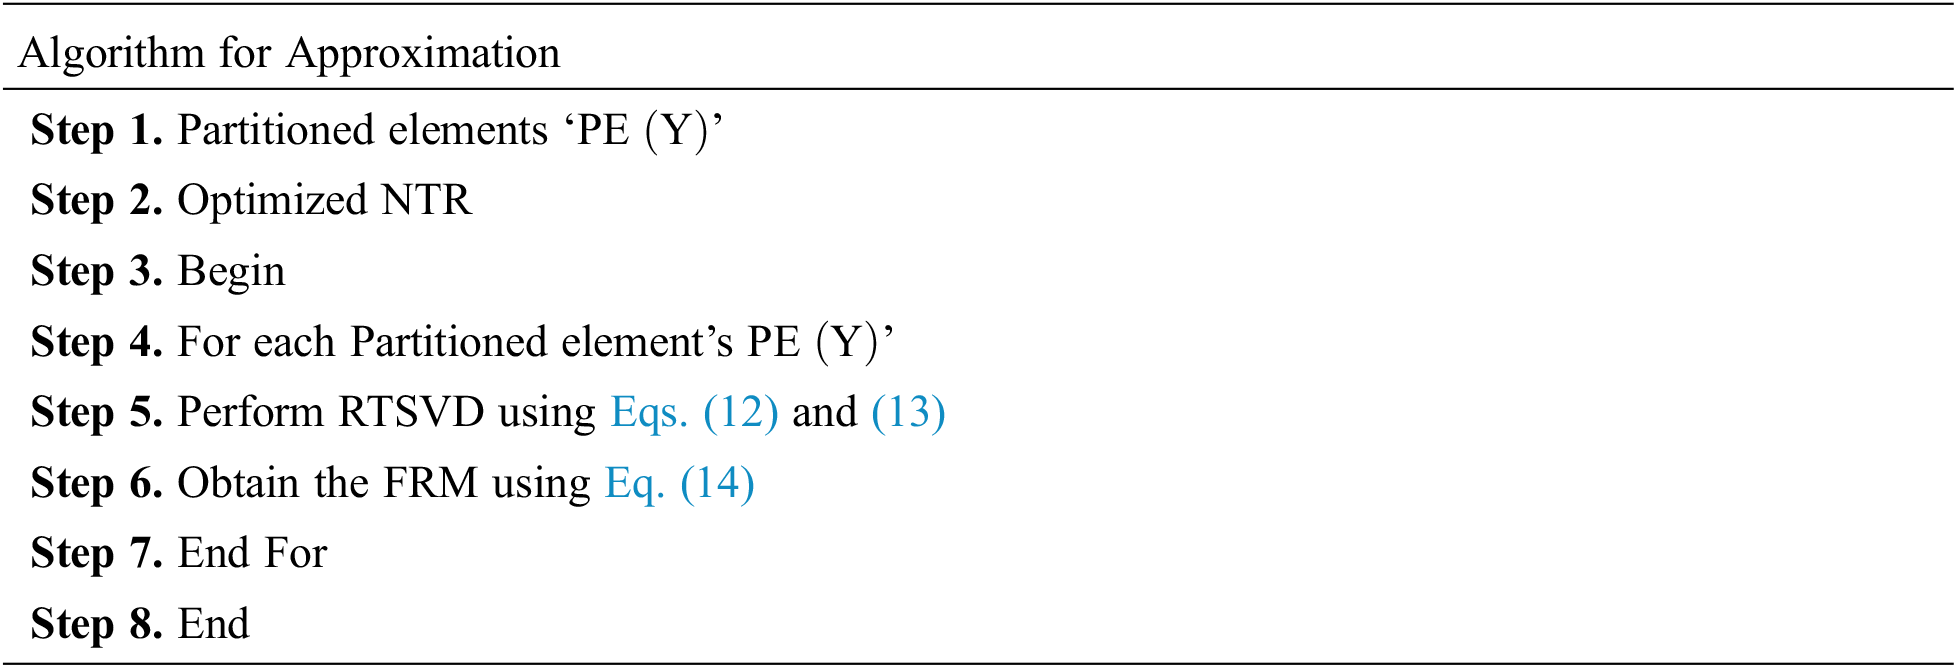
Eventually, the construction of AA is involved in the design of BTAC method. The execution of AA on divided elements is the major contribution of BTAC method. The formation of error-free nodes’ clustering on the basis of the RTSVD in BTAC method is relied upon by Bregman Tensor. The formulation of the flow route map direction F: Rn1*n2*n3 given a vector ‘V’, in ‘Rn1*n2*n3’, is given below:
For effectual nodes clustering on MS-WSN, the usual tangent space distances comprise the Flow Route Map’s (FRM) direction if we consider the covariance matrix as ‘COV(M)’. The existence of neighbourhood SN can be mapped to a given neighbourhood from ‘Rn1*n2*n3’, FRM is contained in the covariance matrix ‘COV(M)’, and it is given in Eqs. (12)–(14). Based on unpolluted nodes, the usual RTSVD is interconnected with each SN mapped to a given neighbourhood for easy clustering. The overhead rate is reduced for a higher rate of unpolluted nodes in BTAC, which is a clustering of trusted SNs.
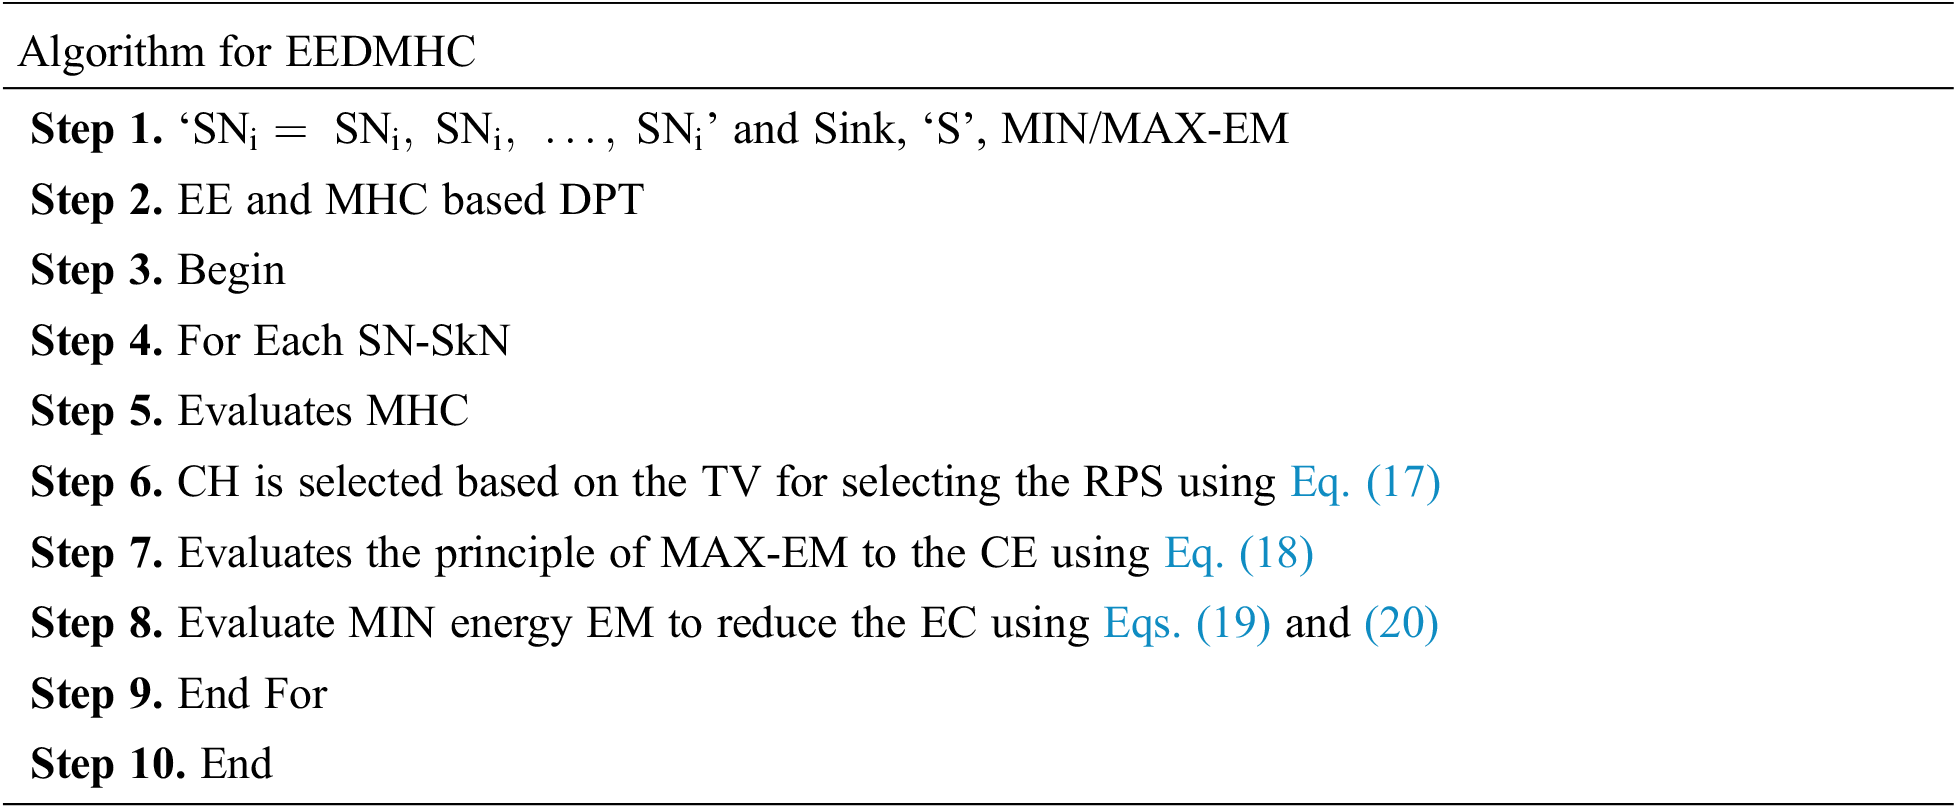
5 Generalized Iterative Scaling Based Energy Efficient Multi-Hop Clustering
The GISEDC method is developed to enhance the MHC with MIN-EC. A log-linear model known as the Generalized Iterative Scaling (GIS) is used to MAX the CE and minimize the EC. At first, the energy is saved in WSN by performing MHC on the disseminated SNs with MS. Therefore, the two factors in the GIS approach are used for selecting the CH. In order to minimize the EC, the CE on the disseminated SNs and the theory of the MIN-EM are enhanced by the GISEDC method using the principle of MAX-EM. In the cluster-ID, the cluster that carries the number of nodes and neighbouring Cluster Data Aggregation (CDA) are included in the grid that is a part of the formation of CH in GIS. The usage of neighbouring CDA and identification of nodes in more than one cluster by the GISEDC method is known as periphery node. Especially in a huge-scale WSN, the periphery node enhances network performance with the MIN-DT. Lastly, the network throughput with MIN-EC is increased by an Energy Effective Distributed Multi-Hop Clustering (EEDMHC) algorithm. There are two parts to the proposed GISEDC model. The CE is improved by the GIS, and the MIN-EC makes use of EEDMHC algorithm. Fig. 6 shows the block diagram of GISEDC model.
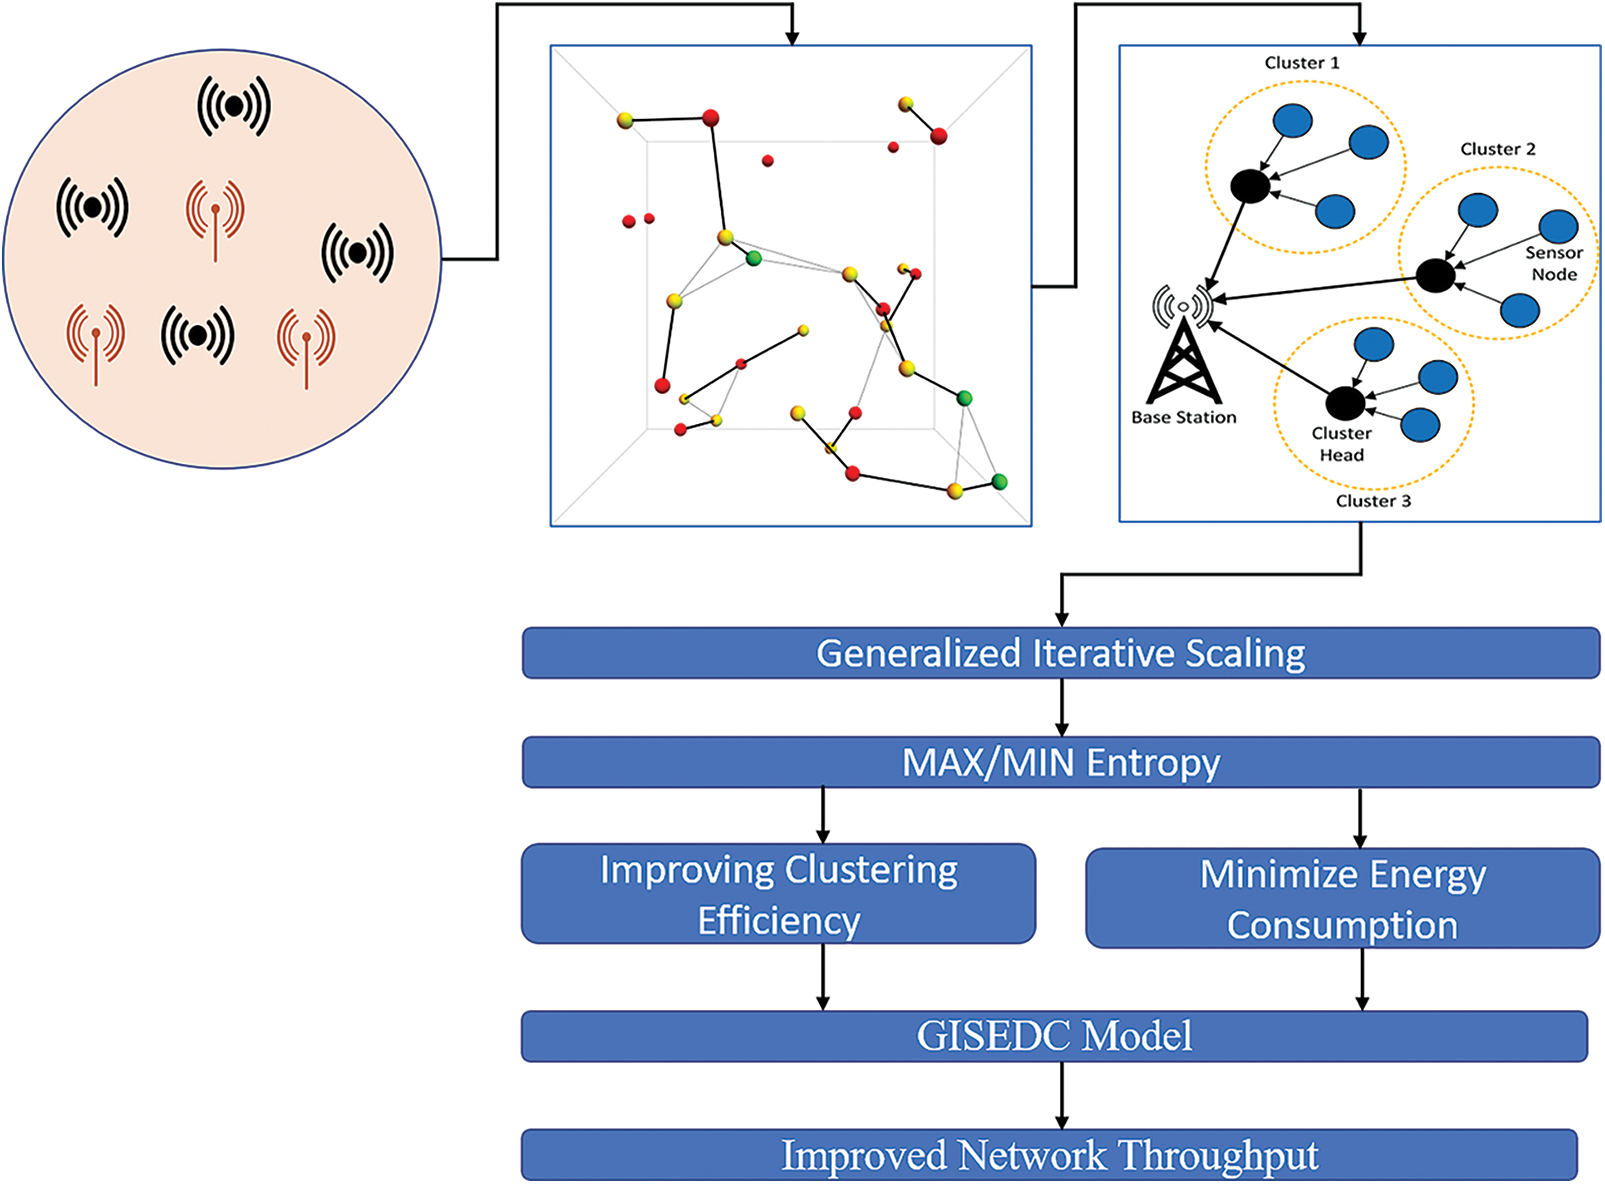
Figure 6: Proposed GISEDC model
5.1 Multi-Hop Clustering Head Selection
Depending on the left out energy and the number of SNs in WSN, the CH is selected in the GISEDC model. Let it be considered that there is a random spread of ‘n’ many SNs over the WSN environment. A single-hop exists in the data distribution among SN and their CH. In the same way, another multi-hop is the DPT between the CH and SkN. The clustering in WSN is performed, for which a start message is transmitted by the SkN to all SNs prior to the MHC process. Initially, the SNs in the neighbouring sink receive this message, and later, for these messages, the SNs calculate the Threshold Value (TV). Based on Residual Energy (RE) and other Neighboring Nodes (NN), the calculation of TC is done. As in the below Eq. (15), the selection of TVs is carried out. The value of T is transmitted by SN to their adjacent nodes after measuring the TC. The value is transmitted to the adjacent node, and an analogy is made with their TV. Along with the cluster-ID, the number of nodes in that cluster and neighbouring CDA, a network is contained in the formation of CH in GIS. The CH formation with SkN is shown in Fig. 7. The periphery node (P) is assumed to have been calculated below: The distance between the nodes is D as given in Eq. (16), and the number of SNs in the network is ‘n’. To choose the path for DPT, the neighbouring nodes for each SN are given much preference after identifying SNs successfully. Because of this reason, for an efficient DPT with MIN energy in WSN, the routing path is chosen.
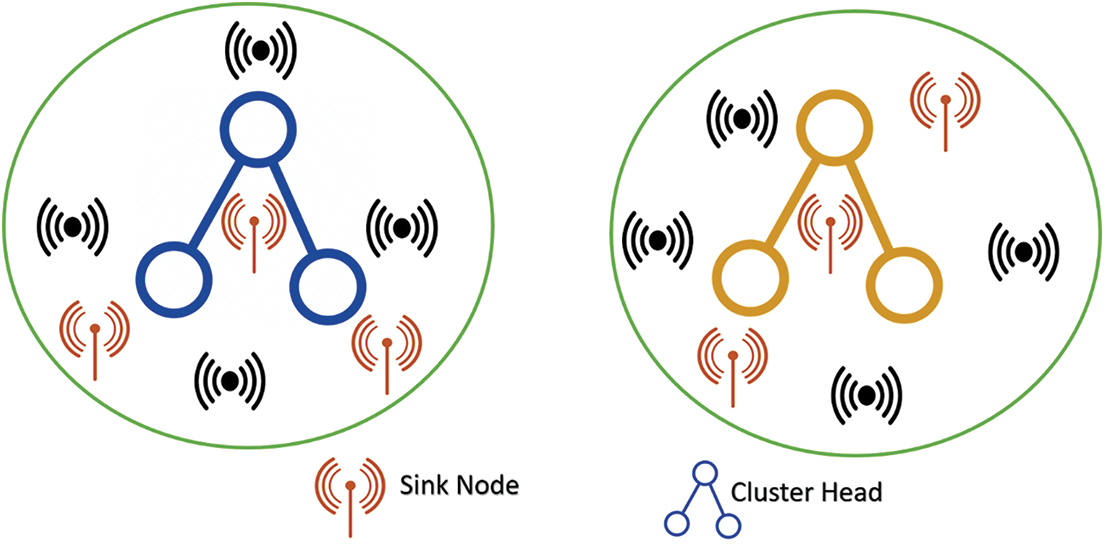
Figure 7: CH formation
5.2 Entropy Model in Generalized Iterative Scaling
In order to improve the efficiency of MHC and EC on the disseminated SNs in WSN, the exponential family of a MAX entropy and MIN entropy clarification is determined by GIS, which is a log-linear method.
5.2.1 Principle of MAX-EM for Clustering Efficiency
To handle the inherent DPT between the determination of the clusters, the MHC is applied with the principle of MAX entropy; moreover, too many distributed networks provide flexibility. The node of a random variable is estimated using the application of the entropy principle. ‘u1, u2, u3, …un’ is the representation of the random variables, and p(ui) is the probability of a random variable. The inverse proportion to the log-likelihood function is the information (In), and it is expressed as,
The information entropy theory can be written from Eq. (7) as follows,
When p(ui) = 1/n, H(U) acquires the maximum value as shown in Eq. (18) entropy probability distribution is being the uniform distribution, i = {1, 2…n}. The probability distribution in U is P, and the context information is (u, v) in Eq. (19). A better CE of the disseminated SNs is achieved by the GISEDC. Below is the MAX-EM:
5.2.2 Principle of MIN-EM for Consumption of Energy
In the GISEDC method, the principle of MIN-EM is used, and through this method, the cumulative energy is MIN at equilibrium, taking into account any unlimited nodes in a WSN. The minimization of internal energy at constant entropy is the indication of the MIN energy entropy principle. The internal energy value and the consistent entropy at equilibrium are the E and R, respectively, as given in Eq. (20). The ‘y’ that denotes any unlimited internal variables is from where the variables have been modified. In GISEDC method, the EC is decreased by applying the principle of MIN-energy entropy. The DPT between the S-DP with MIN-EC is increased successfully using the EEDMHC algorithm. The calculation of internal energy value is as below:
6 Performance of Energy Efficient Routing
In the NS2, the evaluation of the proposed HEPFMUR techniques in WSN was carried out. The WSN, which produces traffic for every 25 ms, is considered to have a network consisting of 100 SNs positioned in a square of A2(1400 m × 1400 m) in a random manner. Using the Random waypoint model for simulation, the distribution of nodes takes place in an area, and at the same time, the link between two nodes is provided by the link layer, and the link’s design is multi-directional. The data PKT of range 8 to 63 is collected by the SkN, and each data with the size of PKT varying between 100 to 512 kb is forwarded to the SkN. The network connectivity is maintained by changing the radio ranges dynamically between 5 and 30 m. A variation between 500 to 1500 ms is witnessed in the simulation time.
For MIN-EC and enhanced routing efficiency, an experiment is conducted in WSN. RST, NTR, EC, PTD, RPS, and CE are some of the parameters utilized for evaluating the WSN with distinct sensing nodes. In the proposed HEPFMUR model, GISEDC method with prevailing Store-Carry and Forward (SCF) method demonstrated by Multiple-Criteria Decision-Making (MCDM) and BTAC method are some of the models in which the experiment is conducted.
The number of data PKTs transmitted by source nodes that is sent to the sink to the number of PKTs received successfully by the equivalent destination nodes is the ratio of the NTR.
The destination node and different PKTs that receive the PKTs are used to measure the throughput ‘T’, shown in Eq. (21). The number of received data PKTs is denoted by
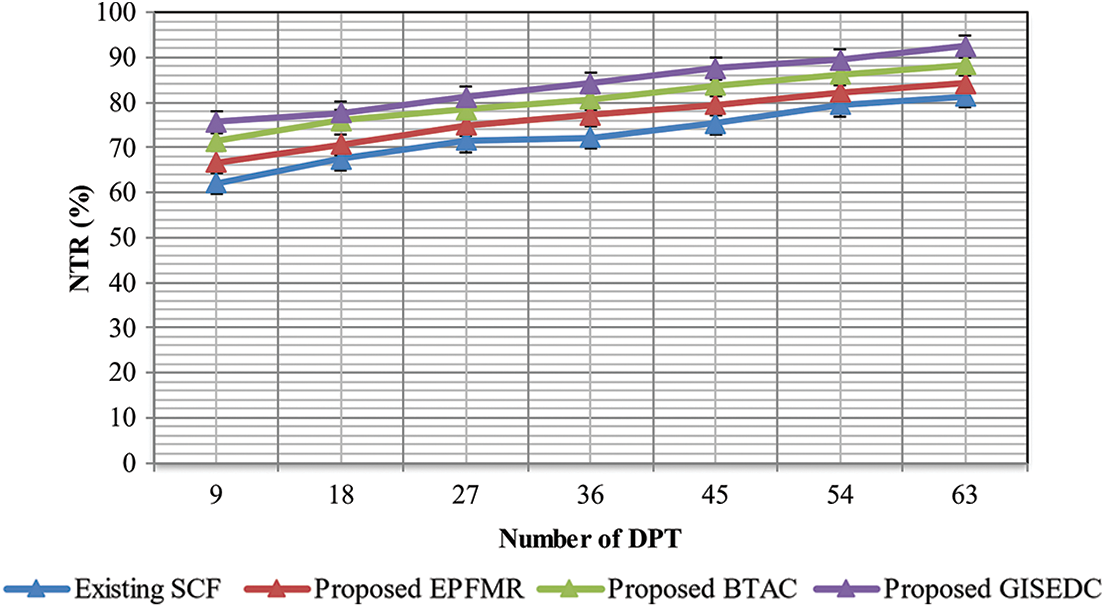
Figure 8: NTR measurement
The product of SNs, power (watts), and time (Sec) give EC in WSN for routing efficiency. Given below is the mathematical formulation for EC,
EC is defined as EC in Eq. (22), where to reach the SkN, SNs define the EC. Based on several SNs, the EC is depicted in Fig. 9. Compared to the remaining methods and its MIN-EC, the performance of our proposed GISEDC method works out well. The routing path is chosen for effective transmission with MIN-EC after the MHC is carried out on the SN in GISEDC. Additionally, in any unlimited nodes in a WSN, the total energy is MIN at equilibrium by applying the MIN-EM principle. By applying the MHC algorithm in the proposed GISEDC method, EC is MIN, i.e., 45%, when compared to the present techniques like an MCDM, enabled SC. Similarly, 15% and 28% are the MIN-EC in the other proposed methods like BTAC and EPFMUR modes. Hence, a better EC is achieved in the proposed GISEDC method.

Figure 9: Measurement of EC
6.4 Clustering Efficiency (CE)
The ratio of the number of SNs accurately clustered to the total number of nodes in the network is defined as CE. The Cluster Efficient is known as CE; the number of SNs situated in WSN is represented as Tn as in Eq. (23)
When compared to other advanced techniques, there is an improvement in the experimental values of CE in the proposed GISEDC method. Here, the variation in the number of SNs is 10 to 70 nodes. The clusters’ efficiency increases when there is an increase in the number of SNs. The number of nodes used in WSN determines CE measurement, as shown in Fig. 10. There is a variation in the nodes from 10 to 70 for practical consideration. The CE also increases with the increase in the number of SNs. This is due to the reason that with the aim of MS to increase the CE, the MHC is carried out on the disseminated SNs.
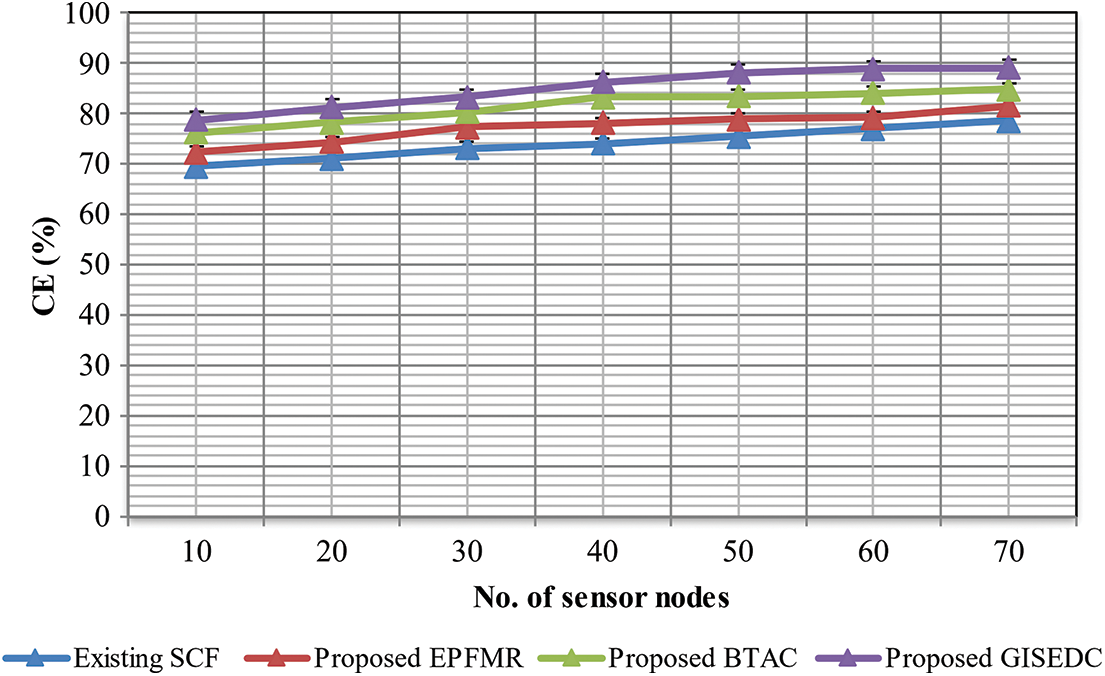
Figure 10: Measurement of CE
Nonetheless, the DPT between the cluster is determined using the application of the MAX-EM principle, which enables MAX-CE. When compared to the present techniques, viz., MCDM enabled SCF, the application of MHC algorithm in the proposed GISEDC method increased the cluster efficiency by 13%. Similarly, the CE of the other proposed methods, viz., BTAC and EPFMUR models, is increased by 9% and 4%, respectively.
6.5 Data Packet Transmission Delay
Two factors in WSN are considered to measure the PTD, viz., required DPT and actual DPT. Hence, the difference between the required DPT and the actual DPT is PTD. The Required and Actual DPT are used to measure the PTD as given in the above Eq. (24). The number of PKTs sent ranges between 9 and 63 in the experimental set-up. A better PTD rate is provided by the BTAC method. Comparable values are offered to the advanced techniques by the PTD acquired from our proposed BTAC method. In connection with SNs in which distinct data PKTs are sent by each SN to the SkN is shown in Fig. 11. Due to GFLC, the proposed BTAC method varies from another approach. The inducement of the tensors of the zero-mean GD in association with the LCG to send the PKT is the merit of deploying GFLC in BTAC method. To interact between SNs and SkN that enable PTD reduction, the utilization of ero-mean GD is significant. When compared to the present techniques, viz., MCDM enabled SCF, the application of GFLC in the proposed BTAC method significantly reduced PTD by 35%. Likewise, there is also a considerable reduction of the PTD by 23% and 12%, respectively, using the other proposed techniques, viz., GISEDC method and the HEMUR model. Thus, a better PTD is obtained using the proposed BTAC method.
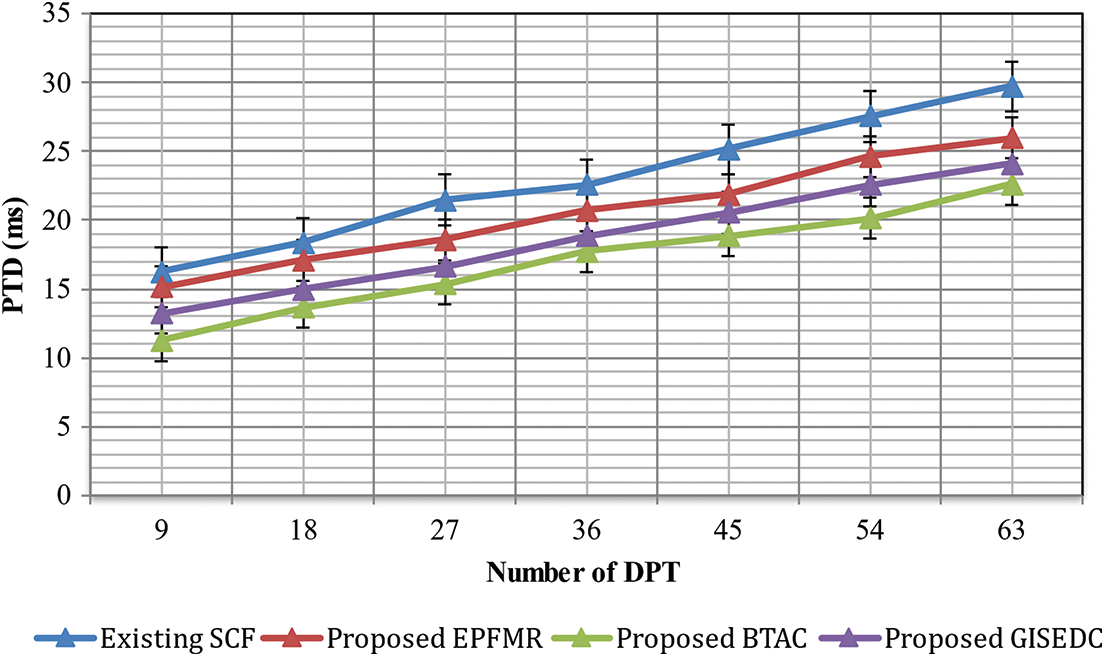
Figure 11: Measurement of PTD
The ratio of route path to the route path utilized from the optimum path is RPS. From Eq. (24), the RPS is acquired. The utilized and the available path of the WSN calculate it. The efficiency of the method is said to be more when the RPS is higher (Fig. 12).
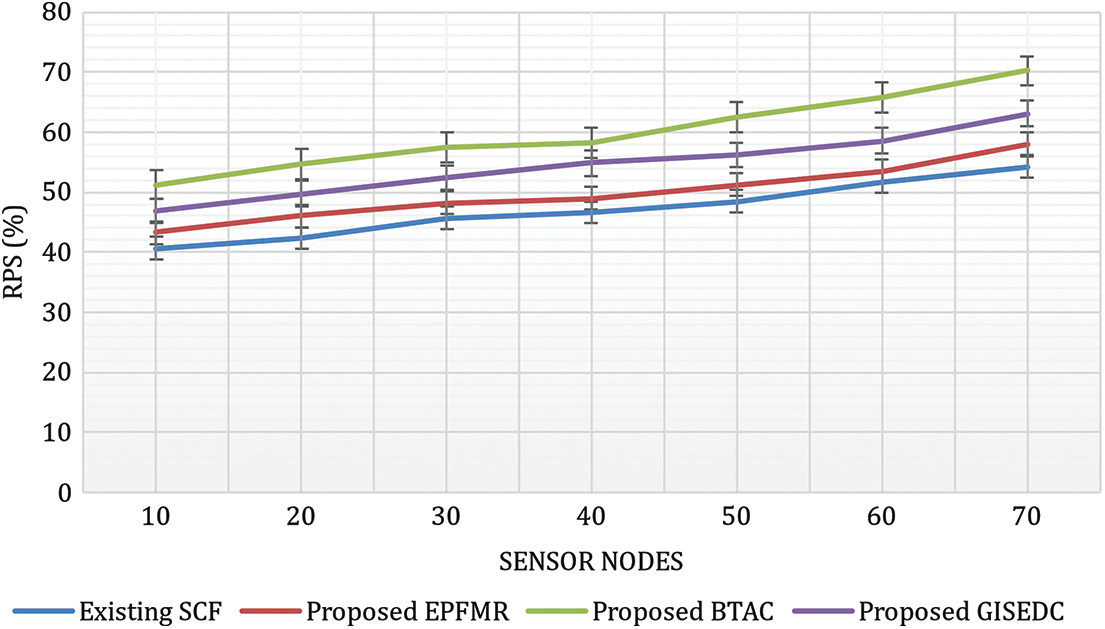
Figure 12: Measurement of RPS
A network size of 1400 × 1400 m was chosen for the purpose of the experiment. Using the proposed BTAC method, for distinct SNs, the values obtained through Eq. (24) are tabulated and briefly compared with other methods. The efficiency of the method is more when the RPS is higher. Regarding distinct SNs, the RPS for DPT in WSN is shown in Fig. 13. The increase in RPS with the increase of SNs in WSN is confirmed in the above reported results, and by using BTAC, it is comparatively higher. With the application of the TC model, there is an enhancement of the RPS for DPT. A logical partition on MS is performed by TC model with an intention to develop the RPS.

Figure 13: Measurement of RST
Consequently, there is an improvement in the RPS using BTAC method. When compared to the present techniques, viz., MCDM enabled SCF, the application of the TC model in the proposed BTAC method has improved RPS by 21%. Likewise, there is also an improvement of RPS in the other proposed methods like GISEDC method and HEMUR model by 13% and 6%, respectively. Thus, RPS achieves better in the proposed BTAC method.
SNs (70 nodes) are used to conduct the experiments. There is a difference between the end RST and start RST by the sink in WSN when the RST sought a route. ‘RSt’ is used to measure the RST in the above Eq. (25), while the end RST is represented by ‘End TimeRS’ by the sink and the start time for RST is represented as ‘Start TimeRS’ by the sink in WSN. Using the HEMUR model, it is explicit that there is a decrease in the RST in Source-Destination Pairs (S-DP). Using HEMUR model, the ATT and traffic volume that cause MIN-RST is considered by the RST based BD. The ATT for S-DP is measured by BD using the ‘0’ value, and hence, there is an acquisition of an ideal global route for S-DP. When compared to the present techniques viz., MCDM enabled SCF achieves a reduction in RST by 35% using the proposed HEMUR model. Similarly, there is also a reduction in the RST by 10% and 18%, respectively, using the other proposed methods like GISEDC and BTAC methods. Hence, a better RST is obtained in the proposed HEMUR model.
In WSN, GISEDC method is developed. The GIS-a log-linear model is used to MAX the CE and minimize the EC. At first, on the disseminated SNs with MS for EE in WSN, the MHC is carried out. To enhance the CE on the disseminated SNs, the application of the MAX-EM principle is practically made. The grid comprising the number of nodes formed in that cluster, cluster-ID and neighbouring CDA are included in the generation of CH in GIS. In the end, the network throughput is increased with MIN-EC using the application of HEEDMC algorithm. The efficiency of RPS for DPT is enhanced at the SkN with the help of the proposed BTAC method. A low PTD rate and enhanced NTR are provided by the proposed method. The TC, which applies the DTC algorithm, is used to improve the route path efficiency in BTAC method. For influential nodes clustering, the direction of the flow route map is contained in RTSVD for reducing COH. During routing, by applying PFMUR, the theoretical analysis and experimentation results show that the EC is enhanced using the HEPFMUR model by 20%. Compared to the advanced techniques, the application of proportional fairness with BD enhances the AEPP by 39%. A better performance is offered by the BTAC method using the application of GFLC with AA resulting in an enhancement of COH by 19% and reduction of PTD by 23%. There is an enhancement of 8% of CE and 27% of EC using the GISEDC method when compared to the advanced techniques.
Funding Statement: The authors are grateful to the Taif University Researchers Supporting Project number (TURSP-2020/36), Taif University, Taif, Saudi Arabia.
Conflicts of Interest: The authors declare that they have no conflicts of interest to report regarding the present study.
References
1. B. Omaima, A. Daniyal, B. Surbhi, D. Pankaj, A. Farrukh et al., “Distance matrix and Markov chain based sensor localization in WSN,” Computers, Materials & Continua, vol. 71, no. 2, pp. 4051–4068, 2022. [Google Scholar]
2. C. J. Watras, M. Morrow, K. Morrison, S. Yaziciaglu, S. Yaziciaglu et al., “Evaluation of wireless sensor networks (WSNs) for remote wetland monitoring: Design and initial results,” Environmental Monitoring and Assessment, vol. 186, no. 2, pp. 919–934, 2014. [Google Scholar]
3. E. D. Pascale, I. Macaluso, A. Nag, M. Kelly and L. Doyle, “The network as a computer: A framework for distributed computing over IoT mesh networks,” IEEE Internet Things Journal, vol. 5, no. 3, pp. 2107–2119, 2018. [Google Scholar]
4. F. Deniz, H. Bagci, I. Korpeoglu and A. Yazıcı, “Energy-efficient and fault-tolerant drone-BS placement in heterogeneous wireless sensor networks,” Wireless Networks, vol. 27, no. 1, pp. 825–838, 2021. [Google Scholar]
5. H. Mostafaei, “Energy-efficient algorithm for reliable routing of wireless sensor networks,” IEEE Transactions on Industrial Electronics, vol. 66, no. 7, pp. 5567–5575, 2018. [Google Scholar]
6. H. Q. Huang, D. Y. Yao, J. Shen, K. Ma and H. Liu, “Multi-weight based clustering algorithm for wireless sensor networks,” Journal of Electronics & Information Technology, vol. 30, no. 6, pp. 1489–1492, 2008. [Google Scholar]
7. J. S. Khan, B. Wadii, A. Jawad, R. Saeed, A. U. Rehman et al., “DNA and plaintext dependent chaotic visual selective image encryption,” IEEE Access, vol. 8, pp. 159732–159744, 2020. [Google Scholar]
8. K. Muthumayil, R. Karuppathal, T. Jayasankar, B. Aruna Devi, N. B. Prakash et al., “A big data analytical approach for prediction of cancer using modified K-nearest neighbour algorithm,” Journal of Medical Imaging and Health Informatics, vol. 11, no. 8, pp. 2120–2125, 2021. [Google Scholar]
9. K. Rajakumari, M. Vinoth Kumar, V. Garima, S. Balu, D. K. Sharma et al., “Fuzzy based ant colony optimization scheduling in cloud computing,” Computer Systems Science and Engineering, vol. 40, no. 2, pp. 581–592, 2022. [Google Scholar]
10. N. Keerthana, V. Viji and S. Sudhakar, “A novel method for multi-dimensional cluster to identify the malicious users on online social networks,” Journal of Engineering Science and Technology, vol. 15, no. 6, pp. 4107– 4122, 2020. [Google Scholar]
11. N. Keerthana, V. Vinod and S. Sudhakar, “Slicing, tokenization, and encryption-based combinational approach to protect data-at-rest in cloud using TF-Sec model,” Journal of Computational and Theoretical Nanoscience, vol. 17, no. 12, pp. 5296–5306, 2020. [Google Scholar]
12. O. Cheikhrouhou, M. Bhatti and R. Alroobaea, “A hybrid DV-hop algorithm using RSSI for localization in large-scale wireless sensor networks,” Sensors, vol. 18, no. 5, pp. 1–14, 2018. [Google Scholar]
13. O. Younis and S. Fahmy, “HEED: A hybrid, energy-efficient, distributed clustering approach for ad hoc sensor networks,” IEEE Transactions on Mobile Computing, vol. 3, no. 4, pp. 366–379, 2004. [Google Scholar]
14. P. Dadheech, R. Sheeba, R. Vidya, P. Rajarajeswari, P. Srinivasan et al., “Implementation of internet of things-based sentiment analysis for farming system,” Journal of Computational and Theoretical Nanoscience, vol. 17, no. 12, pp. 5339–5345, 2020. [Google Scholar]
15. P. S. Ngangbam, S. Shruti, R. P. Thandaiah, S. Tripti, R. Selvakumar et al., “Investigation on characteristics of monte carlo model of single-electron transistor using orthodox theory,” Sustainable Energy Technologies and Assessments, vol. 48, no. 101601, pp. 1–15, 2021. [Google Scholar]
16. P. Thirumoorthy, A. Daniyal, B. Surbhi, A. M. Areej, D. Pankaj et al., “Improved energy based multi-sensor object detection in wireless sensor networks,” Intelligent Automation & Soft Computing, vol. 33, no. 1, pp. 227–244, 2022. [Google Scholar]
17. R. Nithya, K. Amudha, A. Syed Musthafa, D. K. Sharma, R. A. Edwin Hernan et al., “An optimized fuzzy-based ant colony algorithm for 5G-MANET,” CMC-Computers, Materials & Continua, vol. 70, no. 1, pp. 1069–1087, 2022. [Google Scholar]
18. R. Vasanthi, O. I. Khalaf, C. A. T. Romero, S. Sudhakar and D. K. Sharma, “Interactive middleware services for heterogeneous systems,” Computer Systems Science and Engineering, vol. 41, no. 3, pp. 1241–1253, 2022. [Google Scholar]
19. S. Bourouis, A. Zaguia, N. Bouguila and R. Alroobaea, “Deriving probabilistic SVM kernels from flexible statistical mixture models and its application to retinal images classification,” IEEE Access, vol. 7, pp. 1107–1117, 2019. [Google Scholar]
20. S. Mehbodniya, A. Bhatia, A. Mashat, E. Mohanraj and S. Sudhakar, “Proportional fairness based energy-efficient routing in wireless sensor network,” Computer Systems Science and Engineering, vol. 41, no. 3, pp. 1071–1082, 2022. [Google Scholar]
21. S. Nanthini, S. N. Kalyani and S. Sudhakar, “Energy-efficient clustering protocol to enhance network lifetime in wireless sensor networks,” Computers, Materials & Continua, vol. 68, no. 3, pp. 3595–3614, 2021. [Google Scholar]
22. S. Stalin David, M. Anam, K. Chandraprabha, S. Arun Mozhi Selvi, D. K. Sharma et al., “Cloud security service for identifying unauthorized user behaviour,” Computers, Materials & Continua, vol. 70, no. 2, pp. 2581–2600, 2022. [Google Scholar]
23. S. Stalin David, S. Arun Mozhi Selvi, S. Sivaprakash, P. Vishnu Raja, D. K. Sharma et al., “Enhanced detection of glaucoma on ensemble convolutional neural network for clinical informatics,” Materials & Continua, vol. 70, no. 2, pp. 2563–2579, 2022. [Google Scholar]
24. S. Sudhakar and S. Chenthur Pandian, “Secure packet encryption and key exchange system in mobile ad hoc network,” Journal of Computer Science, vol. 8, no. 6, pp. 908–912, 2012. [Google Scholar]
25. S. Sudhakar and S. Chenthur Pandian, “A trust and co-operative nodes with affects of malicious attacks and measure the performance degradation on geographic aided routing in mobile ad hoc network,” Life Science Journal, vol. 10, no. 4s, pp. 158–163, 2013. [Google Scholar]
26. S. Sudhakar and S. Chenthur Pandian, “An efficient agent-based intrusion detection system for detecting malicious nodes in MANET routing,” International Review on Computers and Software, vol. 7, no. 6, pp. 3037–3304, 2012. [Google Scholar]
27. S. Sudhakar and S. Chenthur Pandian, “Authorized node detection and accuracy in position-based information for MANET,” European Journal of Scientific Research, vol. 70, no. 2, pp. 253–265, 2012. [Google Scholar]
28. S. Sudhakar and S. Chenthur Pandian, “Hybrid cluster-based geographical routing protocol to mitigate malicious nodes in mobile ad hoc network,” International Journal of Ad Hoc and Ubiquitous Computing, vol. 21, no. 4, pp. 224–236, 2016. [Google Scholar]
29. S. Sudhakar and S. Chenthur Pandian, “Investigation of attribute aided data aggregation over dynamic routing in wireless sensor,” Journal of Engineering Science and Technology, vol. 10, no. 11, pp. 1465–1476, 2015. [Google Scholar]
30. S. Sudhakar and S. Chenthur Pandian, “Trustworthy position-based routing to mitigate against the malicious attacks to signifies secured data packet using geographic routing protocol in MANET,” WSEAS Transactions on Communications, vol. 12, no. 11, pp. 584–603, 2013. [Google Scholar]
31. S. Sudhakar, G. R. K. Rao, O. I. Khalaf and M. Rajesh Babu, “Markov mathematical analysis for comprehensive real-time data-driven in healthcare,” Mathematics in Engineering Science and Aerospace, vol. 12, no. 1, pp. 77–94, 2021. [Google Scholar]
32. S. Sudhakar, K. Ketan, V. Indragandhi, V. Priya, V. Vijayakumar et al., “Real-time automatic investigation of Indian roadway animals by 3D reconstruction detection using deep learning for R-3D-YOLOV3 image classification and filtering,” Electronics, vol. 10, no. 24, pp. 1–15, 2021. [Google Scholar]
33. S. Sudhakar, O. I. Khalaf, G. R. K. Rao, D. K. Sharma, K. Amarendra et al., “Security-aware routing on wireless communication for e-health records monitoring using machine learning,” International Journal of Reliable and Quality E-Healthcare,”, vol. 11, no. 3, pp. 1–10, 2022. [Google Scholar]
34. S. Sudhakar, O. I. Khalaf, P. Vidya Sagar, D. K. Sharma, L. Arokia Jesu Prabhu et al., “Secured and privacy-based IDS for healthcare systems on e-medical data using machine learning approach,” International Journal of Reliable and Quality E-Healthcare, vol. 11, no. 3, pp. 1–11, 2022. [Google Scholar]
35. S. Sudhakar, O. I. Khalaf, S. Priyadarsini, D. K. Sharma, K. Amarendra et al., “Smart healthcare security device on medical IoT using Raspberry Pi,” International Journal of Reliable and Quality E-Healthcare, vol. 11, no. 3, pp. 1–11, 2022. [Google Scholar]
36. S. Sudhakar, P. Vidya Sagar, R. Ramesh, O. I. Khalaf and R. Dhanapal, “The optimization of reconfigured real-time datasets for improving classification performance of machine learning algorithms,” Mathematics in Engineering Science and Aerospace, vol. 12, no. 1, pp. 43–54, 2021. [Google Scholar]
37. S. Sudhakar, V. Subramaniyaswamy, H. J. Rutvij, V. Vijayakumar, S. Roy et al., “A secure recommendation system for providing context-aware physical activity classification for users,” Security and Communication Networks, vol. 2021, no. 4136909, pp. 1–15, 2021. [Google Scholar]
38. S. Sudhakar, V. Subramaniyaswamy, V. Indragandhi, V. Priya and R. Lokesh, “Detection of false data cyber-attacks for the assessment of security in smart grid using deep learning,” Computers & Electrical Engineering, vol. 93, no. 107211, pp. 1–15, 2021. [Google Scholar]
39. S. Sudhakar, V. Vijayakumar, K. Sujatha, S. Gunasekaran, C. Sathiya Kumar et al., “Investigation on agricultural land selection using hybrid fuzzy logic system, Scalable Computing,” Practice and Experience, vol. 21, no. 4, pp. 569–582, 2020. [Google Scholar]
40. U. Priyadarshni and S. Sudhakar, “Cluster-based certificate revocation by cluster head in mobile ad-hoc network,” International Journal of Applied Engineering Research, vol. 10, no. 20, pp. 16014–16018, 2015. [Google Scholar]
41. W. Alhakami, A. ALharbi, S. Bourouis, R. Alroobaea and B. Nizar, “Network anomaly intrusion detection using a nonparametric Bayesian approach and feature selection,” IEEE Access, vol. 7, pp. 52181–52190, 2019. [Google Scholar]
42. W. Xiang, N. Wang and Y. Zhou, “An energy-efficient routing algorithm for software-defined wireless sensor networks,” IEEE Sensors Journal, vol. 16, no. 20, pp. 7373–7400, 2016. [Google Scholar]
43. X. Liu, “An optimal-distance-based transmission strategy for lifetime maximization of wireless sensor networks,” IEEE Sensors Journal, vol. 15, no. 6, pp. 3484–3491, 2015. [Google Scholar]
44. Y. Zhang, M. Chen, S. Mao, L. Hu and V. C. M. Leung, “CAP: Community activity prediction based on big data analysis,” IEEE Network, vol. 28, no. 4, pp. 52–57, 2014. [Google Scholar]
45. Z. Wen, D. Zhang, K. Yu and T. Sato, “Information centric networking for disaster information sharing services,” IEICE Transactions on Fundamentals of Electronics, Communications and Computer Sciences, vol. E98.A, no. 8, pp. 1610–1617, 2015. [Google Scholar]
46. Z. Zinonos, C. Chrysostomou and V. Vassiliou, “Wireless sensor networks mobility management using fuzzy logic,” Ad Hoc Networks, vol. 16, no. 4, pp. 70–87, 2014. [Google Scholar]
Cite This Article
 Copyright © 2023 The Author(s). Published by Tech Science Press.
This work is licensed under a Creative Commons Attribution 4.0 International License , which permits unrestricted use, distribution, and reproduction in any medium, provided the original work is properly cited.
 Downloads
 Citation Tools