
 Submit a Paper
 Propose a Special lssue
 Open Access
ARTICLE
ASL Recognition by the Layered Learning Model Using Clustered Groups
Department of Information and Communication Engineering, Myongji University, Yongin, Korea
* Corresponding Author: Jaehee Jung. Email:
Computer Systems Science and Engineering 2023, 45(1), 51-68. https://doi.org/10.32604/csse.2023.030647
Received 30 March 2022; Accepted 18 May 2022; Issue published 16 August 2022
 View Full Text
 Download PDF
Abstract
American Sign Language (ASL) images can be used as a communication tool by determining numbers and letters using the shape of the fingers. Particularly, ASL can have an key role in communication for hearing-impaired persons and conveying information to other persons, because sign language is their only channel of expression. Representative ASL recognition methods primarily adopt images, sensors, and pose-based recognition techniques, and employ various gestures together with hand-shapes. This study briefly reviews these attempts at ASL recognition and provides an improved ASL classification model that attempts to develop a deep learning method with meta-layers. In the proposed model, the collected ASL images were clustered based on similarities in shape, and clustered group classification was first performed, followed by reclassification within the group. The experiments were conducted with various groups using different learning layers to improve the accuracy of individual image recognition. After selecting the optimized group, we proposed a meta-layered learning model with the highest recognition rate using a deep learning method of image processing. The proposed model exhibited an improved performance compared with the general classification model.Keywords
American Sign Language (ASL) involves expressing English alphabet letters through finger shapes and gestures [1]. With ASL, sign language can be expressed with a combination of characters using hand gestures; hence, this approach can be adopted as the primary means of communication between people suffering from hearing loss. Additionally, it can be used as the most suitable channel of expression for communication between hearing-impaired and unimpaired people. However, because sign language is difficult for non-specialists to understand, learn, and apply within a short period, a method that recognizes hand gestures using image processing and sensor information can be beneficial for communication. To communicate using hand-shape recognition, information from real-time sensors, such as kinect, can be employed for faster hand-shape and gesture recognition. However, sensor-based methods are limited, owing to the inconvenience of installing additional sensor equipment; hence, active research is currently being conducted on hand-shape recognition using simple image processing techniques via deep learning, without the need of an additional sensor. In this study, we review recent studies on hand-shape recognition based on image processing, including the use of sensors, and discuss recent trends in research on hand-shape recognition. Moreover, we propose a new approach to classify the ASL, through a meta-learning model and compare its performance with that of traditional approaches.
In this study, ASL images with various backgrounds and sizes were used, but to enable learning unity, the size was reduced, they were preprocessed, and then augmented to learn images using both data-collected and kaggle images. In the three proposed models, the ASL image is clustered by a similar shape, and the clustered groups are classified in the first layer. Model 1 is identified by the original convolutional neural network (CNN) and ResNet models, and Models 2 and 3 constitute the second layer. However, the only difference is that the softmax value in the first layer is checked to verify the reliability of the groups. To evaluate the proposed method, the accuracies of the traditional CNN and ResNet learning models were compared.
This article is composed of five sections. Section 2 reviews recent literature on ASL, which is composed of sensors, skeletons, deep learning, and clustering. Section 3 presents the proposed methods and describes the dataset used and its testing procedures. Section 4 describes the results and performance of the proposed model compared with those of other approaches. Finally, the discussion and conclusions of the study are presented in Section 5.
In hand-shape recognition tasks that use the conventional image processing method, various neural networks have been applied to the data of letter images for the classification of 26 images expressed using hands. This method solely classifies images and has the advantage in that it does not require any other information or equipment, except a camera. Another finger recognition method is based on the use of sensor information and a deep-learning-based open-pose library [2]. Because detailed finger movements can be identified using sensor information, precise finger shapes can be recognized by collecting sensor information mounted on specific body parts, such as knuckles, fingertips, and wrists. Additionally, a number of studies have focused on the real-time recognition of sign language images in video streams [3,4], whereas other studies have been conducted to understand sign language through the comprehensive adoption of information obtained from people’s facial expressions, motions, and postures, which is beyond the method of recognition limited to the finger area [5].
In [6], data were collected using CyberGloveTM, a sensor glove comprising 15 sensors, a flock of birds, and a motion tracker mounted on the hand and wrist. The collected data were used for learning through an artificial neural network (ANN), and the meanings of the finger images were classified. In [7], an ASL recognition system using multiple sensors was proposed. Data collected from leap motion sensors were used for multi-sensor data fusion (MSDF) and recognition was performed using hidden markov models (HMM). Using multiple sensors improves accuracy and performance. The author of [8] used a cyber glove and a 3D motion tracker to extract each hand gesture. Hand-shapes were defined using the joint angle data of the fingers in the strain gauge (a measurement instrument) of the glove, and the meaning of each gesture was classified by an ANN, using the extracted gesture data. In [9], sensors were attached to the arm and time-series surface electromyographic signal (sEMG) data from 0 to 5 were collected using sEMG signals obtained from the muscle. The collected data were adopted for learning through a convolution neural network (CNN), and the electromagnetic (EM) signal data were identified and learned for classifying the numbers of gestures. In [10], radio frequency (RF) sensors were used for ASL recognition, and privacy was maintained. This method has various applications, such as identifying spatial information, angle, and direction through RF sensors, and it provides significant performance improvement in the multi-frequency fusion network proposed in this study. Using all the data of the RF sensor, it can be confirmed that the proposed method’s performance is 12% higher than that of previous studies based on multi-frequency fusion networks.
2.2 A Study Using Skeleton Method
An approach that utilizes the features of a skeleton detects specific points of a knuckle and recognizes the finger's shape through the movement of the points. The author of [11] developed a hand skeleton using the estimated 3D key points and midpoint algorithm, which was projected onto three surfaces, and the data were collected by converting it into an image format. Subsequently, a 3D CNN was applied to improve the accuracy of hand sign language recognition, pose evaluation, and motion recognition. In [12], a hand recognition system that employs a leap motion controller (LMC) and a webcam was proposed. Using the LMC, the 3D positions of the hand joints were extracted, and from the RGB images of the hand obtained through the webcam, outline-based features were extracted, and the two sets of data were combined to achieve recognition. The hand landmarks were extracted, the outline was divided into segments for recognition, and testing was performed to verify the performance of the method. The LMC was also used in [13], and the extracted data were converted into an angular function vector by the skeleton module. Through this process, skeleton data were obtained, and two types of Infrared Radiation (IR) images were captured to collect three types of data. The skeleton module extracted the angular features of the skeleton data, while the visual features were extracted from the IR images using a CNN. In this study, two types of functions were combined with a neural network to predict the final recognition. In [14], a virtual 3D manual model was developed by recognizing and tracking a user’s hand through the LMC. Using this model, an application programming interface provided the positions of the hands and fingers in 3D space. Additionally, using data from the LMC and hidden Markov classification algorithms, a system for machine learning was proposed, and this system was used for sign language recognition.
2.3 A Study Using Deep Learning
The most actively researched hand recognition methods involve using CNN and deep learning techniques, which sole use the images of the collected data. This method is particularly advantageous because image recognition can be performed solely through computation of images, and no additional equipment is required. Furthermore, it is a deep learning model widely used for speech recognition [15] as well as images. It can be applied to a classification model by providing a fully connected layer that enables classification through feature extraction of the learning data using convolution and pooling. Several algorithms (AlexNet [16], VGG [17], and ResNet [18]) have been developed based on the CNN algorithm developed by Lecun [19]. Additionally, Sun et al. [20] modified the existing CNN model and performed vehicle-type classification using depthwise separable convolution. Thus, CNN deep learning models and their derived models are widely used to achieve faster and more accurate classification. Moreover, to improve the accuracy of recognition and classification techniques, using CNNs, the cluster concept, that is unsupervised learning [21], has also been employed.
Research has also been conducted using different approaches for the recognition of finger shapes obtained from [22–28]. In [22], datasets comprising finger spelling clips of an ASL video presented online on YouTube, aliszed.org, and deafvideo.tv platforms were collected. In these images, only the hand area was detected, and learning was performed using CNN and long short-term memory (LSTM). Subsequently, testing was performed using a classifier based on the connectionist temporal classification. In [23], real-time recognition of ASL signals was performed using an LMC. By applying a recurrent neural network (RNN)-based k-nearest neighbor (KNN) method, data were collected by extracting the positions, angles, and distances between fingers. In the actual recognition, the LSTM method was applied, and 26 letters of the letters were cross-validated to compare the accuracy of each class. In [24], to extract the hand region exclusively from the entire area of the captured images, the hand region was solely extracted by applying region of interest (ROI) and finger segmentation to segment the region of interest and fingers. Subsequently, through the normalization of segmented finger images, a CNN classifier was used to recognize hand motion. Accordingly, deep learning has been applied to hand motion detection and recognition methods to achieve a high recognition performance. In [25], based on data obtained from the leap motion sensors, 60 sign language signals were classified using the LSTM method. In this study, data augmentation techniques and kinematic models of the forearm, hands, fingers, and thumb were adopted. It was demonstrated that the solution proposed in [25] was suitable for sign language recognition using depth sensor data by integrating a convolution layer with a deep learning model. In [26], a 3D camera sensor was used to collect fingerspelling data of letters and arabic numerals, and a CNN was applied for learning. Regardless of validation, various hyperparameters were tuned to employ different learning compositions and their accuracy was compared. In [27], a sliding window approach was adopted to propose a hierarchical structure that facilitates the efficient online operation of the CNN architecture for offline tasks. Two types of architectures were proposed and the levenshtein distance was employed as an evaluation metric. Publicly available datasets, including ego gestures and NVIDIA dynamic hand gestures, were used to verify their performance and compare their accuracies. In [28], the hand gestures detected through the single shot multibox detection (SSD) method were translated and classified using deep learning techniques based on inception and a support vector machine (SVM); the results were then comparatively analyzed. The proposed system was developed to improve the information communication among people with hearing loss and speech impairment. In a recent study [29] a new dataset, called the American sign language alphabet (ASLA), was created by considering various conditions, such as lighting and distance, and letter finger images were classified using a CNN. The authors demonstrated by using the ASLA dataset, their system can achieve a higher performance than previous studies that used different datasets. However, all the trained and tested datasets were composed of white shapes and black background images.
As described above, the methods for processing finger images can be largely classified into sensor-based, skeleton-based, and image-processing methods that use video streams of only the fingers. From these three method types, a meta-learning method that combines clustering and a deep learning method and uses the direction or features of the finger region within an image without requiring additional devices, was proposed in this study. The clustering method has been reported to achieve effective performance in the field of image classification. Reference [30] employed a clustering technique for the classification of images with abnormal patterns in cancerous tissues. Multiple clustered instance learning was proposed through further subdivisions. In this study, the clustering technique was demonstrated to be effective for image classification. In [31], the k-means algorithm was adopted for image classification, and a combination of two algorithms was proposed: one with the laplacian of the gaussian filter and the other with the prewitt filter. Using this novel clustering algorithm, an improved performance was achieved in image classification tasks. In [32], the k-means algorithm was applied for image recognition, and the optimal performance was verified on two scene image datasets. Additionally, optimal repeatability and high classification accuracy were achieved when it was applied to multiclass scene image classification. Furthermore, in [33], it was demonstrated that when a clustering algorithm was applied to determine the similarities between images, the model-based cluster algorithm exhibited better accuracy in some classes compared with the partition-based adaptive k-means algorithm. It is evident from these methods that the clustering algorithm is effective and exhibits high accuracy in pattern recognition.
In this study, the features of finger images are used to cluster and subdivide similar shapes, and a deep learning technology is adopted for feature extraction to classify the images of all letters. Accordingly, three different learning models that combine clustering with deep learning techniques are presented, and after comparing the performances of the models, a final model is selected and the implications of the results are analyzed. In the proposed method, an algorithm that performs hand-shape recognition through meta-learning using a conventional deep learning method and image clustering is proposed. The recognition success rate was evaluated by clustering and classifying photos of similar hand-shapes, and the recognition accuracy of the finger shapes was evaluated by adopting different meta-learning combinations.
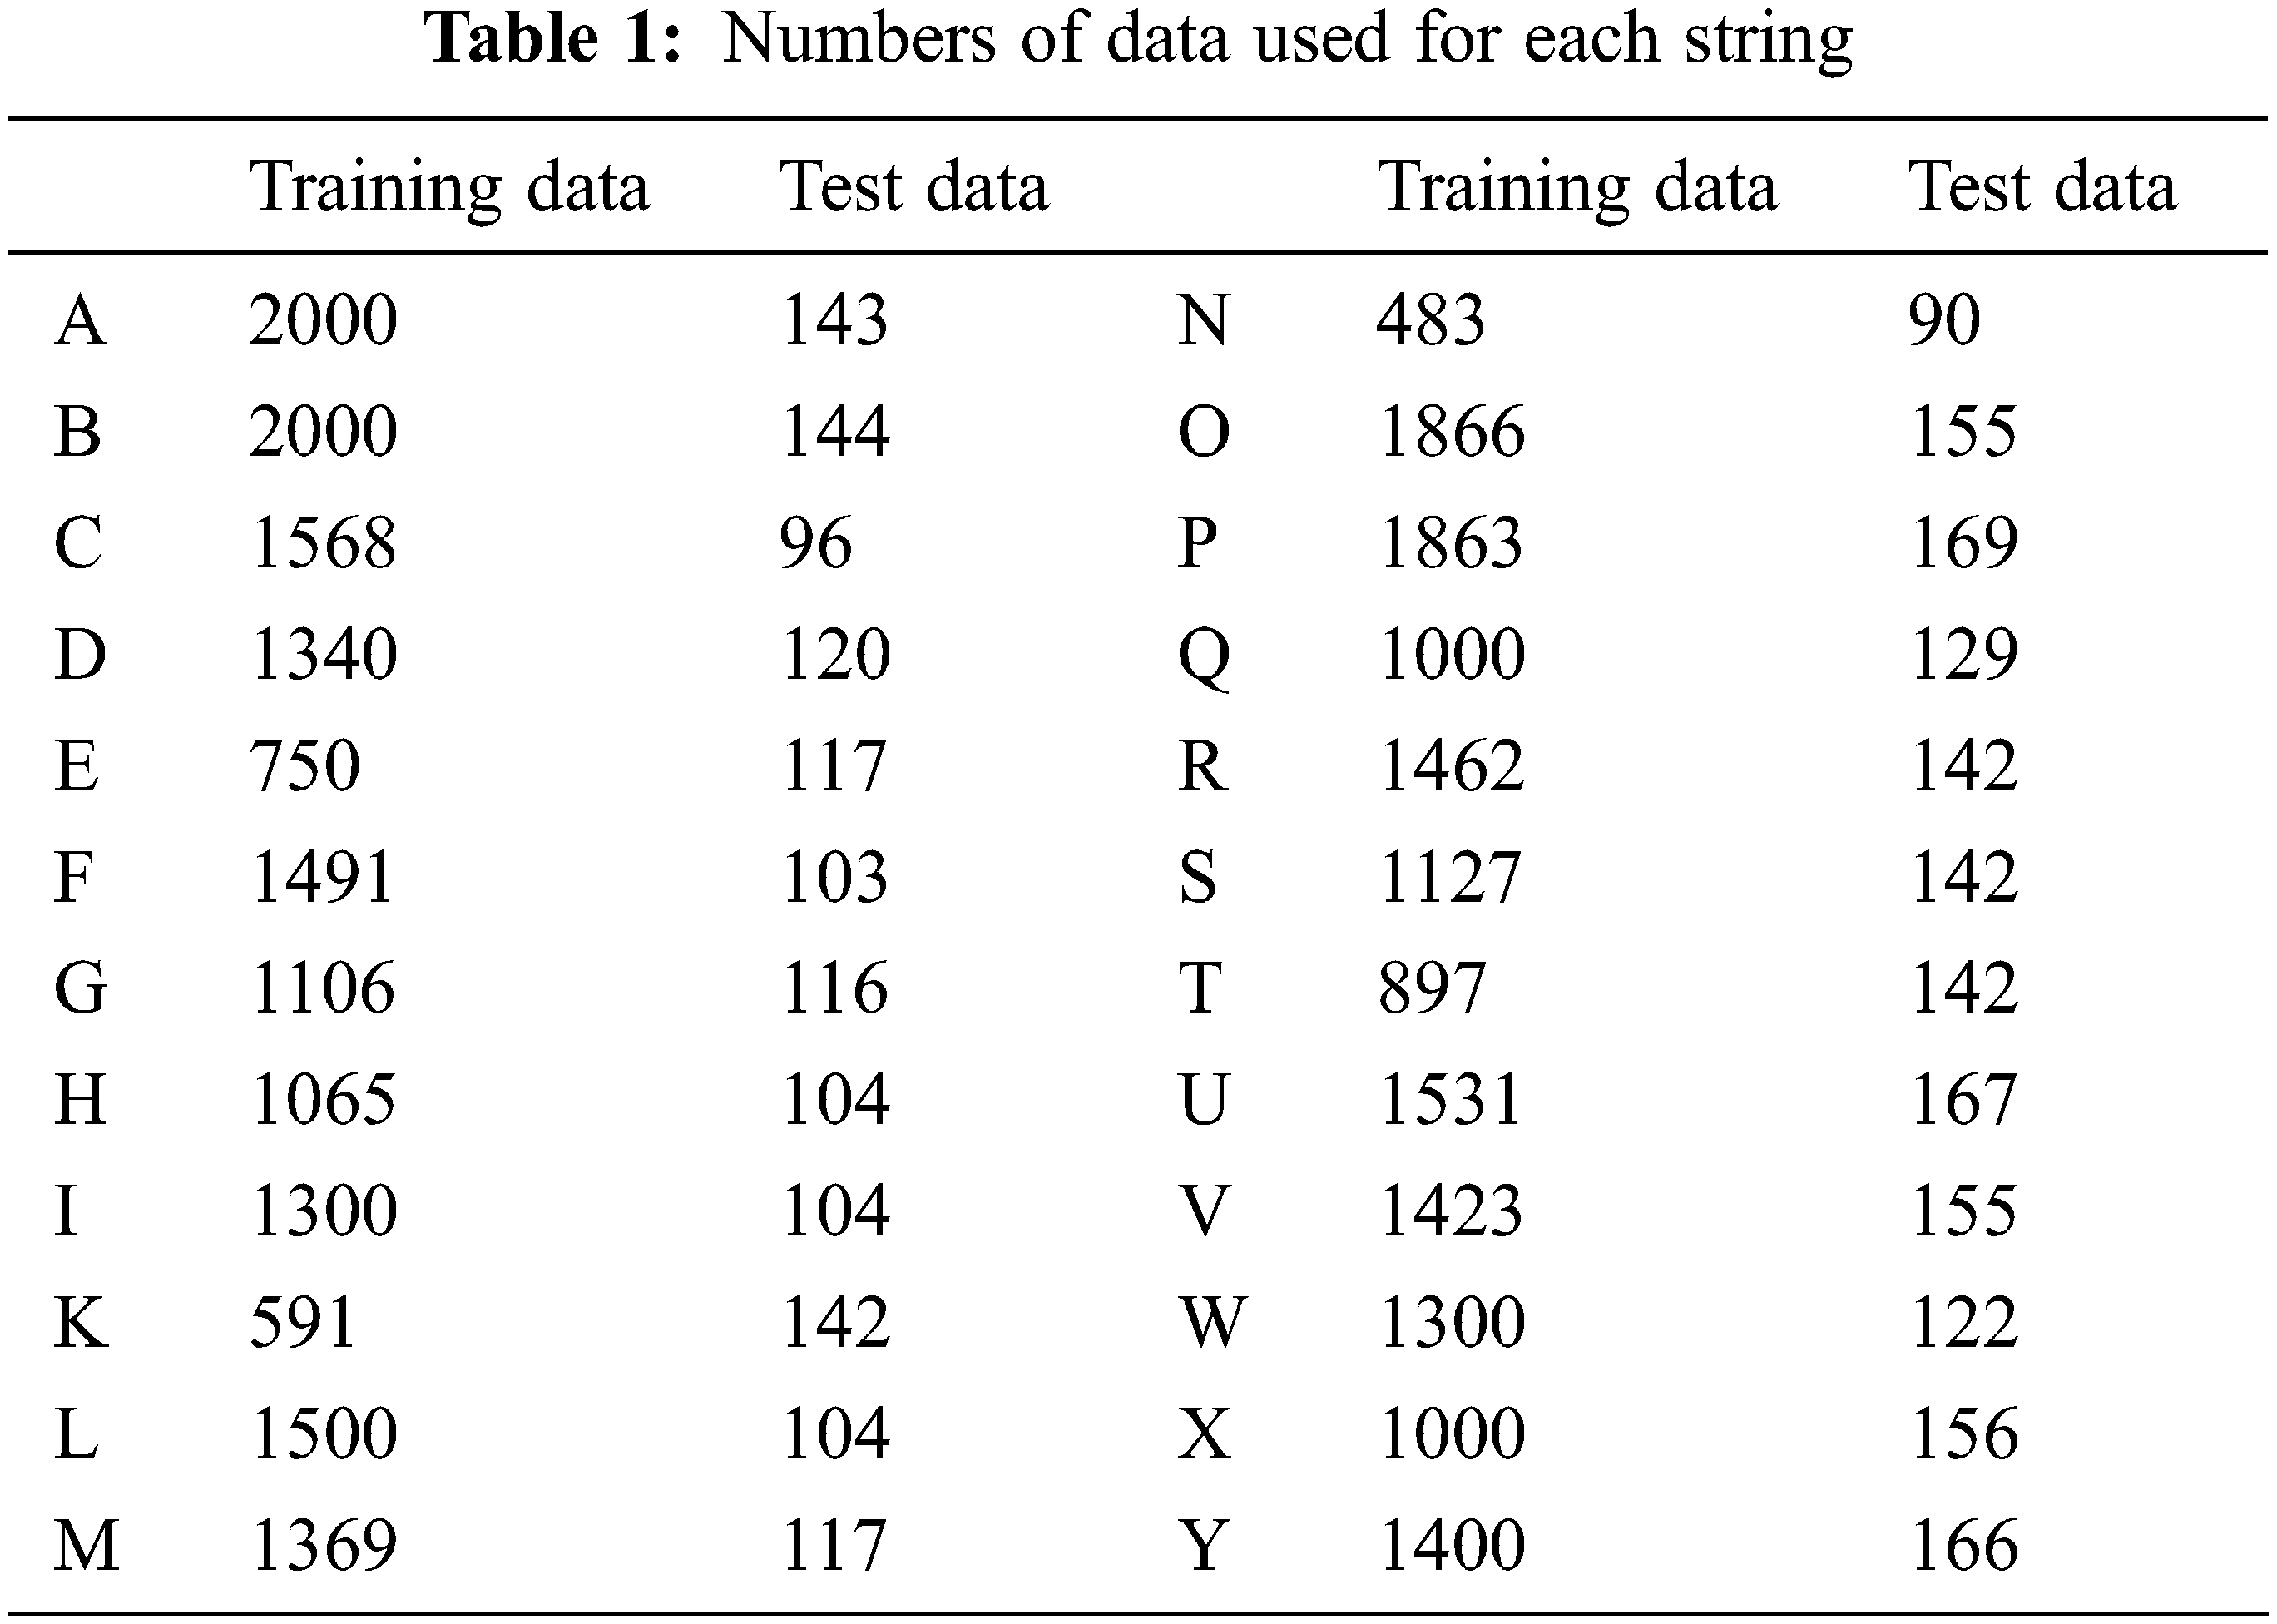
For the image data adopted in the study, 24 categories were used for letters from A to Z, except J and Z, which are characters that already contain the element of motion in the character expression. The total number of data points used was 30,132, including photos collected from [https://www.kaggle.com] and those obtained in various backgrounds. The images collected from kaggle were primarily consecutive photos taken at the same spot, and they comprised similar or monotonous background colors. Moreover, most of them were 64 × 64 pixels in size. Because studies based on kaggle images have similar backgrounds for both training and test sets, data were collected independently to minimize the possible problem posed by overfitting. Therefore, we collected images with various backgrounds and sizes of 1100 × 1300 pixels. However, during model development, the image sizes were converted to 64 × 64 pixels for use as input data to adopt uniform-sized images for training. Fig. 1 presents images of ASL letters, from A to Z that are expressed using fingers. The meanings of the characters differ based on the number and direction of the unfolding fingers. In Fig. 1, the lines represented by cluster1 (C1) to cluster4 (C4) indicate the clusters classified through the proposed method.
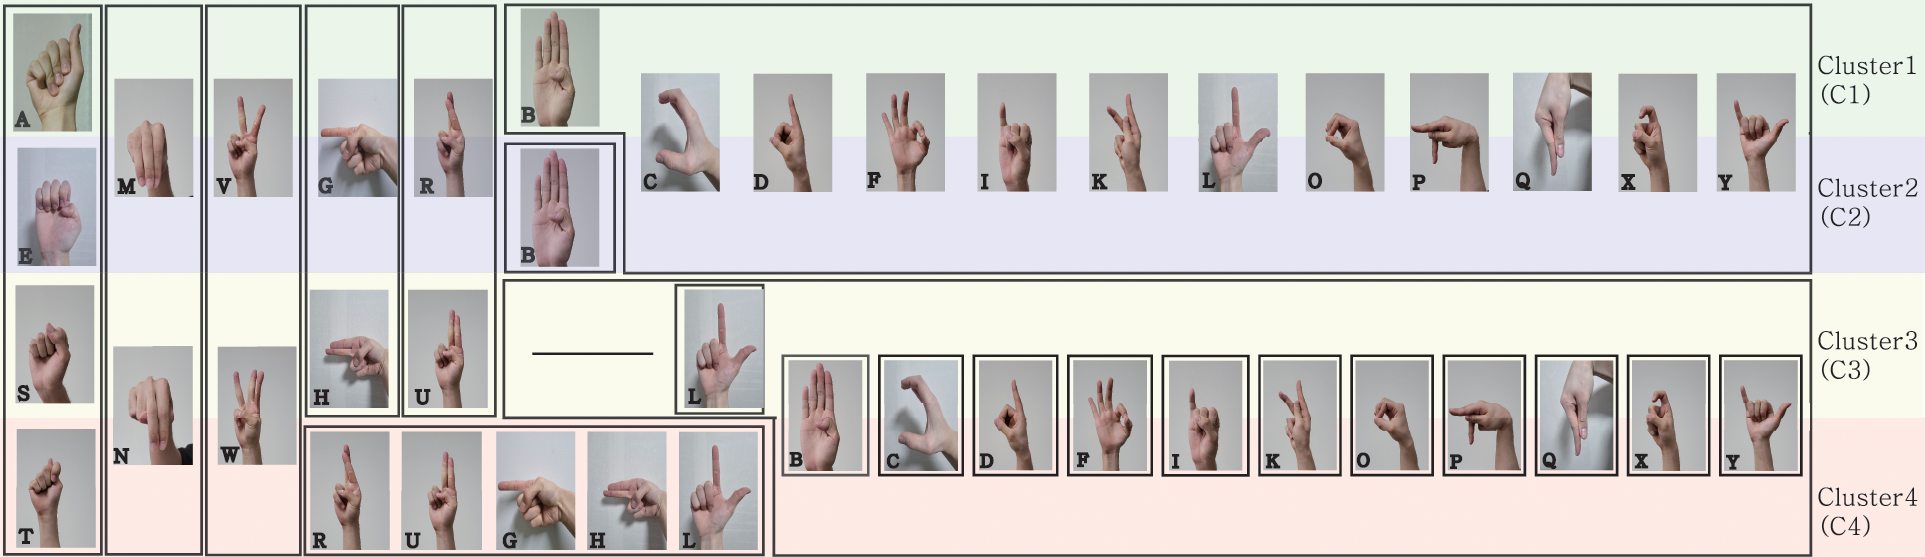
Figure 1: ASL examples from A to Z (except J and Z) and trained groups. The groups in each cluster are classified according to the unfolding degree of the fingers and the shape of the palm. The groups are denoted by the solid line (e.g., The letters A, E, S, T are in the same group.)
Owing to the insufficient amount of data, apart from the data collected from kaggle and photos taken by us, the image data were augmented using an image generator with various background images that were directly photographed. This is because, with data augmentation, the problems of overfitting and data imbalance owing to the insufficient amount of data can be resolved [34,35]. Among the image generator techniques, rotation was adopted, and to augment the image data, the hand-shape images expressed in each letter were rotated to different shapes. However, the finger shapes expressing R and U can appear similar to those expressing G and H, depending on the rotation direction. When the finger expressing U is rotated 90
In this study, evaluation of three different ASL recognition models was attempted, which are presented in Fig. 2. model 1 is a basic deep learning model that does not use different learning layers, whereas models 2 and 3 are meta-learning models comprising multiple layers. The ASL recognition performance was evaluated through a comparative analysis of the performances of the three different models. First, in the case of model 1, all characters from A to Z were individually trained with a basic deep learning model, and a basic CNN deep learning model with multiple hidden layers and the ResNet model was employed. In the cases of models 2 and 3, a meta-layer learning model primarily comprising two layers was used, as illustrated in Fig. 2. The 1st layer of meta-learning comprises different clusters, as illustrated in C1–C4 in Fig. 1, and this model was employed to examine the accuracy between groups with similar images. In the case of model 2, the model trained for each group was stacked on the 2nd layer for assessment. That is, in the 2nd layer of meta-learning, the individual alphabet letter accuracy was examined based on the similarity between the groups trained in the 1st layer. In the case of model 3, the softmax value of the trained data for each group was compared with a threshold value to determine whether the model trained within a group must be used as the 2nd layer model or the model of all letters, from A–Y must be used. In summary, the difference between models 2 and 3 depends on the similarity of softmax values between groups of images that cannot be classified as the desired image in the 1st layer, based on the results within the group of the 1st layer group. In model 2, the final letter was recognized in the group after determining the group. However, in model 3, for images wherein the group was determined below a certain threshold, it was ascertained that the group could not be verified. Therefore, the final letter was recognized using the maximum softmax value in all letters in the 2nd layer. The following subsections comprehensively discuss the characteristics of the three different models for a comparative analysis.
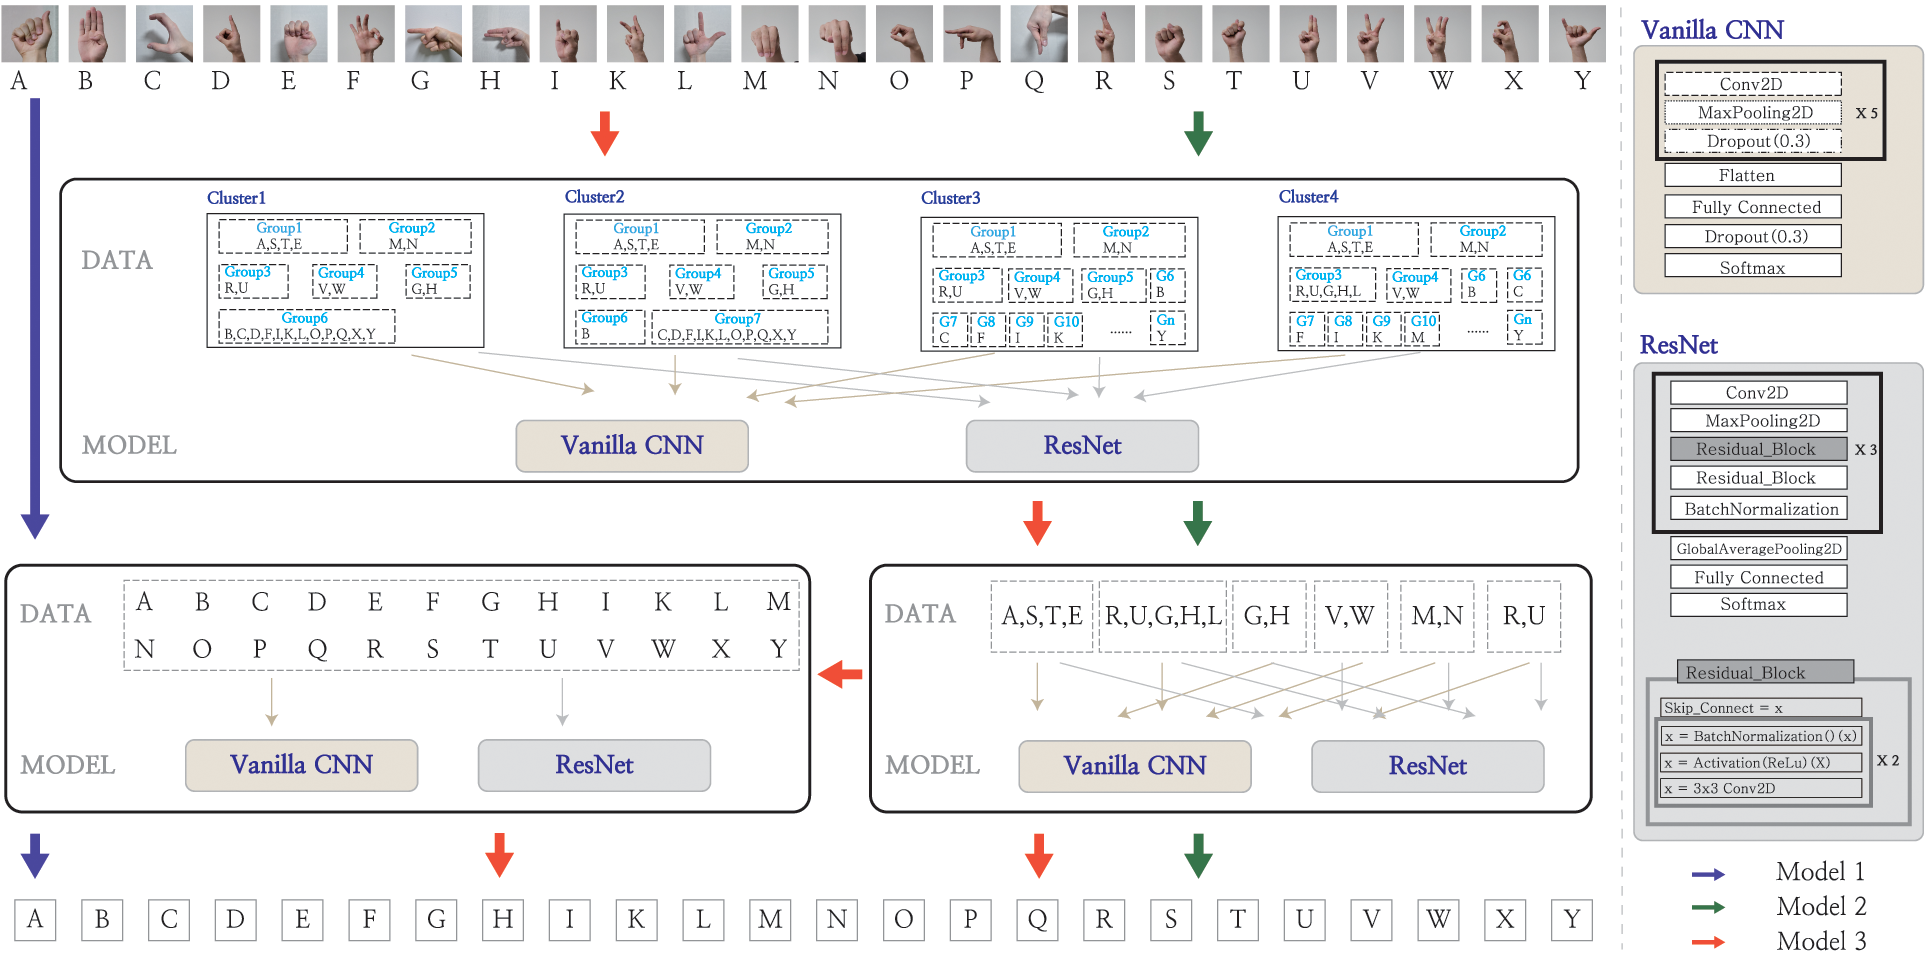
Figure 2: Schematic diagrams of the three models
3.4 Model 1 - Individual Learning Model for All Letters
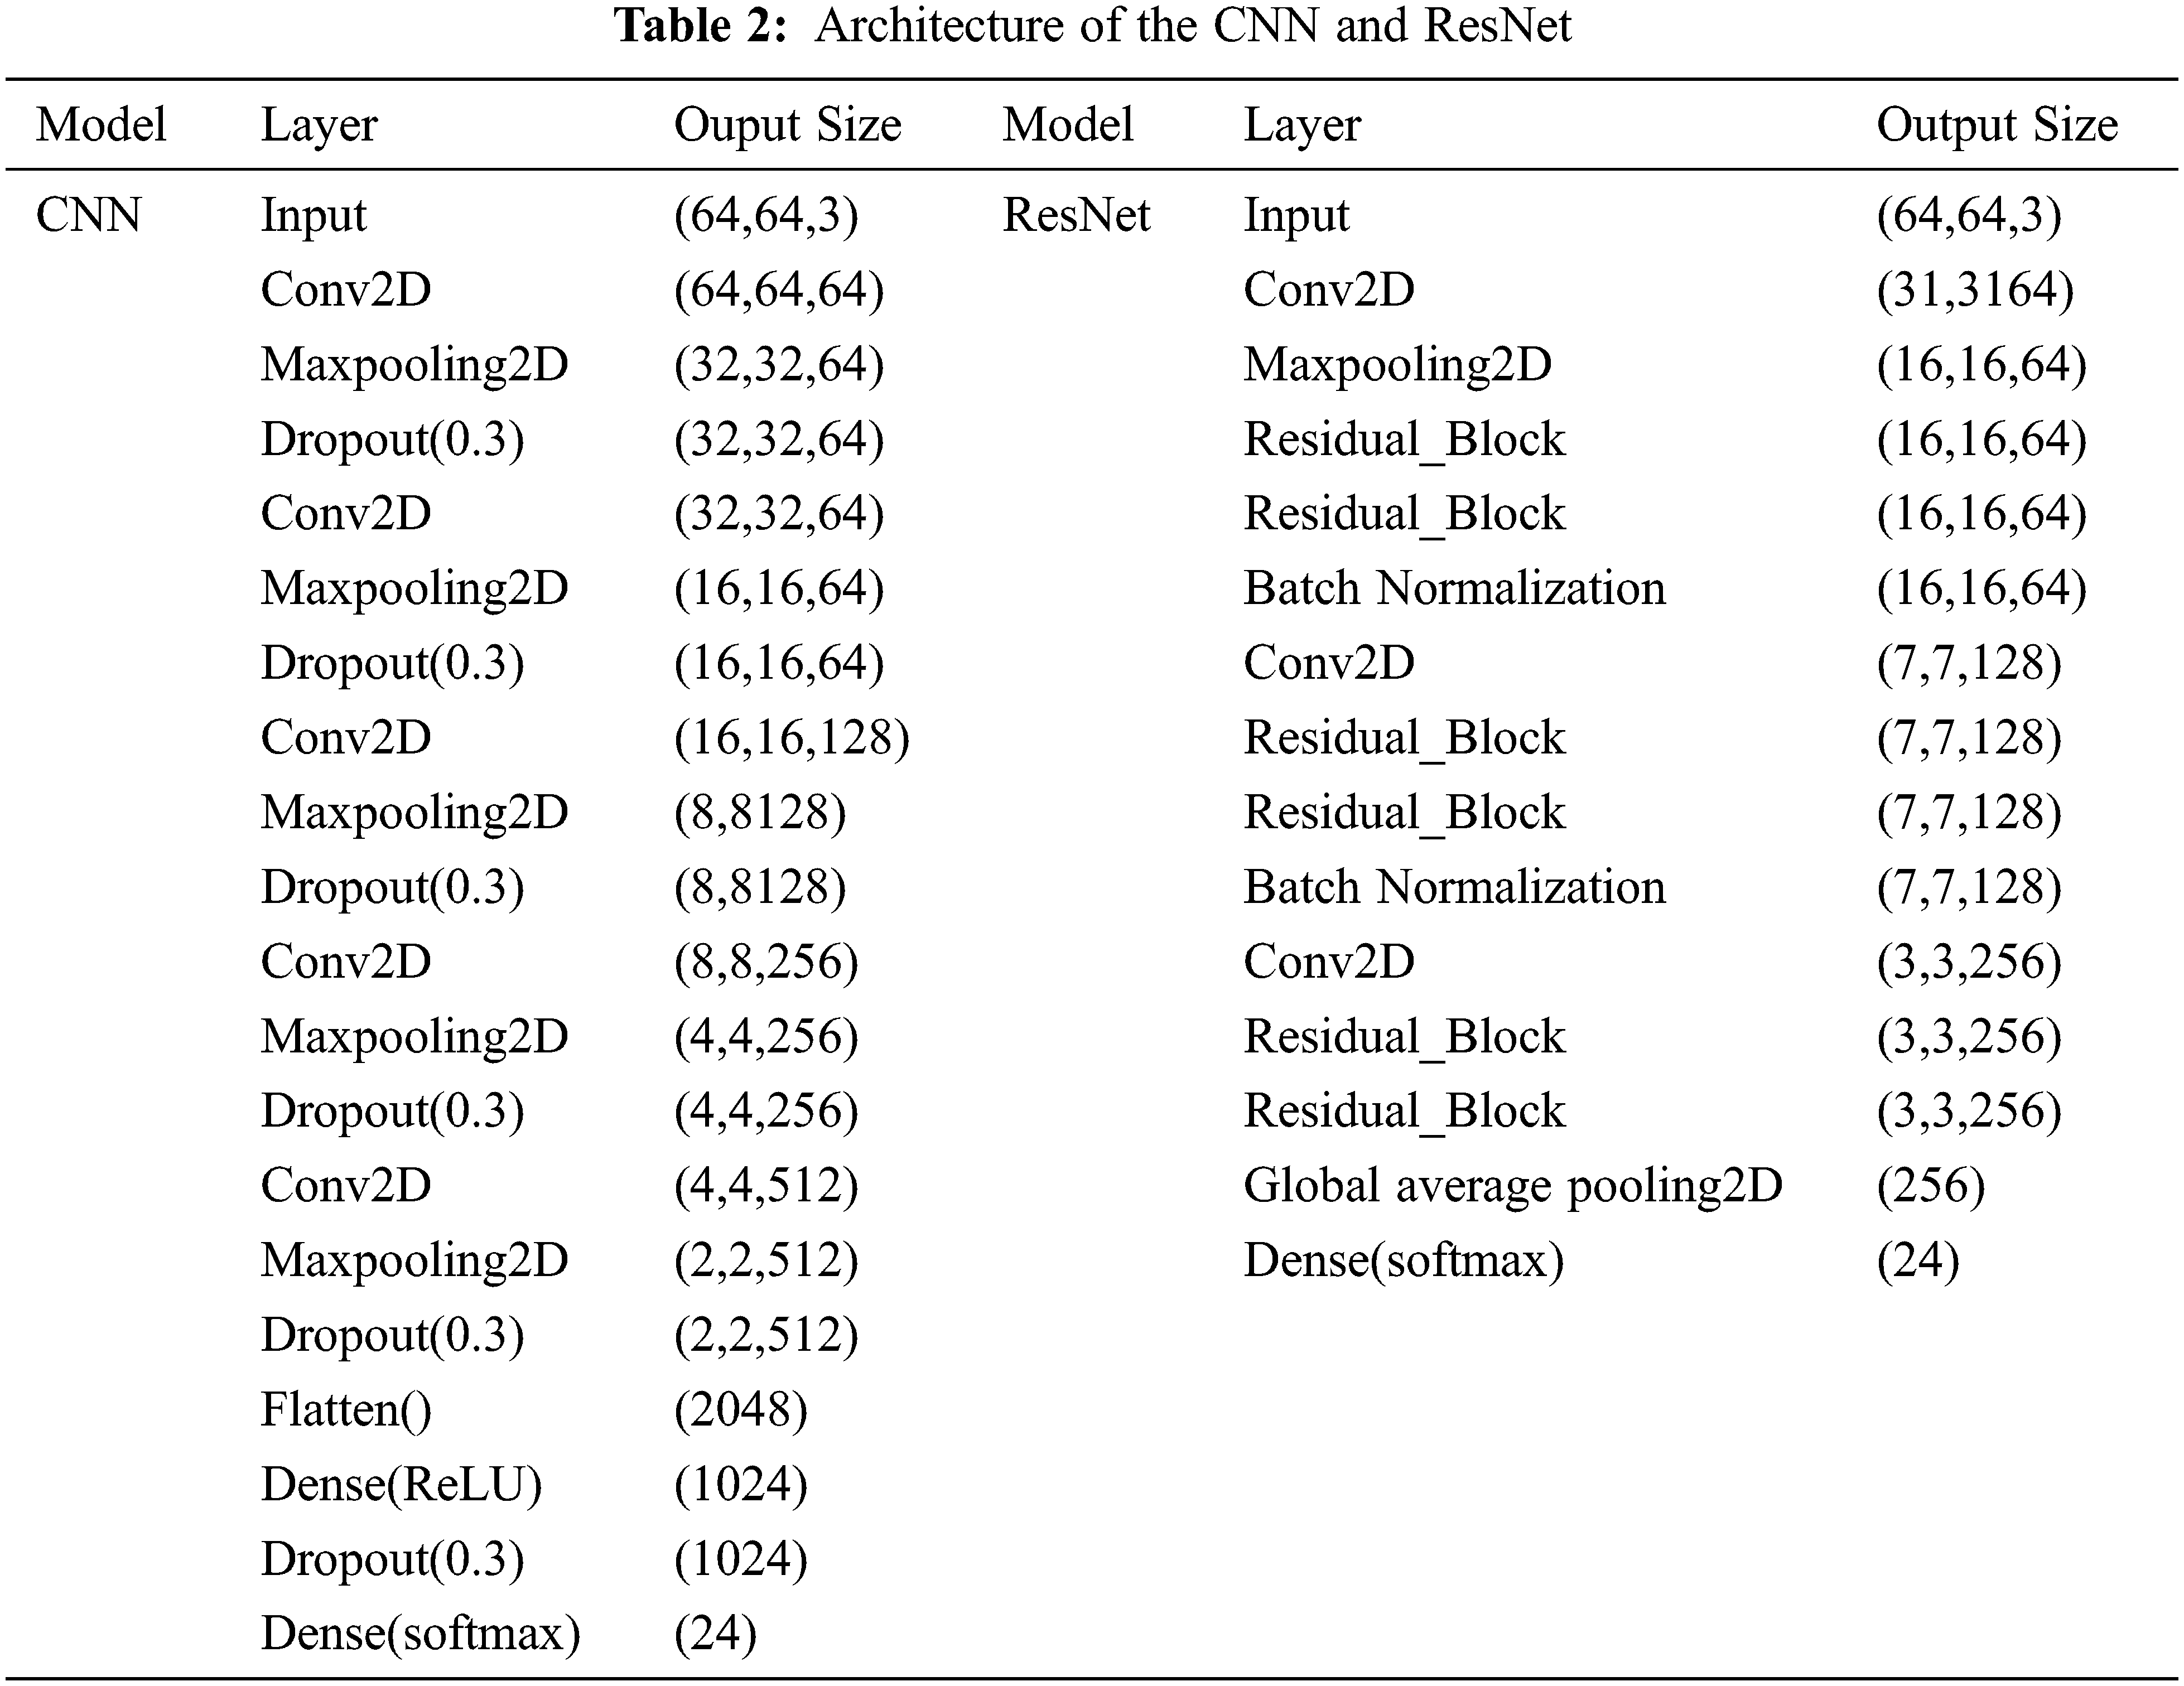
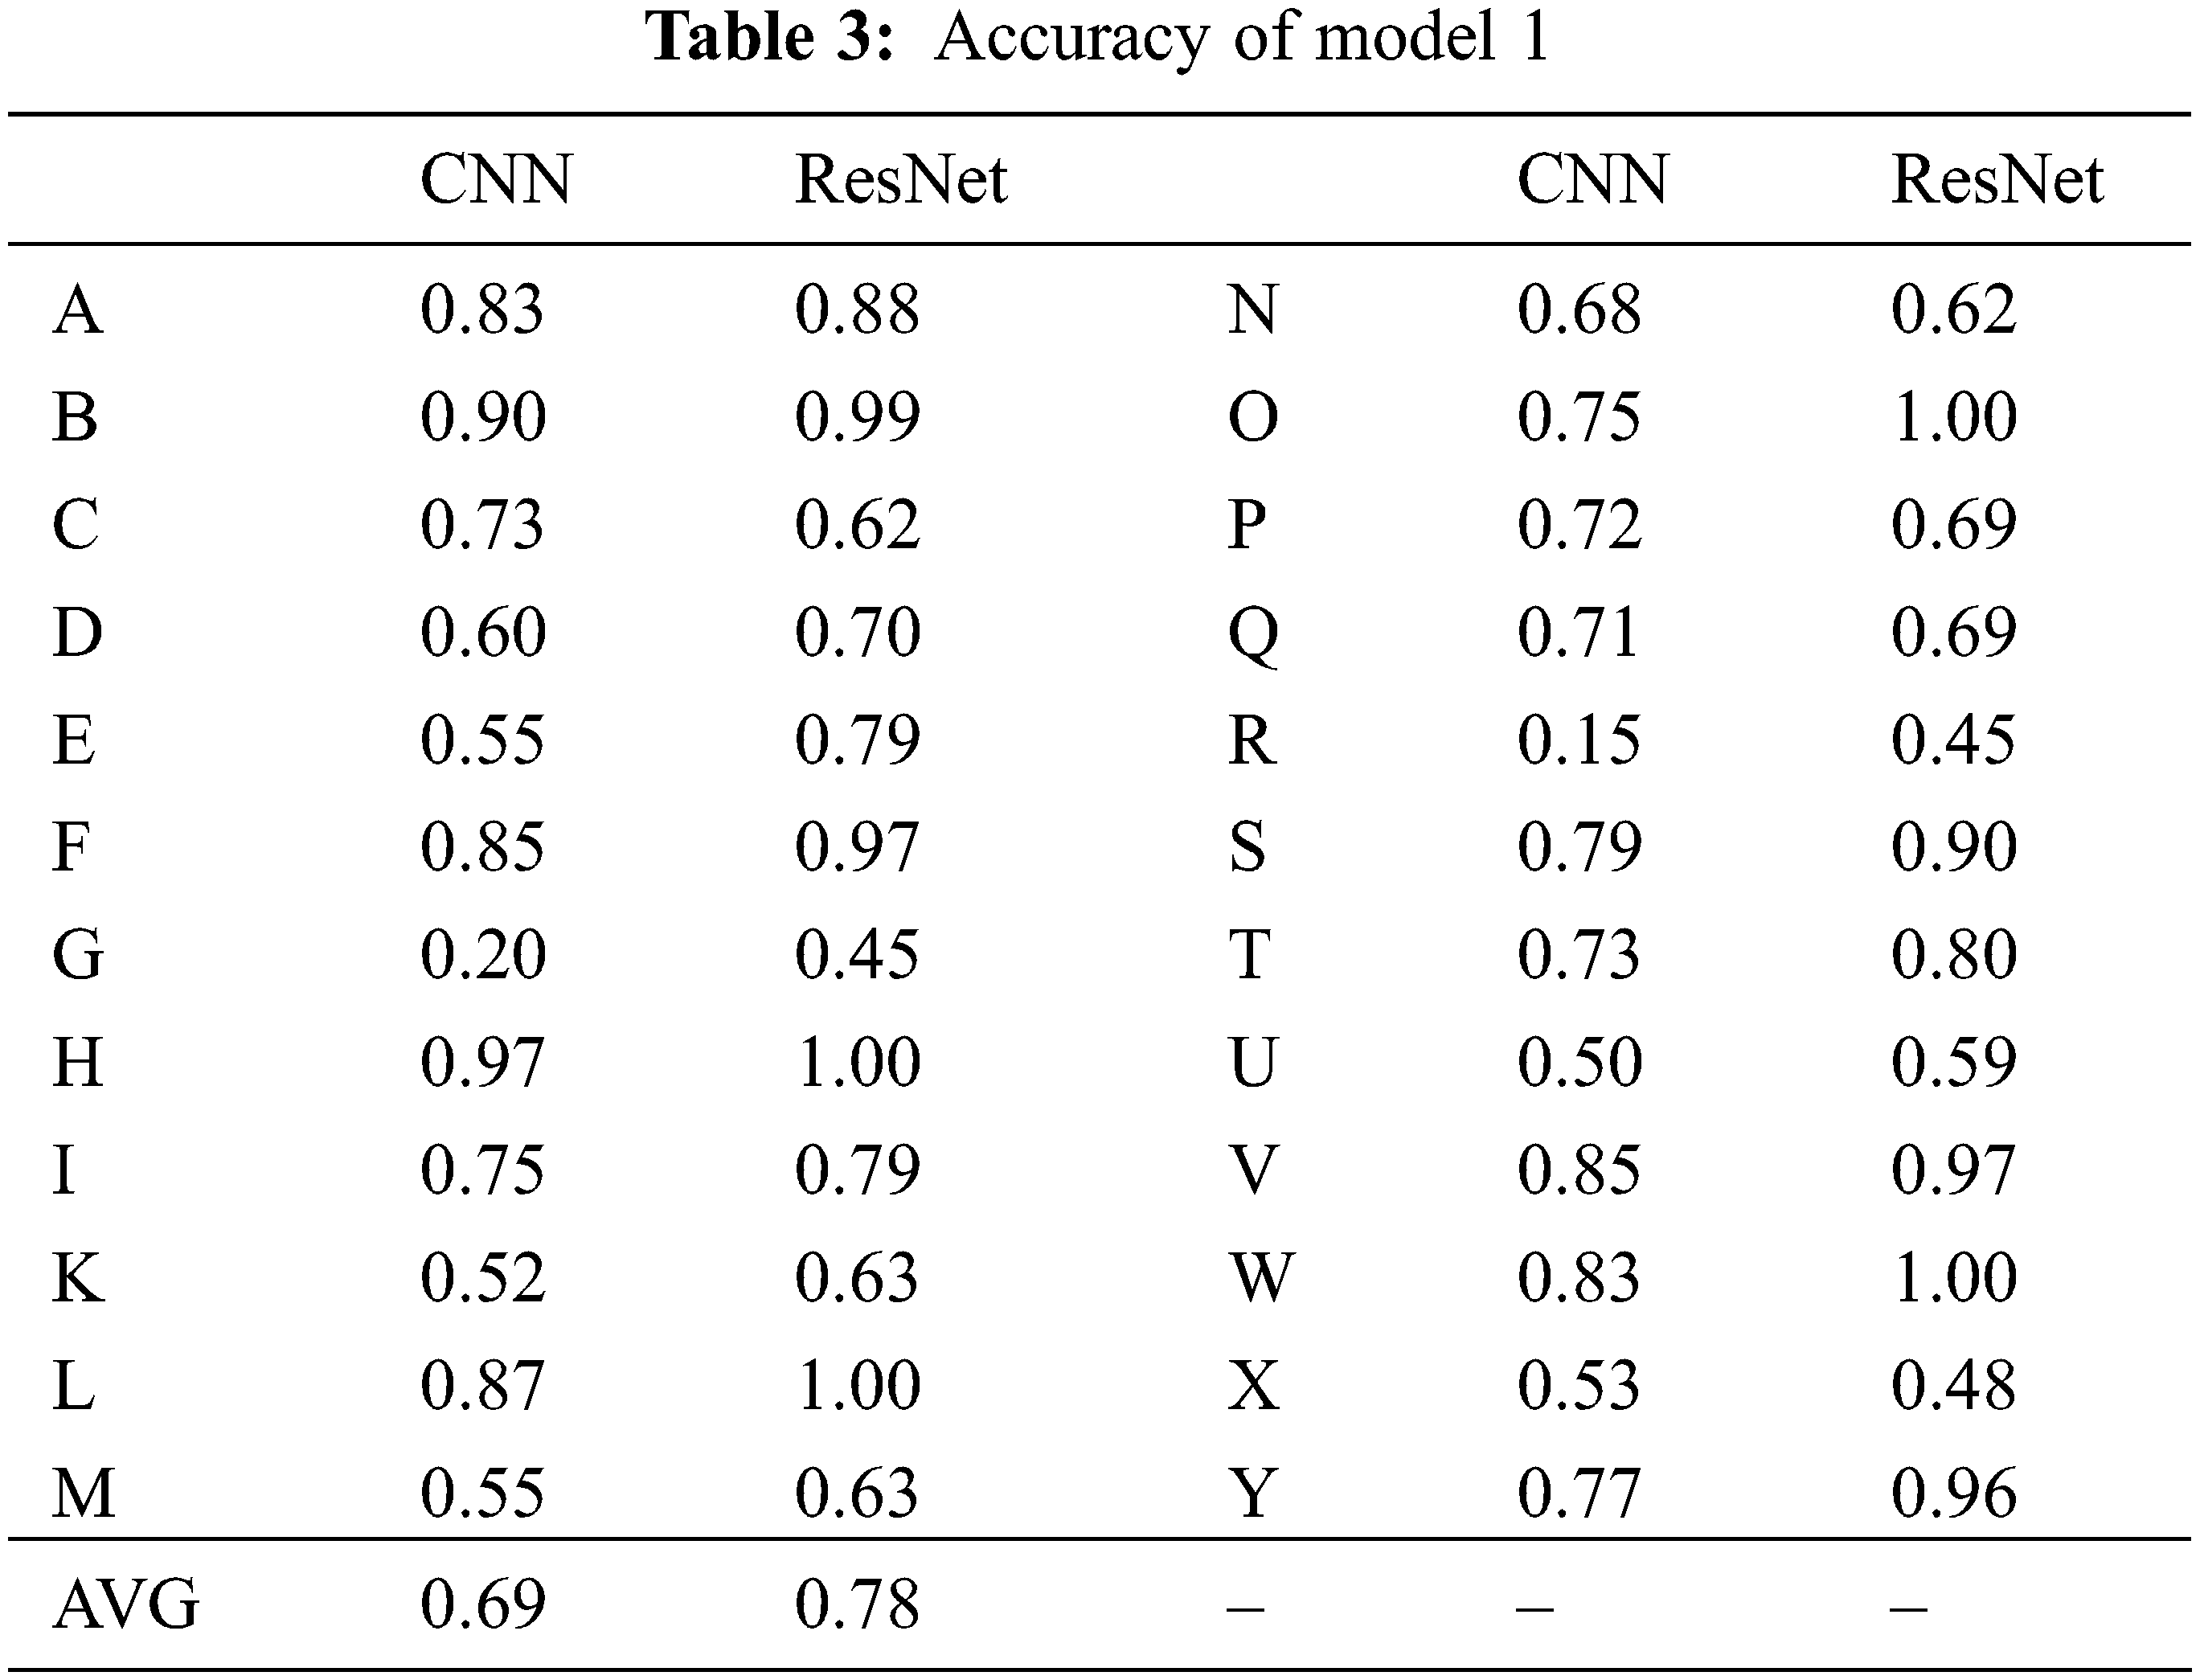
Model 1 was developed based on basic deep learning models, and testing was performed with two models, using a vanilla CNN and ResNet. As presented in Tab. 2, in model 1, the input data that were resized to 64 × 64 pixels were classified into 24 categories, from A to Z, using a vanilla CNN. The model was trained using AlexNet [16]; five convolution layers, max pooling, and dropout were applied; and a fully connected layer was included. In the 1st layer of the deep-learning, which was a hidden layer, convolution was performed with the input images using a 3 × 3 filter kernel. To prevent size reduction of the feature map owing to convolution, padding was set to “same” and ReLU was applied as the activation function. Thereafter, 2 × 2 max pooling was executed, and the dropout rate was set to 0.3 to prevent overfitting. Dropout was only applied during training, and all neurons were used during testing. Subsequently, convolution, ReLU, and dropout were applied five times for the connected layers using the same settings as those applied in the previous layer. Flattened and fully connected layers were used for the 16th and 17th layers, and their output value was activated using the ReLU function. Thereafter, dropout was applied again to prevent overfitting. The softmax function was applied to the output value of the neuron to indicate the probability of it being classified into one of the 24 classes. The second proposed method of model 1 performs training with the same data by including the ResNet method (Tab. 2). Six residual blocks were applied to the layer, and each block represented a layer containing batch normalization and ReLU functions: Conv2D, batch normalization, ReLU, and Conv2D. With these six blocks applied, the size of the input data was set to 64 × 64, which is similar to the method described above. Using Conv2D and max pooling, two residual layers were stacked, and batch normalization was applied again. From Conv2D, a batch normalization block was stacked again, and global average pooling, which is a characteristic of the ResNet, was finally applied. The probability of being classified into each of the 24 classes was then expressed using softmax for the output value. Therefore, as expressed in Eq. (1), for both the model with basic CNN of model 1 applied and the model with the ResNet applied, the sum of the softmax values of each letter becomes “1”, where l is the number of all trained letters.
3.5 Models 2 and 3 - Meta-Learning
3.5.1 Composition of the 1st Layer Data in Models 2 and 3
As represented by the red and green arrows in Fig. 2, models 2 and 3 contain two layers for the learning model. In the 1st layer, four different clusters are formed, and each cluster is divided into several groups. As illustrated in Fig. 1, a cluster is a set of groups composed of several letter shapes. In this study, four different clusters were created to evaluate performance. For the hand-shape image data utilized within the cluster groups, in Fig. 1 were used to represent the clusters C1–C4 and the most distinctively differentiated groups were “A, E, S, T”, “M, N”, “R, U” and “G, H”. All letters in the group “A, E, S, T” resemble a clenched fist. Different letters can be distinguished by the difference in the position of the thumb and degree of palm coverage. For letters in the “M, N” group, the index, middle, and ring fingers face the front of the image; however, they can be differentiated based on the number of unfolded fingers. The letters in the group “R, U” are differentiated between “R” and “U” based on the unfolding of the index and middle fingers. Compared to the “R, U” group, the “G, H” group contains similar numbers of unfolded middle and index fingers; however, the unfolding direction differs. For the remaining letters, no feature could be easily identified visually; therefore, each letter was treated as a group, or all letters were trained independently. The number of letters per group in a cluster can be expressed by Eq. (2). Each cluster can be divided into n groups, and the number of letters in each group can be expressed as m. In other words, n indicates the number of groups in each cluster. Therefore, in Fig. 2, the n values are 6, 7, 17 and 15 for C1, C2, C3 and C4 respectively. m denotes the number of letters in each group. Thus, in the case of the first group (i = 1) in C1, the group comprises the letters “A, S, T, E;” hence, m
As illustrated in Fig. 1, there are four clusters in total. C1 is divided into six groups which are colored by the green box: G1, G2, G3, G4, G5, and G6, and each group in the cluster comprises different letters in each cluster, as shown in the 1st layer of Fig. 2. Regarding C2, C3, and C4, because it was verified in the performance evaluation of the group in C1 that classifying the letter “B” separately improved the performance of each group, it was classified separately as a different group. In C3 and C4, letters that were not manually clustered were unified and divided. In the proposed models 2 and 3, in the 1st layer in Fig. 2, although the images of the letters were not individually trained, they were grouped, and training was conducted between these groups. Therefore, the number of classes for the final classification included the number of groups, denoted as n in Eq. (2).
3.5.2 Model 2 - No Checking of the Softmax Value at the 1st Layer
In Model 2, clustered letter images were trained for each group, and then classified into their respective groups. To evaluate the performance of the groups, four different clusters were combined, and in each group, training was performed using CNN and ResNet models. However, because the composition of the respective group differs for each cluster, the final number of classifiable letters of the model differed for each cluster. After examining the accuracy of each group with the trained data using the trained CNN and ResNet models, each letter was predicted with the index value of the maximum softmax in the group. Therefore, when a group to be classified is determined in the 1st layer of model 2, it is predicted as one of the letters within the group in the 2nd layer, and the prediction accuracy of all alphabet letters depends on the accuracy of the 1st layer. The obtained test results indicate that the performance of C3 was better than that of other clusters; hence, the accuracy of model 2 was comparatively analyzed using only C3–. In Eq. (3), i indicates the number of groups in each cluster and k represents the number of letters belonging to each group. Because the groups in the cluster were used for training, the sum of the softmax for each group in the cluster was 1.
3.5.3 Model 2 - Checking the Softmax Value at the 1st Layer
Model 3 adopted a method similar to model 2; however, the model in the 2nd layer is trained differently, based on the group accuracy obtained in the 1st layer. In model 2, the group was determined in the 1st layer. Because the letters within a group are solely learned on the assumption that the group classification is conducted accurately in the 1st layer, when the first classification is incorrectly performed, the final accuracy of the ASL recognition is reduced. Therefore, in model 3, the 1st layer was classified in the same manner as that in model 2. However, the softmax value for the test results after training in the 1st layer was rechecked. Based on the recheck, if the accuracy of the group decreases, that is, the softmax value is smaller than the set threshold, the group classification results can be considered unreliable. In other words, because the 1st layer learning model inevitably exhibits a low accuracy for group classification in some data, the accuracy is bound to be reduced, regardless of the model adopted as the 2nd layer model. Therefore, when a group was classified with a softmax value below a certain threshold classification was not performed in the 2nd layer based on the letters within the group but was performed for all letters. In other words, when it was determined that the softmax value of the group classification in the 1st layer was less than or equal to the threshold, the model where in all letter images were trained in the 2nd layer was selected as the 2nd layer model. Eq. (4) indicates that the total sum of the softmax values within the group does not become “1” when the softmax value is below the threshold in the 1st layer. For example, consider the case wherein the letter to be tested is “A.” It belongs to the group “A, S, T, E,” which is the first group in the cluster; however, if the softmax value is below a certain threshold in the cluster test between groups, it is uncertain whether the group was correctly classified as the “A, S, T, E” group. Therefore, the 2nd layer was tested with a learning model using all letters from A to Z.
Fig. 3 presents a flowchart using the training and test data for reference model 1, including models 2 and 3, and the proposed models. Model 1, which is indicated by the blue line, performs classification with the basic CNN and ResNet algorithms, and this model serves as the reference model for the comparative evaluation of the performance achieved with models 2 and 3. In model 2, which is depicted by the green dotted lines, in the 1st layer, the learning model was determined by classification into clustered groups. Subsequently, based on the determined cluster group, a test was performed with a learning model within a group for the final determination of the model. In model 3, which is represented by the red dotted lines, in the 1st layer, the test was performed with the learning model between clusters, which is the same as in the case of model 2; however, using the decision symbol, if the softmax value is below a certain threshold, a test is performed using the model trained with all letters, as in model 1, which indicates a difference from model 2. According to the models in the flow chart, for each letter used for testing, test results were derived using different learning models. In Section 5, the performance evaluation of models 1, 2, and 3 is discussed.
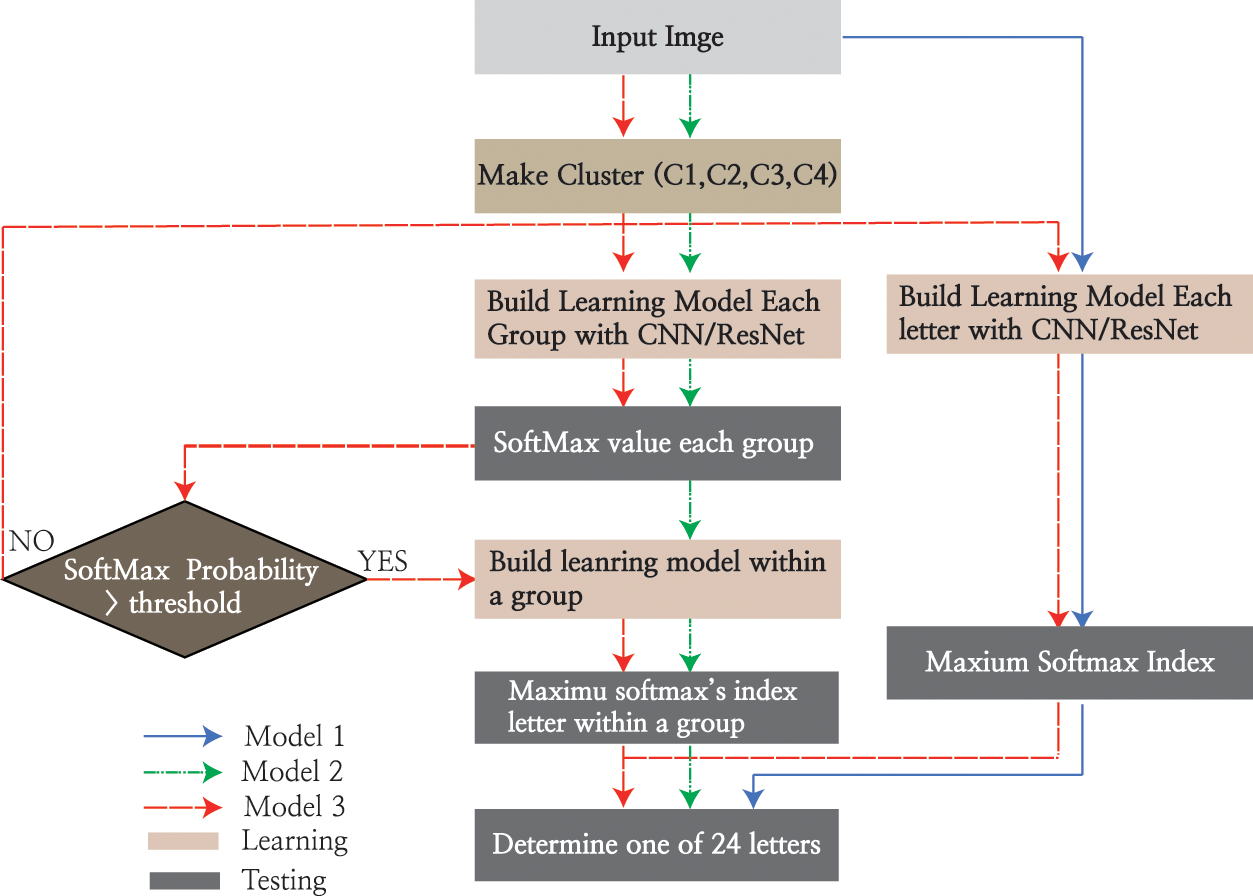
Figure 3: Algorithm flowchart for all models
4.1 Accuracy Comparison of Model 1
Tab. 3 lists the prediction results of the basic image classification model without meta-learning. It indicates the test accuracy for letters from A to Z obtained using the learning models of CNN and ResNet with model 1. The overall average accuracy of the CNN and ResNet models were 0.69 and 0.78, respectively, thereby indicating that the ResNet model exhibited a slightly better performance. Therefore, the ResNet model was adopted as the 1st layer model in the designs of models 2 and 3.
4.2 Comparative Analysis of the Conventional and Proposed Models
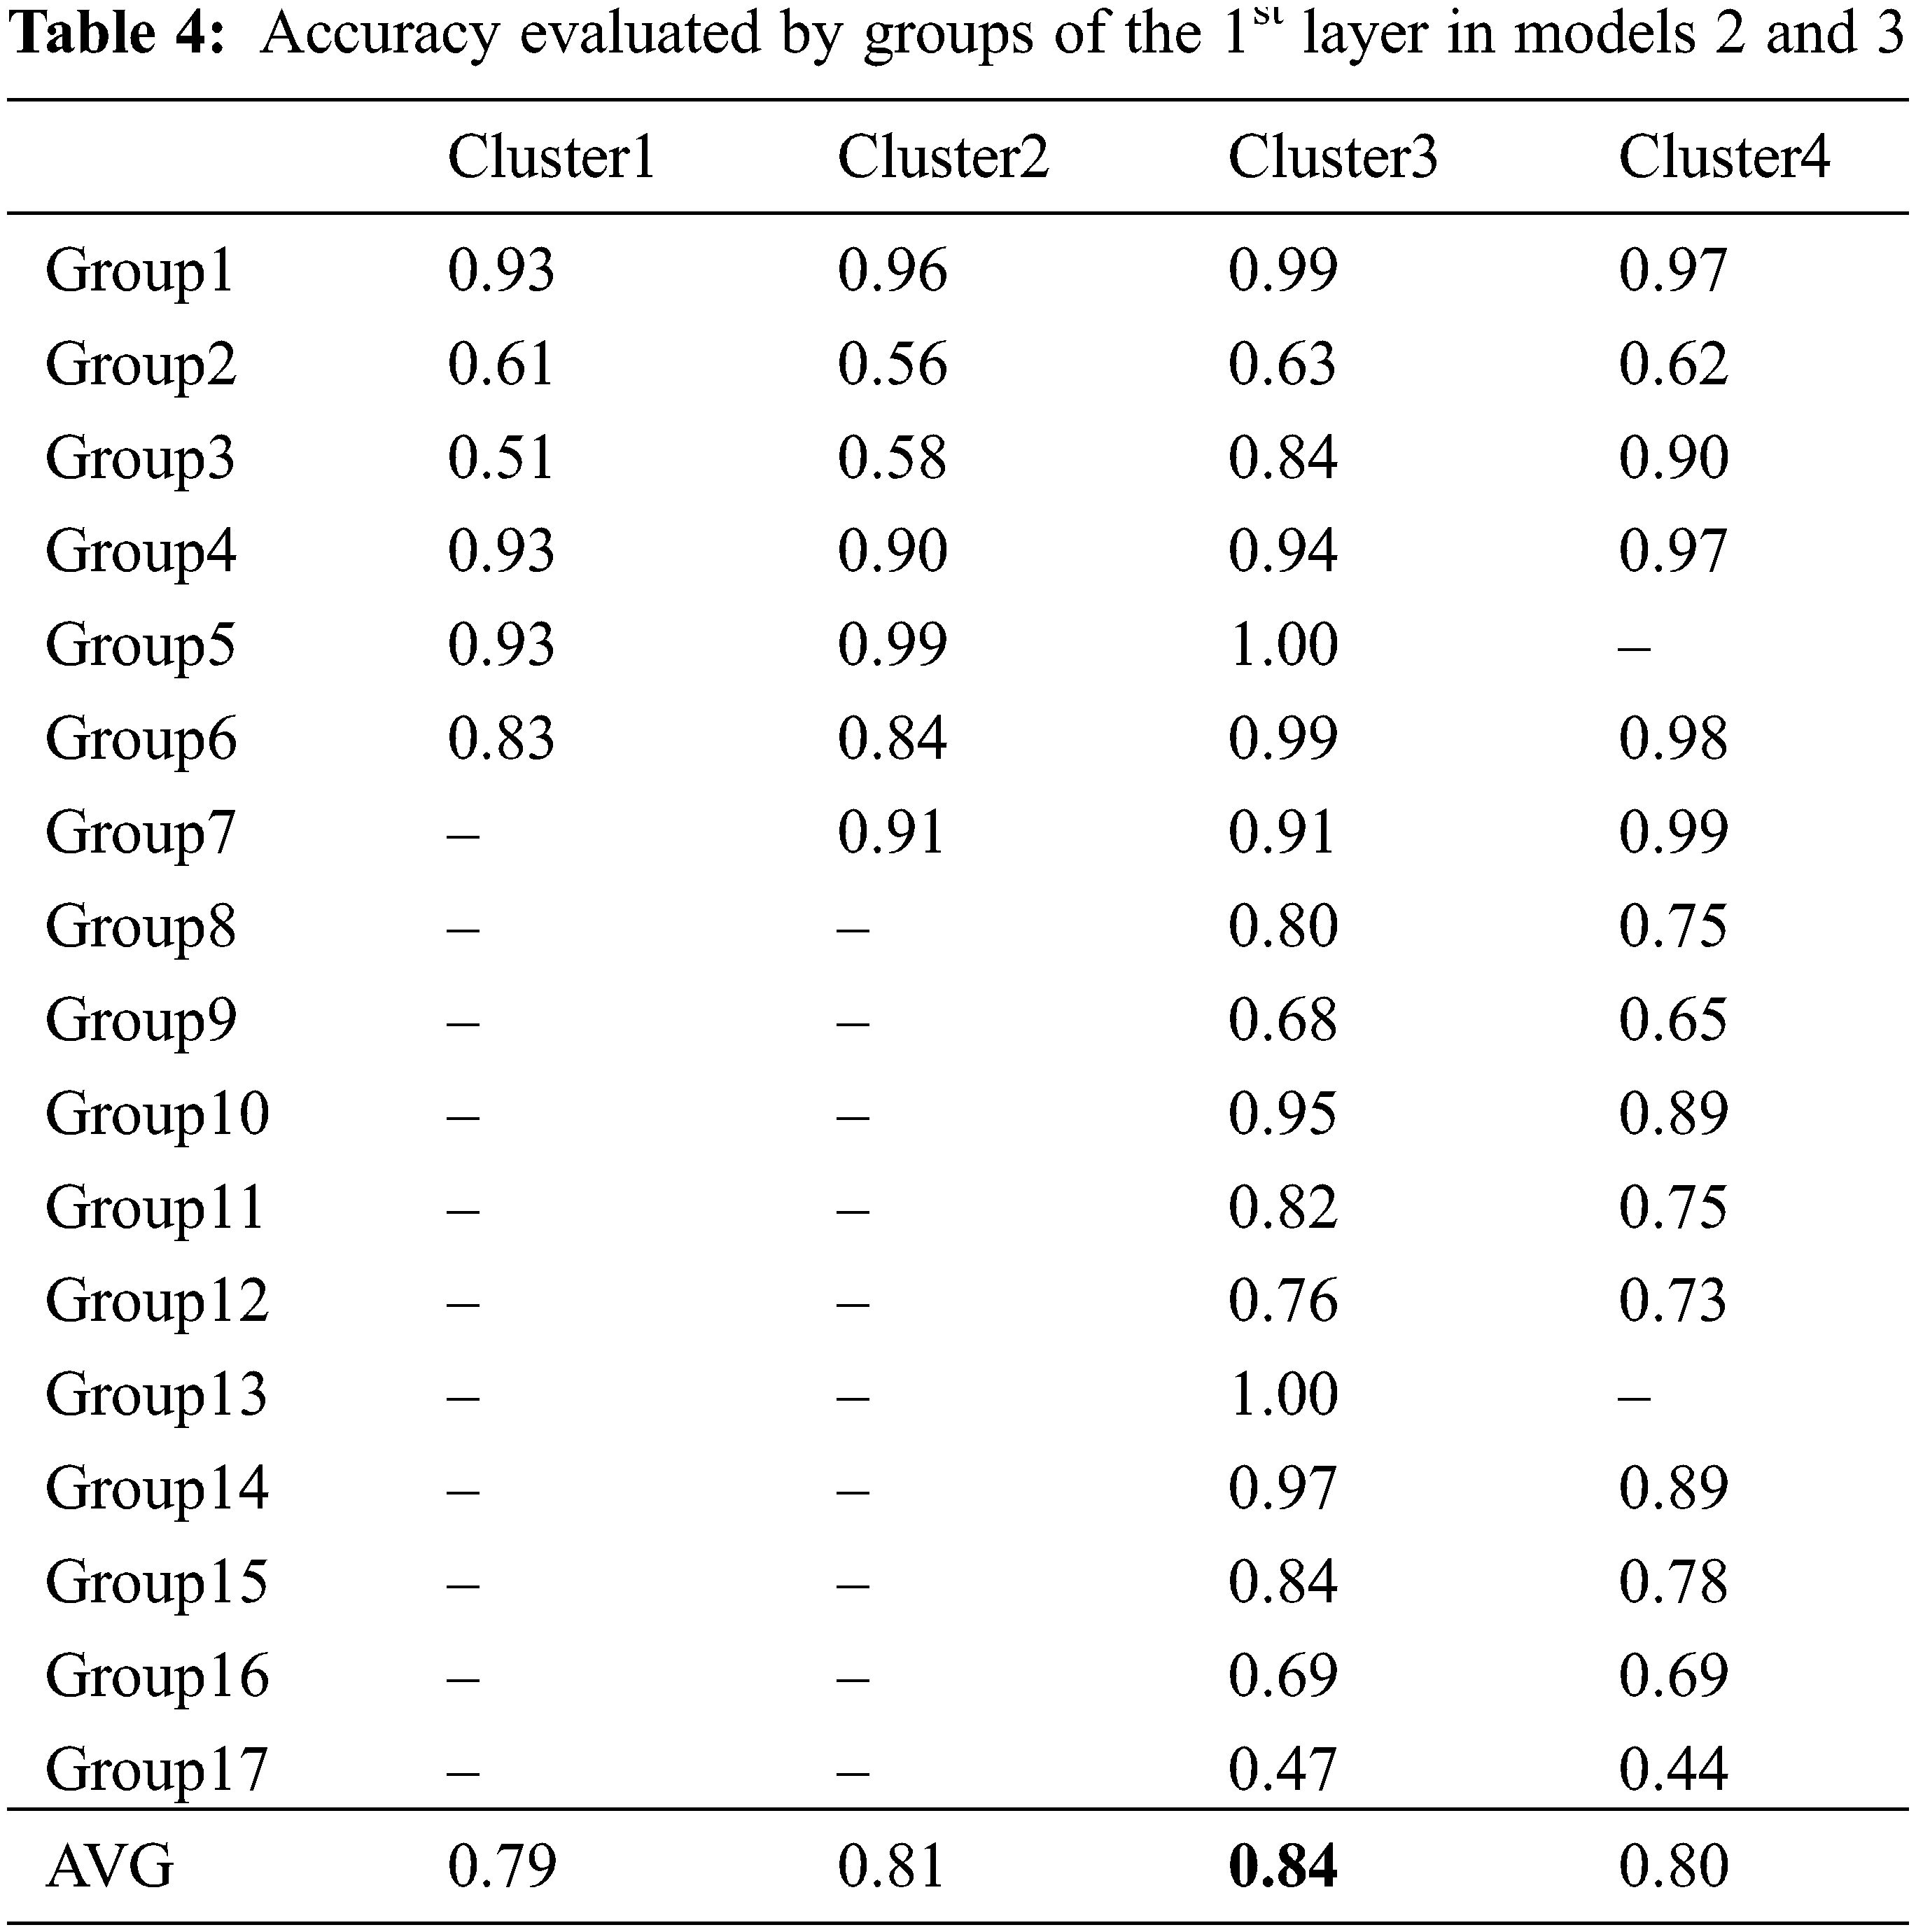
Tab. 4 presents the test results obtained by dividing 24 letters, from A to Z, into 24 categories C1–C4 for the 1st layer tests of models 2 and 3. In other words, the model between the clusters was set as the ResNet model, and the group accuracy between each cluster was evaluated. C1 was divided into the minimum number of groups possible, and for group 2, the letter B, which was not optimally predicted in Group 1, was assigned separately to group 7. For C3 and C4, unlike C1 and C2, all letters were classified into groups, and for C4, the letters R, U, G, H, and L, which correspond to the combination of groups G3, G5, and G13 were classified into one group. The three groups were combined because the letters R, U, G, H, and L express similar hand-shapes, and it was considered that performance could be improved if similar images were clustered into one group. Using the data classified with the test data and performing the test for clusters between groups trained with the ResNet model, the average accuracy values of Clusters 1, 2, 3, and 4 were 0.79, 0.81, 0.84, and 0.80, respectively. Among the four clusters, C3 exhibited a relatively high performance in the test between groups; therefore, in the case of models 2 and 3, the 1st layer was set as C3, and the 2nd layer test was performed.
Tab. 5 presents the results obtained by testing each letter with model 2, using the superior performance of C3, as indicated in the 1st layer in Tab. 5. Although there is a difference in accuracy, depending on the letters, in the case of the reference model 1, the overall average accuracy values of CNN and ResNet were 0.69 and 0.78, respectively; however, in model 2, this was improved to 0.78 and 0.81, respectively, thereby verifying a substantial improvement in accuracy. Similar to the results of model 1, it can be observed that the ResNet model exhibits relatively higher accuracy than the CNN model. Tab. 6 presents the recognition accuracy of each letter for C1–C4 in model 3. In model 2, because the 1st layer affects the accuracy in the 2nd layer, C3 exhibits a higher accuracy than the other clusters; therefore, the 1st layer was fixed to C3 to obtain the results in model 2. However, in model 3, the group classification model of the 1st layer may have had a more significant impact than that of model 2; hence, testing was performed for all clusters. As evident from Tab. 6, the combination with the highest accuracy was setting the 1st layer as C2 and using the ResNet model for learning. Finally, with the same test set presented in Tab. 1, an accuracy of 0.86 was obtained for model 3. Fig. 4 presents the overall average accuracies for models 1, 2, and 3. It is evident that the overall average accuracies of models 2 and 3 are higher than that of model 1, which employs basic ANN techniques for image classification. Furthermore, among all the models, the ResNet model exhibited better performance than the CNN in image classification.
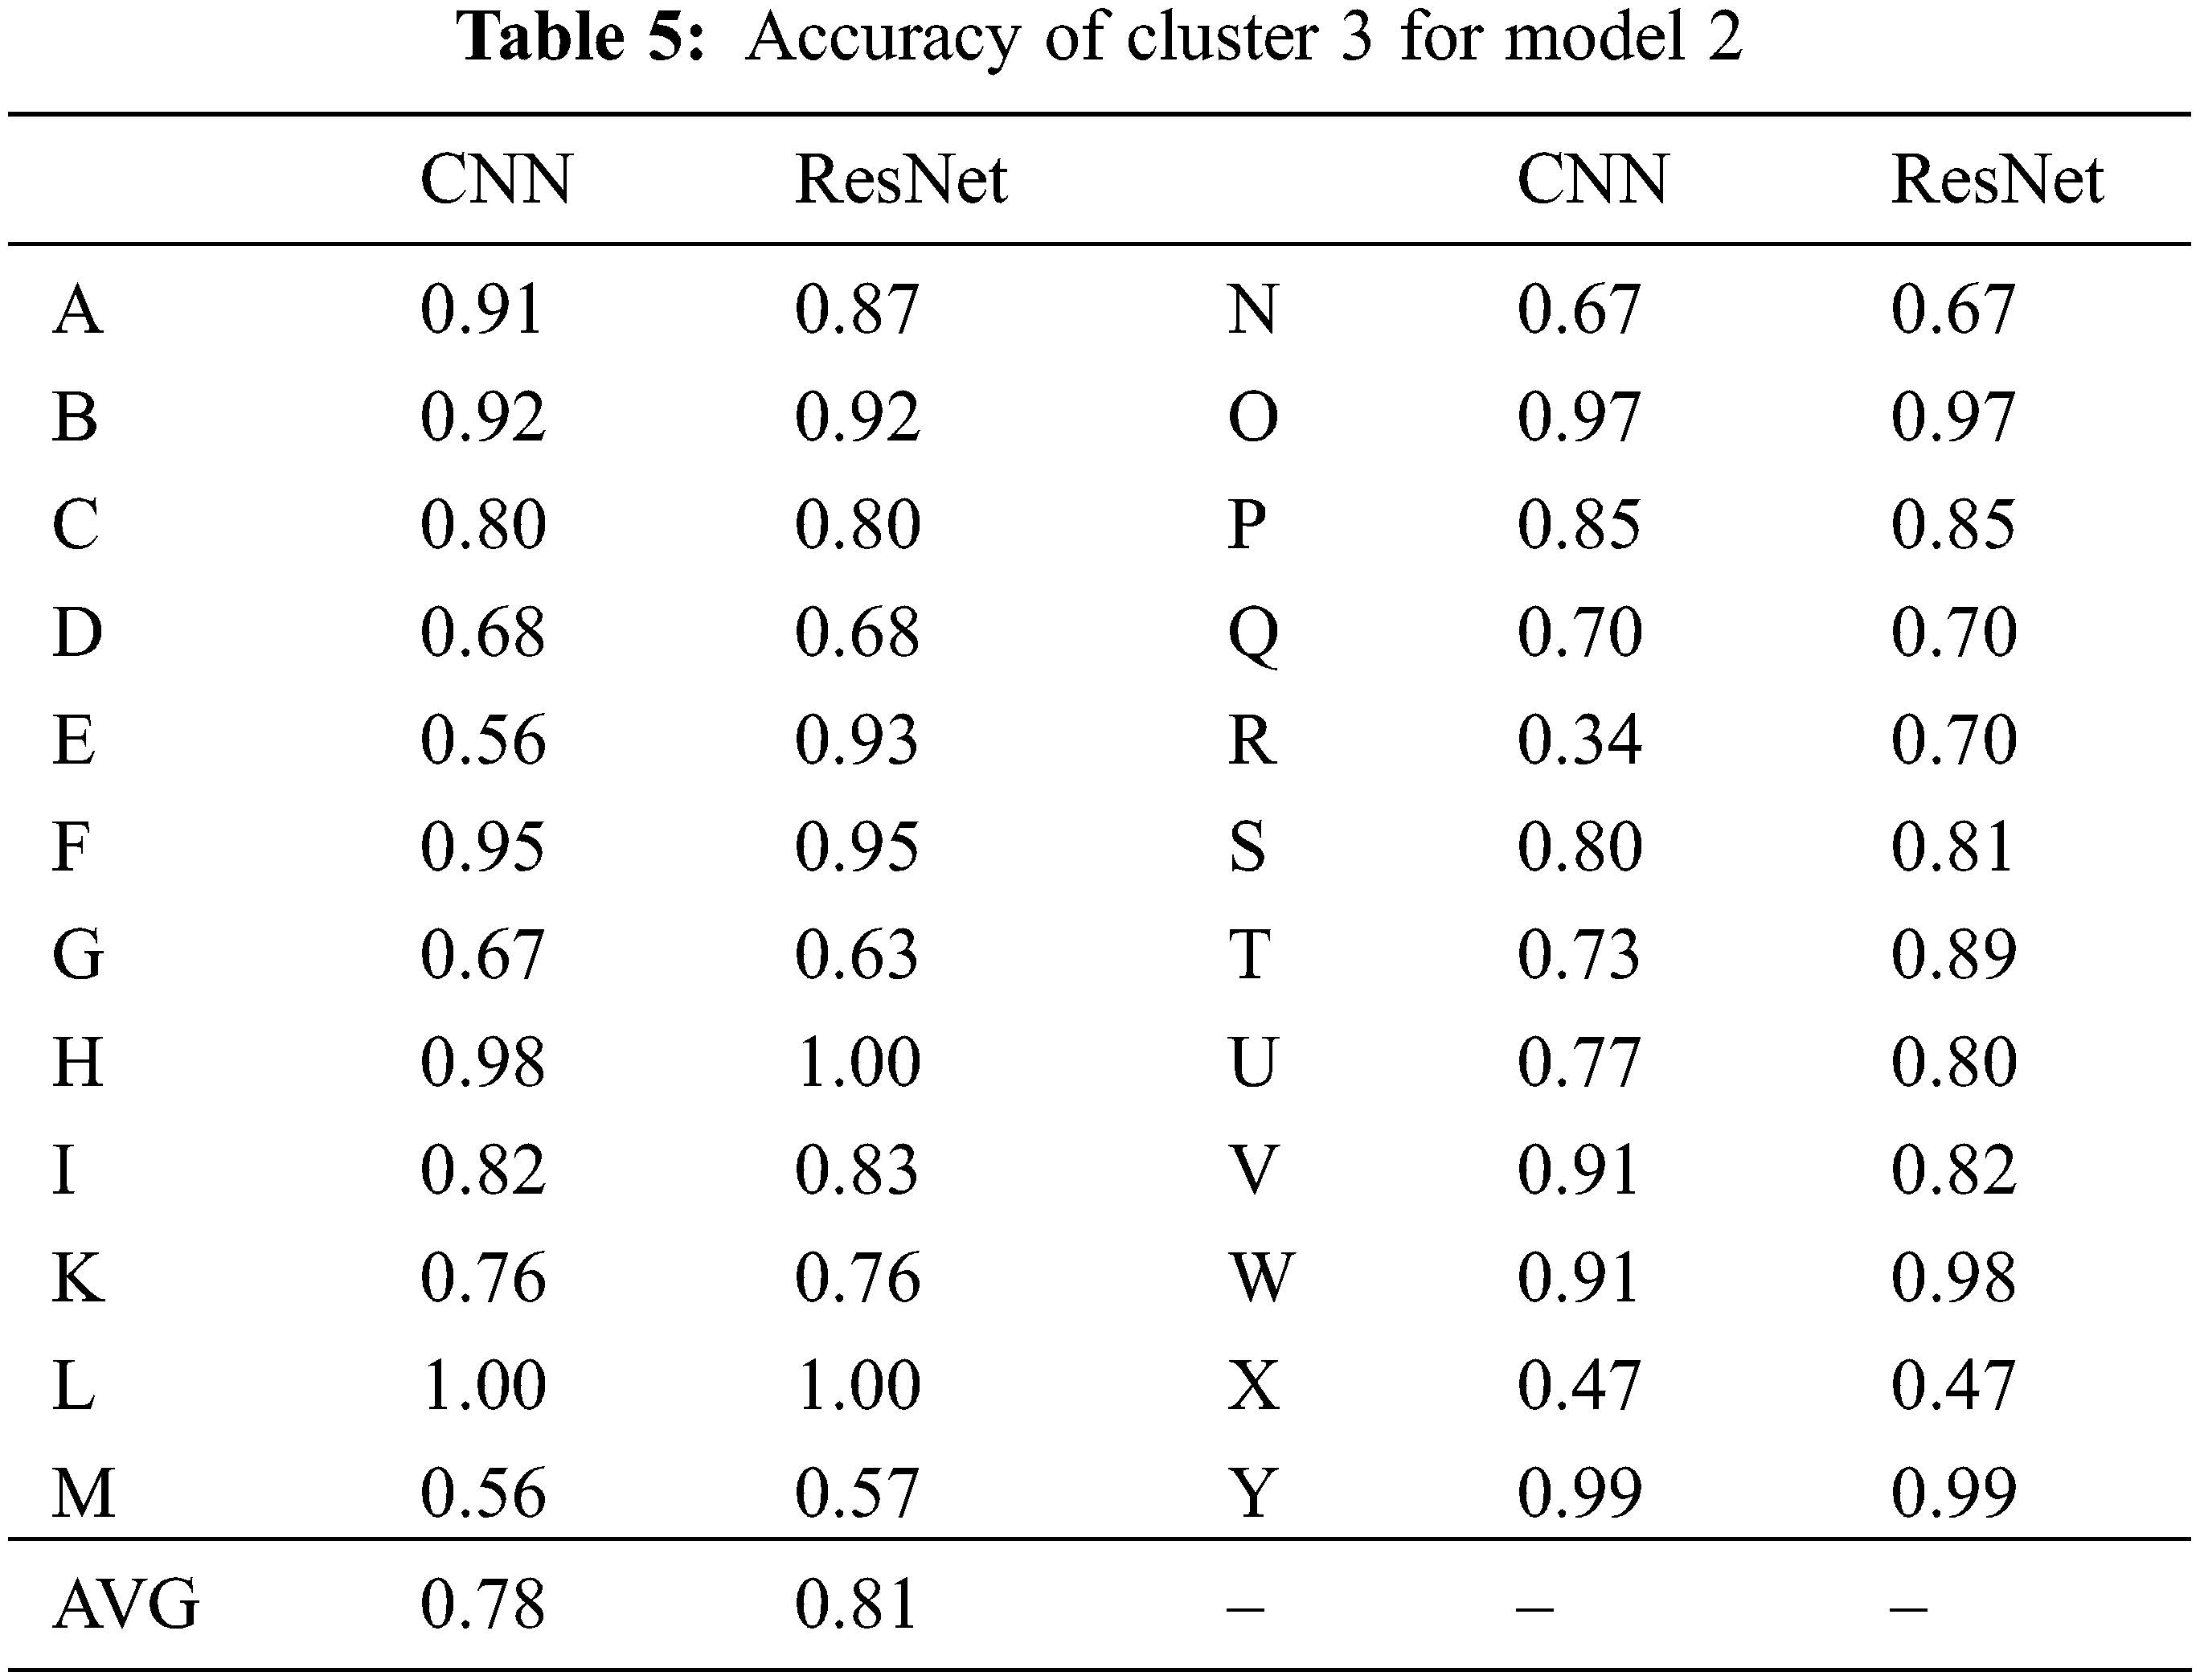
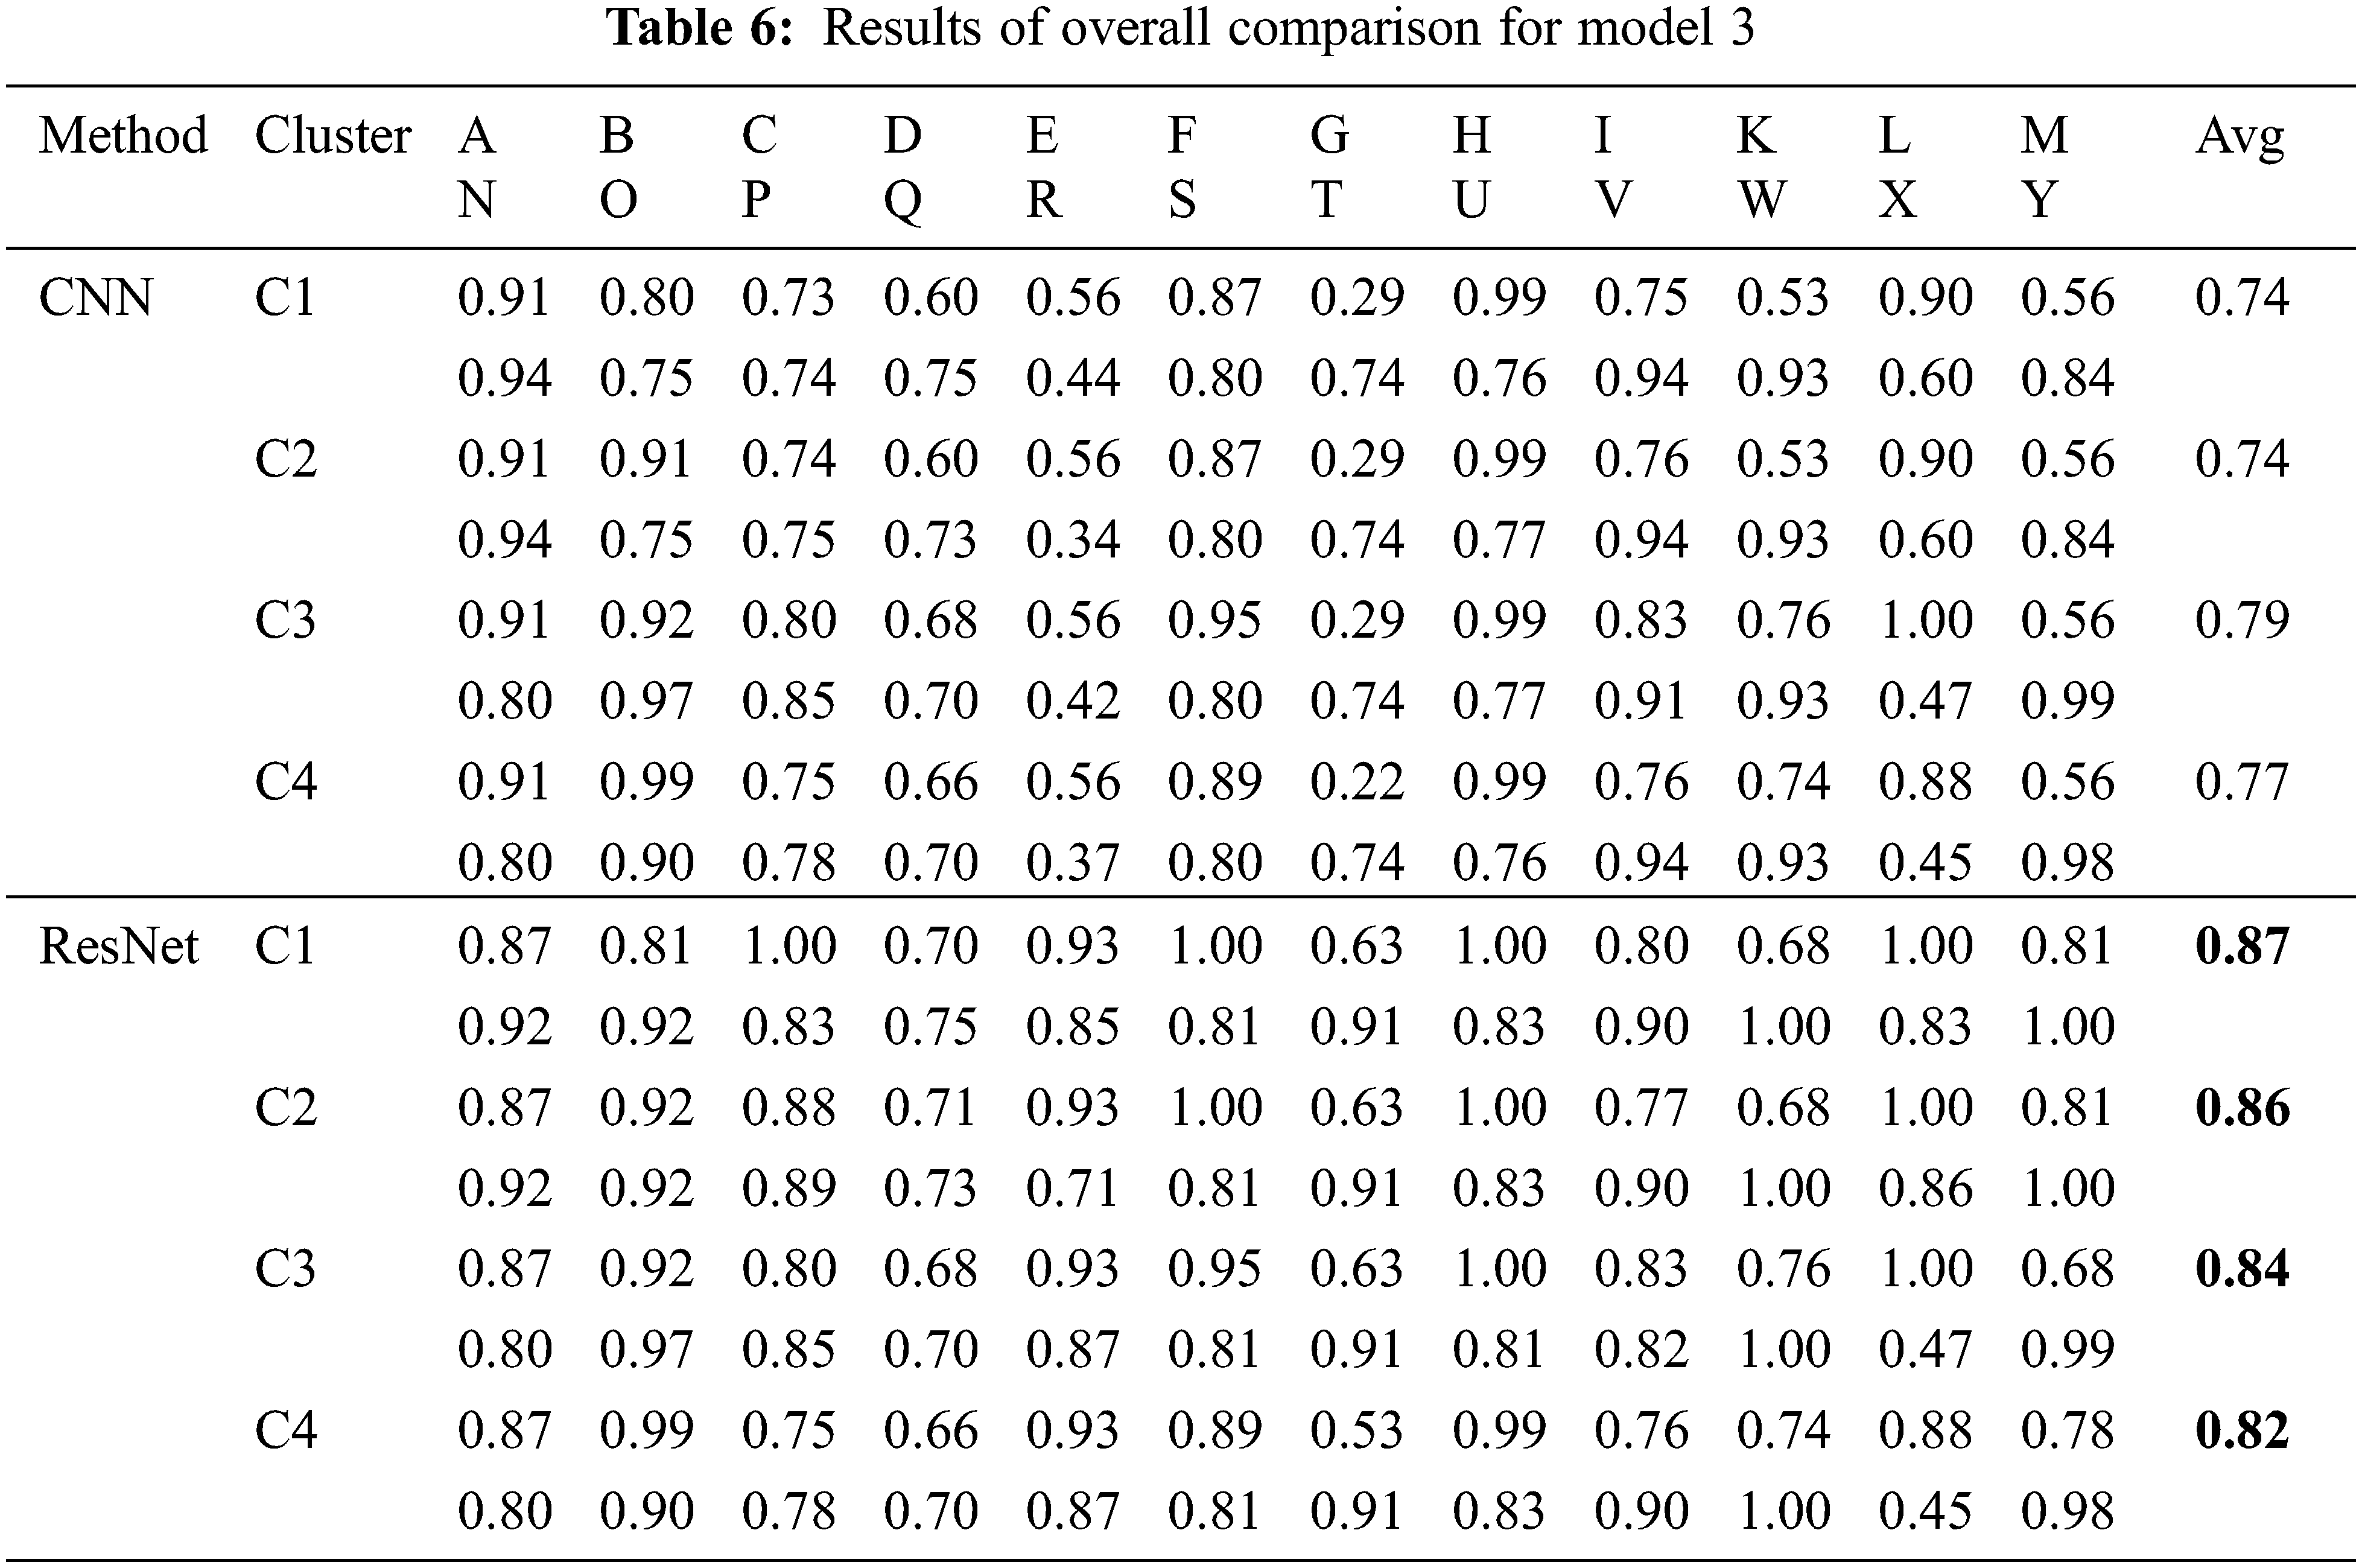
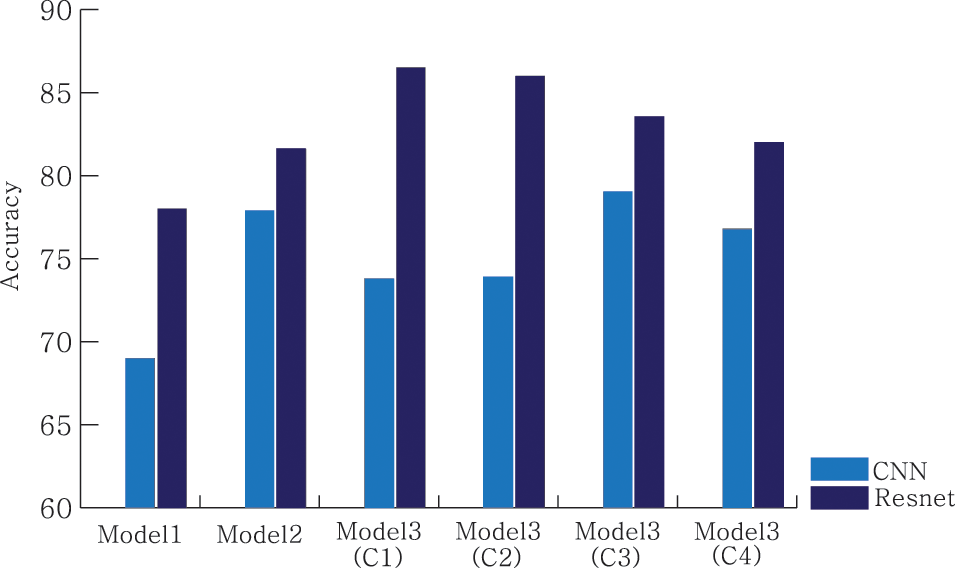
Figure 4: Comparison between models 1, 2, and 3. ( ) indicates the number of clusters
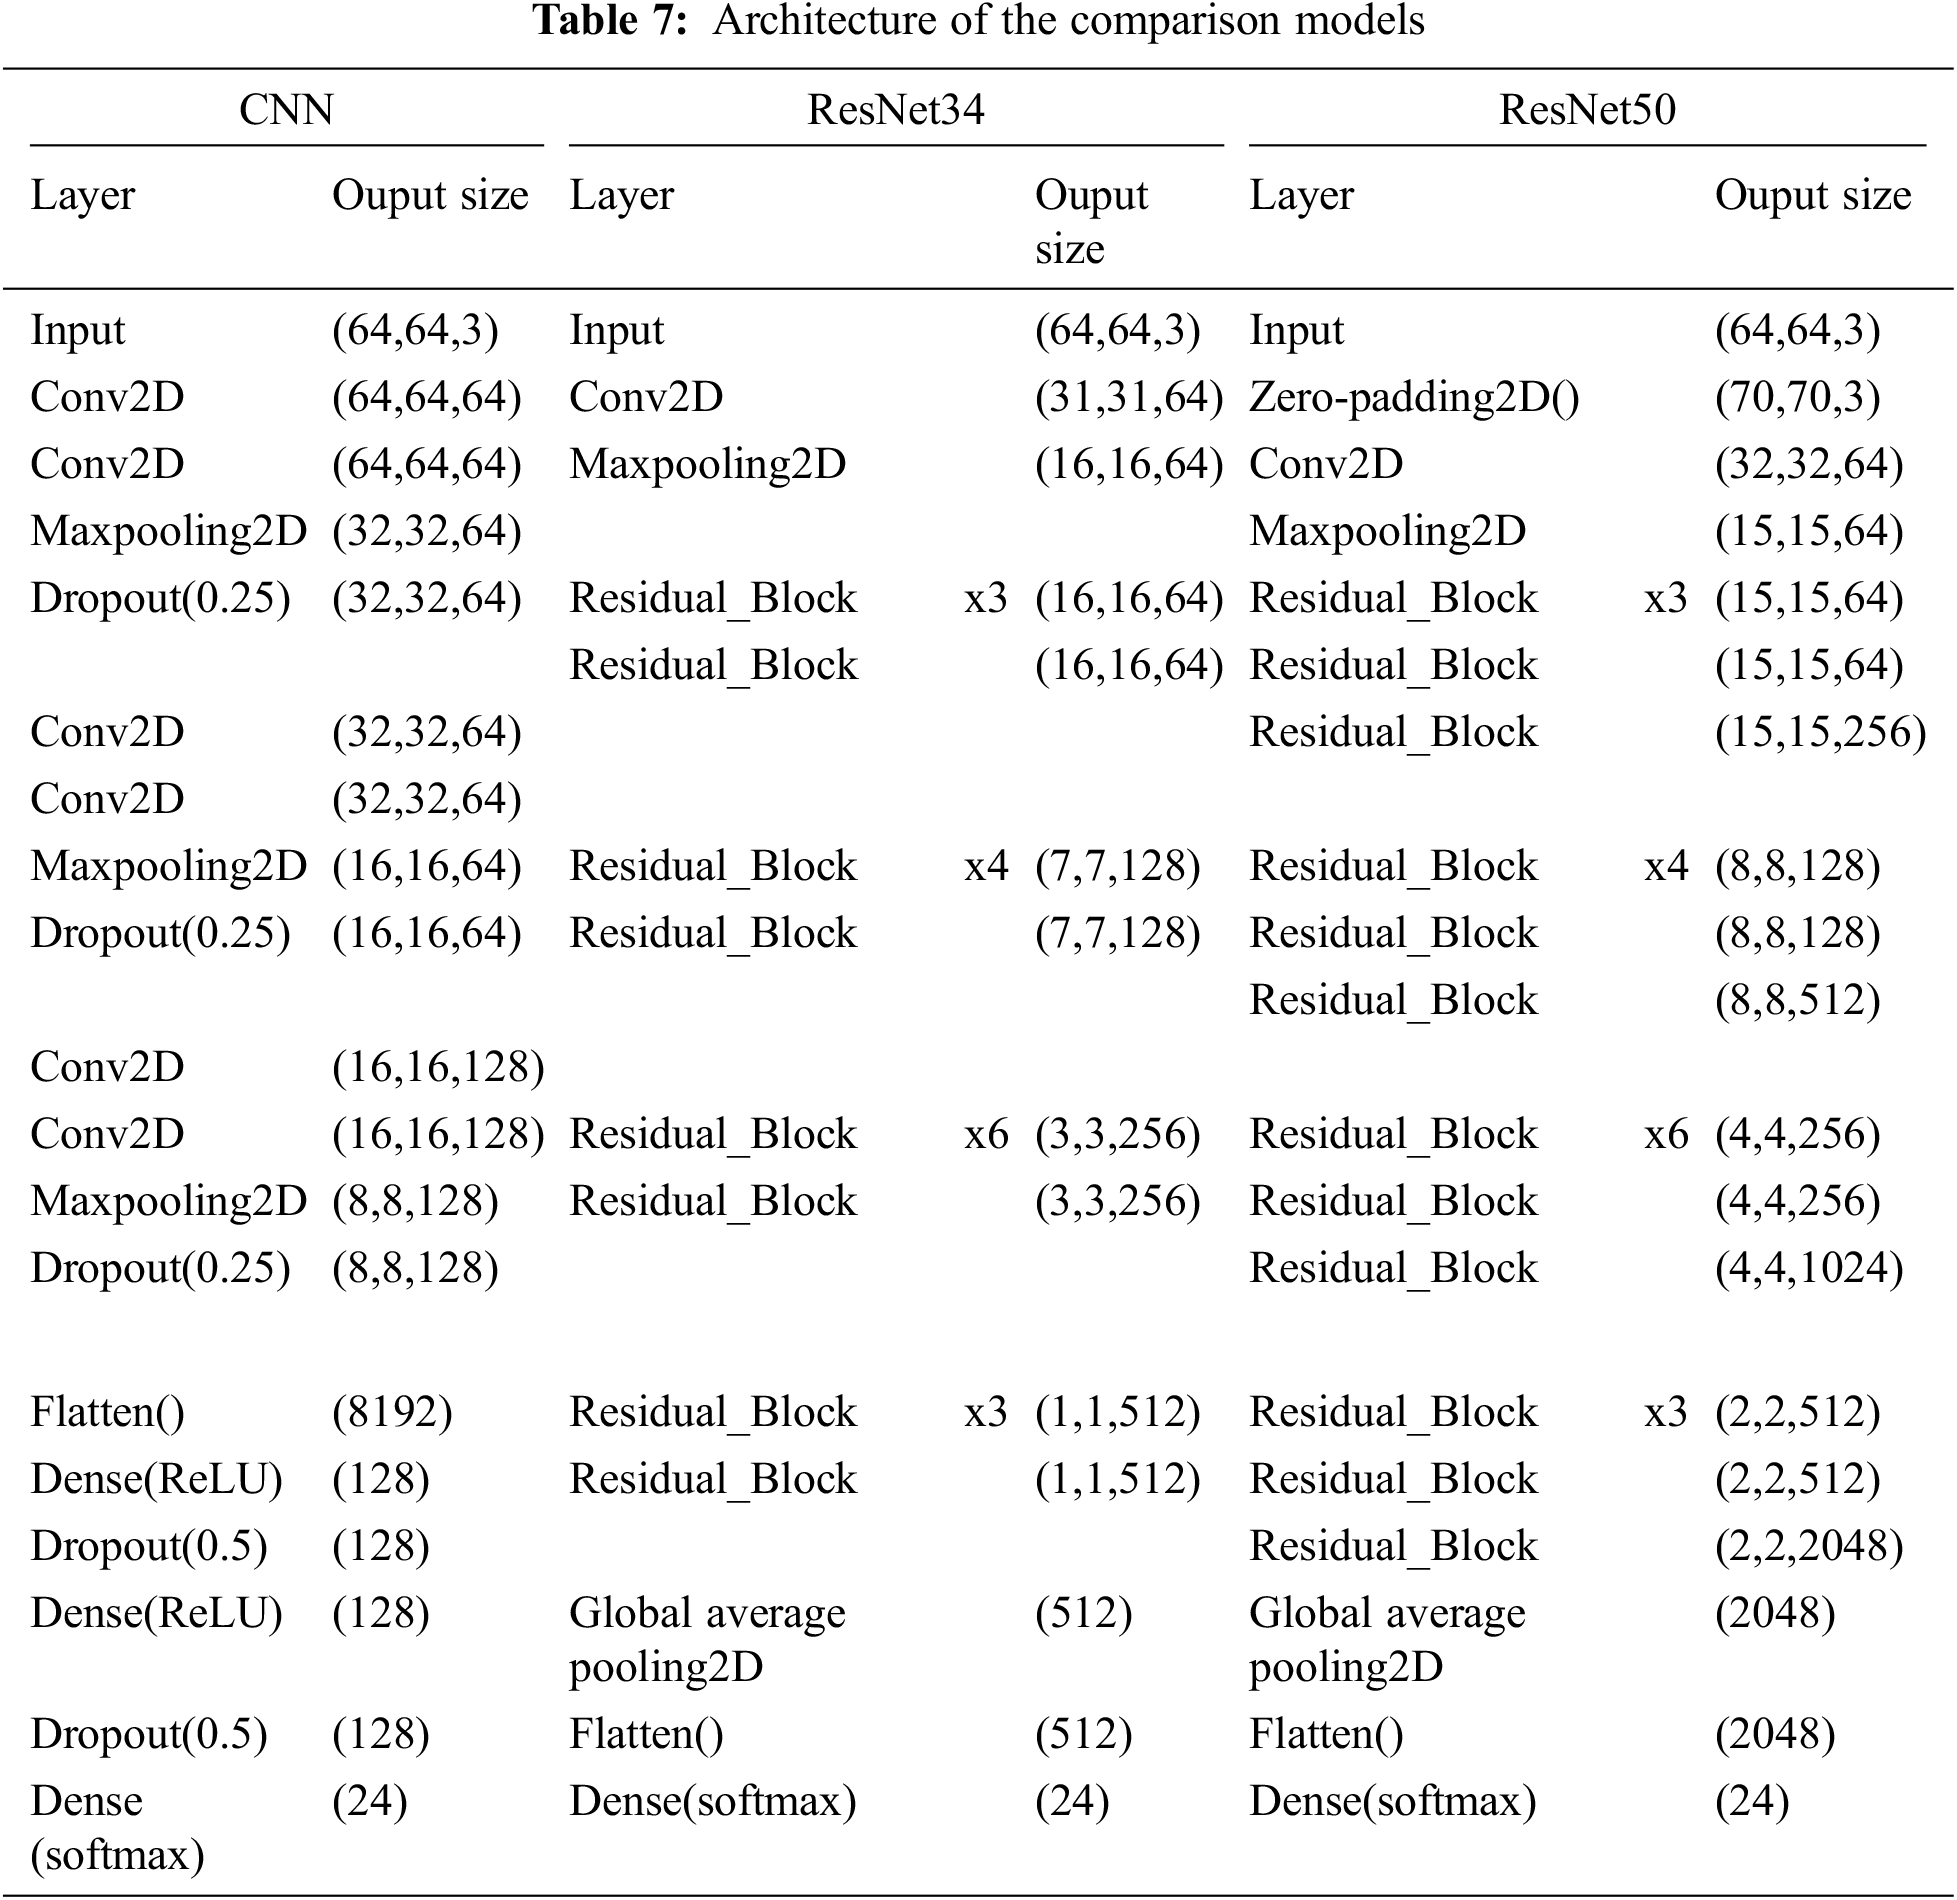
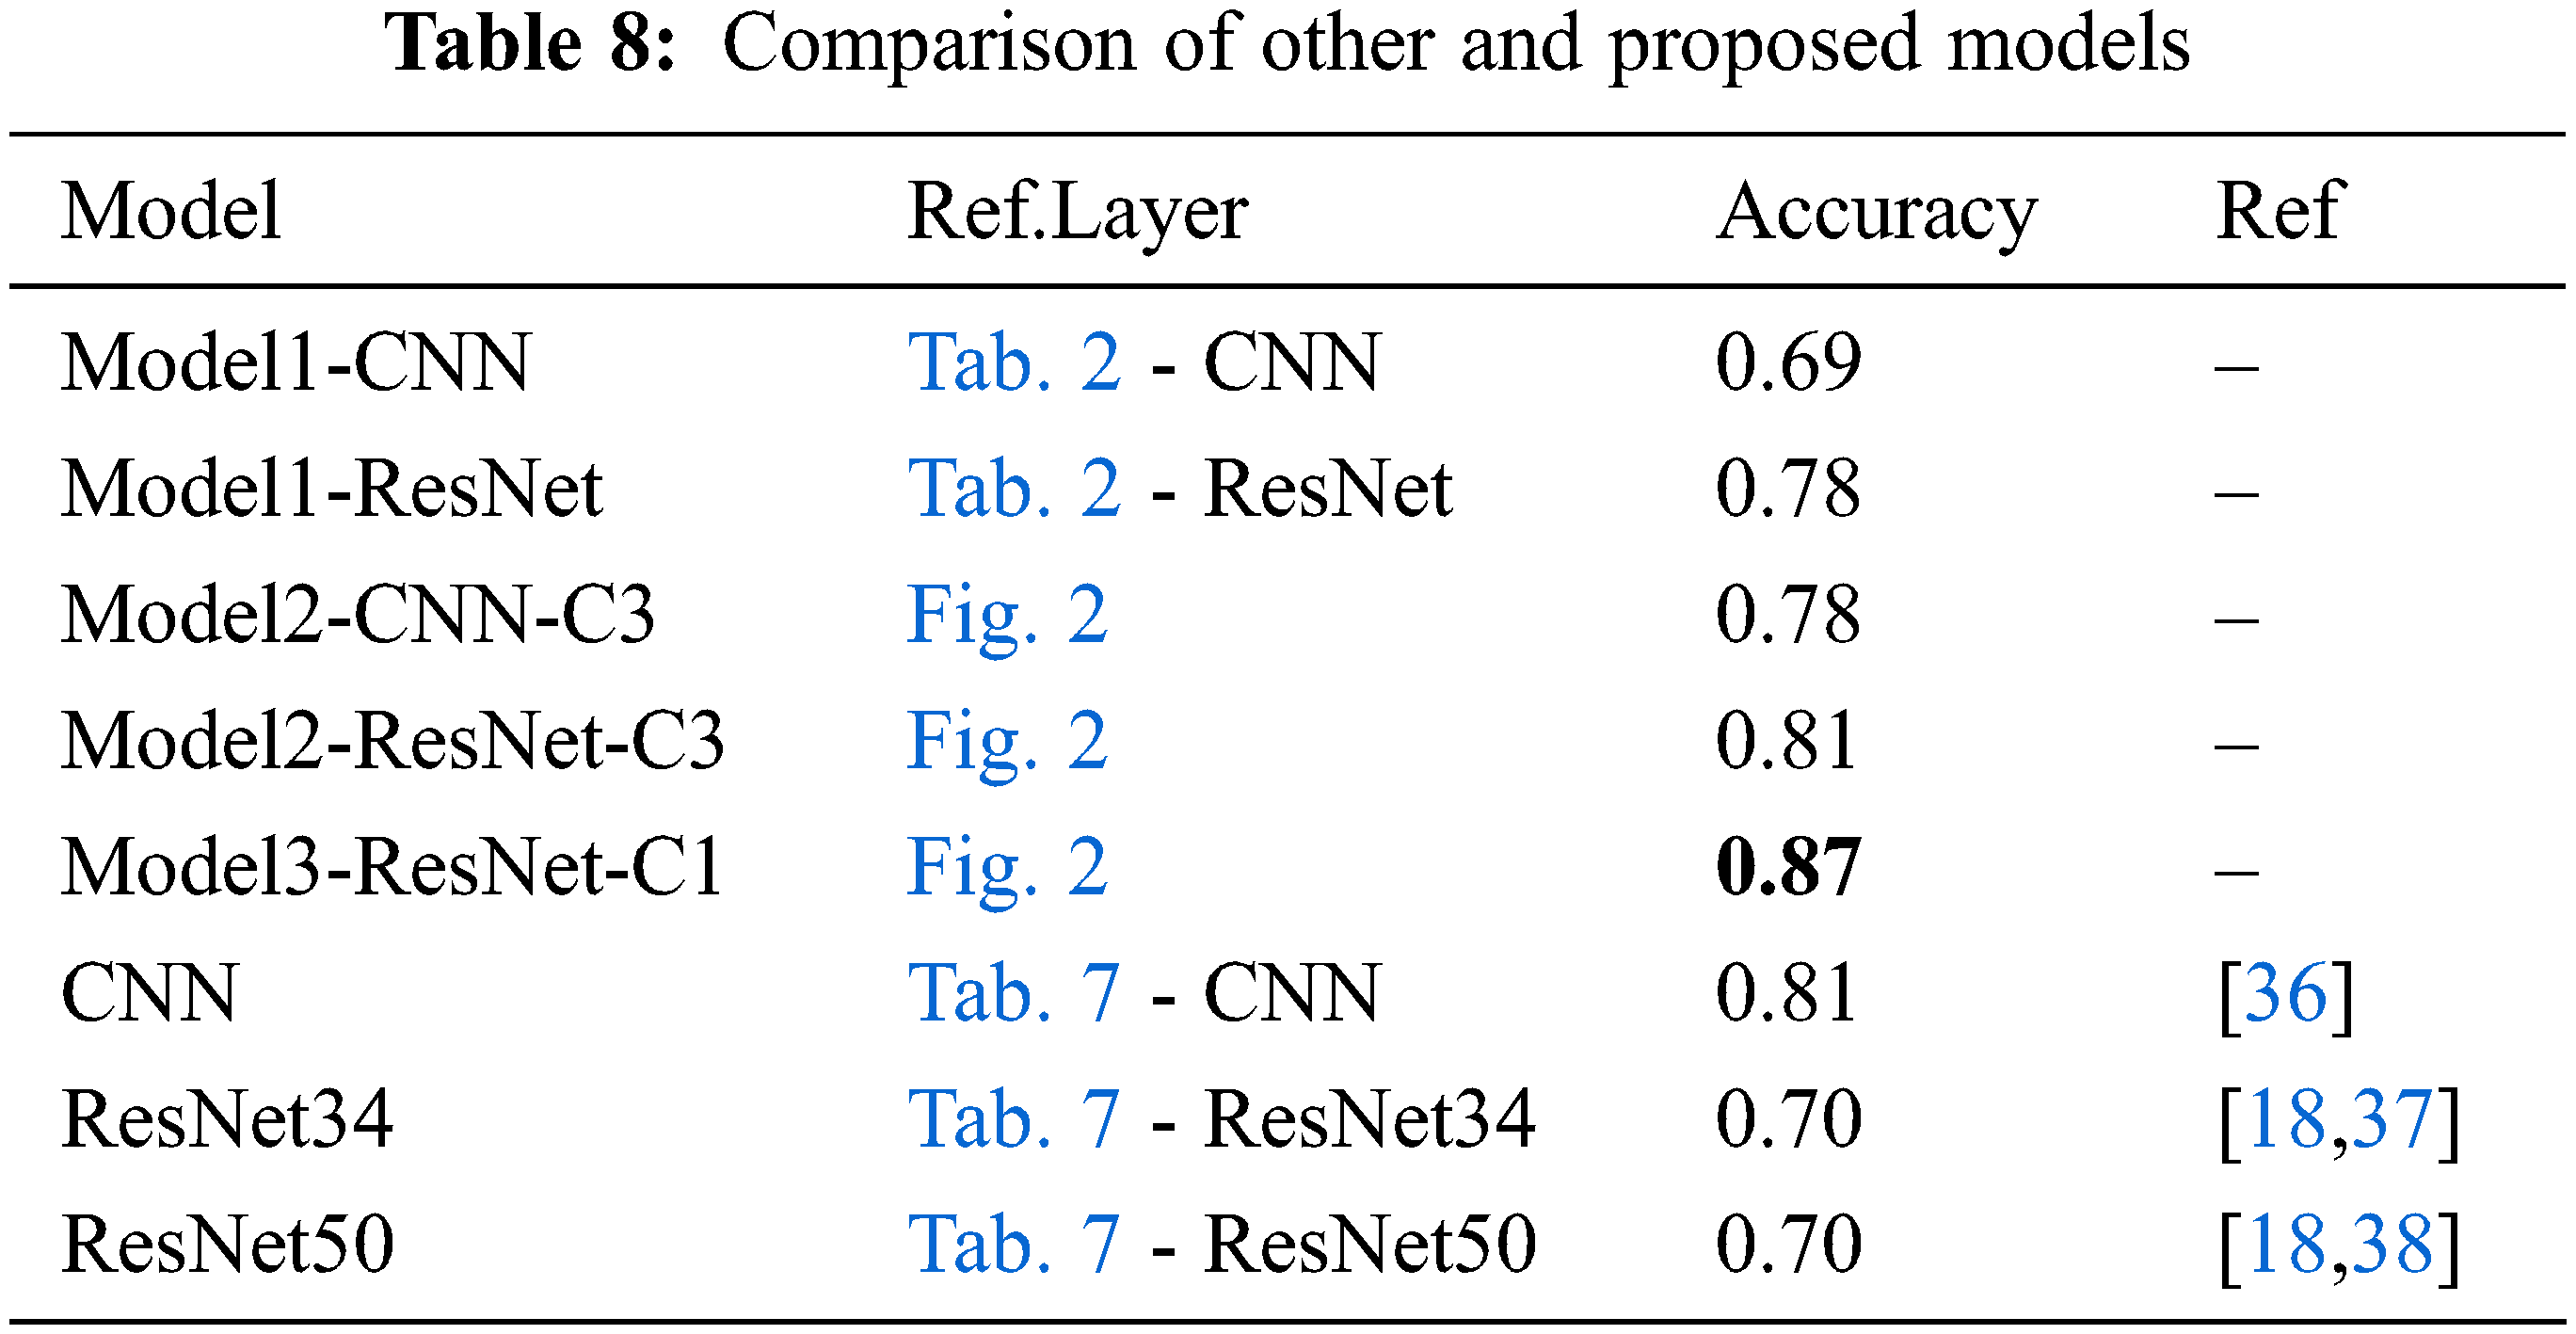
Tab. 7 represents three models to be implemented by the referenced paper, which provide a model for ASL recognition. We employed various background images and augmented data, which have already been used as training and testing sets for the same compared condition. Tab. 8 compares the ASL recognition accuracies of the proposed models with other models. With this benchmark, we conclude that our suggested model, which uses meta-learning, checks softmax values at the 1st layers, and employs a ResNet model, shows the highest performance.
In this study, we proposed a method for improving the accuracy of the conventional image classification model through grouping techniques and softmax values. Among the proposed models, the accuracy of C3 in model 2 was higher than that of other clusters in regarding group-specific accuracy in the 1st layer of meta-learning. The accuracy of the 1st layer had a deterministic effect on the accuracy of the 2nd layer in model 2. Similarly, it was expected that the accuracy of C3 would be higher than the accuracy of other clusters, including those in model 3; however, because the accuracy between groups in model 3 did not exert a significant influence compared to model 2, as presented in Tab. 7, the accuracies of C1 and C2 were higher in comparison. C1 and C2 were divided into a minimal number of groups, without groups of individual letters. However, in C3 and C4, only some letters were grouped, while the rest were divided into individual groups. Regarding the individually classified images, after they were classified in the 1st layer, they could not be classified by a different model in the 2nd layer of model 3. Therefore, rather than C3 and C4, which contain several groups with individual letters, C1 and C2 generally exhibited better classification performance between groups than the other clusters in model 3. This indicates that the groups may have a significant effect on the accuracy of the proposed models.
Because ASL image recognition can be adopted as a means of communication, we reviewed and classified recent studies on ASL image recognition methods. Additionally, a model for improving the ASL recognition performance was proposed. In the proposed model, a meta-learning model was presented, that combined the grouping of similar images and image processing for ASL image recognition. The proposed model has two types: one groups images that can be classified as similar patterns and then reclassifies the images within a group and the other presents decision criteria for reclassification based on the probability of the predicted group. The clusters were divided into four types based on the similarity of the finger shapes and size within a group. The group prediction model was set as the 1st layer of meta learning, and the 2nd layer was a model for reclassification within a group. In the 2nd model layer, CNN and ResNet, which are two representative methods of image deep learning, were applied. For comparative analysis, an image processing method was adopted, that did not apply of meta-learning, and the two proposed methods with meta-learning exhibited higher recognition accuracy than the method that solely employed image processing. Thus, the following three models were investigated in this study: Model 1 was the basic image classification model: Model 2 was trained by the group and adopted in the 1st layer, whereas in the 2nd layer, a model trained with all letters in a group, similar to model 1, was stacked for classification within a group; Model 3 used the same stacked model as model 2, but the softmax value was compared again if it was predicted to be below a set threshold. The highest softmax index among all letters were selected if the softmax value was less than that what was set in the 1st layer. The limitation of the proposed model is that the experimental results obtained vary depending on the classification criteria for the groups. To address this limitation, in future work, we will propose a verifiable clustering model for learning between the groups in the 1st layer.
Funding Statement: This research was supported by the National Research Foundation of Korea (NRF) funded by the Ministry of Science, ICT and Future Planning (NRF-2019R1A2C1084308).
Conflicts of Interest:The authors declare that they have no conflicts of interest to report regarding the present study.
References
1. C. Valli and C. Lucas, Linguistics of American Sign Language: An Introduction, 3rd ed., Washington, DC, USA: Gallaudet University Press, pp. 1–15, 2000. [Google Scholar]
2. T. Simon, H. Joo, I. Matthews and Y. Sheikh, “Hand keypoint detection in single images using multiview bootstrapping,” in Proc. of the IEEE Conf. on Computer Vision and Pattern Recognition, Honolulu, HI, USA, pp. 1145–1153, 2017. [Google Scholar]
3. B. K. Chakraborty, D. Sarma, M. K. Bhuyan and K. F. Macdorman, “Review of constraints on vision-based gesture recognition for human-computer interaction,” IET Computer Vision, vol. 12, no. 1, pp. 3–15, 2018. [Google Scholar]
4. R. Rastgoo, K. Kiani and S. Escalera, “Real-time isolated hand sign language recognition using deep networks and SVD,” Journal of Ambient Intelligence and Humanized Computing, vol. 13, no. 1, pp. 591–611, 2022. [Google Scholar]
5. S. Jiang, B. Sun, L. Wang, Y. Bai, K. Li et al., “Skeleton aware multi-modal sign language recognition,” in Proc. of the IEEE/CVF Conf. on Computer Vision and Pattern Recognition, Nashville, TN, USA, pp. 3413–3424, 2021. [Google Scholar]
6. C. Oz and M. C. Leu, “American sign language word recognition with a sensory glove using artificial neural networks,” Engineering Applications of Artificial Intelligence, vol. 24, no. 7, pp. 1204–1213, 2011. [Google Scholar]
7. K. Y. Fok, N. Ganganath, C. T. Cheng and K. T. Chi, “A real-time ASL recognition system using leap motion sensors,” in 2015 Int. Conf. on Cyber-Enabled Distributed Computing and Knowledge Discovery, Xian, China, IEEE, pp. 411–414, 2015. [Google Scholar]
8. J. Shin, A. Matsuoka, M. A. M. Hasan and A. Y. Srizon, “American sign language alphabet recognition by extracting feature from hand pose estimation,” Sensors, vol. 21, no. 17, pp. 5856, 2021. [Google Scholar]
9. J. Park and C. Kwon, “Korean finger number gesture recognition based on CNN using surface electromyography signals,” Journal of Electrical Engineering & Technology, vol. 16, no. 1, pp. 591–598, 2021. [Google Scholar]
10. S. Z. Gurbuz, M. M. Rahman, E. Kurotohlu, E. Malaia, A. C. Gurbuz et al., “Multi-frequency RF sensor fusion for word-level fluent ASL recognition,” IEEE Sensors Journal, early access, pp. 1, 2021. [Google Scholar]
11. R. Rastgoo, K. Kiani and S. Escalera, “Hand sign language recognition using multi-view hand skeleton,” Expert Systems with Applications, vol. 150, no. 8, pp. 113336, 2020. [Google Scholar]
12. K. Mahdikhanlou and H. Ebrahimnezhad, “Multimodal 3D American sign language recognition for static alphabet and numbers using hand joints and shape coding,” Multimedia Tools and Applications, vol. 79, no. 31-32, pp. 22235–22259, 2020. [Google Scholar]
13. W. Tao, Z. Lai, M. C. Leu and Z. Yin, “American sign language alphabet recognition using leap motion controller,” in Proc. 2018 Institute of Industrial and Systems Engineers Annual Conf., Orlando, Florida, USA, pp. 31–36, 2018. [Google Scholar]
14. A. Vaitkevicius, M. Taroza, T. Blazauskas, R. Damasevicius, R. Maskeliunas et al., “Recognition of American sign language gestures in a virtual reality using leap motion,” Applied Sciences, vol. 9, no. 3, pp. 445, 2019. [Google Scholar]
15. Mustaqeem and K. Soonil, “MLT-DNet: Speech emotion recognition using 1D dilated CNN based on multi-learning trick approach,” Expert Systems with Applications, vol. 167, pp. 114177, 2021. [Google Scholar]
16. A. Krizhevsky, I. Sutskever and G. E. Hinton, “Imagenet classification with deep convolutional neural networks,” Advances in Neural Information Processing Systems, vol. 25, pp. 1097–1105, 2012. [Google Scholar]
17. K. Simonyan and A. Zisserman, “Very deep convolutional networks for large-scale image recognition,” arXiv preprint arXiv:1409.1556, 2014. [Google Scholar]
18. K. He, X. Zhang, S. Ren and J. Sun, “Deep residual learning for image recognition,” in Proc. of the IEEE Conf. on Computer Vision and Pattern Recognition, Las Vegas, NV, USA, pp. 770–778, 2016. [Google Scholar]
19. Y. Lecun, L. Bottou, Y. Bengio and P. Haffner, “Gradient-based learning applied to document recognition,” Proc. of the IEEE, vol. 86, no. 11, pp. 2278–2324, 1998. [Google Scholar]
20. S. Wei, Z. Guoce, Z. Xiaorui, Z. Xu and G. Nannan, “Fine-grained vehicle type classification using lightweight convolutional neural network with feature optimization and joint learning strategy,” Multimedia Tools and Applications, vol. 80, no. 20, pp. 30803–30816, 2021. [Google Scholar]
21. J. Guerin, O. Gibaru, S. Thiery and E. Nyiri, “CNN features are also great at unsupervised classification,” arXiv preprint arXiv:1707.01700, 2017. [Google Scholar]
22. B. Shi, A. M. D. Rio, J. Keane, J. Michaux, D. Brentari et al., “American sign language fingerspelling recognition in the wild,” in 2018 IEEE Spoken Language Technology Workshop (SLT). Athens, Greece: IEEE, pp. 145–152, 2018. [Google Scholar]
23. C. K. M. Lee, K. K. H. Ng, C. H. Chen, H. C. W. Lau, S. Y. Chung et al., “American sign language recognition and training method with recurrent neural network,” Expert Systems with Applications, vol. 167, no. 1, pp. 114403, 2021. [Google Scholar]
24. P. S. Neethu, R. Suguna and D. Sathish, “An efficient method for human hand gesture detection and recognition using deep learning convolutional neural networks,” Soft Computing, vol. 24, no. 20, pp. 15239–15248, 2020. [Google Scholar]
25. V. Hernandez, T. Suzuki and G. Venture, “Convolutional and recurrent neural network for human activity recognition: Application on American sign language,” PloS One, vol. 15, no. 2, pp. e0228869, 2020. [Google Scholar]
26. B. Kang, S. Tripathi and T. Q. Nguyen, “Real-time sign language fingerspelling recognition using convolutional neural networks from depth map,” in Proc. 2015 3rd IAPR Asian Conf. on Pattern Recognition (ACPR), Kuala Lumpur, Malaysia, IEEE, pp. 136–140, 2015. [Google Scholar]
27. O. Kopuklu, A. Gunduz, N. Kose and G. Rigoll, “Real-time hand gesture detection and classification using convolutional neural networks,” in Proc. 2019 14th IEEE Int. Conf. on Automatic Face & Gesture Recognition (FG 2019), Lille, France, IEEE, pp. 1–8, 2019. [Google Scholar]
28. R. H. Abiyev, M. Arslan and J. B. Idoko, “Sign language translation using deep convolutional neural networks,” KSII Transactions on Internet and Information Systems (TIIS), vol. 14, no. 2, pp. 631–653, 2020. [Google Scholar]
29. A. Kasapbasi, A. E. A. Elbushra, O. A. Hardanee and A. Yilmaz, “DeepASLR: A CNN based human computer interface for American sign language recognition for hearing impaired individuals,” Computer Methods and Programs in Biomedicine Update, vol. 2, no. 5, pp. 100048, 2022. [Google Scholar]
30. Y. Xu, J. Y. Zhu, E. Chang and Z. Tu, “Multiple clustered instance learning for histopathology cancer image classification, segmentation and clustering,” in Proc. 2012 IEEE Conf. on Computer Vision and Pattern Recognition, Providence, RI, IEEE, pp. 964–971, 2012. [Google Scholar]
31. B. Subbiah and C. C. Seldev, “Image classification through integrated K-means algorithm,” International Journal of Computer Science Issues, vol. 9, no. 2, pp. 518, 2012. [Google Scholar]
32. K. Xie, J. Wu, W. Yang and C. Sun, “K-means clustering based on density for scene image classification,” in Proc. of the 2015 Chinese Intelligent Automation Conf., Fuzhou, China, Springer, pp. 379–386, 2015. [Google Scholar]
33. H. Al-Jubouri, H. Du and H. Sellahewa, “Adaptive clustering based segmentation for image classification,” in Proc. 2013 5th Computer Science and Electronic Engineering Conf. (CEEC), Colchester, United Kingdom, IEEE, pp. 128–133, 2013. [Google Scholar]
34. L. Taylor and G. Nitschke, “Improving deep learning using generic data augmentation,” in Proc. IEEE Symp. Series on Computational Intelligence (SSCI), Bangalore, India, IEEE, pp. 1542–1547, 2018. [Google Scholar]
35. C. Shorten and T. M. Khoshgoftaar, “A survey on image data augmentation for deep learning,” Journal of Big Data, vol. 6, no. 1, pp. 1–48, 2019. [Google Scholar]
36. V. Bheda and D. Radpour, “Using deep convolutional networks for gesture recognition in American sign language,” arXiv preprint arXiv: 1710. 06836, 2017. [Google Scholar]
37. P. Kurhekar, J. Phadtare, S. Sinha and K. P. Shirsat, “Real time sign language estimation system,” in Proc. 2019 3rd Int. Conf. on Trends in Electronics and Informatics (ICOEI), Tirunelveli, India, IEEE, pp. 654–658, 2019. [Google Scholar]
38. A. D. Marjusalinah, S. Samsuryadi and M. A. Buchari, “Classification of finger spelling American sign language using convolutional neural network,” Computer Engineering and Applications Journal, vol. 10, no. 2, pp. 93–103, 2021. [Google Scholar]
Cite This Article
 Copyright © 2023 The Author(s). Published by Tech Science Press.
This work is licensed under a Creative Commons Attribution 4.0 International License , which permits unrestricted use, distribution, and reproduction in any medium, provided the original work is properly cited.
 Downloads
 Citation Tools