 Open Access
ARTICLE
Optimal Deep Belief Network Based Lung Cancer Detection and Survival Rate Prediction
1 Department of Information Technology, Rajalakshmi Engineering College, Chennai, 600125, Tamilnadu, India
2 Department of Computer Science and Engineering, Rajalakshmi Engineering College, Chennai, 600125, Tamilnadu, India
* Corresponding Author: Sindhuja Manickavasagam. Email:
Computer Systems Science and Engineering 2023, 45(1), 939-953. https://doi.org/10.32604/csse.2023.030491
Received 27 March 2022; Accepted 19 May 2022; Issue published 16 August 2022
Abstract
The combination of machine learning (ML) approaches in healthcare is a massive advantage designed at curing illness of millions of persons. Several efforts are used by researchers for detecting and providing primary phase insights as to cancer analysis. Lung cancer remained the essential source of disease connected mortality for both men as well as women and their frequency was increasing around the world. Lung disease is the unrestrained progress of irregular cells which begin off in one or both Lungs. The previous detection of cancer is not simpler procedure however if it can be detected, it can be curable, also finding the survival rate is a major challenging task. This study develops an Ant lion Optimization (ALO) with Deep Belief Network (DBN) for Lung Cancer Detection and Classification with survival rate prediction. The proposed model aims to identify and classify the presence of lung cancer. Initially, the proposed model undergoes min-max data normalization approach to preprocess the input data. Besides, the ALO algorithm gets executed to choose an optimal subset of features. In addition, the DBN model receives the chosen features and performs lung cancer classification. Finally, the optimizer is utilized for hyperparameter optimization of the DBN model. In order to report the enhanced performance of the proposed model, a wide-ranging experimental analysis is performed and the results reported the supremacy of the proposed model.Keywords
Lung cancer (LC) is the major and primary reason for cancer death in both men and women. Demonstration of LC in the body parts of the patient exposes via earlier symptoms in several persons [1]. Treatments are undergone and projection rest on the diagnosis types of cancers, the stages (extent of spreading), and victim outcome status. Likely medication contains surgery, radiotherapy, and chemotherapy Persistence relies upon the stages, overall health of a person, and other determiners, however entirely only 14% of an individual recognized with LC live 5 years after the recognition [2]. The death rate and prevalence of tobacco consumption are comparatively high. Generally, LC grows inside the wall or epithelium of the respiratory tree [3]. However, it could be started anywhere else in the lung region and affect other parts of the lung system. LC is most probably affected persons between the ages of 55 and 65 and frequently takes several years for development [4]. There are 2 major classifications of LC one is small cell LC (SCLC) or oat cell cancer and another one is Non-small cell LC (NSCLC).
Every type of LC develops and spreads in different means and it is treated accordingly [5]. In case of cancer has characteristics of both verities, it is known as mixed small cell or large cell cancers. Non-small cell LC is more common than SCLC and it has usual growth and also spreads more gradually [6]. SCLC is nearly associated with smoking and growing rapidly and forms huge tumors which may spread extremely all over the body. They frequently started in the bronchi near the centre of the chest. LC death rate is associated with the total number of cigarettes consumed [7]. Pre-diagnosis aids us to recognize or narrow down the probability of screening for LC disease. Signs of LC and risk aspects (obesity, smoking, alcohol drinking, and insulin resistance) had a statistically important effect in early diagnosis phase [8]. The LC diagnostic and prognostic problems are mostly in the scope of the extremely discussed grouping problems [9,10]. These issues have inspired many of the investigators in statistics domain, computer intelligence, and data mining.
In [11], a k-Nearest-Neighbor method, where a genetic algorithm is employed to the effectual feature election to minimize the data dimension and augment classification performance, is applied for identifying the phase of patient disease. To enhance the performance of the presented method, the optimal value for k is defined by the experiment technique. Agrawal et al. [12] examine the lung tumor dataset obtainable from the SEER by proposing precise survival predictive model for lung cancer with data mining technique. Then, the developed pre-processing step led to splitting or removal, or modification of attribute, and 2 of the 11 derived attributes have been found to have important prediction energy. Data mining classification technique is utilized on the pre-processed dataset and validation and data mining optimization. In [13], appropriate integration of Adoptive thresholding segmentation approach was employed to segment input images, a familiar Support Vector Machine (SVM) image classification approach was employed for classifying lung cancer and Content-based image retrieval method is utilized for comparing lung image features namely intensity, contract, shape, and texture. Lim et al. [14] proposed a bioinformatics pipeline and standardized data that is pre-processed by a strong statistical method; allows other to implement largescale meta-analysis, without conducting statistical correction and time-consuming data mining. [15] explored the part of Chinese prescription in non-small cell lung cancer (NSCLC) and offer reference for the prescription and herbs applications. Randomized and quasi-randomized controlled medical trials on Chinese herbal medication in the treatment of NSCLC have been gathered from 7 datasets to determine a dataset of prescriptions on NSCLC.
This study develops a Ant lion Optimization with Optimal Deep Belief Network (ODBN) model named ALO-ODBN for Lung Cancer Detection and Classification. Initially, the ALO-ODBN model undergoes min-max data normalization approach to preprocess the input data. Besides, the ALO algorithm gets executed to choose an optimal subset of features. In addition, the DBN model receives the chosen features and performs lung cancer classification. Finally, the Adam optimizer is utilized for hyperparameter optimization of the DBN model. In order to report the enhanced performance of the ALO-ODBN model, a wide-ranging experimental analysis is performed and the results reported the supremacy of the ALO-ODBN model.
In this study, a new ALO-ODBN model has been developed for Lung Cancer Detection and Classification. Initially, the ALO-ODBN model undergoes min-max data normalization approach to preprocess the input data. Besides, the ALO algorithm gets executed to choose an optimal subset of features. In addition, the DBN model receives the chosen features and performs lung cancer classification. Finally, the Adam optimizer is utilized for hyperparameter optimization of the DBN model. Fig. 1 depicts the overall work flow of ALO-ODBN technique.
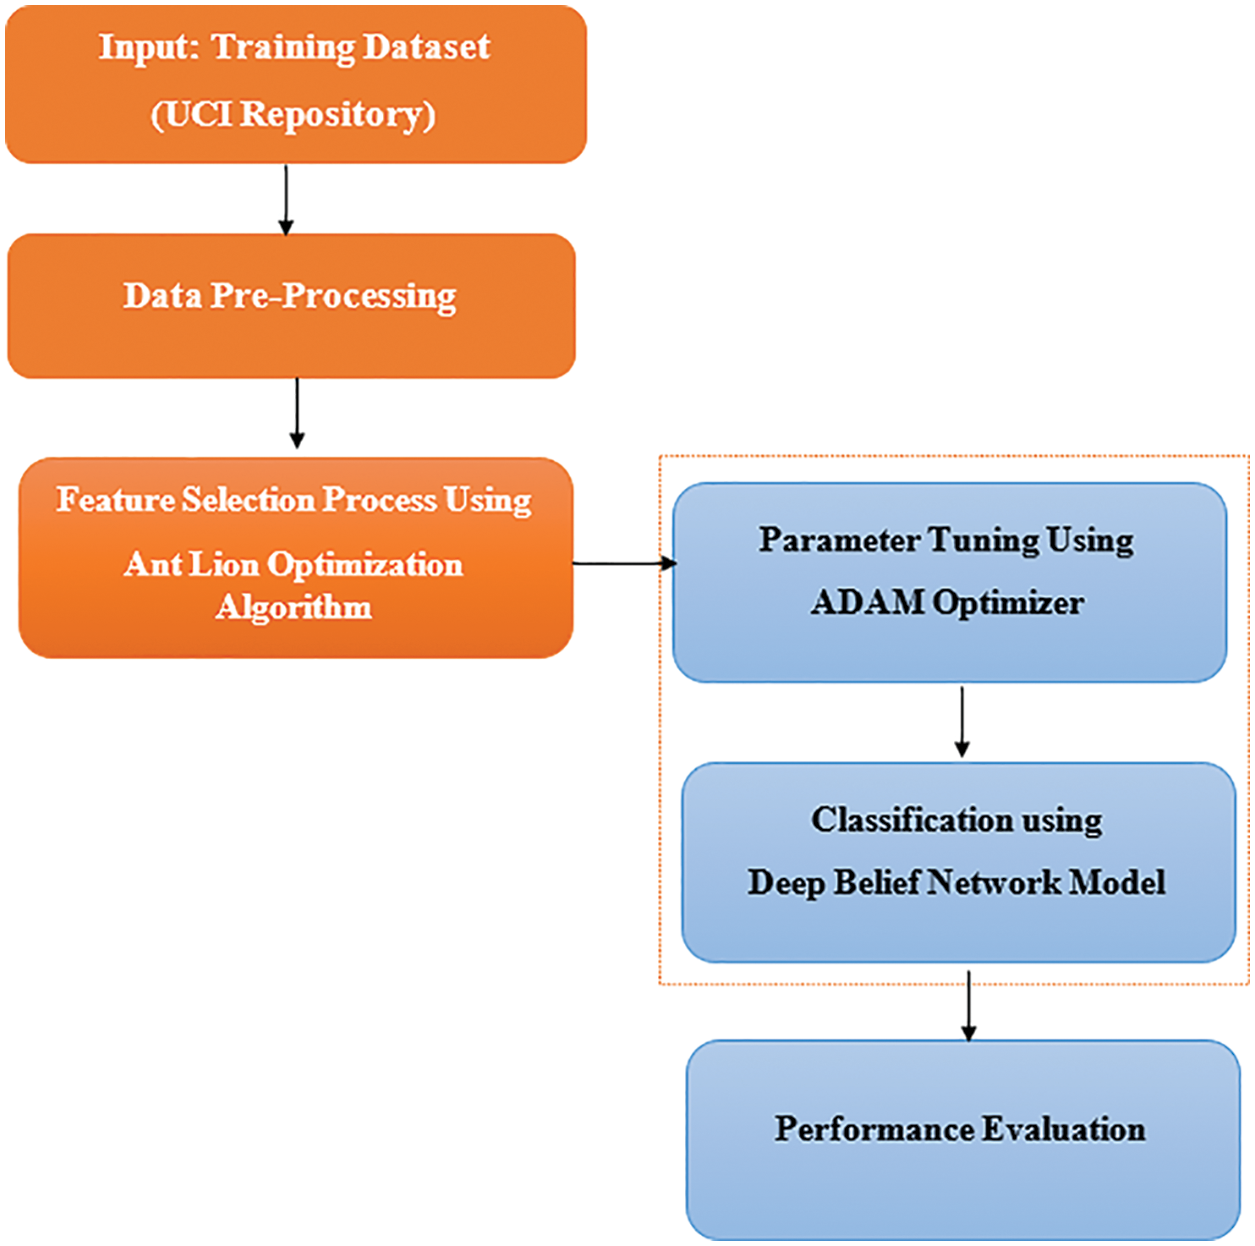
Figure 1: Overall work flow of ALO-ODBN technique
Initially, the ALO-ODBN model undergoes min-max data normalization approach to pre-process the input data. In any ML model, data normalization is widely utilized to attain proficient results [16]. The features values can different from small to large values. So, the normalization process is employed for scaling the features as given below.
2.2 Process Involved in ALO Technique
The recent meta heuristic method of ant lion optimization algorithm is the interaction of antlions and ants. mall cone shaped traps are made by the antlions, in which they hide and wait for their prey. The major steps involved in the tuning process are illustrated below with the help of steps given below
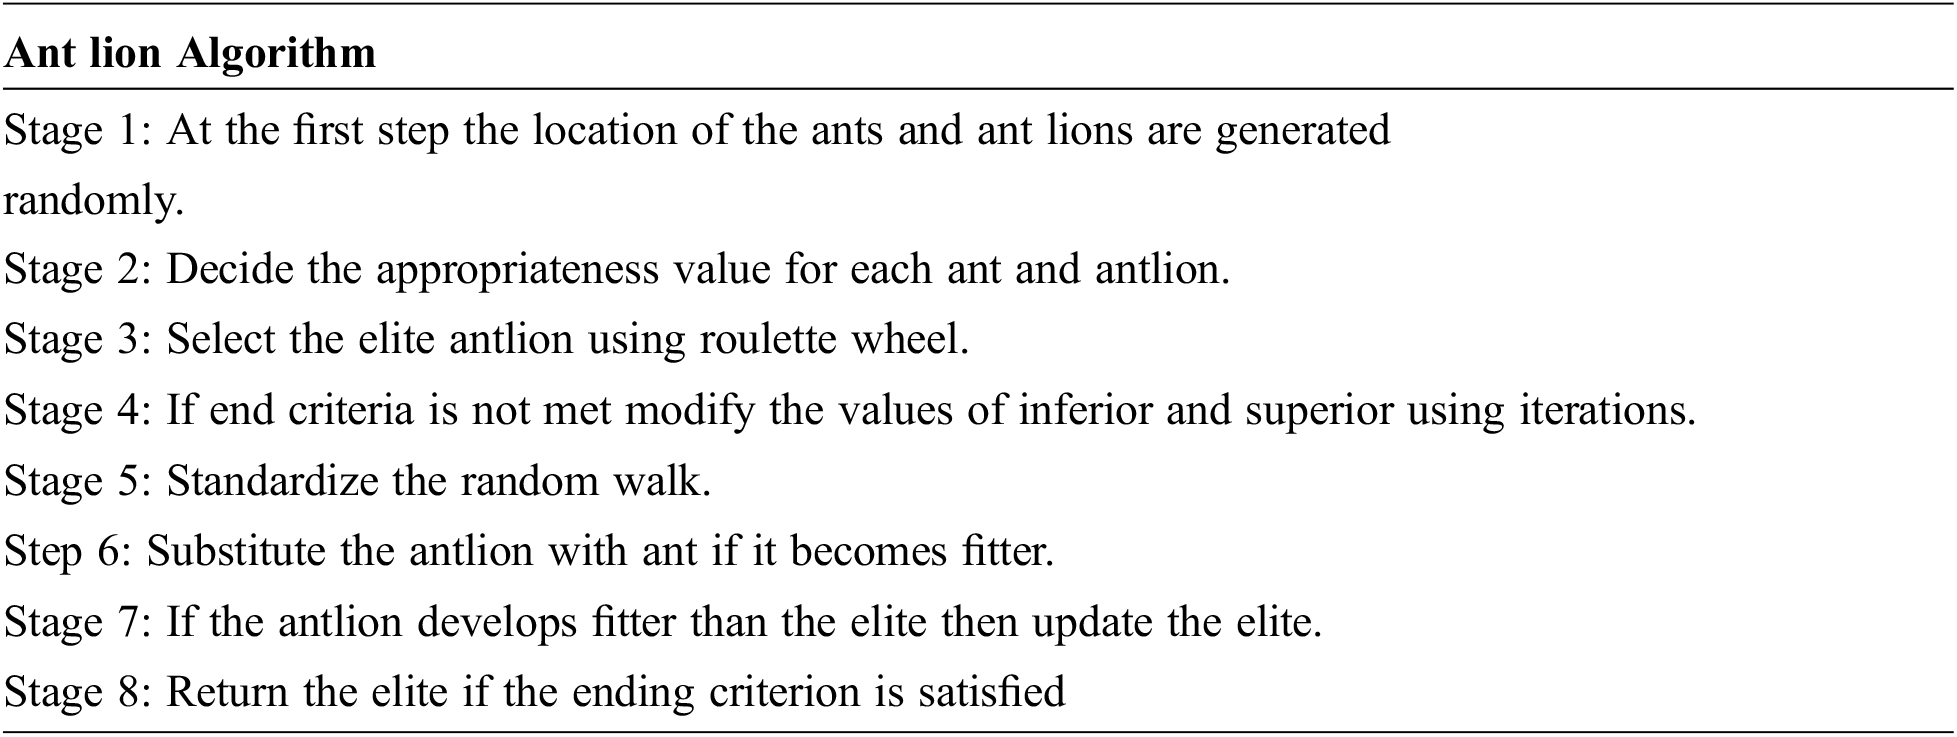
The ant lion optimization algorithm simulates the hunting mechanism of the antlions. The following subsections describe the steps of the algorithm.
The random walk of ants, where,
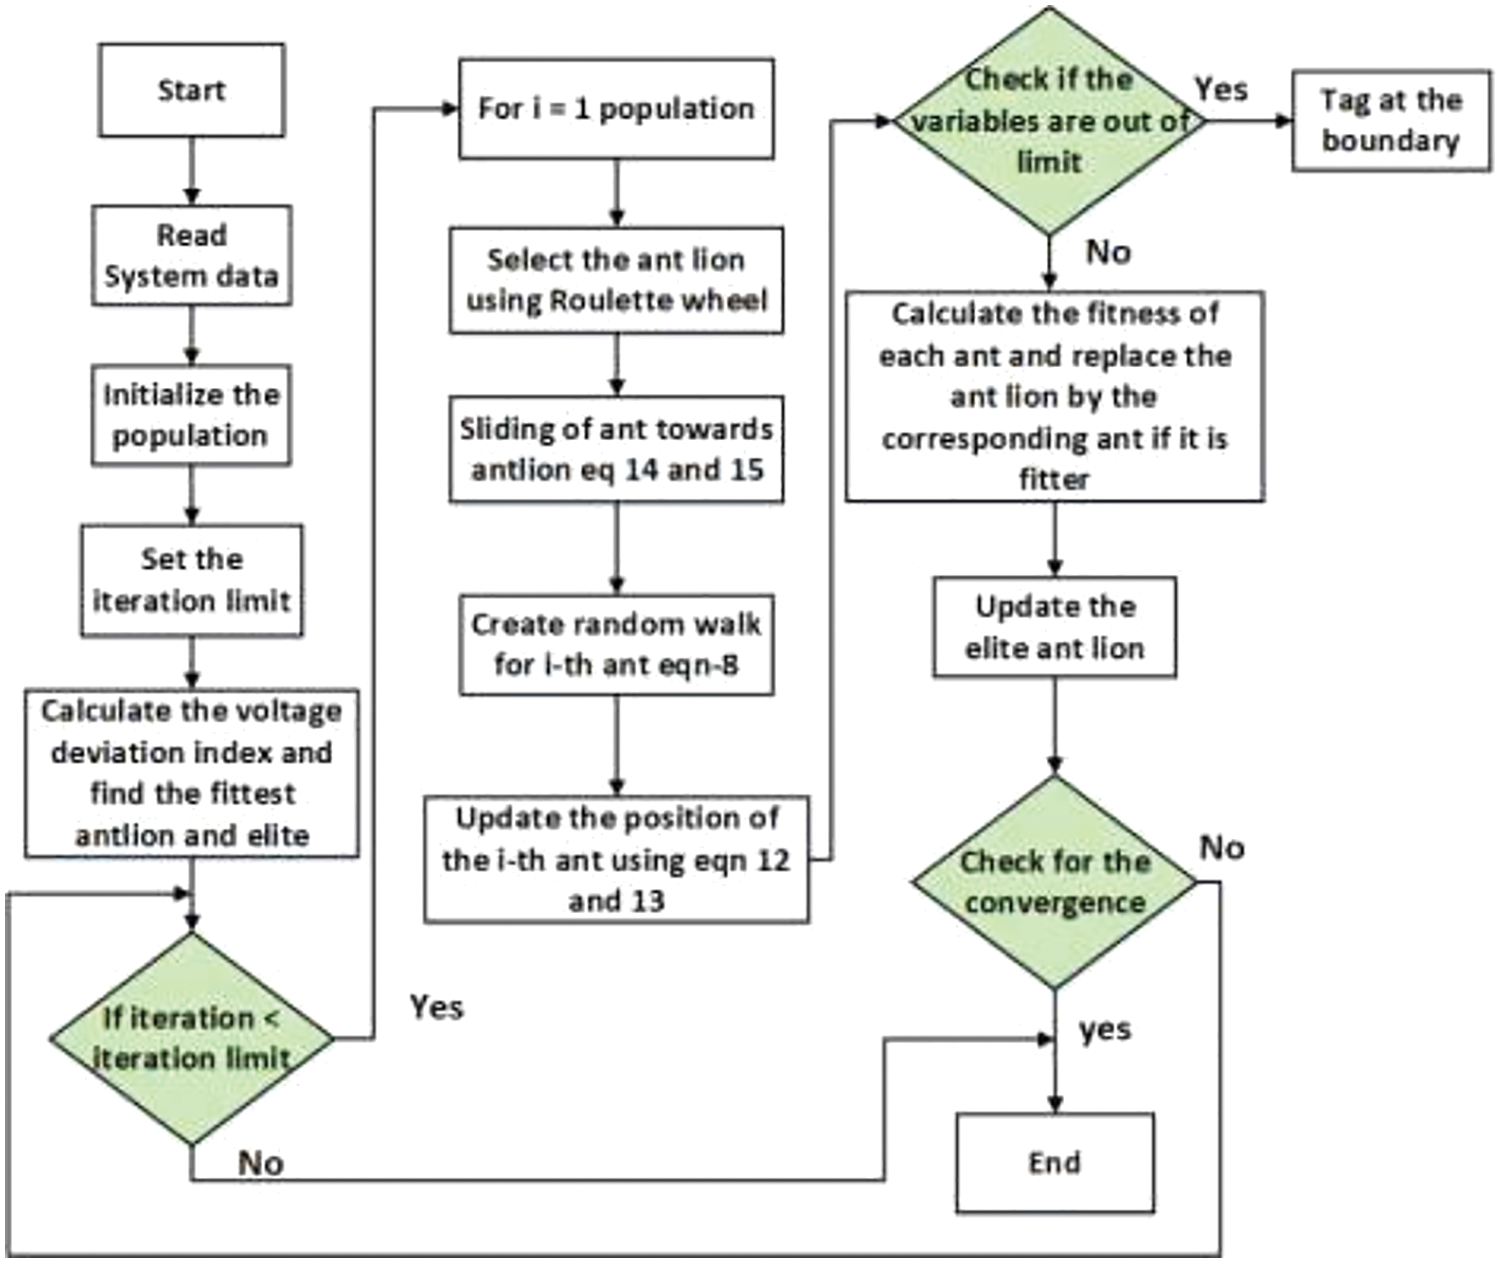
Figure 2: Flow chart for Ant lion optimization algorithm
The fitness values for the ants are stored in the form of a matrix and are a function of the objective function. In the same manner the fitness values of the antlions are also stored in another matrix. During each step f the iteration, the random walk of the ants is to be confined within the boundary of the search space. This is executed by Eq. (3), where
2.4 Falling of Ant Towards Antlion
The ants randomly walk without seeing the trap, so, it may fall down into the cone shaped trap. This is realized by adaptively decreasing the radius of the random walk as shown.
where,
Here, t is the current iteration and T is the maximum iteration and w is a constant.
Trapping of ant by antlion
The range of the random walk of the ith ant during tth iteration is modified as below in order to model the trapping behavior.
where, antlion is the position of the jth antlion during ith iteration
At this stage, the DBN model receives the chosen features and performs lung cancer classification. Typically, DBN is constructed by stacking Restricted Boltzmann Machine (RBM) that captures higher-order correlation that is noted in the visible unit. DBN is pretrained in an unsupervised greedy layer-wise manner for learning a stack of RBM through the Contrastive Divergence (CD) approach. The output depiction of RBM is utilized as the input dataset to train the RBM in the stack. Afterward the pretraining, the DBN is finetuned by BP of error derivative and the initial weight and bias of all the layers are corrected. RBM is an approach to represent each training sample in a compact and meaningful manner, by capturing the regularities and inner structure. This is realized by presenting an additional set of neurons named hidden unit to the network that value is indirectly fixed from training dataset [17]. On the other hand, visible unit obtains the value directly from training dataset. Obviously, the network contains three hidden nodes and four visible nodes. In the forward pass, the output
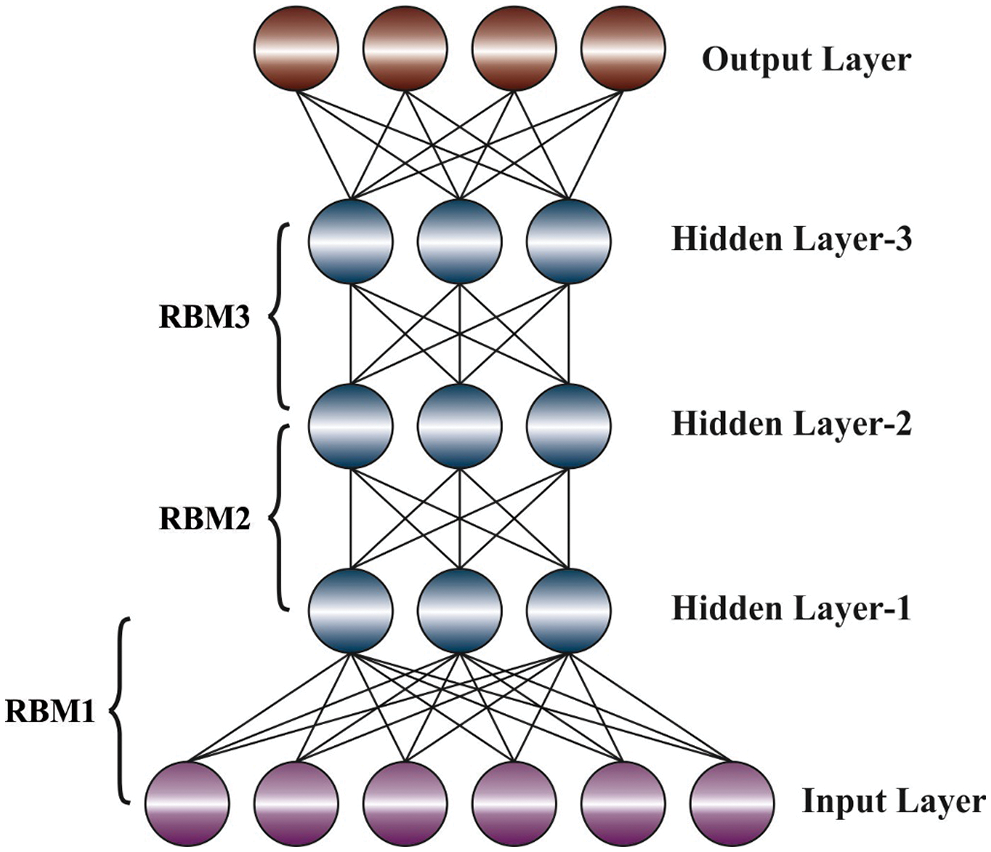
Figure 3: DBN structure
Consider the input dataset and the reconstruction is standard curve of distinct shapes. The aim is to reduce the error or diverging area in the two curves, named Kullback-Leibler
Therefore, the possibility distribution of a group of novel input x,
Consider P and Q represent the distribution of a constant arbitrary parameter; the KL-Divergence equation is determined below:
Now, p and q denote the density of P and
For good understanding of the CD approach, mathematical calculation is included.
Now v and h denote visible and hidden layers of RBM, correspondingly. The energy of joint configuration, (v, h) of the visible and hidden layers are determined below:
Now
Next, the joint possibility through v and h is calculated by:
Assume
The equation to update weight is estimated by taking derivative of
Here
The conditional probability of
Now,
Having Eqs. (12), (14), and (15), it is easier to attain an un-biased instance of
Now, recon represents the recreation stage.
Finally, the Adam optimizer is utilized for hyperparameter optimization of the DBN model. Simultaneously, the hyperparameter optimization of the DBN was performed by Adam optimizer. It is applied for estimating an adaptive learning value where the variable is employed for training the variable of the DNN [19]. It is effective and elegant technique for the first-order gradient with controlled storage for stochastic optimization. Here, the lately presented technique has been applied for resolving the ML problem with higher dimension variable space, and massive data evaluates the learning rate for various characteristics from calculation with initial and another order moments. In addition, the Adam optimizer is commonly employed according to the momentum and gradient descent (GD) methods, and a variation of an interval. Consequently, initial momentum has been gained b7:
The next momentum is expressed by,
Here
This section inspects the performance validation of the ALO-ODBN model using benchmark lung cancer dataset [20]. It comprises 32 samples with 56 features and 3 class labels.
Fig. 4 demonstrates a collection of confusion matrices produced by the ALO-ODBN model on distinct runs. On run-1, the ALO-ODBN model has identified 9, 13, and 9 class labels respectively. Moreover, on run-2, the ALO-ODBN methodology has identified 9, 12, and 10 class labels correspondingly. Furthermore, on run-3, the ALO-ODBN approach has identified 9, 12, and 9 class labels respectively. Along with that, on run-4, the ALO-ODBN technique has identified 9, 11, and 9 class labels respectively. In line with, on run-5, the ALO-ODBN algorithm has identified 9, 13, and 8 class labels correspondingly.
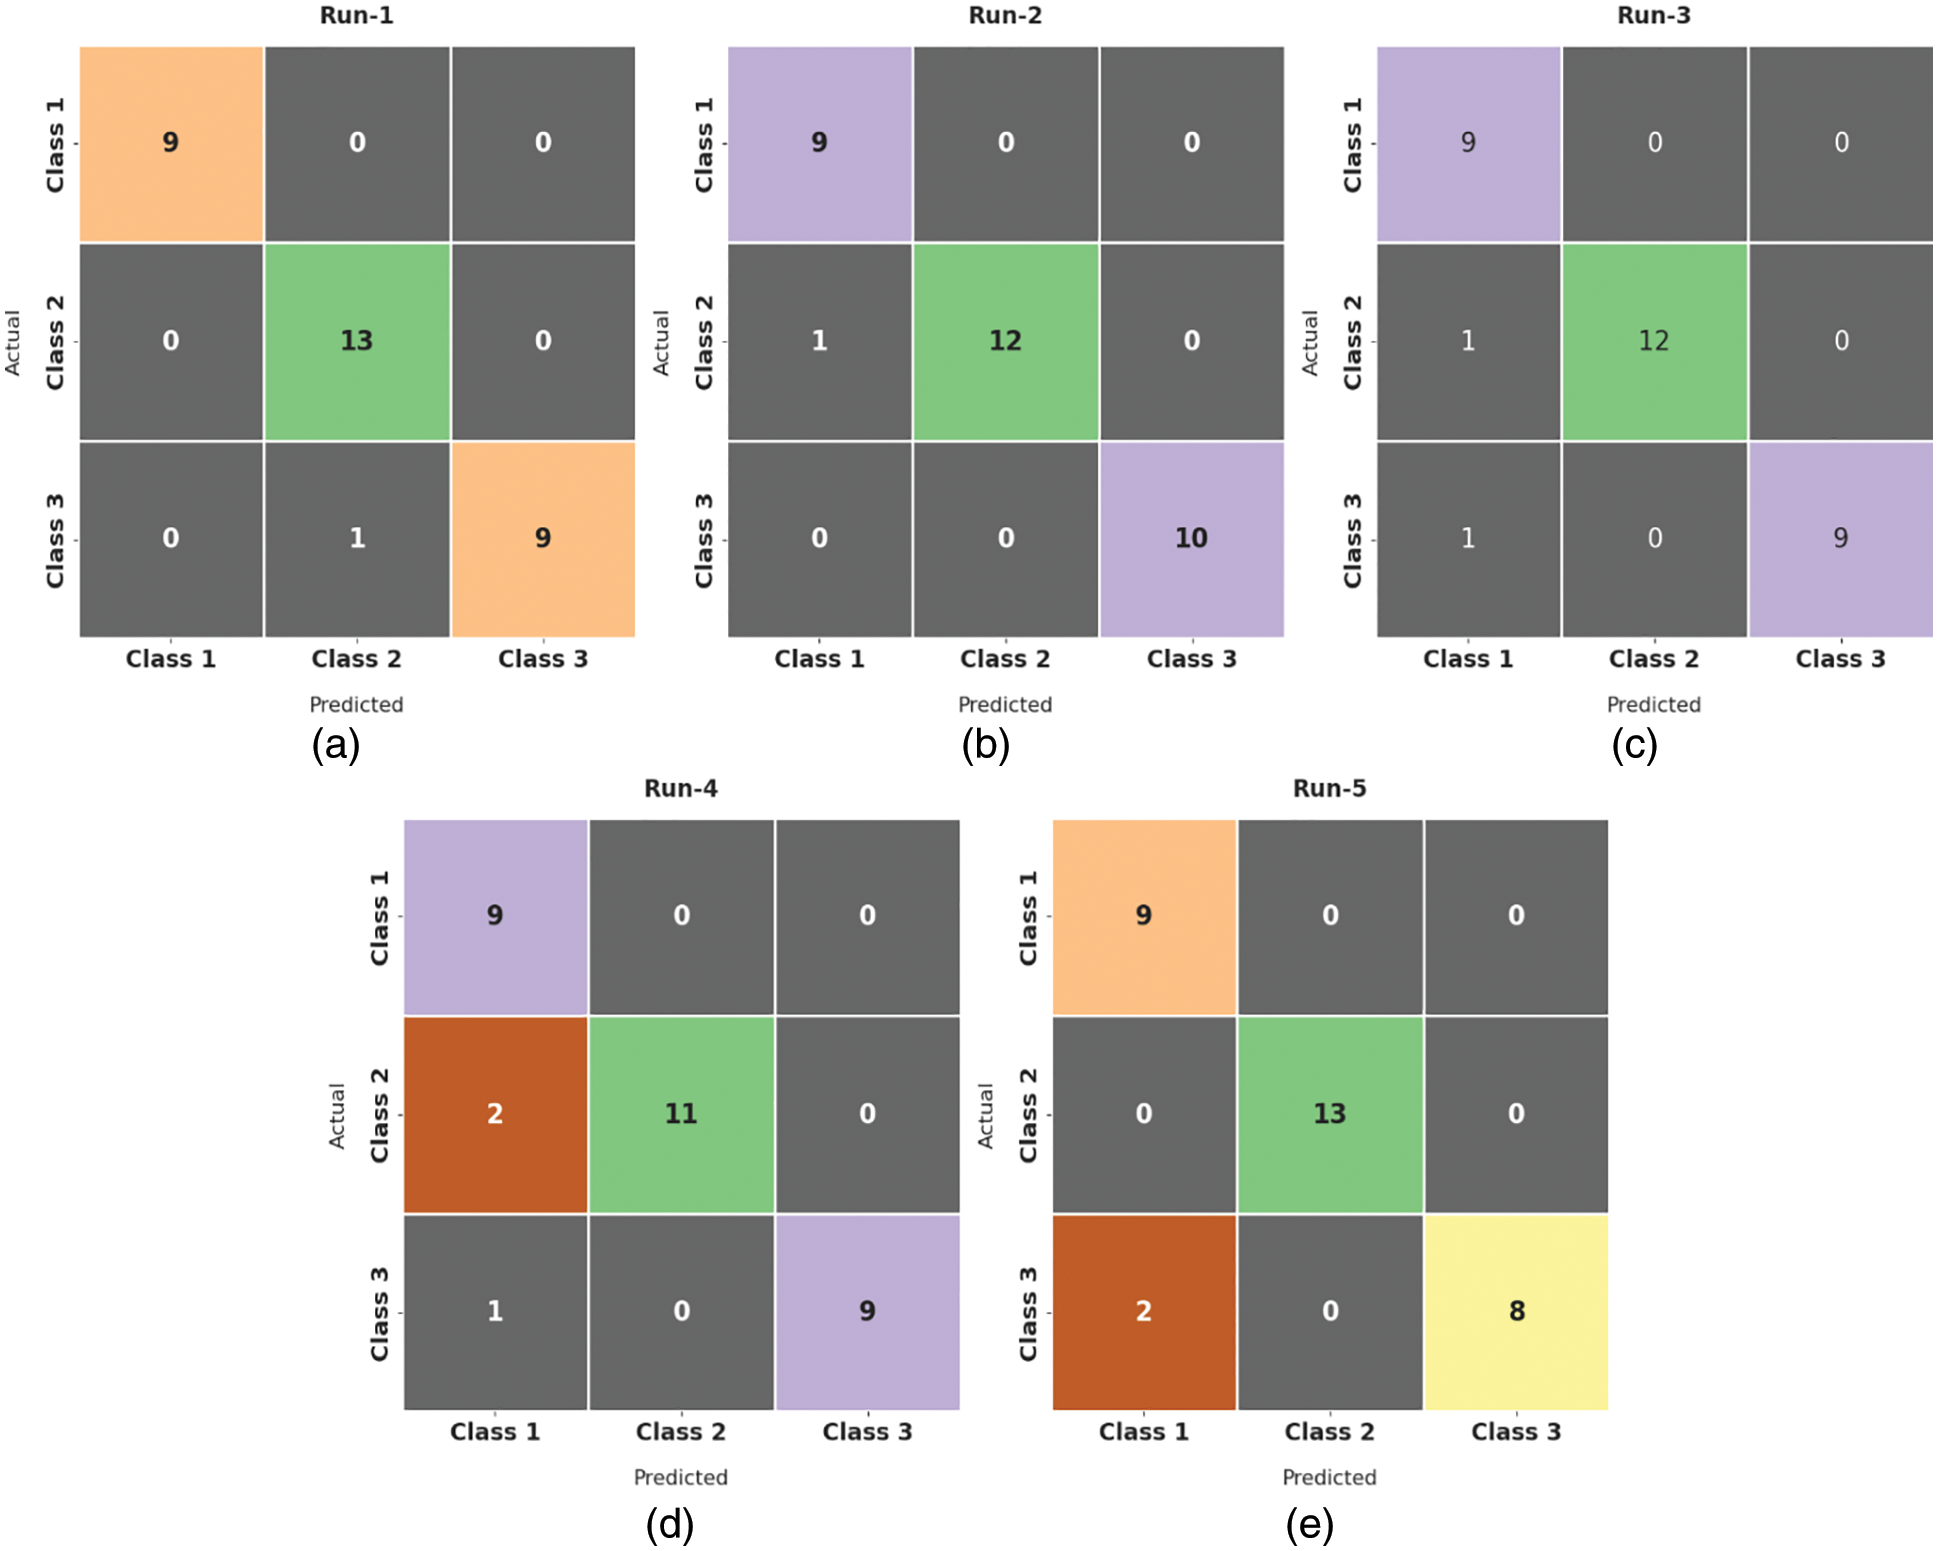
Figure 4: Confusion matrix of ALO-ODBN technique with distinct runs
Tab. 1 and Fig. 5 demonstrates brief classification results of the ALO-ODBN model using distinct runs. The results indicated that the ALO-ODBN model has accomplished maximum classification performance. For instance, with run-1, the ALO-ODBN model has provided an average

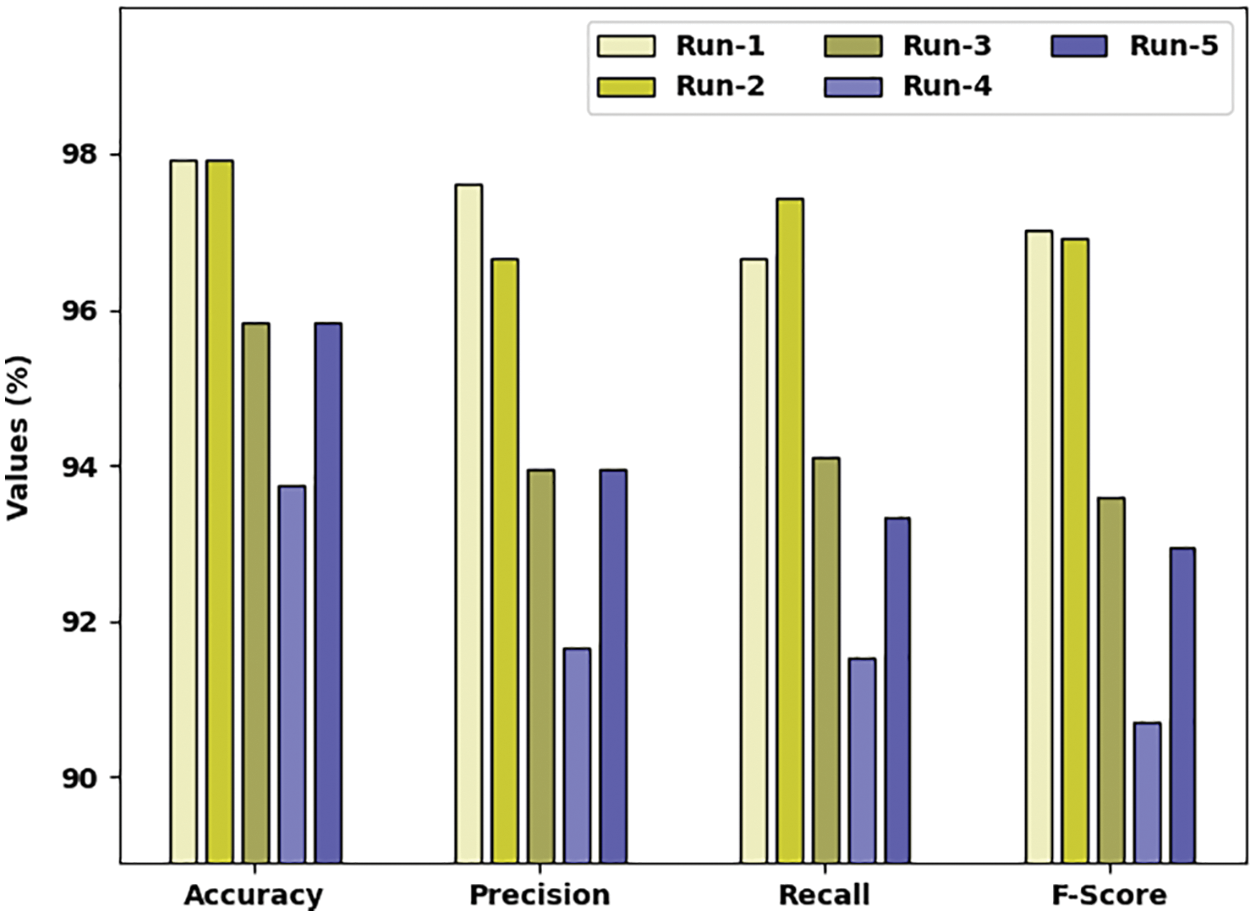
Figure 5: Result analysis of ALO-ODBN technique with distinct runs
The training accuracy (TA) and validation accuracy (VA) attained by the ALO-ODBN approach on lung cancer classification is demonstrated in Fig. 6. The experimental outcomes implied that the ALO-ODBN model has gained maximum values of TA and VA. In specific, the VA is seemed to be higher than TA.
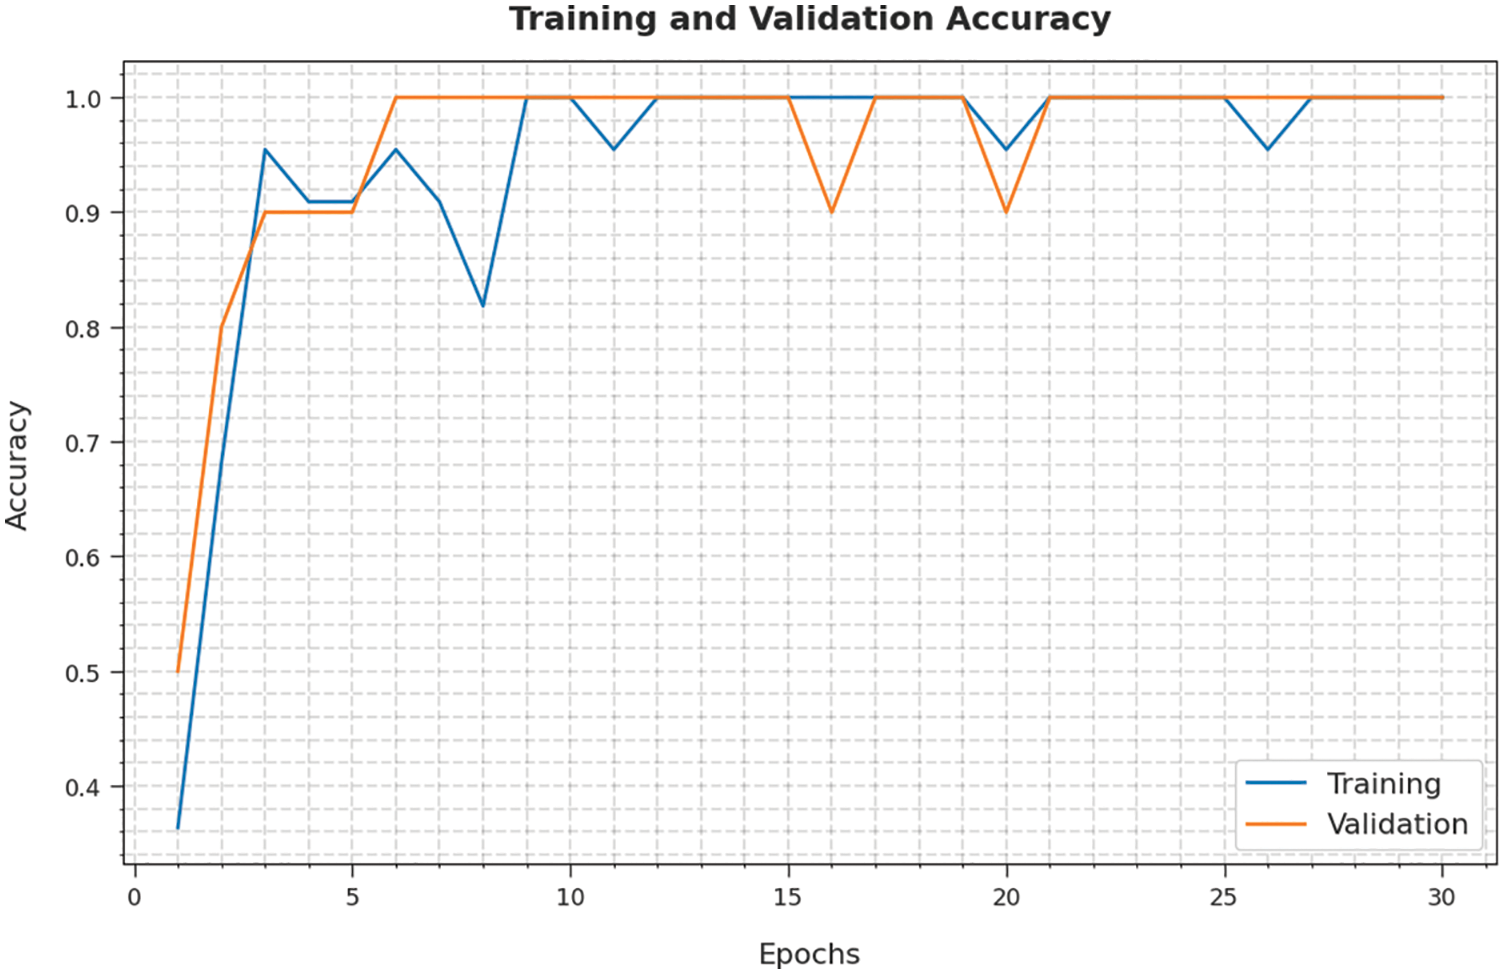
Figure 6: TA and VA analysis of ALO-ODBN technique
The training loss (TL) and validation loss (VL) achieved by the ALO-ODBN model on lung cancer classification are established in Fig. 7. The experimental outcomes inferred that the ALO-ODBN technique has accomplished least values of TL and VL. In specific, the VL is seemed to be lower than TL.
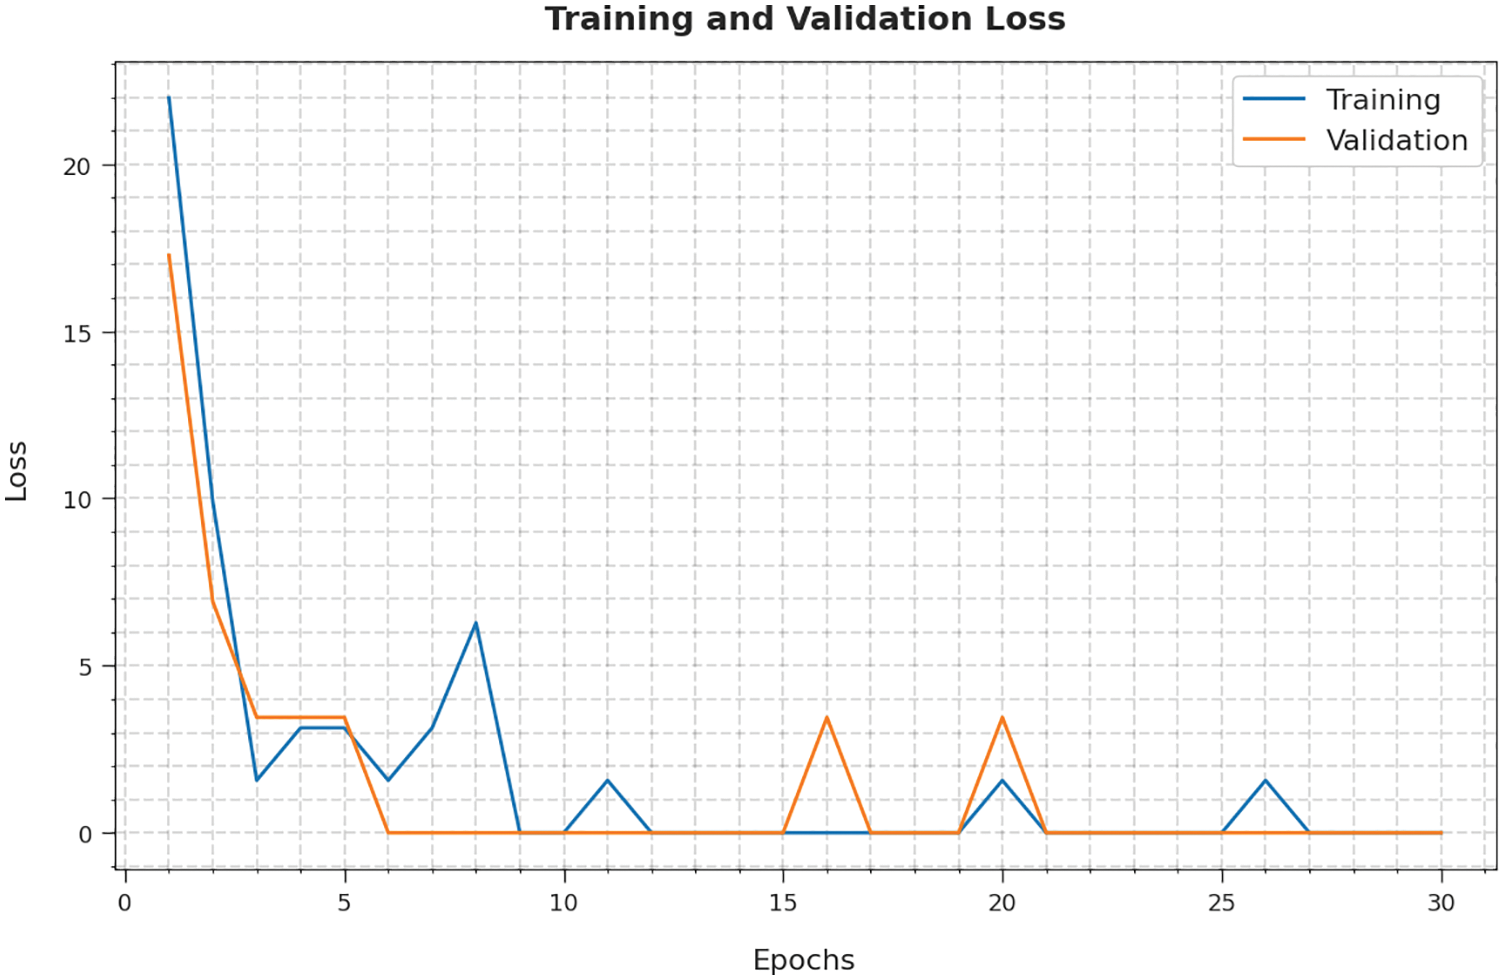
Figure 7: TL and VL analysis of ALO-ODBN technique
A brief precision-recall examination of the ALO-ODBN model on test dataset is represented in Fig. 8. By observing the figure, it can be stated that the ALO-ODBN approach has accomplished maximal precision-recall performance under test dataset.
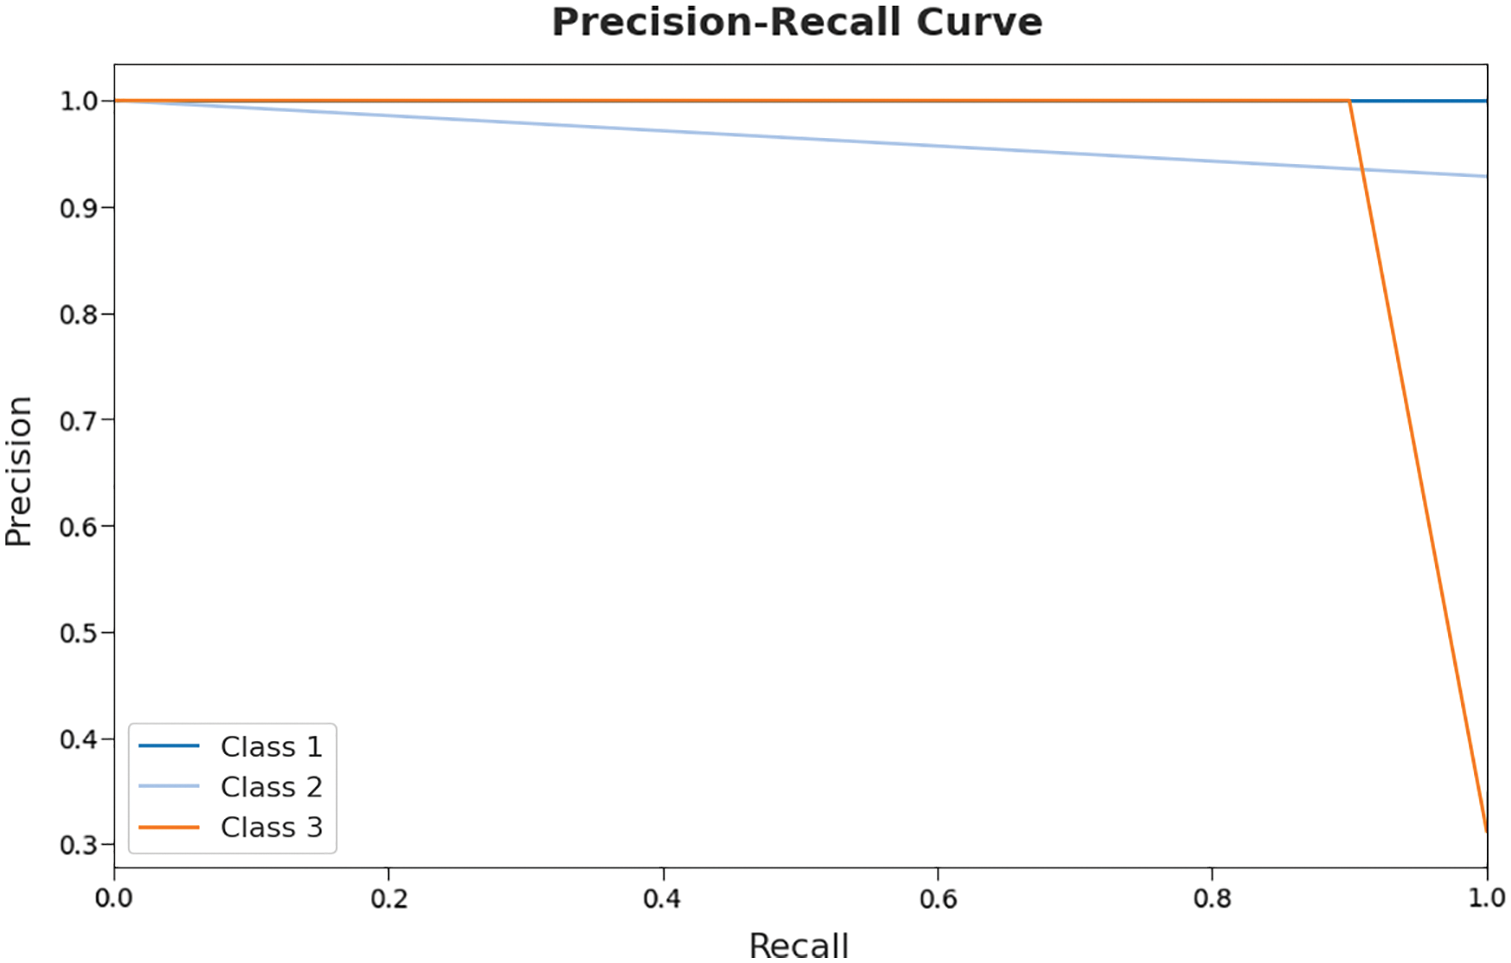
Figure 8: Precision-recall curve analysis of ALO-ODBN technique
A brief ROC investigation of the ALO-ODBN method on test dataset is depicted in Fig. 9. The results exposed that theALO-ODBN model has exhibited its ability in categorizing three different classes such as class 1, class 2, and class 3 on the test datasets.
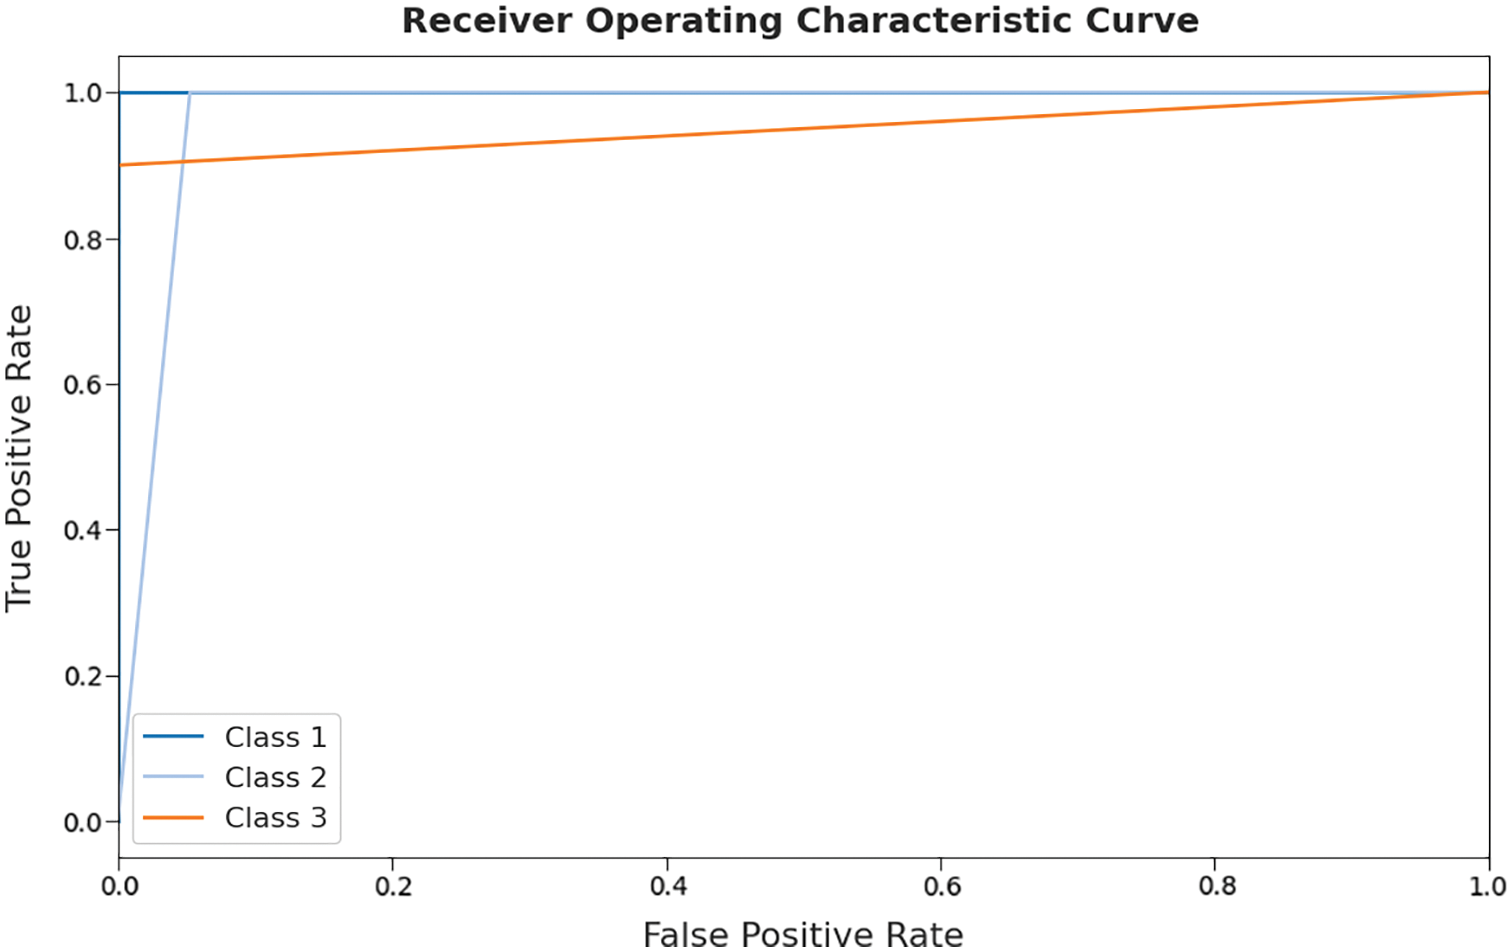
Figure 9: ROC curve analysis of ALO-ODBN technique
For ensuring the betterment of the ALO-ODBN model, a comparison study is made with existing models in Tab. 2 [21]. A detailed

A brief
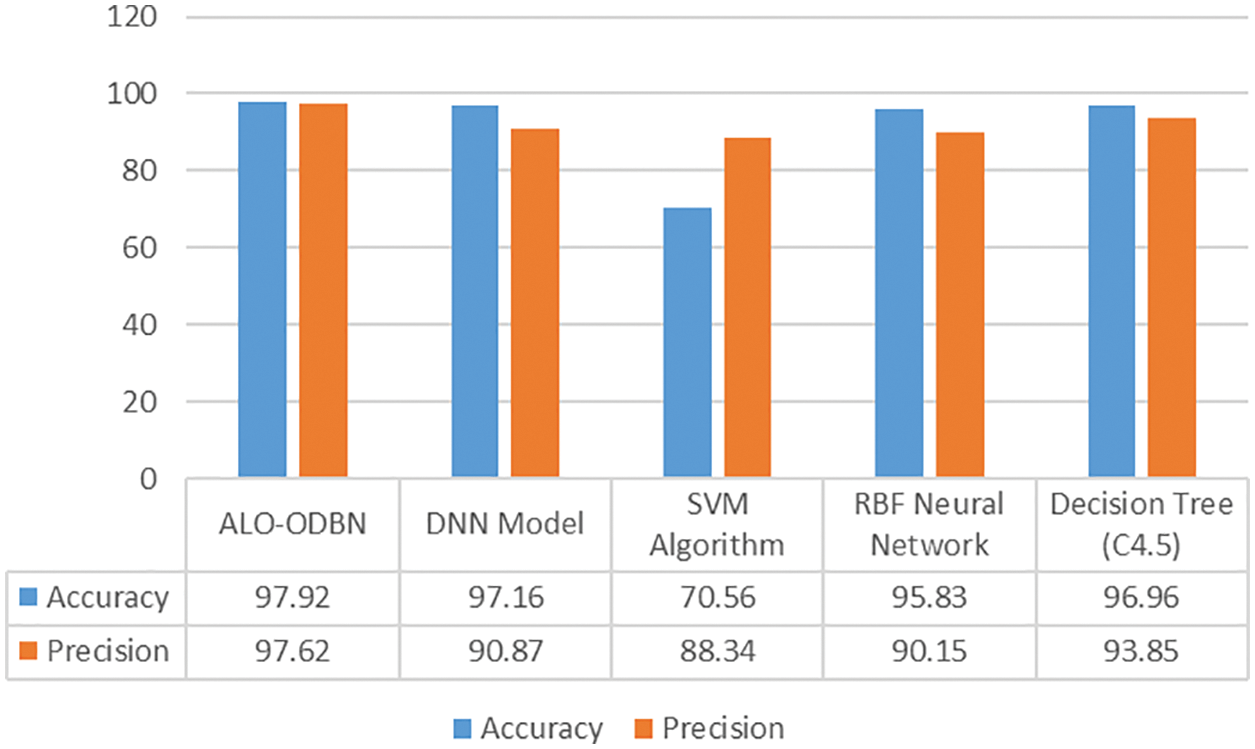
Figure 10:
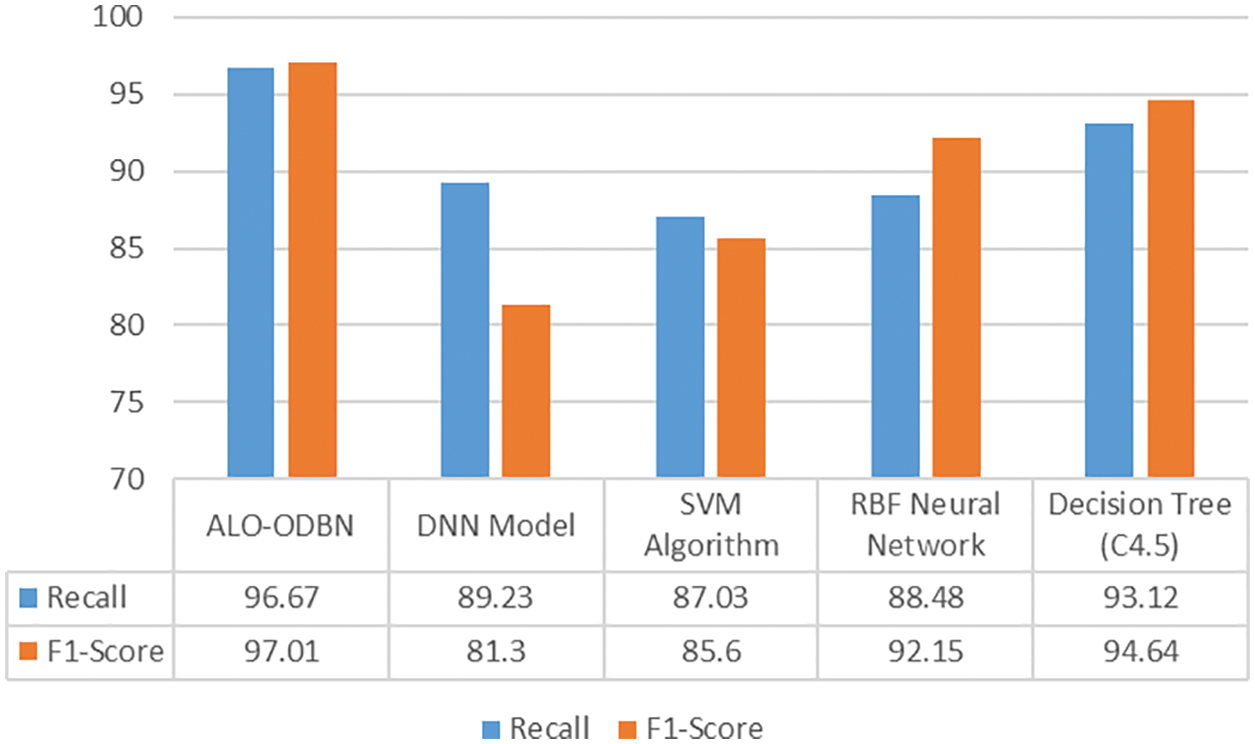
Figure 11:
From the above mentioned tables and figures, it is apparent that the ALO-ODBN model has outperformed the other methods interms of different measures. The overall survival rate detection of patient is improved when compared with other existing methods.
In this study, a new ALO-ODBN model has been developed for Lung Cancer Detection, Classification and survival rate prediction. The proposed ALO-ODBN model aims to identify and classify the presence of lung cancer. Initially, the ALO-ODBN model undergoes min-max data normalization approach to preprocess the input data. Besides, the ALO algorithm gets executed to choose an optimal subset of features. In addition, the DBN model receives the chosen features and performs lung cancer classification. Finally, the Adam optimizer is utilized for hyperparameter optimization of the DBN model. In order to report the enhanced performance of the ALO-ODBN model, a wide-ranging experimental analysis is performed and the results reported the supremacy of the ALO-ODBN model.
Funding Statement: The authors received no specific funding for this study.
Conflicts of Interest: The authors declare that they have no conflicts of interest to report regarding the present study
References
1. K. Ahmed, A. A. Kawsar, E. Kawsar, A. A. Emran, T. Jesmin et al., “Early detection of lung cancer risk using data mining,” Asian Pacific Journal of Cancer Prevention, vol. 14, no. 1, pp. 595–598, 2013. [Google Scholar]
2. P. Ramachandran, N. Girija and T. Bhuvaneswari, “Early detection and prevention of cancer using data mining techniques,” International Journal of Computer Applications, vol. 97, no. 13, pp. 48–53, 2014. [Google Scholar]
3. V. Krishnaiah, G. Narsimha and N. S. Chandra, “Diagnosis of lung cancer prediction system using data mining classification techniques,” International Journal of Computer Science and Information Technologies, vol. 4, no. 1, pp. 39–45, 2013. [Google Scholar]
4. Z. S. Zubi and R. A. Saad, “Using some data mining techniques for early diagnosis of lung cancer,” in Proc. of the 10th WSEAS International Conf. on Artificial Intelligence Knowledge Engineering and Data Bases, Cambridge, UK, pp. 32–37, 2011. [Google Scholar]
5. R. G. Ramani and S. G. Jacob, “Improved classification of lung cancer tumors based on structural and physicochemical properties of proteins using data mining models,” PloS One, vol. 8, no. 3, pp. e58772, 2013. [Google Scholar]
6. S. Shah and A. Kusiak, “Cancer gene search with data-mining and genetic algorithms,” Computers in Biology and Medicine, vol. 37, no. 2, pp. 251–261, 2007. [Google Scholar]
7. K. Ahmed, T. Jesmin and M. Z. Rahman, “Early prevention and detection of skin cancer risk using data mining,” International Journal of Computer Applications, vol. 62, no. 4, pp. 1–6, 2013. [Google Scholar]
8. D. Chauhan and V. Jaiswal, “An efficient data mining classification approach for detecting lung cancer disease,” in Proc. Int. Conf. on Communication and Electronics Systems (ICCESIEEE, Coimbatore, India, pp. 1–8, 2016. [Google Scholar]
9. F. Heydari and M. K. Rafsanjani, “A review on lung cancer diagnosis using data mining algorithms,” Current Medical Imaging, vol. 17, no. 1, pp. 16–26, 2021. [Google Scholar]
10. K. Juma, M. He and Y. Zhao, “Lung cancer detection and analysis using data mining techniques, principal component analysis and artificial neural network,” American Academic Scientific Research Journal for Engineering, Technology, and Sciences, vol. 26, no. 3, pp. 254–265, 2016. [Google Scholar]
11. N. Maleki, Y. Zeinali and S. T. A. Niaki, “A K-NN method for lung cancer prognosis with the use of a genetic algorithm for feature selection,” Expert Systems with Applications, vol. 164, pp. 113981, 2021. [Google Scholar]
12. A. Agrawal, S. Misra, R. Narayanan, L. Polepeddi and A. Choudhary, “A lung cancer outcome calculator using ensemble data mining on SEER data,” in Proc. of the Tenth Int. Workshop on Data Mining in Bioinformatics, San Diego, CA, USA, pp. 1–9, 2011. [Google Scholar]
13. B. Muthazhagan, T. Ravi and D. Rajinigirinath, “An enhanced computer-assisted lung cancer detection method using content based image retrieval and data mining techniques,” Journal of Ambient Intelligence and Humanized Computing vol. early access, pp. 1–9, 2020. [Google Scholar]
14. S. B. Lim, S. J. Tan, W. T. Lim and C. T. Lim, “A merged lung cancer transcriptome dataset for clinical predictive modeling,” Scientific Data, vol. 5, no. 1, pp. 1–8, 2018. [Google Scholar]
15. X. Qi, Z. Guo, Q. Chen, W. Lan, Z. Chen et al., “A data mining-based analysis of core herbs on different patterns (zheng) of non-small cell lung cancer,” Evidence-Based Complementary and Alternative Medicine, vol. 2021, pp. 1–13, 2021. [Google Scholar]
16. Y. Wu, B. Yan and X. Qu, “Improved chicken swarm optimization method for reentry trajectory optimization,” Mathematical Problems in Engineering, vol. 2018, pp. 1–13, 2018. [Google Scholar]
17. A. Fischer and C. Igel, “An introduction to restricted boltzmann machines,” in Iberoamerican Congress on Pattern Recognitio, Berlin, Heidelberg, Germany, Springer, pp. 14–36, 2012. [Google Scholar]
18. W. Almanaseer, M. Alshraideh and O. Alkadi, “A deep belief network classification approach for automatic diacritization of arabic text,” Applied Sciences, vol. 11, no. 11, pp. 5228, 2021. [Google Scholar]
19. Z. Zhang, “Improved adam optimizer for deep neural networks,” in Proc. IEEE/ACM 26th Int. Symp. on Quality of Service (IWQoSIEEE, Banff, AB, Canada, pp. 1–2, 2018. [Google Scholar]
20. Z. Q. Hong and J. Y. Yang, “Optimal discriminant plane for a small number of samples and design method of classifier on the plane,” Pattern Recognition, vol. 24, no. 4, pp. 317–324, 1991. [Google Scholar]
21. N. R. Murty and M. P. Babu, “A critical study of classification algorithms for lung cancer disease detection and diagnosis,” International Journal of Computational Intelligence Research, vol. 13, no. 5, pp. 1041–1048, 2017. [Google Scholar]
Cite This Article
 Copyright © 2023 The Author(s). Published by Tech Science Press.
This work is licensed under a Creative Commons Attribution 4.0 International License , which permits unrestricted use, distribution, and reproduction in any medium, provided the original work is properly cited.


 Submit a Paper
 Propose a Special lssue
 View Full Text
 Download PDF
 Downloads
 Citation Tools