
 Submit a Paper
 Propose a Special lssue
 Open Access
ARTICLE
Classification Model for IDS Using Auto Cryptographic Denoising Technique
1 Department of Computer Science & Engineering, PPG Institute of Technology, Coimbatore, Tamilnadu, India
2 Department of Computer Science & Engineering, SNS College of Technology, Coimbatore, Tamilnadu, India
* Corresponding Author: P. Sivaprakash. Email:
Computer Systems Science and Engineering 2023, 45(1), 671-685. https://doi.org/10.32604/csse.2023.029984
Received 16 March 2022; Accepted 28 April 2022; Issue published 16 August 2022
 View Full Text
 Download PDF
Abstract
Intrusion detection systems (IDS) are one of the most promising ways for securing data and networks; In recent decades, IDS has used a variety of categorization algorithms. These classifiers, on the other hand, do not work effectively unless they are combined with additional algorithms that can alter the classifier’s parameters or select the optimal sub-set of features for the problem. Optimizers are used in tandem with classifiers to increase the stability and with efficiency of the classifiers in detecting invasion. These algorithms, on the other hand, have a number of limitations, particularly when used to detect new types of threats. In this paper, the NSL KDD dataset and KDD Cup 99 is used to find the performance of the proposed classifier model and compared; These two IDS dataset is preprocessed, then Auto Cryptographic Denoising (ACD) adopted to remove noise in the feature of the IDS dataset; the classifier algorithms, K-Means and Neural network classifies the dataset with adam optimizer. IDS classifier is evaluated by measuring performance measures like f-measure, recall, precision, detection rate and accuracy. The neural network obtained the highest classifying accuracy as 91.12% with drop-out function that shows the efficiency of the classifier model with drop-out function for KDD Cup99 dataset. Explaining their power and limitations in the proposed methodology that could be used in future works in the IDS area.Keywords
The usage of computer systems and the Internet has recently resulted in major protection, confidentiality, and privacy difficulties due to the procedures involved in the electronic transformation of data. More work has indeed been transformed into enhancing the user privacy of systems, but systems have all these issues. The aim about an ID is to track a site or server and identify any sort of irregular activity inside the network. Barbara et al. (2002) [1] explains that IDSs may be either IDS host-based or IDS network-based. By observing particular network incidents, NIDSs identify attacks while HIDS identifies intruders in individual hosts. An Intrusion detection system checks a network protocol that detects the raw packets from a segment of the local networks via the software. In an attempt to identify threats which may be overlooked by HIDS, it can also monitor further network objectives although Influenced by social media cannot read incoming packets and could not detect several types of threats. Currently, there’s really no device that’s also absolutely stable in the world. In particular, numerous forms of malicious activities occur as described by wespi (2000) [2]. When a new signature with unusual behaviour is added to the signature database, these attacks develop. Such threats evolve where in the attack patterns there is a new signature with an irregular activity. One such tool allows a number of network structures, cloud storage and data management to be tracked Peng, et al. (2020) [3] and Liang et al. (2019) [4]. The IDS could efficiently detect attacks aimed at undermining a system’s security characteristics such as integrity, reliability and confidentiality. In this paper explained the number of networks, cloud storage and information systems to be correctly classified and evaluated the performance measures. Section 2 explains the related work; Section 3 explains the Classification Methodology; Section 4 describes the implementation; and finally Section 5 conclusion have been done.
Hussein et al. (2020) [5] introduced a framework aimed at establishing node clusters for the distribution of data across all network nodes. The purpose of most WSN attacks is either to restrict or eliminate the capacity of the network to conduct its planned working procedures, as defined by Ioannouou (2017) [6]. As explained by zhang et al. [7]. One of those attacks is a DoS attack Suhaimi et al. (2011) [8]. One such attack is carried out by system crash, malfunction, depletion of resources, malicious transmission of elevated signals, and minimizing system performance Peng, et al. (2019) [9]. Many bits of study show that several current prevention strategies are not enough to protect the network’s data packets and sustain WSN’s operation. For example, since NIDS can only display packet headers as they move through the channel, it can detect possible certain IP-based DoS attacks. NIDSs, furthermore, do not depend on the host’s device (OS) as an identifying source, rather HIDSs rely on the Operating system to work efficiently. Aldweesh (2020) [10] surveyed the Intrusion detection hybrid IDSs that incorporates client and network-based capabilities. Afiq et al. (2019) [11] explained that ID approaches may also take the form of identification of misuse or identification of anomalies. Attack monitoring detects intrusions by seeking known patterns of activities. Present commercial NIDSs use this technique. A detriment to avoiding misuse would be that unknown threats cannot be spotted. Relevant approaches were used to classify threats, such as analyst networks, grants given, traditional aesthetic, and data analysis. The expert system employs a set of rules, as given by Barbara et al. (2002) [1], to describe invasions. Brady et al. (2017) [12] explained that audit incidents are translated into facts bearing their semantic meaning. Then, an inference engine can make judgments using those rules and arguments. The signature-based evaluation relies on the interpretation of known attacks even during inspection trail ; the attack is recognized as an attack operation that suits for an already defined attack signatures. Aquize (2017) [13] implemented the self organize map for anomaly detection. Here, for ID, machine learning algorithms can be proposed. The method of extracting significant yet missing data data or patterns from a given collection of data is data mining. Genes or structures, such as rules, instance-based cases, decision sequences and machine learning, can be described for other purposes. Data mining technologies are commonly used to detect violence. The behaviour of machine learning approaches and procedures that rely on the association rules algorithm is explained by Nalisnick et al. (2019) [14]. Intrusion detection also use decision trees (DT) and association rules. By combining hybrid testing and hierarchical feature networking, Jiang et al. (2020) [15] developed a network-based intrusion detection technique. With the NN algorithm, the IDS output is improved. Abnormality detection is used to compensate for misuse detection’s inability to recognise unknown threats. The complexity of developing a system with such properties is larger in the case of misuse detection, according to Elhag et al. (2015) [16]. In the field of edge computing it is pointed out that security of outsourcing data is still have an issue as described by Zhang (2019) [7] in his research. Shah et al. (2018) [17] also point to a higher percentage of false alarms, as well as a poor detection rate]. Ragav et al. (2013) [18] describe how an uneven dataset affects model evaluation. False alarm rates, low detection rates, unbalanced datasets, and response time are all issues. More IDS categories have recently been pushed for by Singh et al. (2015) [19]. Shone et al. (2020) [2] implemented non-symmentric variant deep learning technique. By studying the recent papers there is no concrete implementation hidden layer denoising classifier with optimizer. To fill this gap the proposed methodology evaluated the IDS using by measuring classifiers performance metrics with and without dropout; where data imbalance problem with low detection rate is achieved.
Machine learning is a strong collection of neural-network learning algorithms. The neural net is an underlying biological framework that allows computers to learn from observations. The multiple hidden layers inside a convolutional neural network, with each hidden layer acting itself as a machine learning techniques. DNN’s basic structure consists of a feed back layer, a number of hidden layers, and an output layer. When preprocessed input is fed into the learning algorithm, the output values can be calculated sequentially throughout the network’s hidden layers. K-means is the classifies data under unsupervised machine learning. In this section the three steps is presented. The first is pre-processing; second, Auto Crptographic Denoising with dropout and without dropout; and the third is Classification. Fig. 1 represents the architecture of the proposed model.
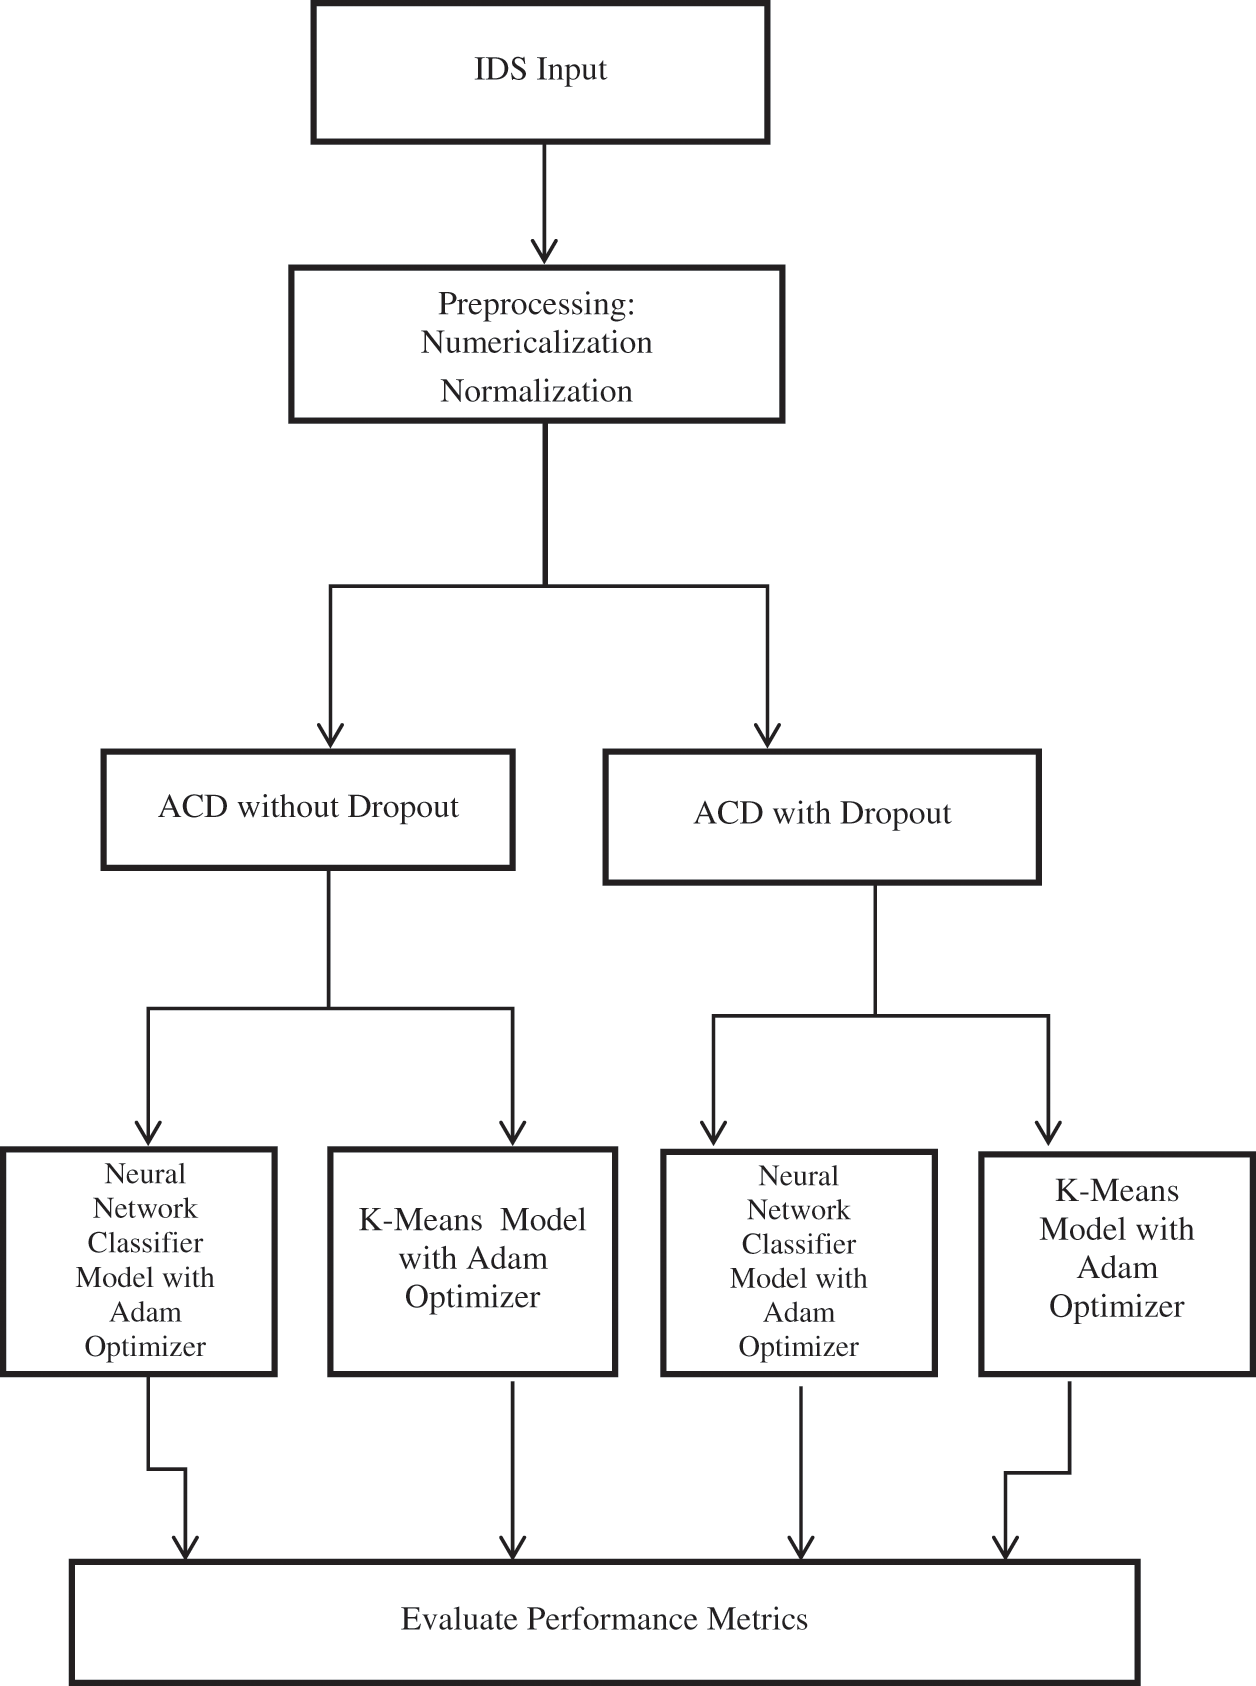
Figure 1: Proposed classification for IDS
Preprocessing is a technique to have attributes type conversion. This is carried-out by numericalization and normalization process. Numerilicalization is the process of converting the dataset in the structured format and normalization is the process to minimize or exclude the duplicate data.
i) Numericalization:
Features 2, 3 and 4 (i.e., Protocol_type, Service and Flag) of NSL-KDD were represented as non numerical. ACD technique accepts only the numeric matrix for denoising. For this purpose, the values of features are converted to numeric form in both test and training data set. The encoded binary vectors of udp, tcp, icmp are (0, 1, 0), (1, 0, 0) and (0, 0, 1). There are other features such as 70 type of attributes for the feature service and 11 type of attributes for the feature flag. So after numericalization the 41 feature is mapped to dimensionality of 122 feature.
(ii) Normalization:
The logarithmic scaling method is used to have same range of values for the features such as duration, src_bytes and dst_bytes which have high values. Finally using min–max scaling every feature values is mapped to [0, 1].
3.2 Auto Cryptographic Denoising (ACD) with and Without Dropout
Generally denoising reduces the feature pool of the dataset. In IDS, the dataset in cloud environment the data security is more important. In order to reduce the feature pool efficiently with security the cryptographic technique is used for denoising called ACD (Auto Cryptographic Denoising). Fig. 2. describes about Neural Network with dropout where X1, X2, X3, X4 are inputs with three hidden layers and Output node Ŷ M. Gnouma et al. (2019) [20].
Figure 2: Fuzzy modeling
With a feed forward network, auto encrption is a sort of neural network in which the input and output are the same. Its goal is to learn compressed data with the least amount of loss possible. It have three steps such as encrpt, decrpt and code. The encrpter encodes by compressing the input produces the code and decrpter decodes the code that produced by encrpter. This code layer is learned by auto encrpt for determining useful features A. ElAdel et al. (2017) [21]. That is, by adding random noise data and making to subtract the noise data from the original data. So that auto encrpter cannot relay the input as it contains random noise data. This process is called ACD.
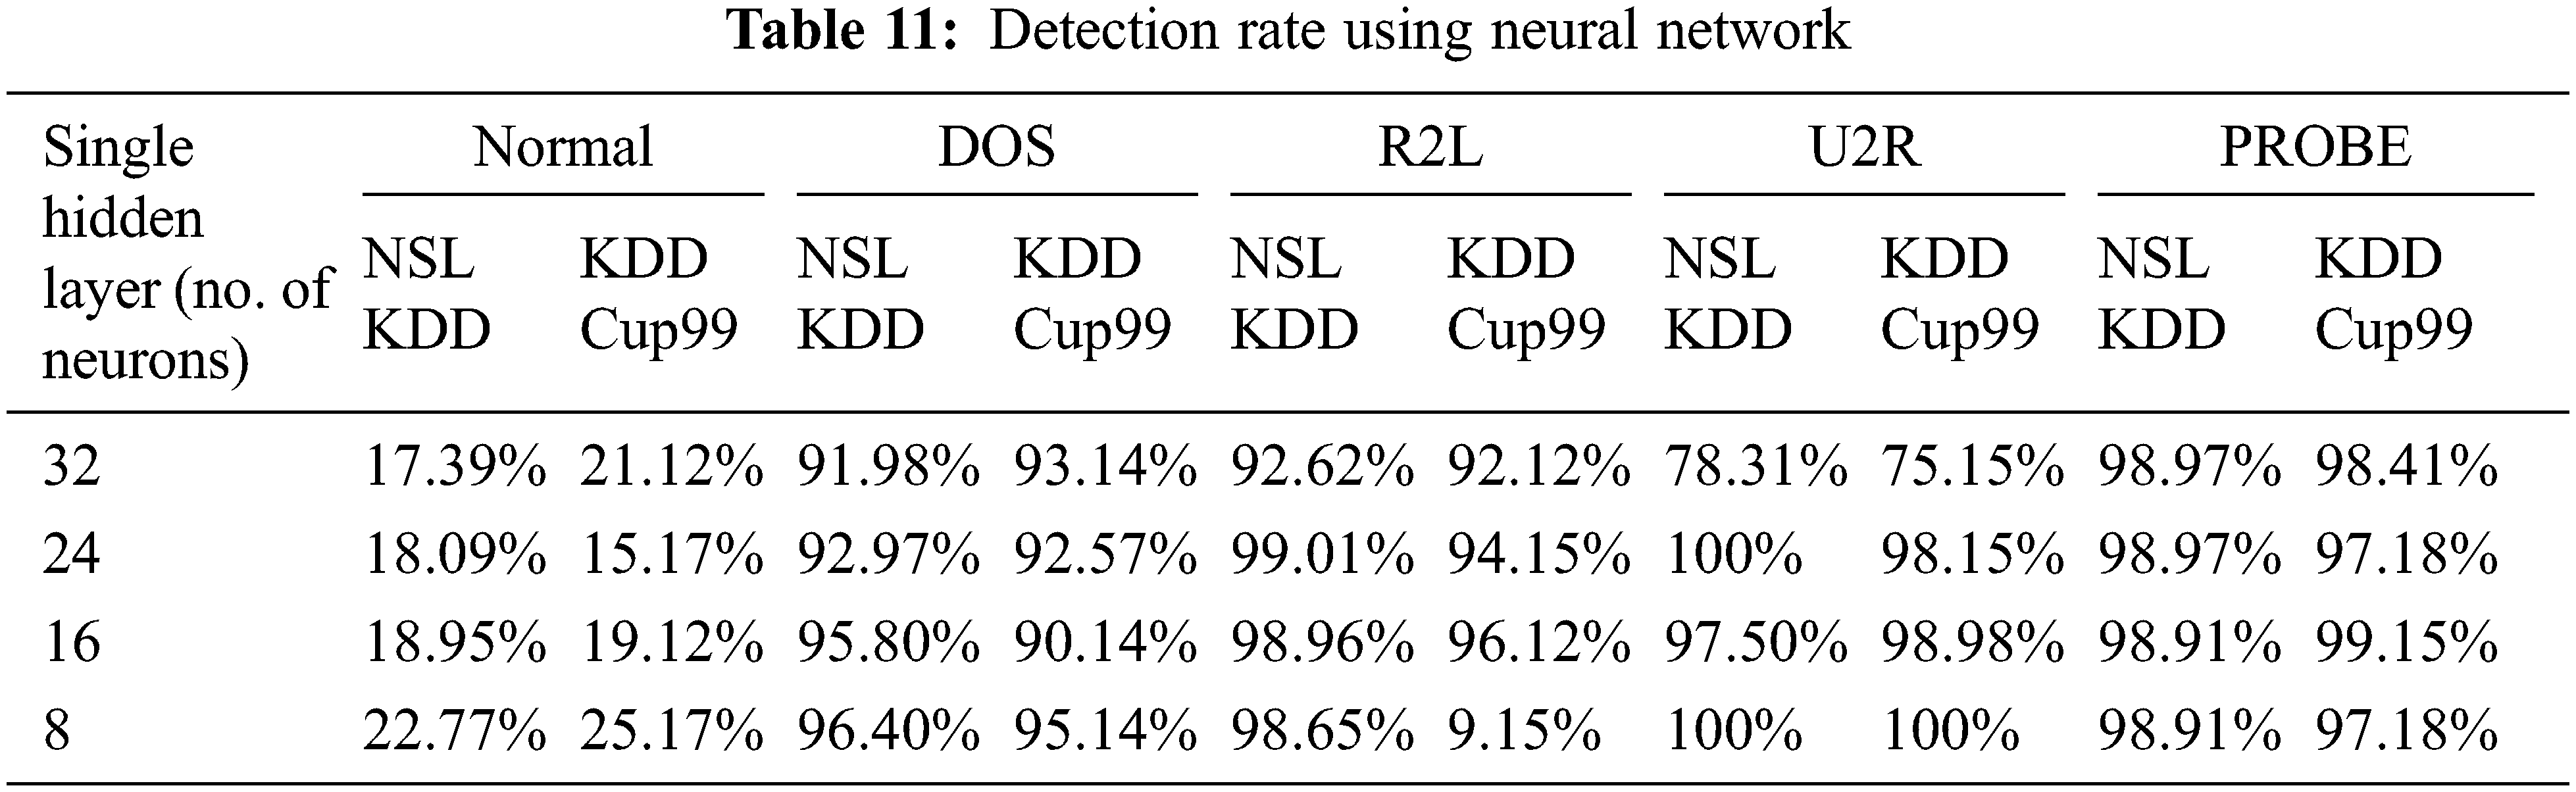
Dropout aims to interpret the hidden layers in neural network by adding noise Dahl et al. (2013) [22]. Randomly the with fixed probability the features can be dropped out independently Senthil Kumar (2015) [23]. The Dropout (noise) is added to the Denoising Autoencrypter’s input layer in our system. We recommend a DEA with Dropout dependent anomaly detection system for only intrusion detection, which is a deviation-based anomaly detection approach whose training only comprises instances of ordinary traffic without marking. The reconstruction error obtained is the anomaly score. The anomaly score is calculated using the reconstruction error. The outcome is also examined without the use of the drop out function. The ACD algorithm with and without dropout is shown in the Tab. 11 below.
3.3 Classification Methodology
The features of the extracted dataset are categorized, and performance measures are assessed. The ACD drop-out function is used to create the neural network classification model, and performance measurements are examined. The performance of a K-means classifier model is tested without the use of a drop-out function. The dataset that identifies intrusions in the cloud environment is classified by the classifier model.
i) Neural Network
The Architecture for two inputs, the first order fuzzy model with two rules is shown in Fig. 2.
Layer 1: Fuzzification layer
Assume the inputs X and Y and output Z.
Rule 1: if X is A1 and Y is B1, then f1 = p1X + q1Y + r1
Rule 2: if X is A2 and Y is B2, then f2 = p2X + q2Y + r2
Here every node i in this layer is an adaptive node with a node function,
Layer 2: Rule antecedent layer
This layer includes the nodes which represents the antecedent part of an association rule. The output of each node is given as
Layer 3: Strengthen the normalization layer
Weight obtained in layer 2 is normalized by fixed nodes that present in this layer. The output of the normalization layer is given as,
Layer 4: Consequent layer
The adaptive nodes included in this layer are the products of normalization strength in polynomial order.
Layer 5: Inference Layer
The overall output is given as,
In layer 1 the eight modifiable parameters ci and σi where i = 1, 2, 3, 4. Modifiable parameters ri, si, and ti for i = 1, 2 in layer 4 six
ACD with Drop-outs on the inputs has a 122-neuron activation function Shone et al. (2018) [24] considering the fact where each sample has 122 features, a Dropouts layers with a specified likelihood of 0.5. 8, 16, 24 and 32 are the neuron units with a single loss function with unique numbers. So the auto encoder’s hidden representation has compression ratio of 122 as 8, 16, 24, and 32 by learning interesting pattern and relations.
ii) K-Means
Generally, K-means algorithm is implemented in finding the intrusions in NSL KDD that is widely used for internet traffic without drop-out. Fig. 3 represents the procedure for K-means algorithm.
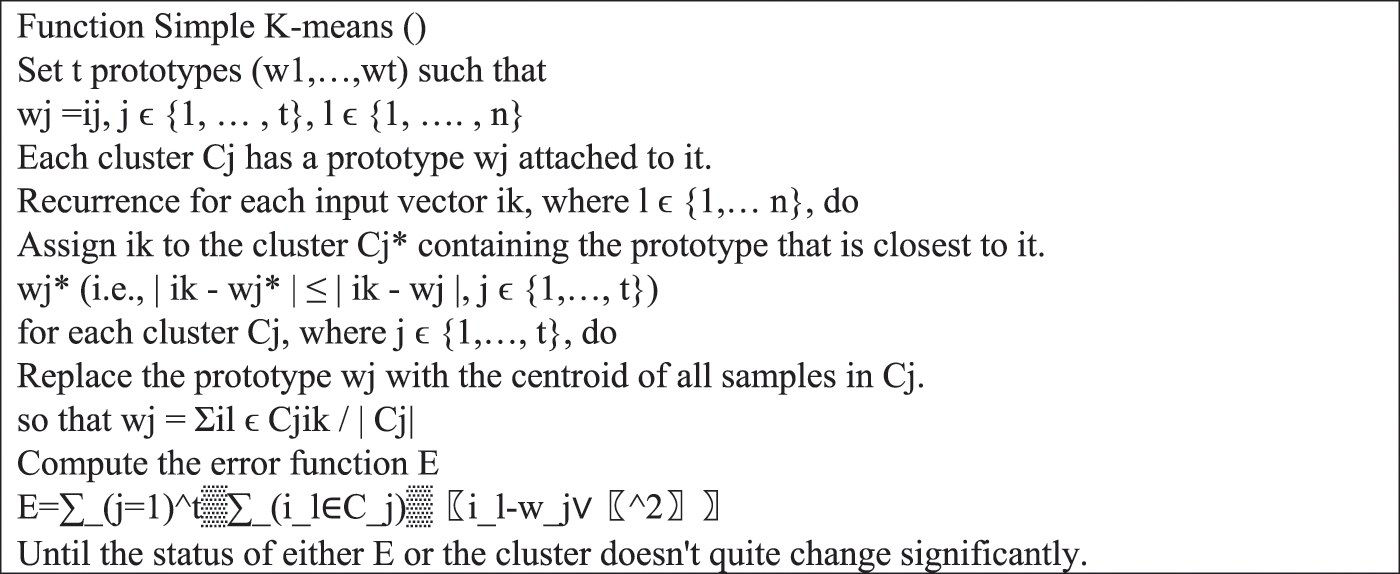
Figure 3: Pseudocode of K means algorithm
The goal of K-means clustering is to divide data into k groups so that data points in the same cluster are similar and data points in other clusters are quite far away. The gap between adjacent locations determines their similarity. The distance can be measured in a variety of ways. One of the most often used distance metrics is the Euclidean distance. The diagram below illustrates how to determine the euclidean distance between two locations in a two-dimensional space. The square of the difference between the x and y coordinates of the locations is used to compute it. The clusters formed that is associated with the prototype that assigned. The cluster prototype is updated to have centroid for current samples. The error function is calculated E.
a. NSL KDD Dataset
The network traffic records in the NSL KDD dataset are the traces of traffic that a real intrusion detection system observed, leaving only evidence of its presence. The dataset comprises 43 features per record, 41 of which are related to the traffic input and the last two of which are labels (whether it’s a standard or attack) and score (the severity of the attack) Chen et al. (2020) [25].
Despite the fact that these attacks are present in the data, the distribution is substantially skewed. Tab. 1. above shows a breakdown of the record distribution. Essentially, typical traffic makes up more than half of each data set’s records, and the distribution of U2R and R2L is extremely low. Although this is a low number, it accurately represents the distribution of modern-day internet traffic attacks, with DoS being the most common, and U2R and R2L being rare.
b. KDD Cup 99 Dataset
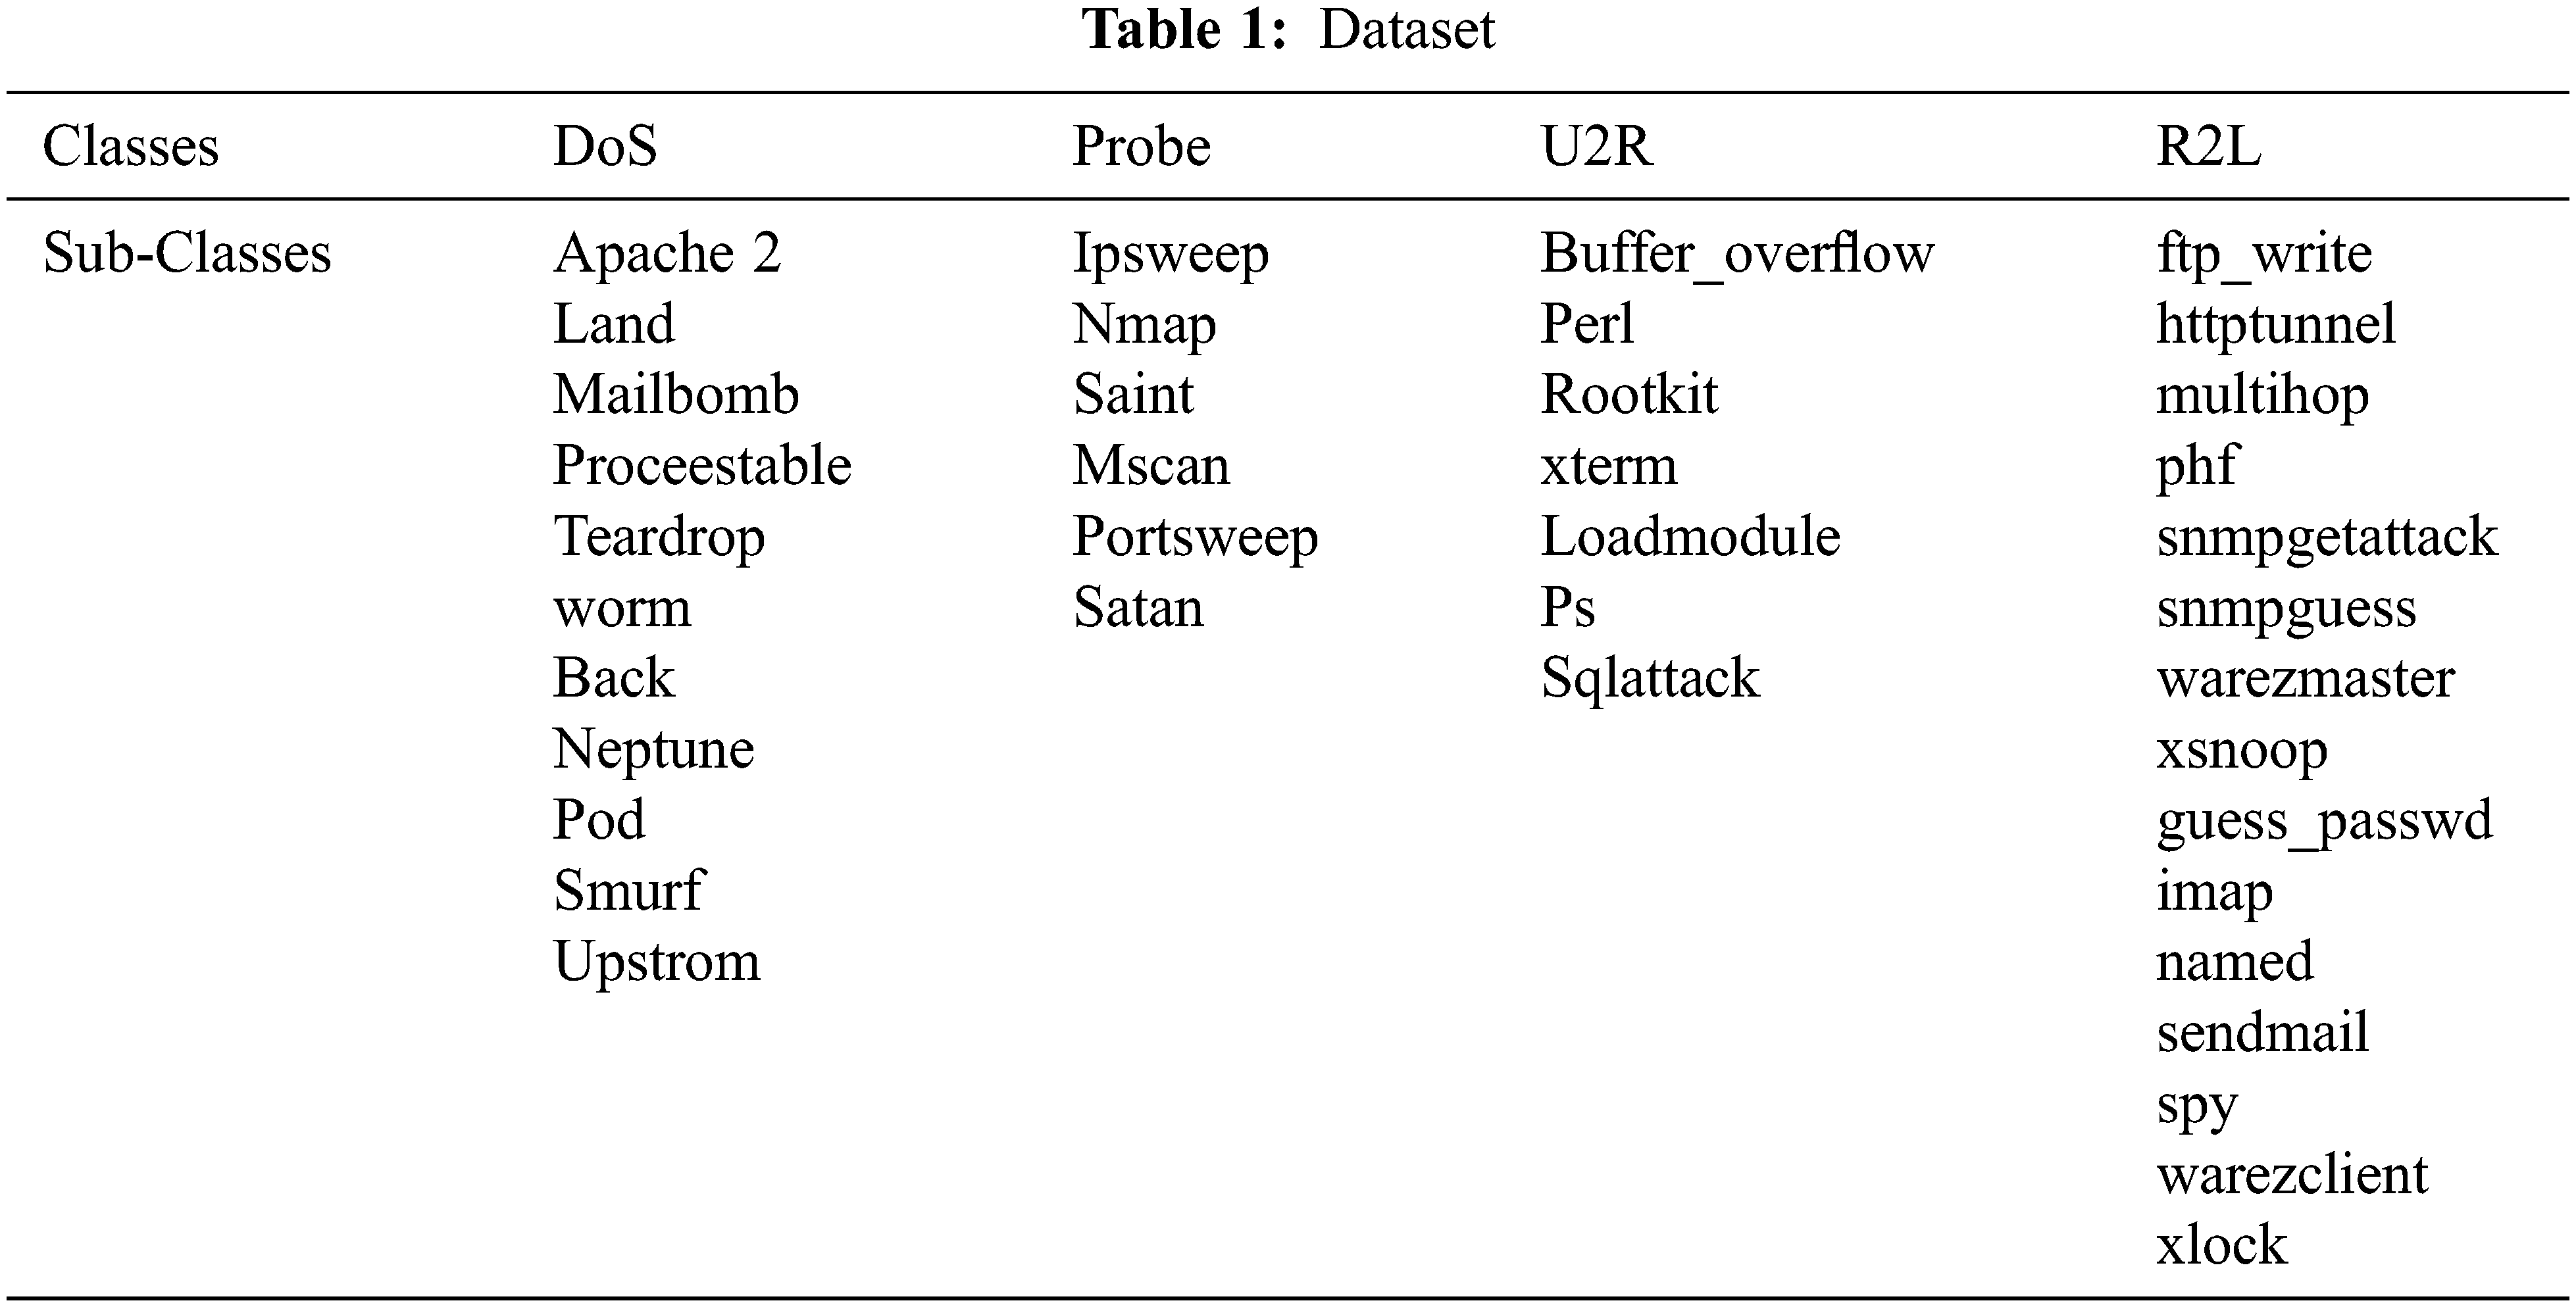
The KDD Cup99 dataset comprises around 4GB of packed data gathered over roughly 7 weeks of network traffic data. It has 41 traffic flow characteristic properties and is divided into two classes: regular and malicious. The Dataset comprises several assaults, including a Denial of Service (DOS), a User to Root (U2R), a Remote to Local (R2L), and a Probing Attack.
4.2 K-means Clustering Anomaly Detection
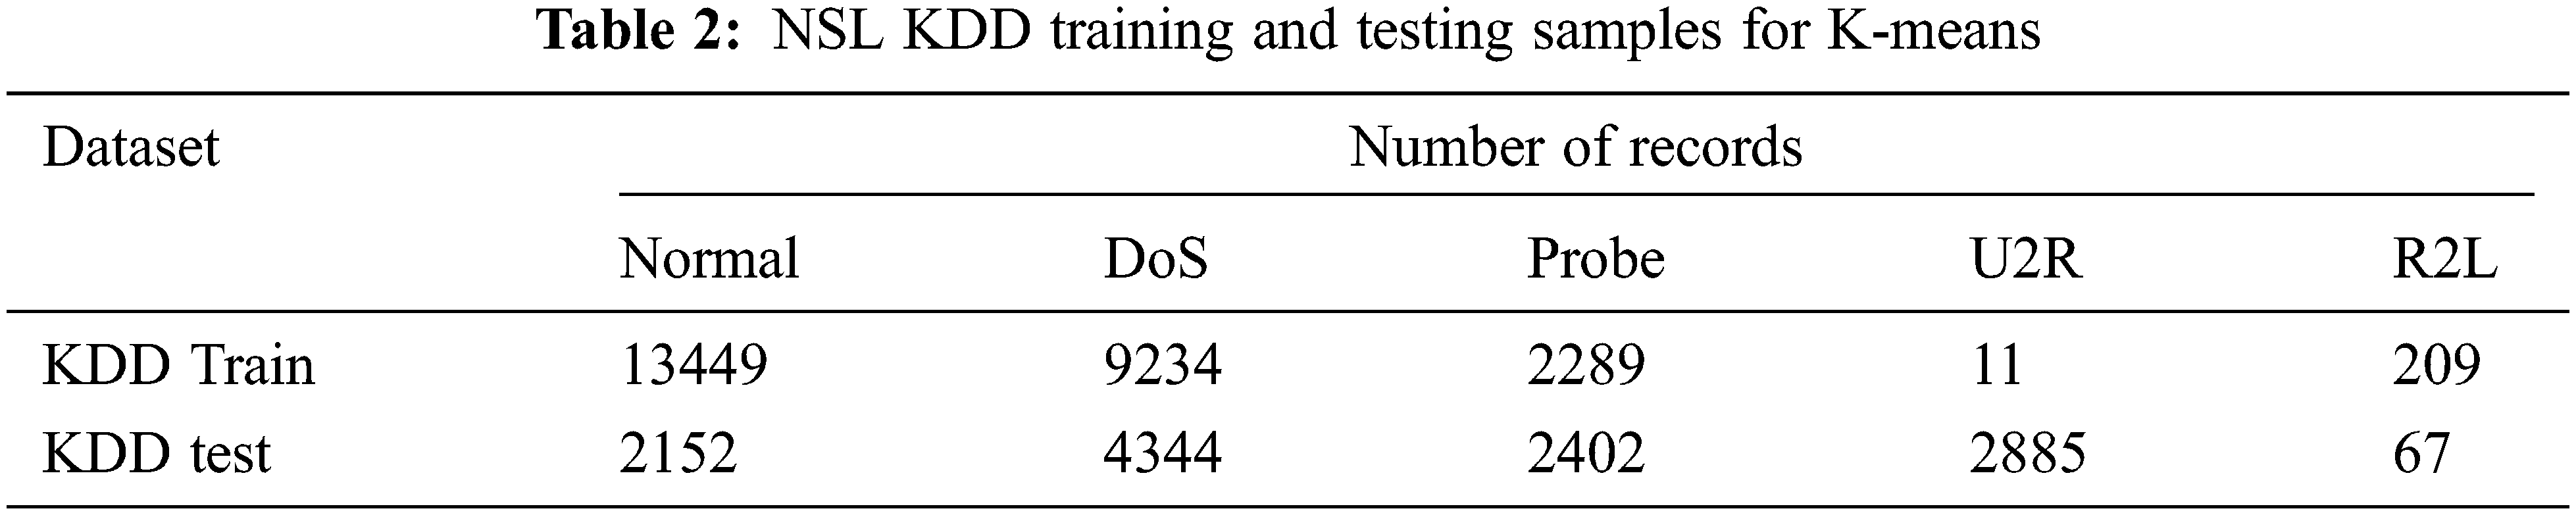
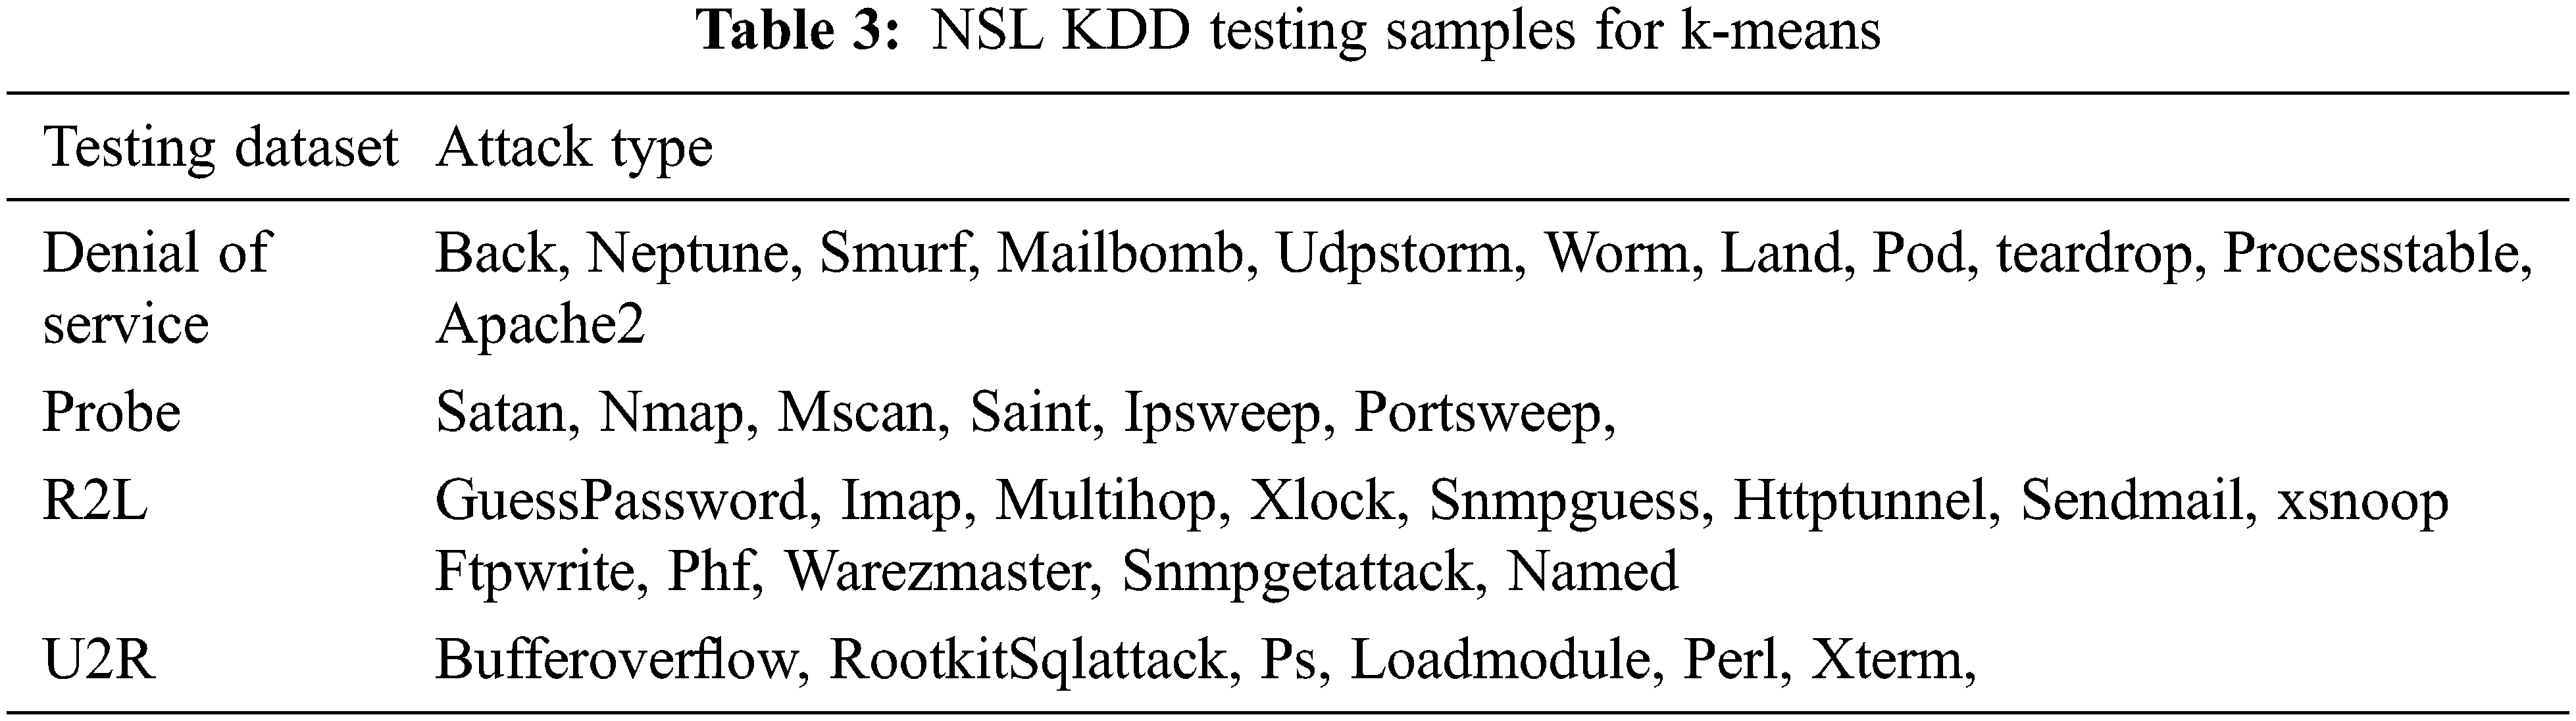
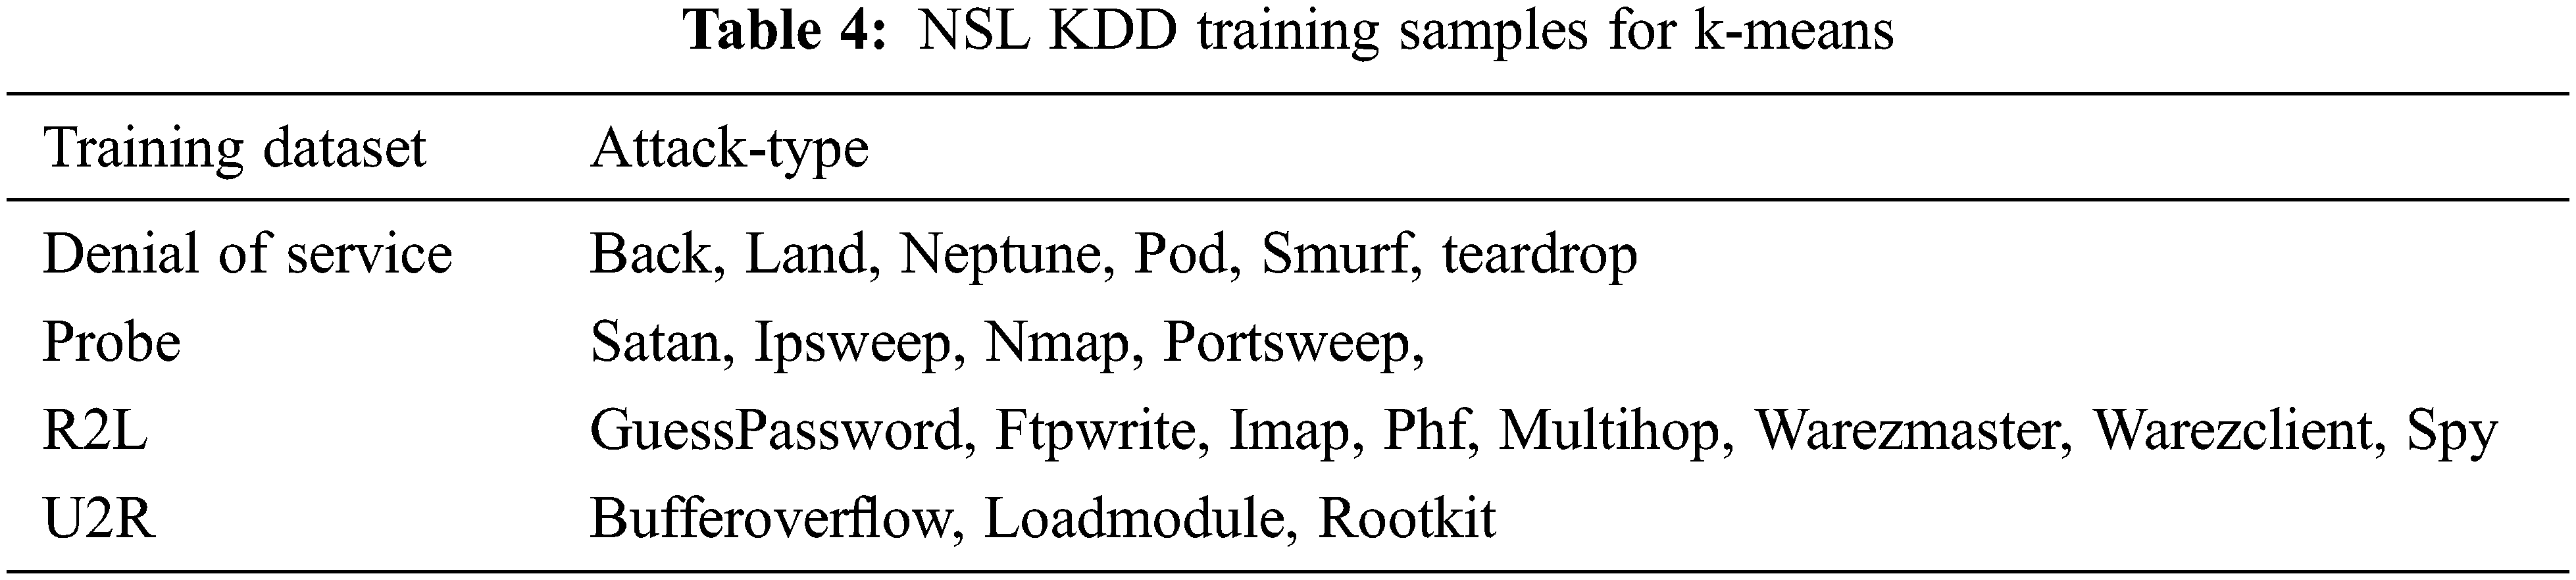
Unsupervised data mining technique for intrusion detection is K-Mean Clustering. It is used to evaluate the Intrusion detection without drop-out. The training and testing dataset is shown in Tab. 2. The attack type for testing data set is 20% of 37 attack type shown in Tab. 3 and the training data type is 80% of 21 attack type as shown in Tab. 4.
The KDD Cup99 has training and testing dataset as shown in Tabs. 5 and 6. The Attacks and normal dataset are classified as original and distinct records. Like NSL KDD the KDD cup99 also have classes of attacks as normal, DoS, Probe, R2L and U2R that are represented in Tab. 7.
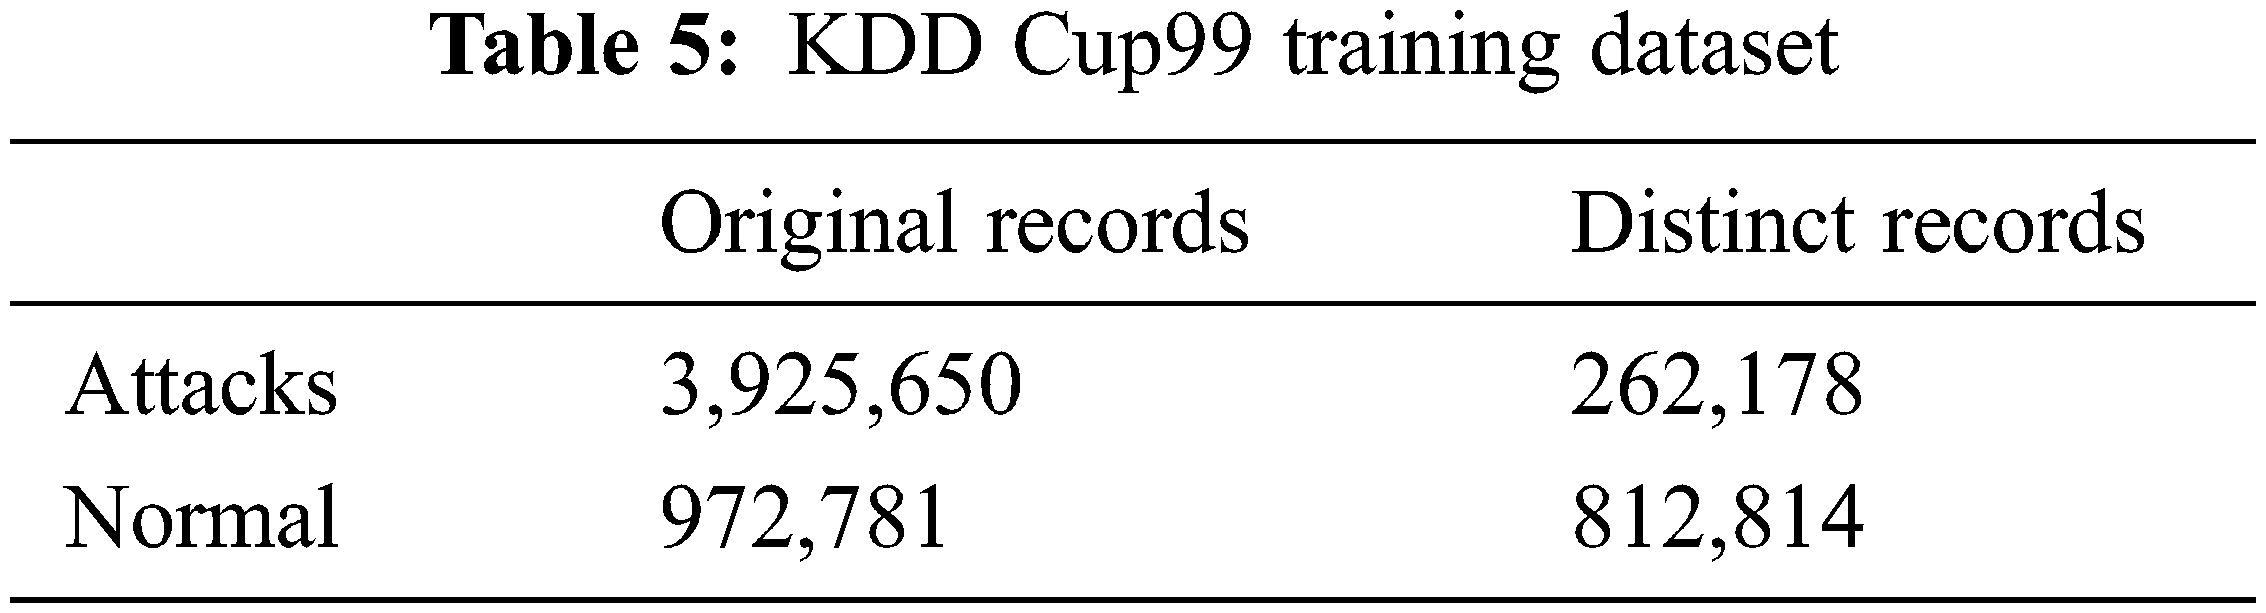
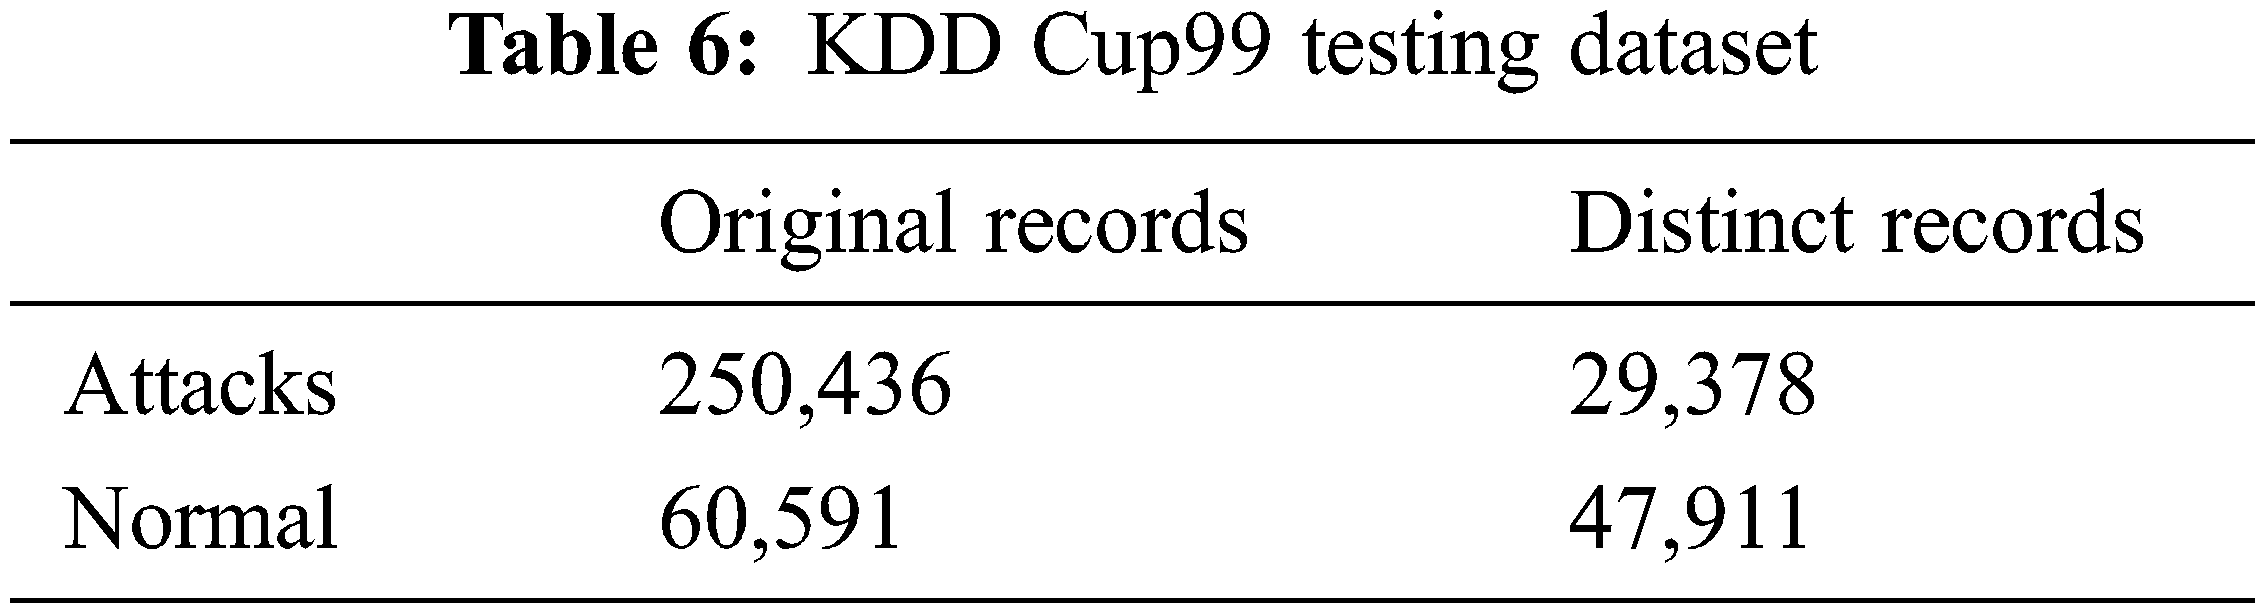
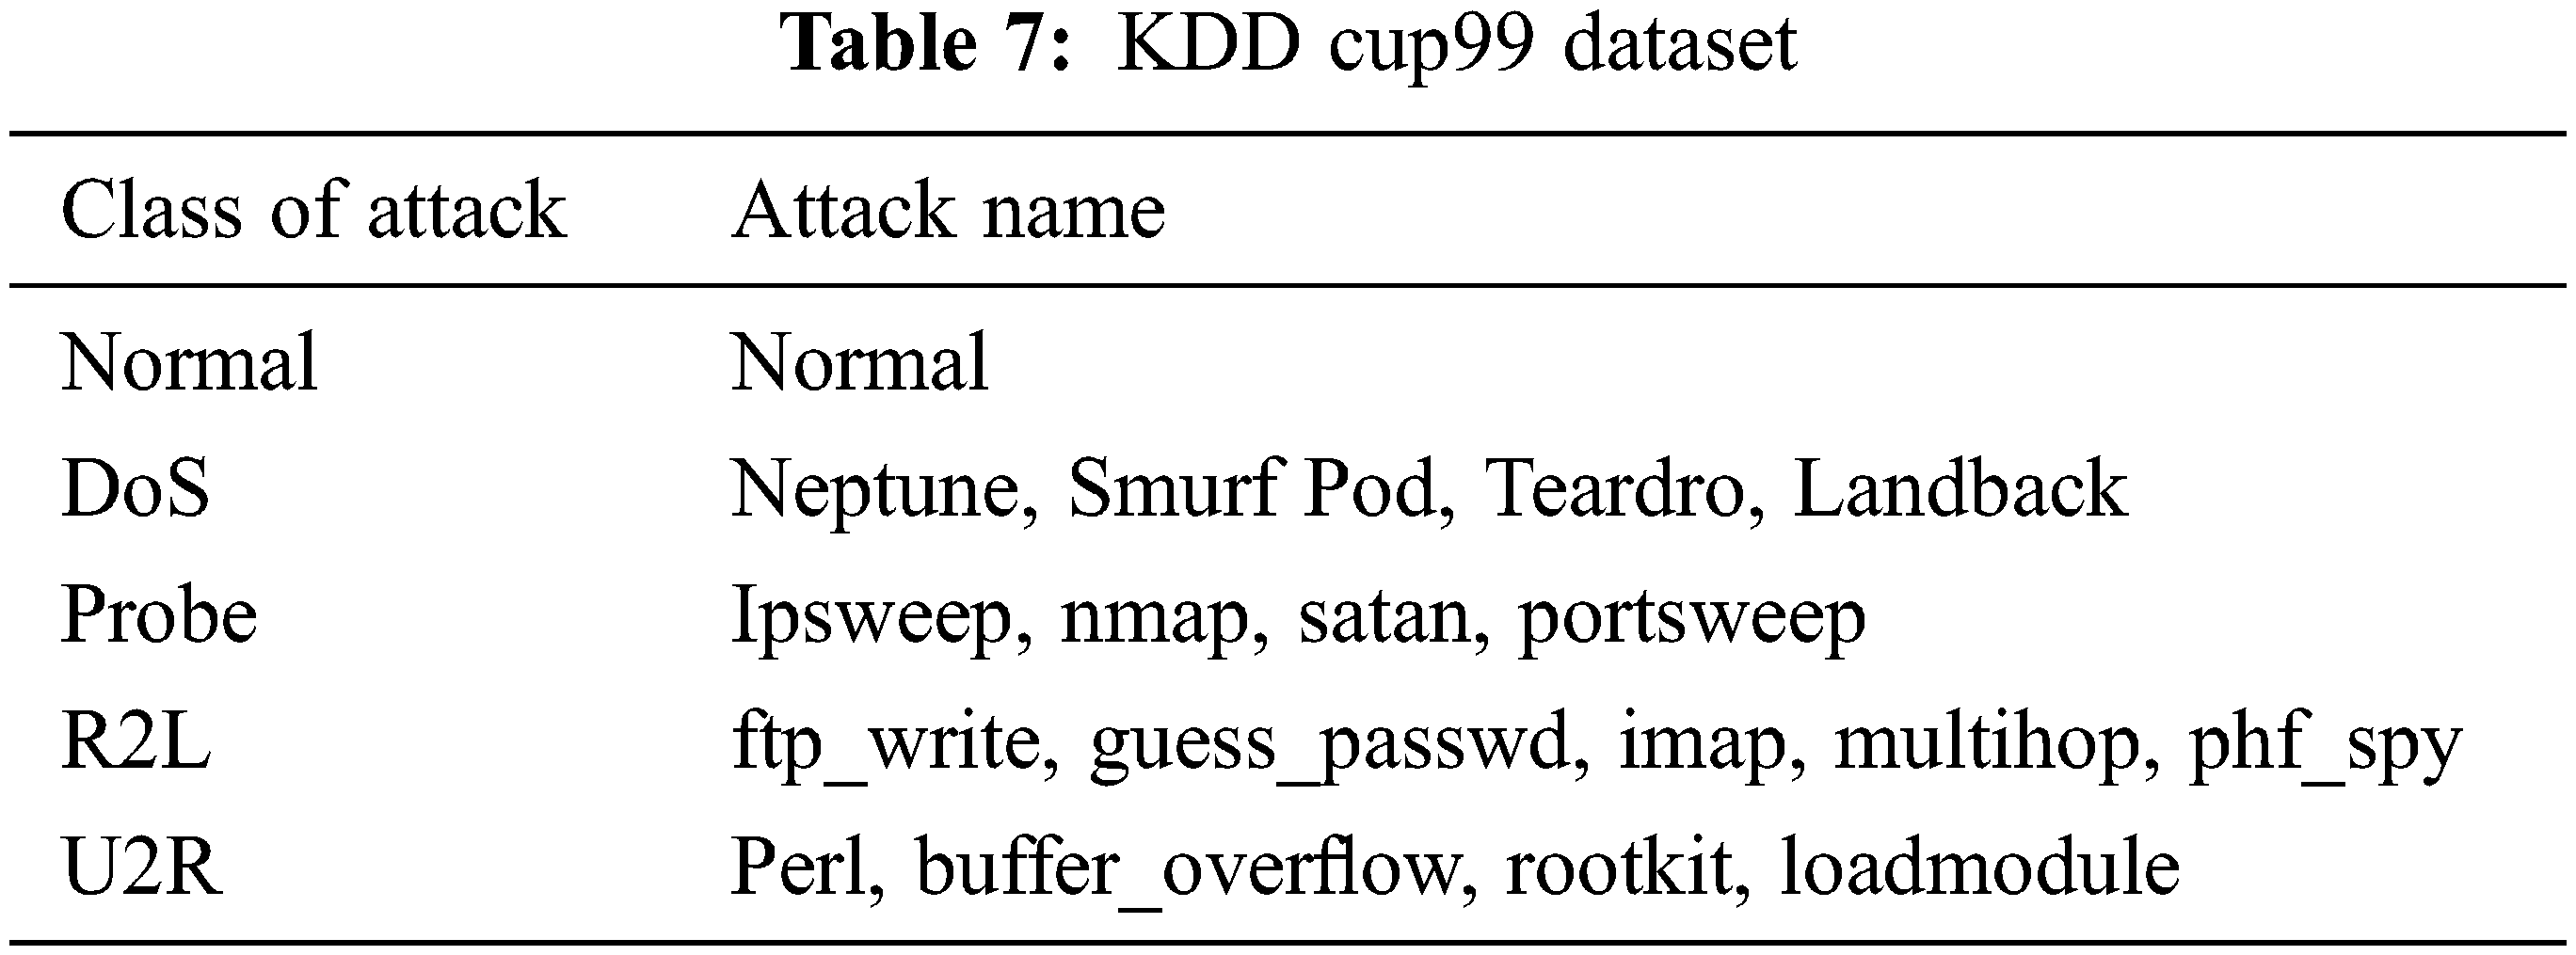
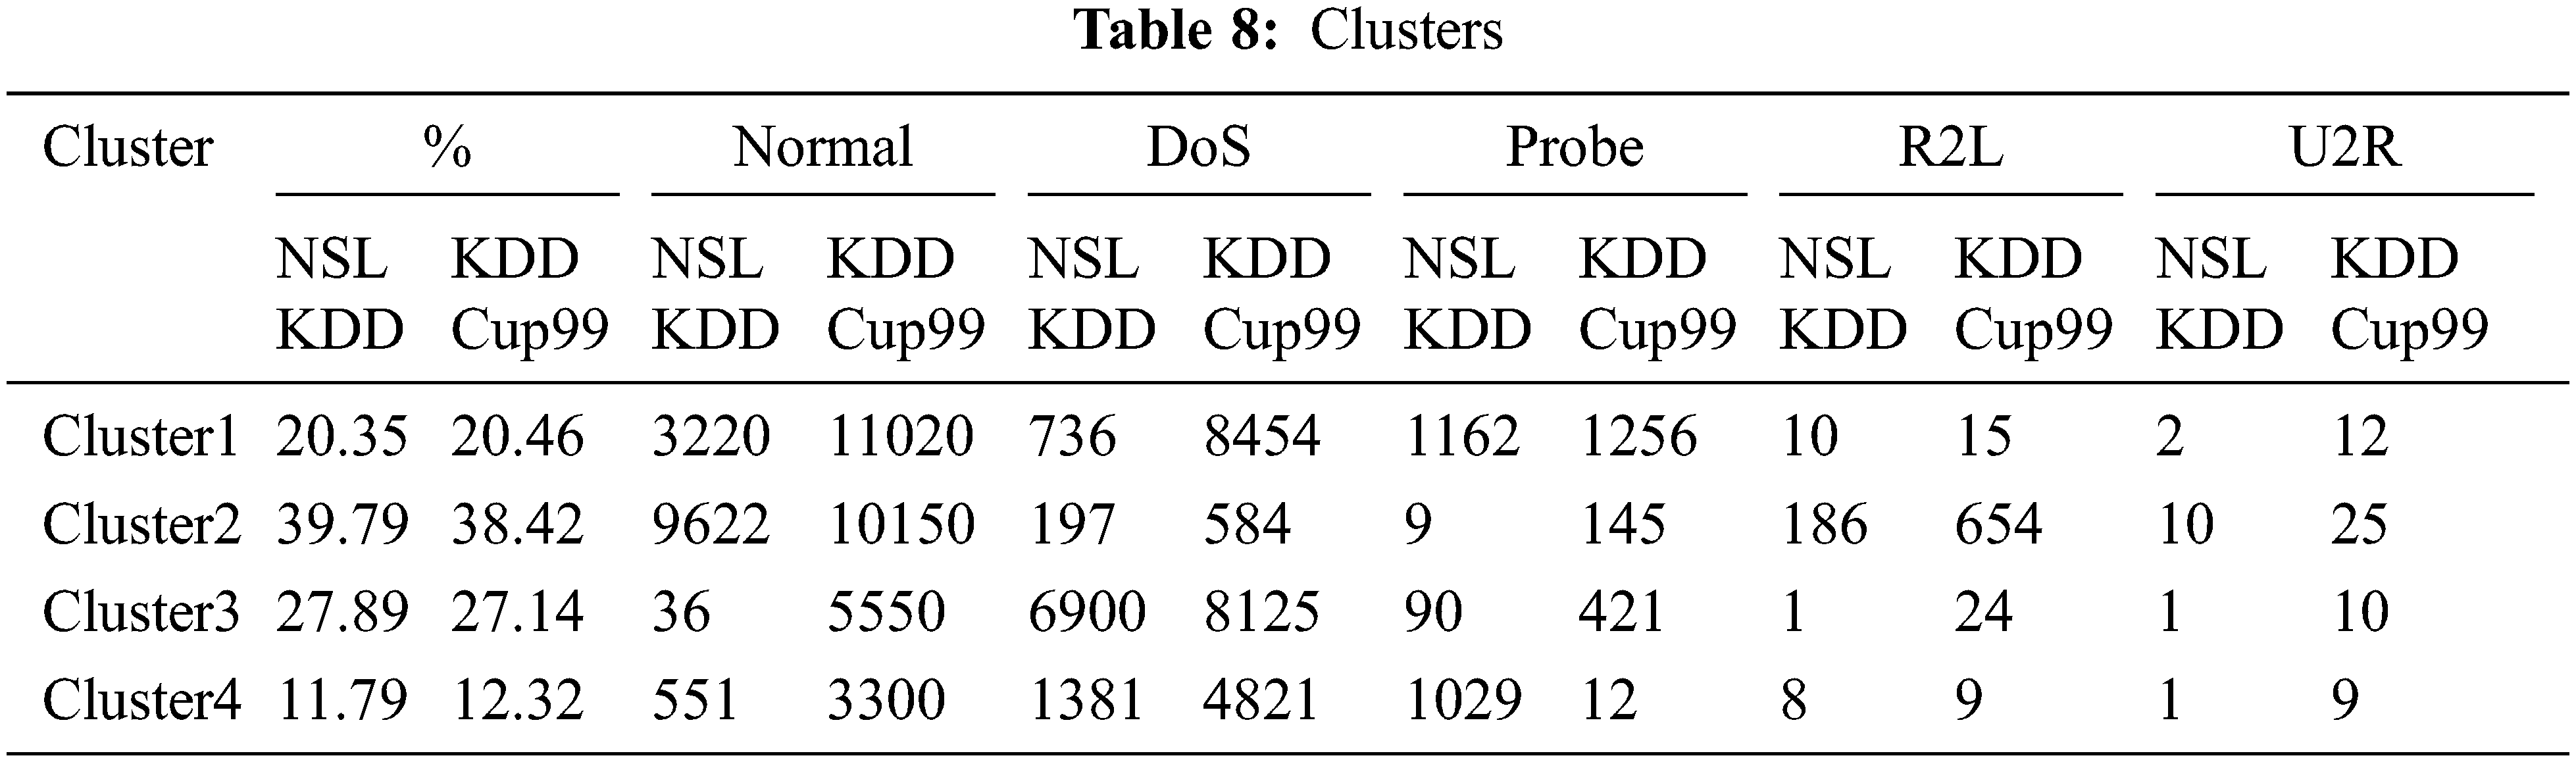
Fig. 4. represents Clusters in NSL Kdd and KDD Cup99 shows Cluster2 contains more instances whereas cluster4 is small. The clusters produced using the k-means algorithm without the inclusion of a drop out function are shown in Tab. 8. The clustering mechanism Shah et al.(2018) [2] of the K-means algorithm was employed for unsupervised learning. The K-means clustering algorithm separates a data item’s n observations into k groups, with each data item belonging to the cluster with the closest mean. According to this, the centroid or middle of these clusters would be determined by first calculating “K,” or the number of clusters, and then using the distance between two points and their mean value. The K-means technique takes 9.23 and 9.321 s to build cluster models the NSL KDD dataset and KDD Cup99 dataset respectively. The mean squared error is 19208.72 and 19874.98 for the NSL KDD dataset and KDD Cup99 dataset respectively.
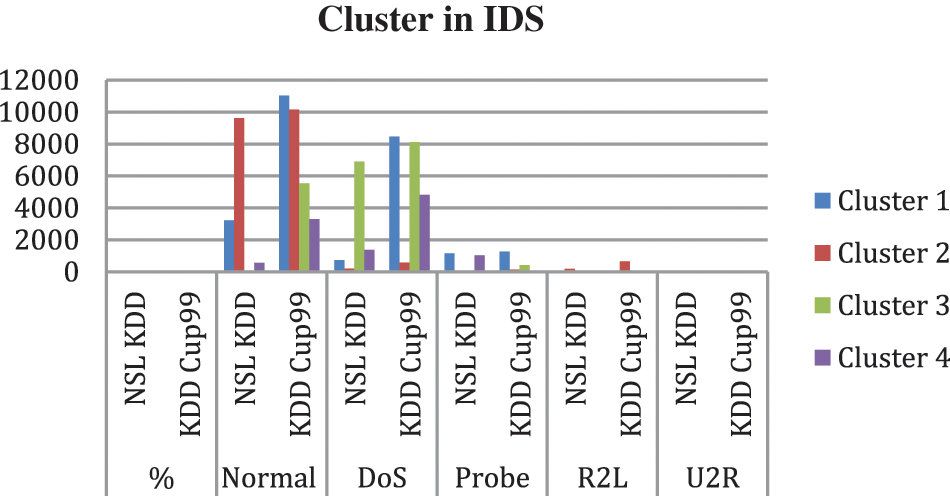
Figure 4: Clusters in IDS
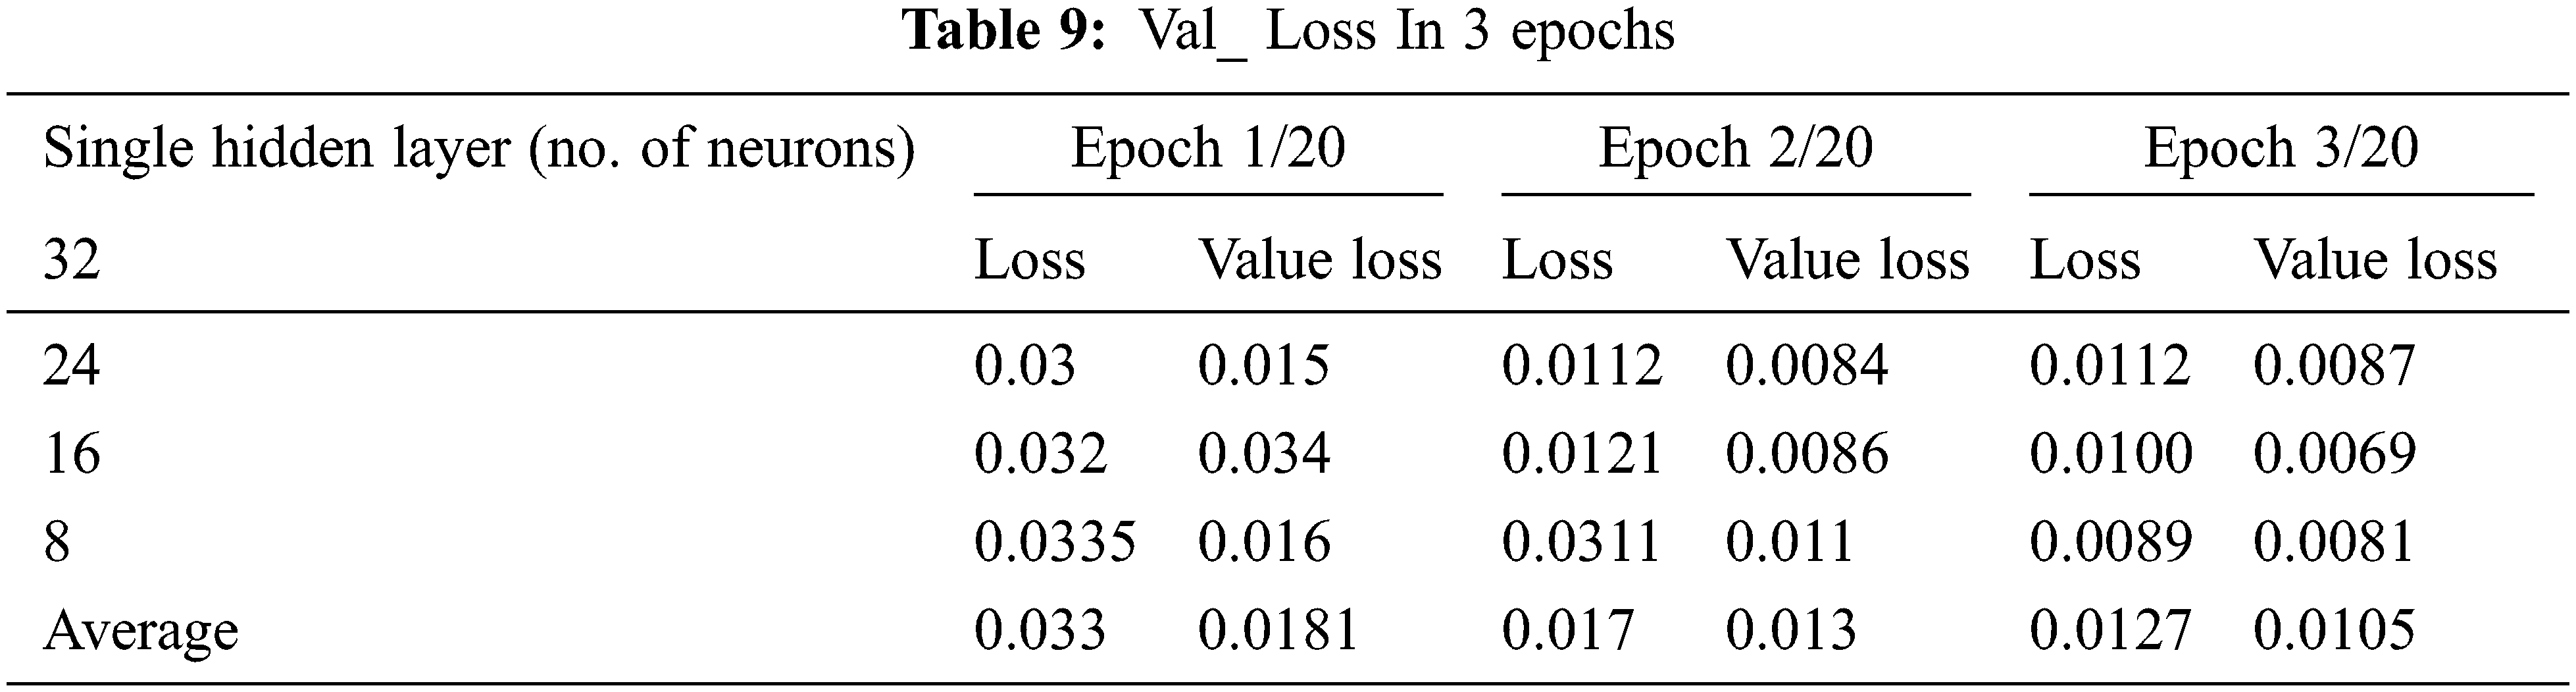
The ACD was learned by only using tests labelled “Standard” that reflect the presence of acceptable behavior, but this was accomplished by checking the device to reduce the error function between its outputs and inputs. Every neuron uses the same amount of weight. The neurons are considered to be locally linked since they share the weight layers Urban et al. (2017) [26]. Although there are 125973 rows in the training set, the DEA was trained using only the samples labelled “Usual” to reflect the presence of normal behaviour. It used 67343 “Normal” samples for training, with 60608 being used. With a batch size of 150, the network is generated for 20 epochs using adam optimizer. Tab. 9. shows the loss value in 3 epoch for hidden layers of 32 neurons, 24 neurons, 16 neurons and 8 neurons.
The measures that follow are: The efficiency of ACD-based anomaly detection is evaluated by Aldweesh, et al. (2020) [10]. (A) Precision: Eq. (8) The percentage of correctly categorized records in relation to the total number of records.
Recall (R) is defined as the proportion of true positive records divided by total number of true positives and false negatives (FN) sorted information Eq. (9) recipient.
The precision(P) is calculated by dividing the percent of true positives (TP) records by the total number of true positives (TP) and false positives (FP) categories Eq. (10).
The harmonic average F Eq. (11) is a number between 0 and 1 that combines recall and precision.
The performance metrics are measured with drop-out function is shown in Tab. 10. The highest accuracy is 90.32%, the highest precision obtained is 0.8812% and highest f-measure is 0.9185 for hidden layer of 8 neurons. The highest recall value is 0.9661 for hidden layer of 16 neurons. Confusion matrix for NSL KDD with dropout function is shown in Fig. 5. Its overall accuracy is 88.36%. The best validation performance is at 0.05284 at epoch 20 in Neural network classifier.
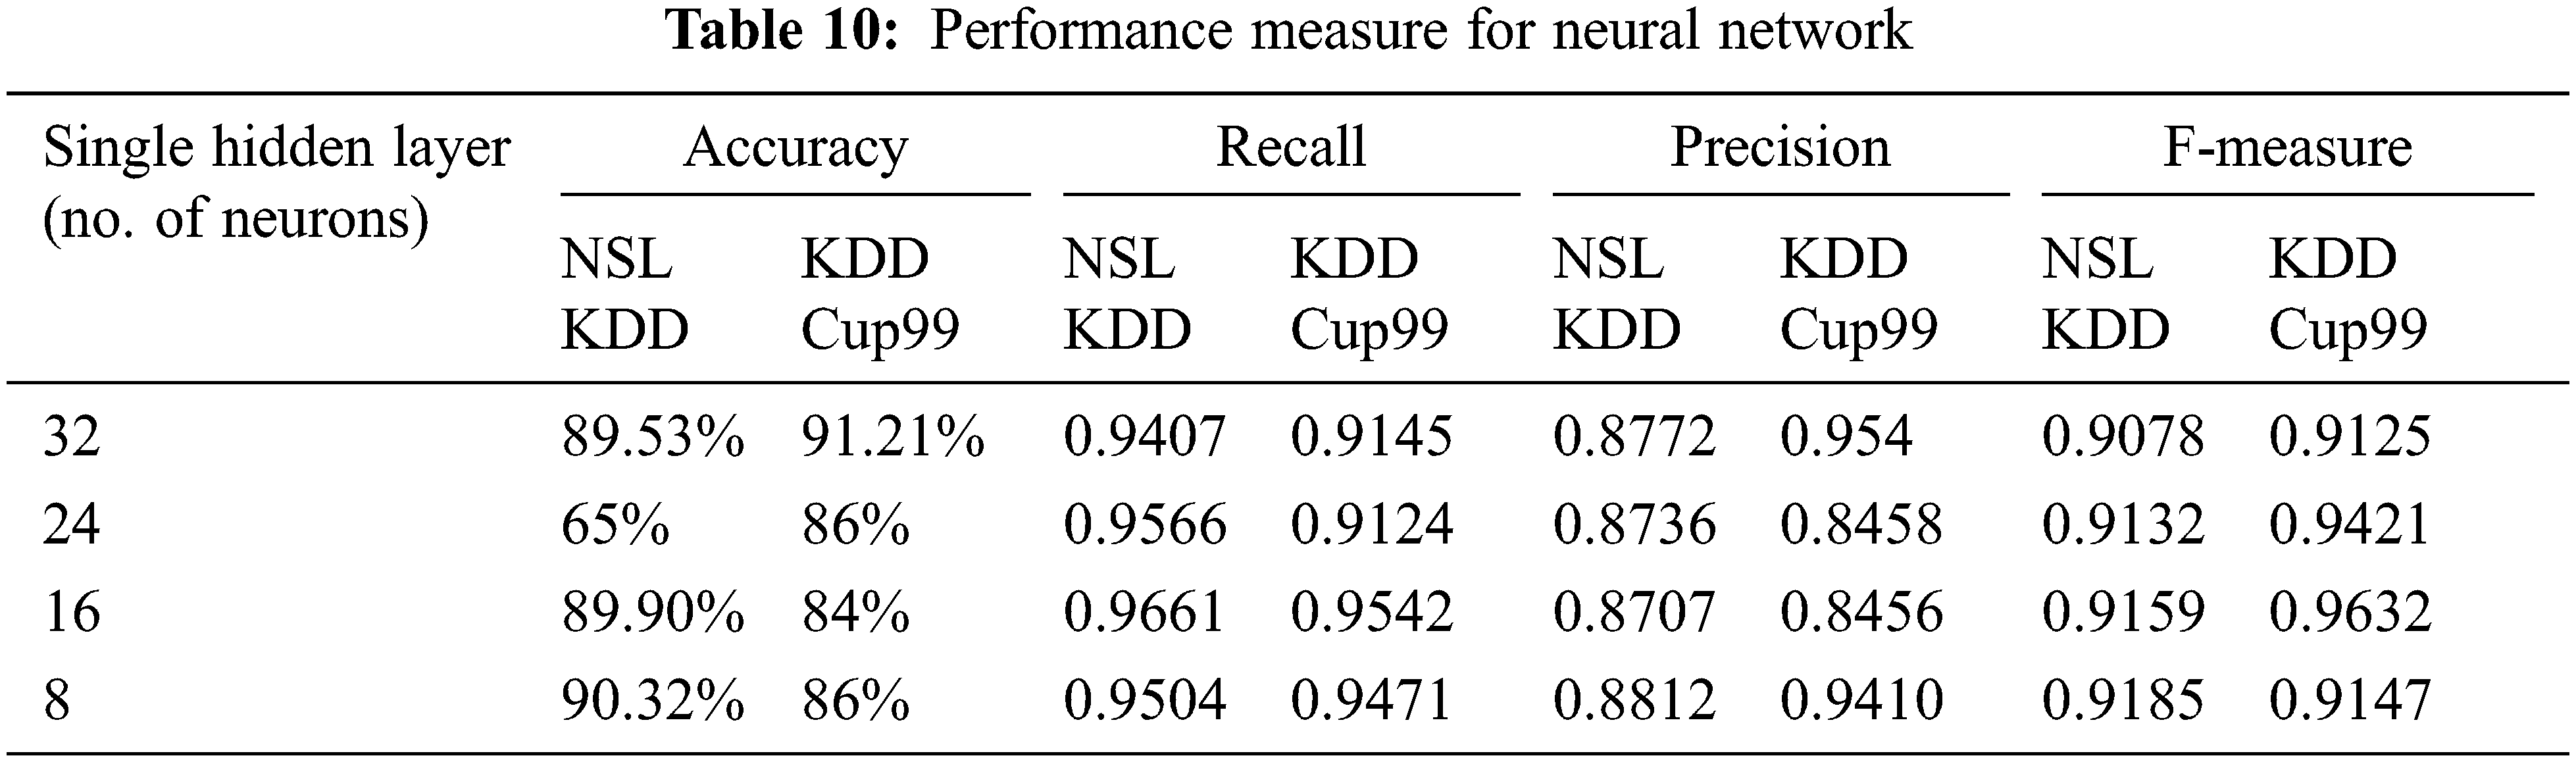
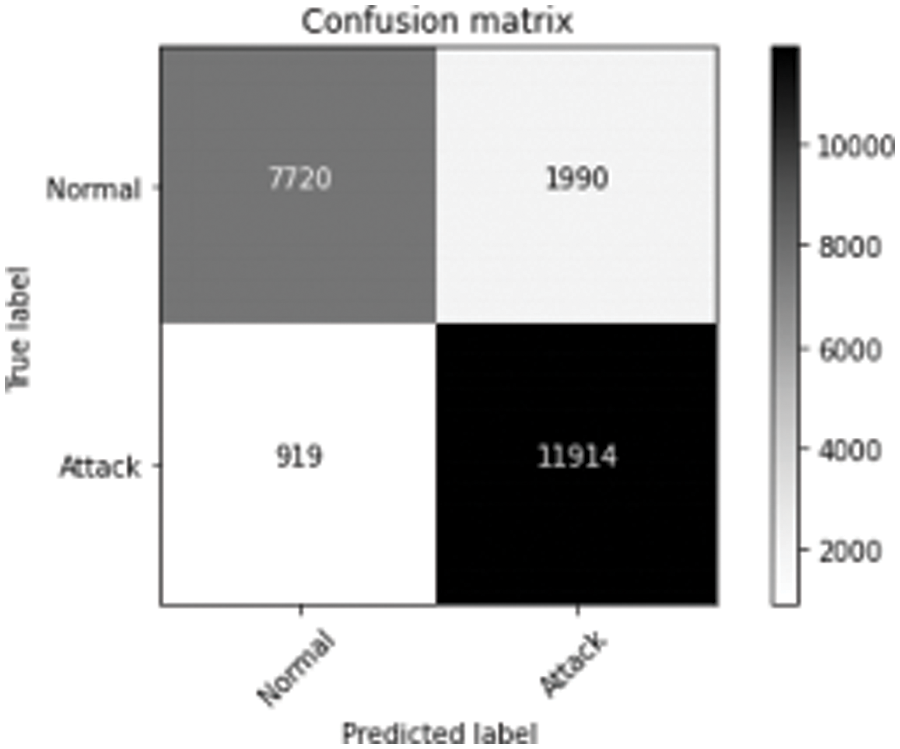
Figure 5: Confusion matrix for NSL KDD dataset with dropout function
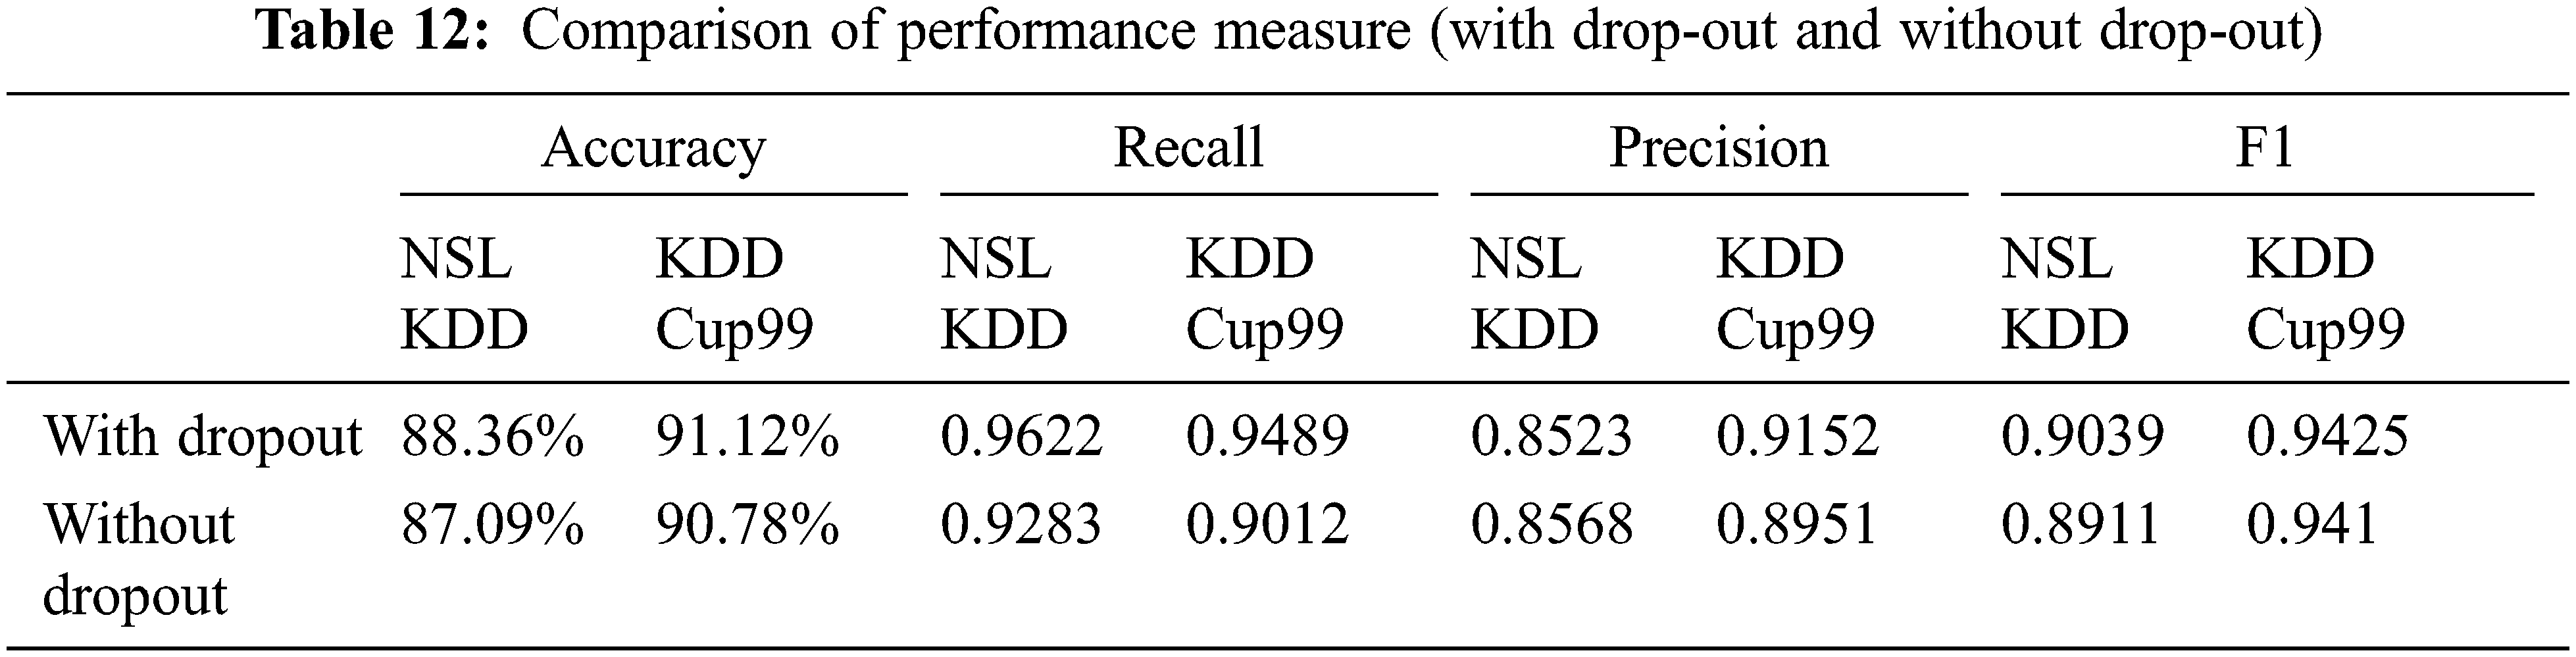
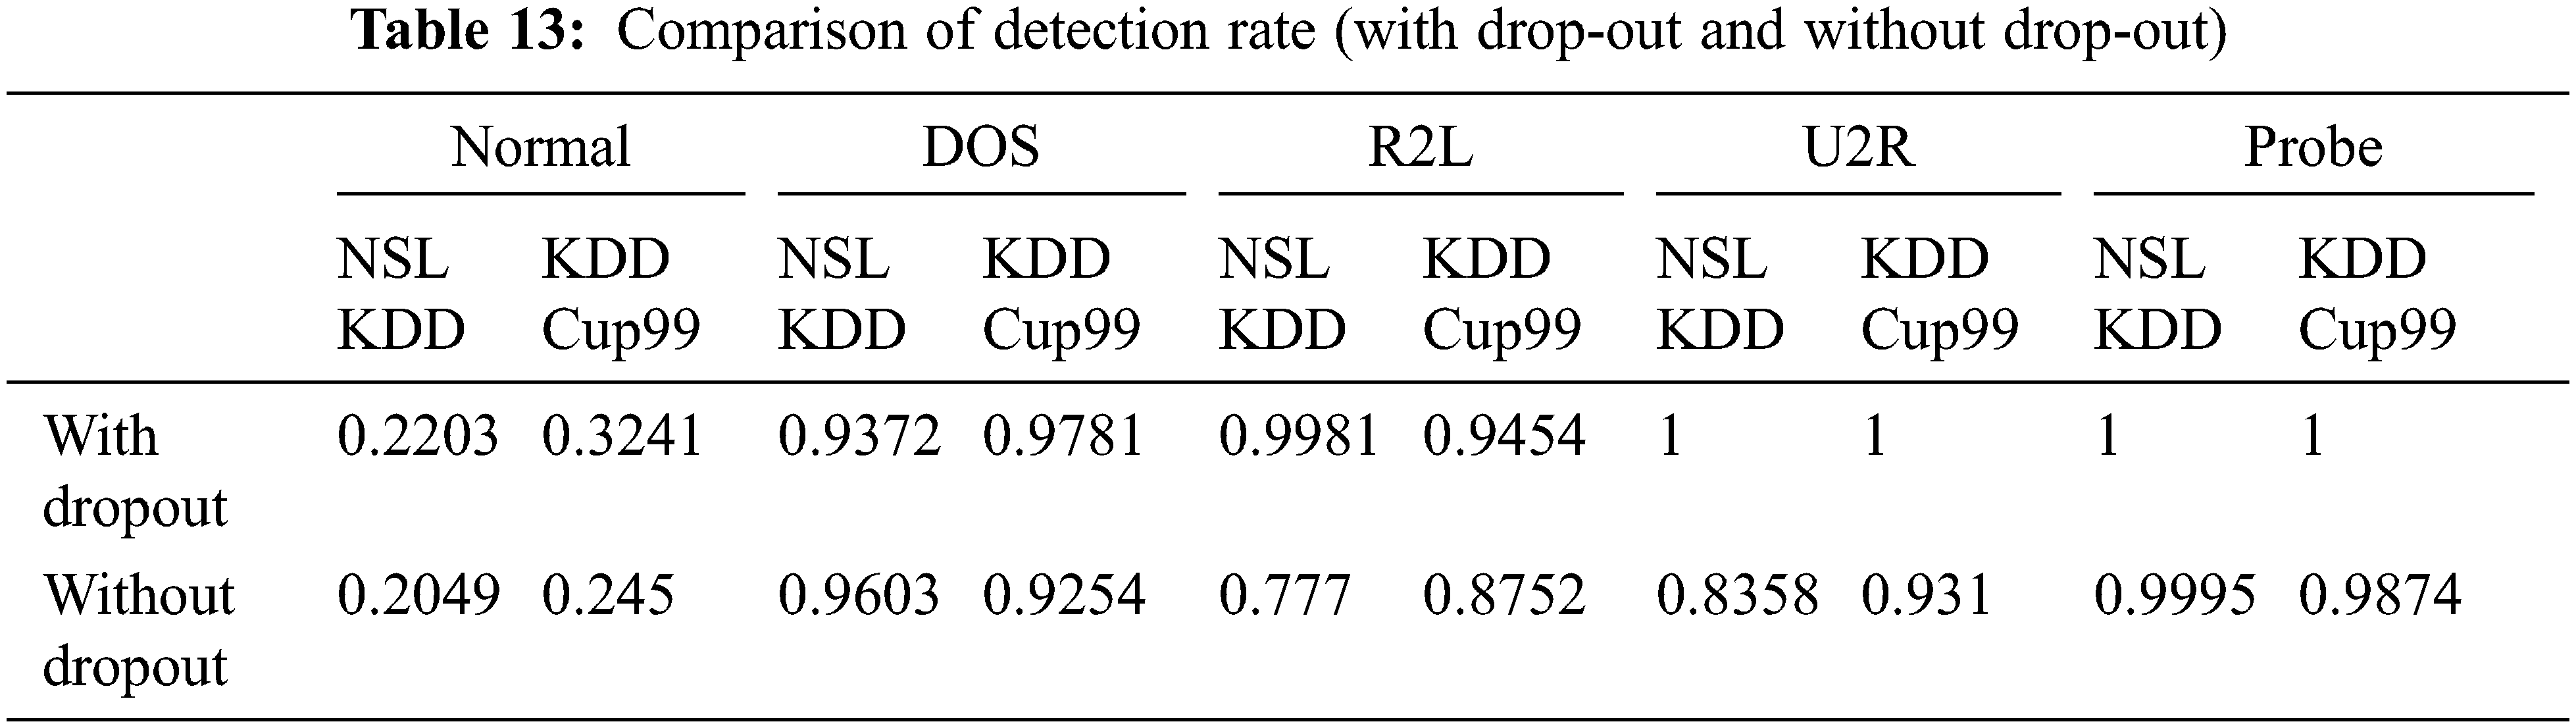
Fig. 6 represents the comparison of Performance measure which includes with drop-out and without drop-out. Tab. 8. shows the detection rate that have 100% U2R for 24 and 8 neurons. Fig. 7 represents the confusion matrix for KDD Cup99 with dropout function. Its overall accuracy is 91.12%. The best validation performance is at 0.0559 at epoch 20 in Neural network classifier. Tabs. 10 and 11 shows the performance measure and detection rate using neural network (with drop-out) and K-means (without drop-out) respectively. The better accuracy is obtained with drop-out function than the without drop-out for the KDD Cup99 as shown in Tab. 12. The detection rate is higher for U2L and probe as 1 for drop-out function. The detection rate is higher for the with drop-out function comparatively with the without drop-out function except DOS as shown in Tab. 13.
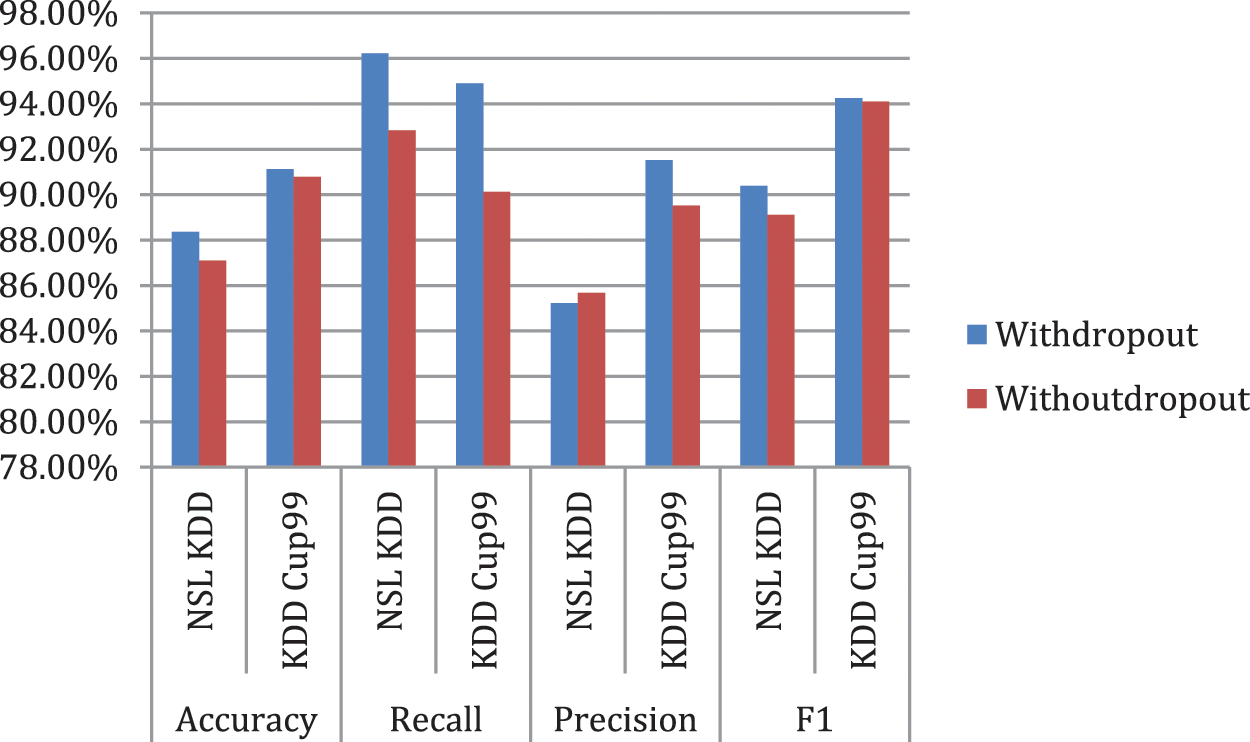
Figure 6: Comparison of performance measure (with drop-out and without drop-out)
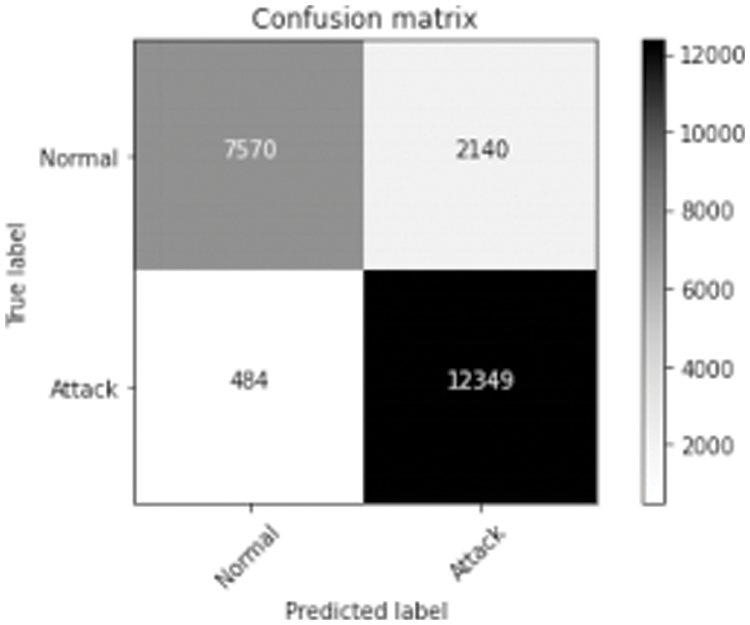
Figure 7: Confusion matrix for KDD Cup99 dataset with dropout function
The confusion matrix describes the performance of the classification model for normal and attack predicted class. The threshold values classify values between 0 and 1. Here, confusion matrix represents true positive as 7570, false negative as 2140, false positive as 484 and true negative as 12349. The threshold value is 0.01. The threshold value can be changed according to the classification process. EDA-HSSO’s performance renders better performance for the rest of the nodes. Thus, it can well be perceived that the proposed work attains superior performance to the existing work.
The confusion matrix represents true positive as 7720, false negative as 1990, false positive as 919 and true negative as 11914; threshold is measured at 0.01. If the threshold value changes there will be change in the predicted value. The threshold is set to the point where there is highest sensitivity with low specificity.
Fig. 8 represents Comparison of Detection rate for both with drop-out and without drop-out. From Tab. 13. it is interesting to see that the better accuracy is achieved by proposed with drop-out function model. Comparitively KDD cup99 with dropout obtained highest accuracy; error detetion rate is low for KDD Cup99.
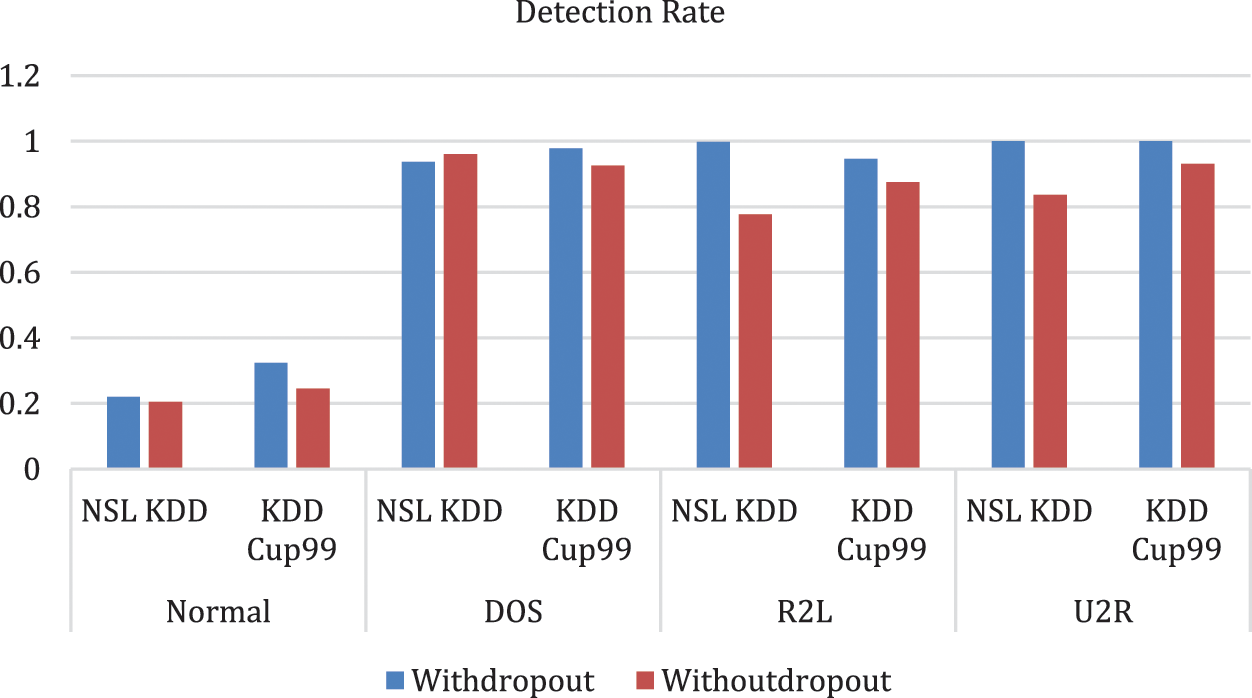
Figure 8: Comparison of detection rate (with drop-out and without drop-out)
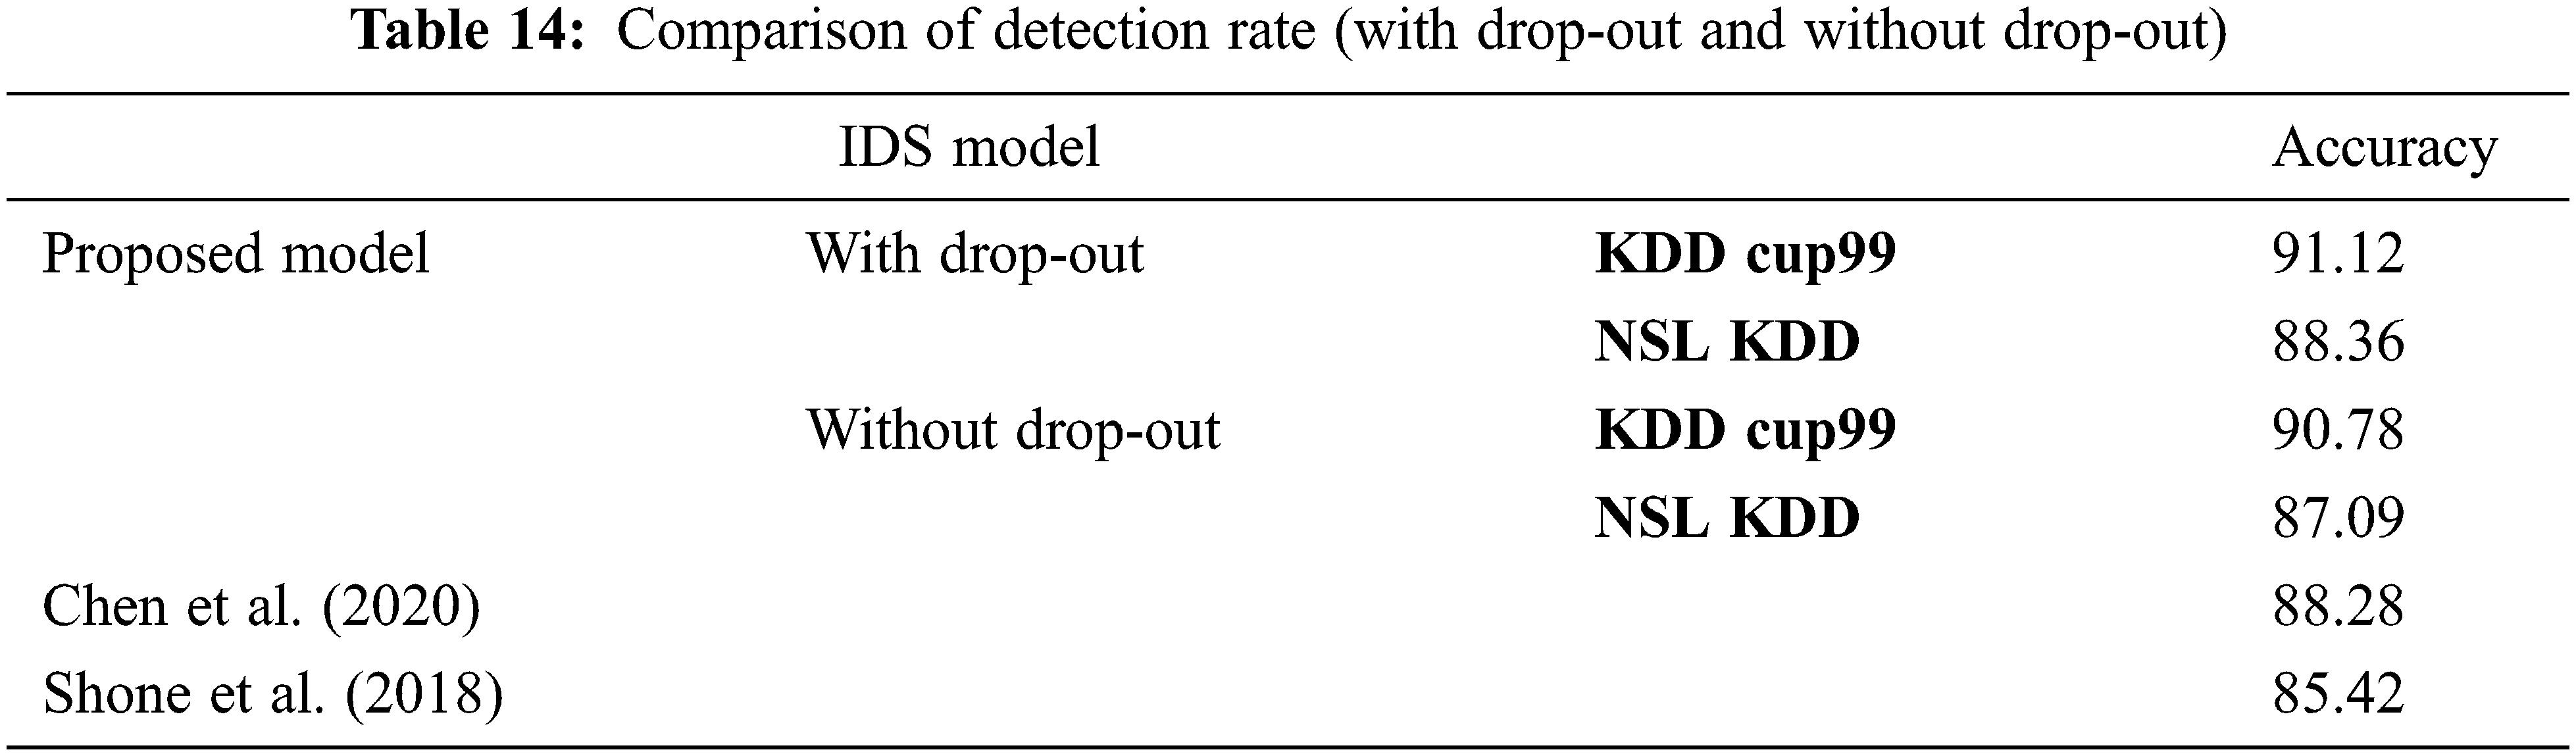
In this paper, the Auto Cryptographic Denoising is proposed with drop-out based anomaly detection. The dataset is trained using normal traffic only. The main contribution of this paper is implementing the Drop-Out function to increase the classification accuracy. The performance metrics and threshold value are measured and compared between with drop-out and with-out drop-out function for two datasets nslkdd dataset and kdd Cup 99. The classification model with drop-out function obtains the better accuracy in KDD Cup99 when compared to classification model with-out drop-out function. The single hidden layer in Neural network is very effective and easy to train the dataset. The simplicity is the strength of this approach. K-means forms the four clusters that is efficient for handling intrusions without drop-out. The data imbalance problem is handled by using drop-out function. Here, the implementation of hidden layer denoising classifier with drop-out and drop-out function is evaluated the IDS using by measuring classifiers performance metrics; where data imbalance problem with low detection rate is achieved. The KDD Cup99 dataset by implementing Neural network classification model with adam optimizer obtains the largest accuracy of 91.12% with drop-out function with less error rate. Explaining In future work, the multiple hidden layers can be build with various optimizers.
Funding Statement: The authors received no specific funding for this study.
Conflicts of Interest: The authors declare that they have no conflicts of interest to report regarding the present study.
References
1. D. Barbará, J. Couto, S. Jajodia and N. Wu, “An architecture for anomaly detection,” in Applications of Data Mining in Computer Security, Springer Science & Business Media, vol. 6, pp. 6376–6391, 2002. [Google Scholar]
2. Wespi, M. Dacier and H. Debar, “Intrusion detection using variable-length audit trail patterns,” in Int. Workshop on Recent Advances in Intrusion Detection, Springer, pp. 110–129, 2000. [Google Scholar]
3. H. Peng, C. Liu, D. Zhao, H. Ye, Z. Fang et al., “Security analysis of CPS systems under different swapping strategies in iot environments,” IEEE Access, vol. 8, pp. 63567–63576, 2020. [Google Scholar]
4. J. Liang, J. Chen, X. Zhang, Y. Zhou and J. Lin, “One-hot encoding and convolutional neural network based anomaly detection,” Journal of Tsinghua University (Science Technology), vol. 59, pp. 523–529, 2019. [Google Scholar]
5. A. A. Hussien, S. W. Shammari and M. J. Marie, “Performance evaluation of wireless sensor networks using LEACH protocol,” Indonesian Journal of Electrical Engineering and Computer Science, vol. 19, no. 1, pp. 395–402, 2020. [Google Scholar]
6. C. Ioannou, V. Vassiliou and C. Sergiou, “An intrusion detection system for wireless sensor networks,” in 2017 24th Int. Conf. on Telecommunications (ICT) May 3, Limassol, Cyprus, IEEE, pp. 1–5, 2017. [Google Scholar]
7. R. Zhang and X. Xiao, “Intrusion detection in wireless sensor networks with an improved NSA based on space division,” Journal of Sensors, vol. 2019, Article ID 5451263, pp. 20, 2019. [Google Scholar]
8. H. Suhaimi, S. I. Suliman, I. Musirin, A. F. Harun and R. Mohamad, “Network intrusion detection system by using genetic algorithm,” Indonesian Journal of Electrical Engineering and Computer Science (IJEECS), vol. 16, no. 3, pp. 1593–1599, 2019. [Google Scholar]
9. H. Peng, Z. Kan, D. Zhao and J. Han, “ “Security assessment for interdependent heterogeneous cyber physical systems,” Mobile Network and Applications, vol. 26, no. 4, pp. 1–11, 2019. https://doi.org/10.1007/s11036-019-01489-z. [Google Scholar]
10. A. Aldweesh, A. Derhaband and A. Z. Emam, “Deep learning approaches for anomaly-based intrusion detection systems: A survey, taxonomy, and open issues,” Knowledge Based System, vol. 189, pp. 105–124, 2020. [Google Scholar]
11. A. A. Afiq, M. A. Zakariya, M. N. Saad, A. A. Nurfarzana, M. H. M. Khir et al., “A review on classifying abnormal behavior in crowd scene,” Journal Visual Communication Image Represent, vol. 58, pp. 285–303, 2019. [Google Scholar]
12. S. Brady, A. Hava, P. Perry, J. Murphy, D. Magoni et al., “Towards an emulated IoT test environment for anomaly detection using NEMU,”in Global Internet of Things Summit, In 2017 Global Internet of Things Summit (GIoTS), IEEE, pp. 1–6, 2017. https://doi.org/10.1109/GIOTS.2017.8016222. [Google Scholar]
13. V. G. Aquize, E. Emery and F. B. de Lima Neto, “Self-organizing maps for anomaly detection in fuel consumption,” in Latin American Conference on Computational Intelligence, Case study: Illegal fuel storage in Bolivia. In 2017 IEEE Latin American Conference on Computational Intelligence (LACCI), IEEE, pp. 1–6, 2017. [Google Scholar]
14. E. Nalisnick, A. Matsukawa, Y. W. Teh, D. Gorur and B. Lakshminarayanan, “Do deep generative models know what they don’t know?,” in Published as a Conference Paper at ICLR, arXiv preprint arXiv:1810.09136, 2019. [Google Scholar]
15. K. Jiang, W. Wang, A. Wang and H. Wu, “Network intrusion detection combined hybrid sampling with deep hierarchical network,” IEEE Access, vol. 8, pp. 32464–32476, 2020. [Google Scholar]
16. A. S. Elhag, A. Fernández, A. Bawakid, S. Alshomrani and F. Herrera, “On the combination of genetic fuzzy systems and pairwise learning for improving detection rates on intrusion detection systems,” Expert System Application, vol. 42, pp. 193–202, 2015. [Google Scholar]
17. S. A. R. Shah and B. Issac, “Performance comparison of intrusion detection systems and application of machine learning to snort system,” Future Generation Computer System, vol. 80, pp. 157–170, 2018. [Google Scholar]
18. A. Vishnu Priya, S. Ashish kumar srivastava and V. Arun, “Hybrid optimal energy management for clustering in wireless sensor network,” in Computers and Electrical Engineering, vol. 86, pp. 379–387, 2020. [Google Scholar]
19. R. Singh, H. Kumar and R. K. Singla, “An intrusion detection system using network traffic profiling and online sequential extreme learning machine,” Expert System Application, vol. 42, pp. 8609–8624, 2015. [Google Scholar]
20. M. Gnouma, A. Ladjailia, R. Ejbali and M. Zaied, “Stacked sparse autoencoder and history of binary motion image for human activity recognition,” Multimedia Tools and Applications, vol. 78, no. 2, pp. 2157–2179, 2019. [Google Scholar]
21. A. ElAdel, R. Ejbali, M. Zaied and C. B. Amar, “Fast deep neural network based on intelligent dropout and layer skipping,” IEEE International Joint Conference on Neural Networks (IJCNN), pp. 897–902, 2017. [Google Scholar]
22. G. E. Dahl, T. N. Sainath and G. E. Hinton, “Improving deep neural networks for LVCSR using rectified linear units and dropout,” in IEEE Int. Conf. on Acoustics, Speech and Signal Processing, May 2013, Canada, pp. 8610–8613, 2013. [Google Scholar]
23. T. Senthil Kumar and K. I. Ohhm Prakash, “A queueing model for e-learning system,” Advances in Intelligent Systems and Computing, vol. 325, pp. 89–94, 2015. https://doi.org/10.1109/ICASSP.2013.6639346. [Google Scholar]
24. N. Shone, T. N. Ngoc, V. D. Phai and Q. Shi, “A deep learning approach to network intrusion detection,” IEEE Transactions on Emerging Topics in Computational Intelligence, vol. 2, no. 1, pp. 41–50, 2018. [Google Scholar]
25. S. Chen, J. Yu and S. Wang, “One dimensional convolutional auto-encoder-based feature learning for fault diagnosis of multivariate processes,” Journal of Process Control, vol. 87, pp. 54–67, 2020. [Google Scholar]
26. G. Urban, K. J. Geras, S. E. Kahou, O. Aslan, S. Wang et al. “Do deep convolutional nets really need to be deep and convolutional?,” in ICLR, arXiv preprint arXiv:1603.05691, USA, 2017. [Google Scholar]
Cite This Article
 Copyright © 2023 The Author(s). Published by Tech Science Press.
This work is licensed under a Creative Commons Attribution 4.0 International License , which permits unrestricted use, distribution, and reproduction in any medium, provided the original work is properly cited.
 Downloads
 Citation Tools