
 Submit a Paper
 Propose a Special lssue
 Open Access
ARTICLE
A Quasi-Newton Neural Network Based Efficient Intrusion Detection System for Wireless Sensor Network
1 Department of Electronics and Communication Engineering, SNS College of Technology, Coimbatore, Tamilnadu, India
2 Department of Computer Science & Engineering, Dr. N.G.P Institute of Technology, Coimbatore, Tamilnadu, India
3 Department of Computer Science & Engineering, SNS College of Technology, Coimbatore, Tamilnadu, India
* Corresponding Author: A. Gautami. Email:
Computer Systems Science and Engineering 2023, 45(1), 427-443. https://doi.org/10.32604/csse.2023.026688
Received 02 January 2022; Accepted 18 April 2022; Issue published 16 August 2022
 View Full Text
 Download PDF
Abstract
In Wireless Sensor Networks (WSN), attacks mostly aim in limiting or eliminating the capability of the network to do its normal function. Detecting this misbehaviour is a demanding issue. And so far the prevailing research methods show poor performance. AQN3 centred efficient Intrusion Detection Systems (IDS) is proposed in WSN to ameliorate the performance. The proposed system encompasses Data Gathering (DG) in WSN as well as Intrusion Detection (ID) phases. In DG, the Sensor Nodes (SN) is formed as clusters in the WSN and the Distance-based Fruit Fly Fuzzy c-means (DFFF) algorithm chooses the Cluster Head (CH). Then, the data is amassed by the discovered path. Next, it is tested with the trained IDS. The IDS encompasses ‘3’ steps: pre-processing, matrix reduction, and classification. In pre-processing, the data is organized in a clear format. Then, attributes are presented on the matrix format and the ELDA (entropy-based linear discriminant analysis) lessens the matrix values. Next, the output as of the matrix reduction is inputted to the QN3 classifier, which classifies the denial-of-services (DoS), Remotes to Local (R2L), Users to Root (U2R), and probes into attacked or Normal data. In an experimental estimation, the proposed algorithm’s performance is contrasted with the prevailing algorithms. The proposed work attains an enhanced outcome than the prevailing methods.Keywords
WSN comprises smaller important components, which have restricted power devices, say sensors, and it can be installed in open surroundings [1]. Due to its wireless environment, it is employed in most unguarded surroundings wherein any sort of adversaries may take note of the traffic and insert their own nodes on the sensor network [2], which is called as attack injection. The attacks are DoS along with distributed-DoS (DDoS) attacks [3]. DDoS (Distributed Denial of Service) assaults are a type of denial-of-service attack. A DDoS assault entails the deployment of a malware, which is a collection of linked internet devices that are utilized to flood a targeted server with bogus information. These can bring about considerable harm to the WSN surroundings. Thus, the IDS is absolutely required for recognizing those sorts of activities since the WSN is utilized for numerous applications, say temperature, healthcare, vibrations, military, medical, along with sound, et cetera., [4,5].
IDS is extensively utilized on network security defence, as it alludes to gather along with evaluating data as of the network to detect abnormal performance on the network [6]. Aimed at data collection, the data is transferred as of the sink to the node (destination). Direct transmissions to the sink don’t assure a well-balanced distribution of the energy load amongst the network’s sensors. Therefore, numerous clustering protocols were purposely modelled for WSN to enhance data collecting mechanisms [7]. Data collection is the act of obtaining and interpreting data on certain characteristics in a structured manner, allowing one to recognize pertinent questions as well as assess consequences. In all academic domains, encompassing diverse disciplines, economics, and economics, information gathering is an important part of the study process. Whereas the methodologies differ depending on the field, the focus on precise and truthful data collecting stays identically. The data-collecting mechanism gathers sensing data as of sensors and also reports to an exact node, termed a sink [8]. Next, the intrusion is analyzed in the amassed data.
In addition, the ID design in a homogeneous WSN introduces parameters say sensing gamut, along with node density, for every point of a field of interest should be within the sensing gamut of at least ‘1’ SN. The intruder might be attacking a multi-SN or single SN [9]. Normally, IDS can be categorized as misuse-centered IDS along with anomaly-centered IDS [10,11]. The misuse-centred detection [12] searches for network attack sequences or events by matching them with its stored signatures. The anomaly-centred detection [13] notices irregularity by contrasting current network events with pre-stated normal traffic behaviour on the network. Nevertheless, usual IDSs may be compromised by recurrent detection faults along with false alarms. Developing IDS efficiency can be attained by adopting Computational Intelligences (CI) techniques, which means that machine learning can automatically uncover helpful information as of vast datasets [14]. Therefore, the CI techniques give features, like evolution, reasoning, perception, adaptation, along with learning, which can be explored to make more robust IDS and can handle unidentified attacks and also adapt to disparate application scenarios [15,16]. However, the current studies established on the CI have poor accuracy. Thus, to ameliorate the performance, this document proposed a QN3 centred ID in WSN.
The paper is pre-arranged as: Section 2 surveys the associated works regarding the proposed work. In Sections 3, a brief discussion about the proposed methodology is presented; Section 4 analysis the Investigational outcome and Section 5 will convey the conclusion of this paper.
Selvakumar et al. [17] rendered the adaptive IDS for choosing attributes grounded on the Fuzzy Rough sets. Allen’s interval algebra (AIA) was employed on network trace datasets for picking countless attack data for effectual attack prediction in WSNs. It encompasses “8” major constituents, say the network trace dataset, AIA, data pre-processing, feature selection, testing module, classification, rule generation, and knowledge-centric module. The purpose of cluster analysis creation is to uncover intriguing relationships and correlations in large datasets. The proportion of interactions wherein the goods co-occur is a second unique metric, which would be described as the proportion of activities wherein the things co-occur. This system attained an excellent detection rate on considering the prevailing approaches.
Iman Almomani et al. [18] put forward the IDS framework in WSN to recognize and classify the “4” sorts of Denial of Service attacks (DoS), like, Black hole, Gray-hole, flooding, and also scheduling attacks. This framework regarded the utilization of Lower-energy adaptive clustering hierarchal protocol with the intention of detecting such attacks. This framework collected data Wireless Sensor Network–DataSet (WSN-DS) as of NS-2 (Network Simulator). Subsequently, the amassed data was processed for generating 23 features. For recognizing and also for classifying the aforesaid attacks, Artificial Neural Networks (ANNs) classifier was well-trained on the regarded dataset. The outcomes evinced that the WSN-specialized dataset (WSN-DS) ameliorated the competency of IDS to attain the topmost classification accuracy rate.
Gautam Borkar et al. [19] propounded the clustering strategy and the adaptive classifier termed support vector machine (SVM) for ID in WSN. This approach employed an adaptive chicken swarm optimizations (CSO) algorithm for choosing a cluster head (CH) to diminish time consumption. Subsequently, the system utilized a 2-staged classification approach termed as adaptive classification. In this supervised learning scheme with IDS, an acknowledgment centric technique was deployed for reporting the malicious SN. Once recognized, a high-level security strategy together with intrusion response was rendered to other SN by which a secure packet transmission transpired between disparate SN. SVM is a powerful algorithm primarily for high-dimensional environments, as it uses little RAM, and performs well whenever there is a comfortable margin of difference among categories Here, the comparison outcomes corroborated that the system proffered pre-eminent output.
Han et al. [20] propounded an ID model grounded on autoregressive framework and game theory. The system ameliorated the ID by concerning the energy consumption (EC) of the ID and by obtaining the optimum defense model that balanced the system’s detection efficacy and EC by examining the framework’s mixed Nash’ equilibrium solutions. In the experiment, the prime indicator of the system’s EC was the process running time. The outcomes corroborated that the game model could lessen the EC and also could effectually estimate the attack time and next targeted cluster grounded on the game theory.
Riecker et al. [21] suggested the energy-efficient, lightweight framework, which exploited Mobile agents (MA) for ID grounded on the EC of the SN as a metric. This framework utilized a MA that gathered energy readings and alarmed an alert if unexpected changes transpired. The MA carried the node’s battery status. This status aided to predict the expected EC grounded on past observations with the utilization of linear regression prototype. The feasibility of MAs utilized for ID in WSN was verified. It also recognized the DoS attacks grounded on the EC metric. While examining the outcomes, the IDS were corroborated to attain excellent detection accuracy.
Mehmood et al. [22] paid attention to a knowledge-centric context-aware methodology to recognize the intrusions created by the prevailing malicious nodes. Primarily, the entire network was split into many fold clusters, and every cluster has a nominated head (node). The CH interacted with the existent base station (BS) and then delivered the events’ data to the knowledge base via inference engines. Significantly, the traffic was observed and a suspicious event created by the attacker node got blocked by the CH on account of knowledge-storage about the nature of all events. The Knowledge-centric IDS (KB-IDS) evinced practically acceptable outcomes contrasted to other non-security and security structures.
3 Proposed Intrusion Detection System in WSN
Security problems have become gradually more prominent on account of the broad application of WSN in the military in addition to environmental monitoring. Data that is being exchanged over WSN is susceptible to malevolent attacks on account of being short on physical defence equipment. Thus, equivalent schemes of ID are urgently required to defend in opposition to such attacks. For reducing this series effect on the WSN, [23] this paper proposed Quasi-Newton Neural Network-centered efficient IDS on the WSN environment. A neural group is a combination of techniques that attempts to detect hidden patterns in a series of measurements using a method that resembles how the brain processes information [24]. Neural networks, in this context, consist of a set of cells that can be biological or synthetic in origin. The proposed work comprises ‘2’ phases, namely the DG process in WSN, and an ID phase. In the DG, initially, SN is formed as a cluster since WSN has a big number of SN and a BS. In addition, the CH is selected centered on the DFFF [25–27]. Subsequently, the data is gathered as of the CH utilizing the discovered path, this phase is labeled as the DG phase. NSL-KDD (Kngarsol Knowledge Discovery in Databases) is an intelligence-gathering gathering designed to address some of the issues with the KDD’99 time series. Additionally, the NSL-KDD training, as well as test sets, has a significant quantity of recordings [28,29]. This benefit enables them to execute the tests on the entire set while having to pick a tiny sample at arbitrary times. In the ID phase, first, the training process is performed with the aid of the NSL-KDD dataset. Next, the data is preprocessed and the pre-processing phase comprises the ‘3’ steps: removal of redundant data, the string to numerical conversion, in addition to min-max normalizations. Then, the matrix format of the obtained output of the normalized value is lessened by utilizing the Entropy-centered Linear Discriminants Analysis (ELDA) algorithm. After lessening the unnecessary values, the output is inputted to the QN3 classifier, which classifies the sort of attack that affects the data and the possible attacks like DoS, R2L, U2R, Probe, and Normal. In the testing phase, the gathered data as of the WSN environment is inputted to the proposed IDS. Depended on the training result (explicitly, the training result is fixed as the targeted value), the intrusion is detected from the amassed data in WSN. The proposed IDS’s block diagram is evinced in Fig. 1.
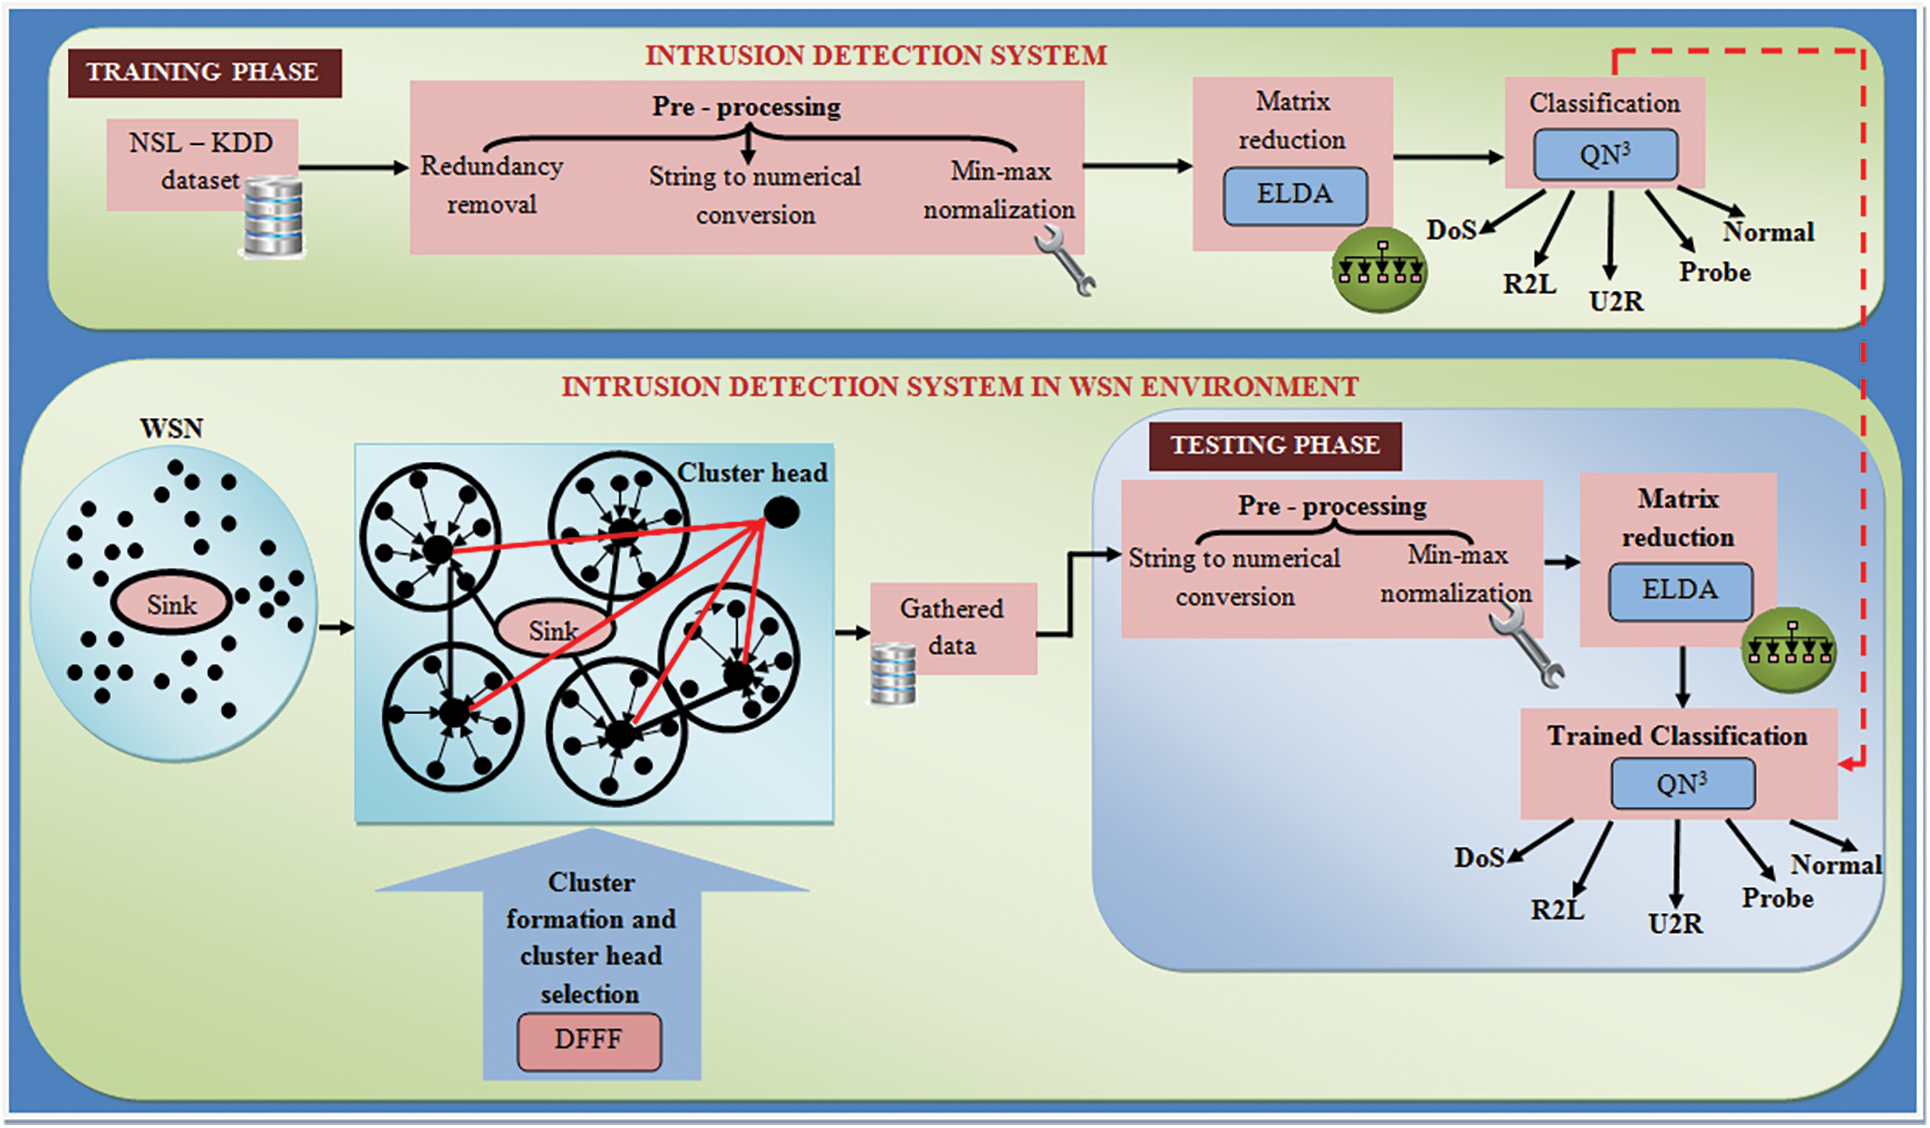
Figure 1: Block diagram for the proposed methodology
3.1 Cluster Formation and Cluster Head Selection
The SN and BS are deployed in the WSN. Thus, the SN is formed as clusters, and as of that, the CH is selected centred on the residual energy (Rse) utilizing the Distance Fruit Fly Fuzzy c-means (DFFF). The fuzzy c-means method performs better than the k-means algorithm. In contrast to the k-Means method, which requires that each piece of information correspond to a singular grouping, fuzzy c-means allows information elements to adhere to multiple clusters with a high degree of probability. The cluster formation is a procedure of grouping the SN on a network. In the proposed technique, the famous Fuzzy C-Means (FCM) is chosen for generating a cluster. FCM clustering protocols are centralized clustering algorithms. Here, consider a network of M sensor nodes, which is separated into clusters say c1,c2,….cn. Originally, the cluster centroid is arbitrarily selected on the FCM. The arbitrary centroid selection hasn’t rendered accurate clusters. So, to enhance the clustering procedure, the proposed work utilizes the distance-centred fruitfly optimization algorithm, this chooses the better centroid value and renders accurate cluster outcomes. Basic fruitfly optimization is comprised of ‘2’ phases. In the initial phase, the flies utilize their smell ability to fly via the food region. In the 2nd phase, they utilize their vision ability to get nearer. Firstly, set the parameters, including populace size, the maximal count of iterations, and the fruit fly’s location. The fruit flies are considered as the centroid values that mean the SN. Then, produce the individual SN’s location in the group,
where, r implies the range parameter, ui,vi signifies the SN’s location and uco,vco implies the SN’s co-ordinate value. Next, set the smell concentration’s judgment value Sci as the reciprocal of the distance as of the fruitfly (i.e., SN) to the origin:
wherein, Dche implies the distance betwixt the SN. The Fruit Fly Optimization Algorithm (FOA) is a novel approach for determining optimal solution that is predicated on the fruit fly’s food-finding behavior. The fruit fly outperforms comparable organisms in terms of sensitivity as well as cognition, particularly in apheresis and eyesight In a normal fruit fly algorithm, the distance is computed centred on Euclidean Distances (ED). However, the ED centred distance computation is feeble.
For a big number of values. Thus, here, the Chebyshev distance is employed, which takes the distance betwixt’2’sensor nodes ui and vi, correspondingly, is,
The Eq. (4) is more appropriate for the infinity value. After that, compute the odor concentration (Oc) of every individual fruit fly, which is mathematically implied as,
wherein, f(Sci) signifies the smell concentration’s fitness function (f). Next, find the maximal smell concentration’s value and its equivalent position is,
wherein, bs,bi signifies the best smell, best index and max(Oc) signifies the maximum smell concentration. Next, the fruitfly-swarm flies toward that location utilizing vision.
Lastly, iterate the number of generations until meeting the satisfying criteria. Then, the cluster centroid value is calculated based on this algorithm. Additionally, the Rse is fixed for the entire SN. The reason for the cluster formation in this protocol is to lessen the subsequent objective function (ηf):
wherein,
The ηf is minimized with regard to the distance betwixt the cluster center and the SN. Fuzzy partitioning is performed via an iterative optimization of the ηf that is exhibited in Eq. (9), with the update of membership centred on
Eq. (12) implies that every data point necessarily belongs to as a minimum of ‘1’ cluster, and hence, it is not isolated.
The iteration stops when
where, Rse states the difference betwixt the initial energy (Ine) and current energy (Cue) of the SN as well as the standard value is fixed as the Rse. The CH is chosen centred on this Rse. If the Rse of the CH is below the fixed threshold value, the CH is again chosen grounded on the residual f.
Here, gather the data as of the CH of the clusters in the discovered path of WSN. Here, the CH data is taken as of the members of the clusters. Therefore, the data is attained on the destination side and is proffered in below Eq. (15).
where, Gd-Gathered data from the SN
gn-“n”-number of data
Then, testing of data is done in a formerly trained classifier. The testing is similar to training process, but during pre-processing, the steps, namely (i) string to numerical conversion and (ii) min-max normalizations, are processed. Among the most prevalent methods of data normalizing is min-max normalization. The lowest value of every characteristic is converted to a 0, the highest value is converted to a 1, and all other values are converted to a fraction within 0 & 1. The IDS’ training process is expounded below.
3.3 Intrusion Detection System
An intrusion detection system (IDS) is an operating system program that watches for discrimination and prejudice or regulation breaches on the internet. A network monitoring platform is often used to notify or gather any harm to persons or contravention. Here, the gathered data is tested with the trained classifier. Here, the data picked from NSL-KDD data set “Qs” is expressed as,
where,
Moreover, the training process encompasses “3” phases, (i) pre-processing, (ii) matrix reduction together with (iii) classification, which are explicated below,
It is performed since IDS is very specific about the data source, which might be in the unclear format. Pre-processing of input data is done in three ways in this proposed methodology. Primarily, the redundant data existent in the considered dataset is eradicated. Then, the string values existent in the considered dataset are transmuted into numerical values by assigning specific values to disparate samples. For example, for service type ‘aol’ = 1, ‘auth’ = 2, ;bgp’ = 3, etc, for flag ‘oth’ = 1, ‘Rej’ = 2, etc and for protocol type: ‘TCP’ = 1, ‘UDP’ = 2 and ‘ICMP’ = 3. In this manner, for each feature, the categories are transmuted to numerical form. Then, the normalization of these numerical values is done with the utilization of min-max normalization. Min-max is the utmost straightforward normalization approach that creates the standard numerical gamut of the scores as of 0 to 1 and is proffered as,
where,
0, 1–Range
Finally, the attained (normalized) value is regarded as the matrix value, which comprises more attribute- relevant values. So, inessential values are reduced in the next matrix reduction step.
After pre-processing the matrix form, the normalized value about the attributes is lessened with the utilization of the Entropy-centric Linear Discriminant Analysis (ELDA). Fisher’s linear discriminant is a technique used mostly in survey data as well as other sectors to obtain a sequential subset of characteristics that distinguishes or differentiates data into two classes of occurrences. Regression model statistical technique (LDA), standard analysis of variance (NDA), and multiple regressions assessments is a generalization of Fisher’s linear classification algorithm. The Linear discriminant analysis (LDA) refers to a supervised subspace learning strategy and it is grounded on a Fisher Criterion. Primarily, the pre-processed value of the considered dataset is regarded. Consider
where
where,
Next, evaluate the mean corrected class matrix. Betwixt-class scatter matrix
where
The objective is to increase
The above ratio is found to be maximized only if the column vectors are the Eigen vectors of
where,
3.3.3 Classification Using QN3
After matrix reduction, the output value is given to the Quasi-Newton [27] Neural Network (QN3) as the input, which detects the possible attacks existent in the WSN environment. A neural network (NN) [23] works grounded on a supervised learning strategy as of the previous experiences of the system by attaining the labelled data as a training set. The utmost significant aspect that affects system performance is the selection of the Training Function. The selected function’s effect chiefly relies on the data size. The training function is varied grounded on the system’s loss calculation. The weight along with the bias value is updated after evaluating the loss. This updation is done centered on the Quasi-Newton’s approach since it finds better training directions by utilizing the 2nd derivatives of the loss function (LF). So, the proposed methodology is termed as the QN3 and its structure is displayed using Fig. 2.
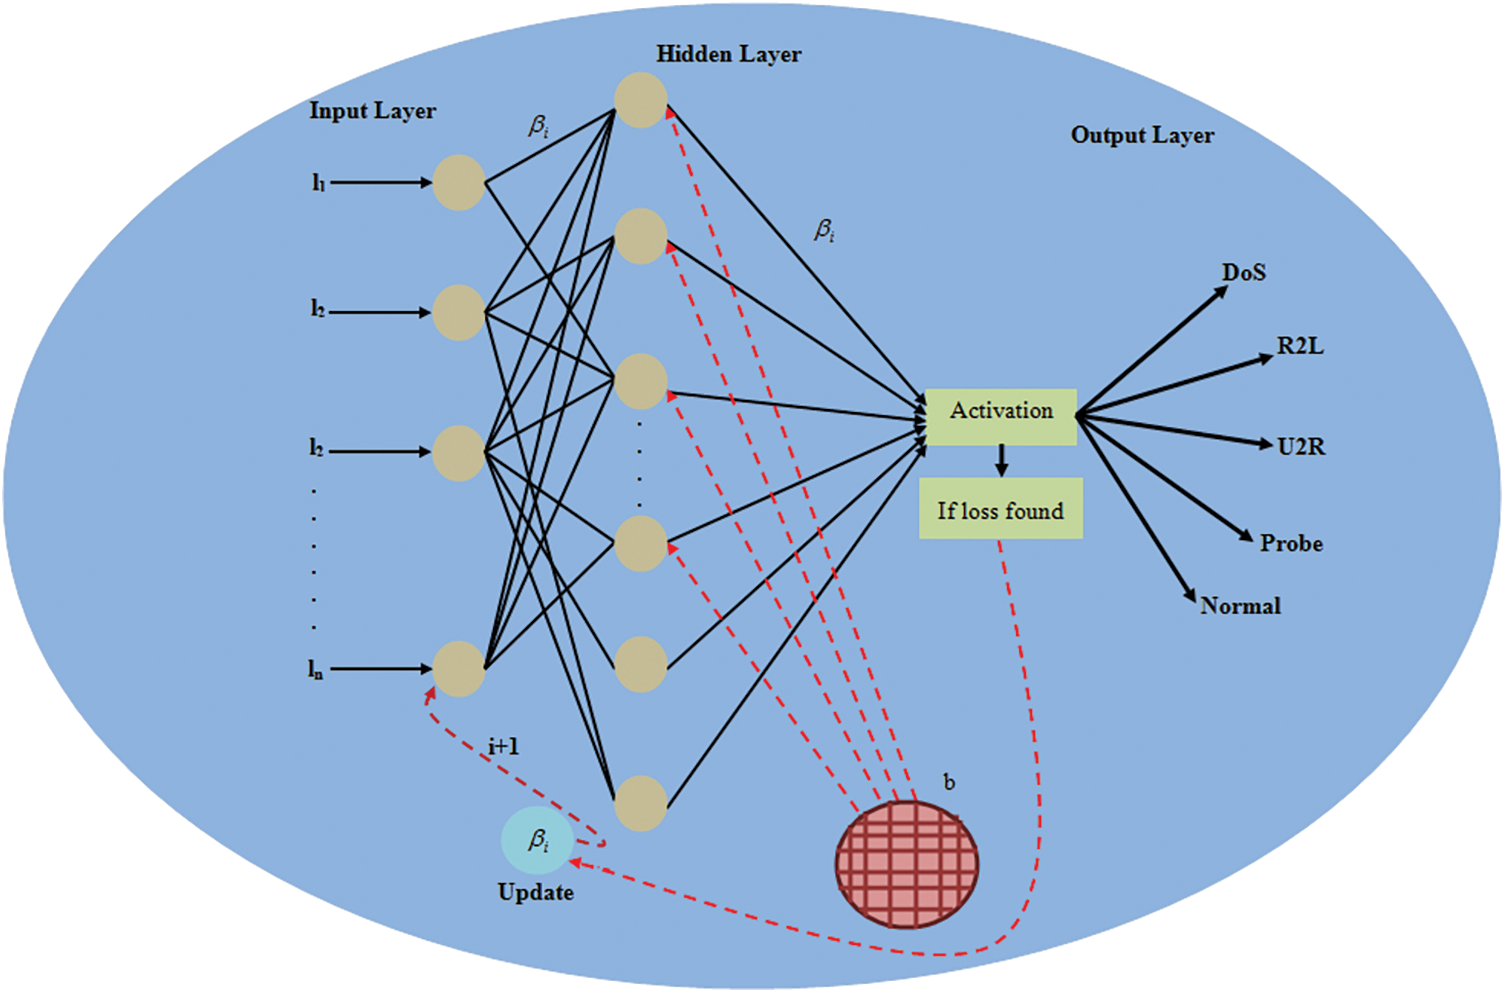
Figure 2: Structure of the QN3
Initially assign the n-number of input neurons and their weight value. Then, calculate the hidden layer
where,
Then, evaluate the output unit “
The proportion of an individual’s schedule space that is used for effective, chargeable activity is referred to as utilization. The utilization rate of development is an essential indicator for businesses to monitor. Afterward, the algorithm for training the network is normally grounded on the reduction of an energy function signifying the instantaneous error. That is, it assesses the error function of the output utilizing Eq. (27).
where,
To maintain minimum system error, the difference value between the acquired- and the target-output must be less. To lessen this value, the weights have to be updated. During training, the Quasi-Newton’s approach is utilized for updating the weight value and it performs numerous operations to lessen the Hessians matrix. Each variable is evaluated as,
where,
For the successful iterations, the
where,
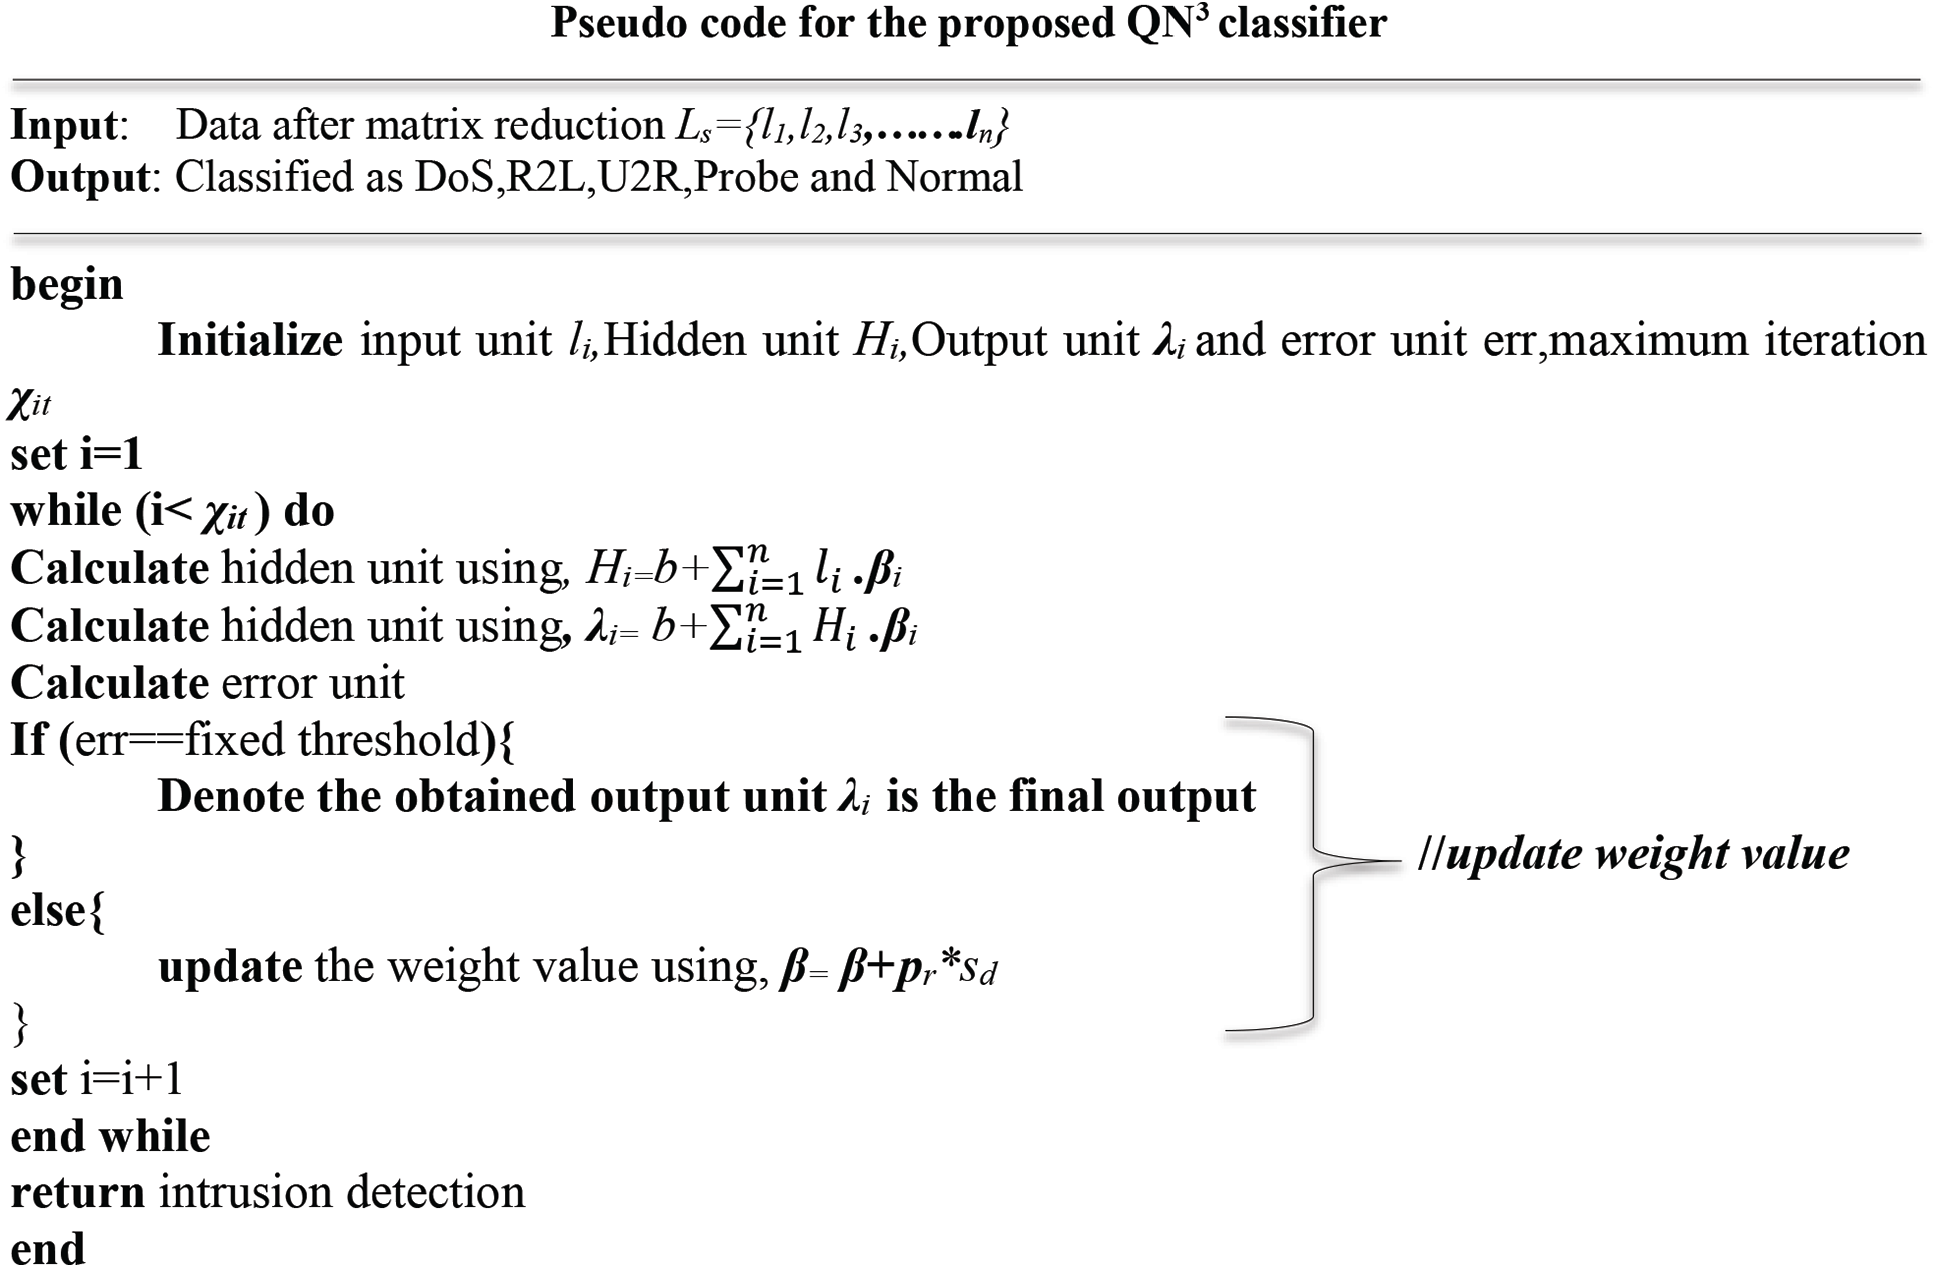
The Proposed QN3 pseudo-code detects the normal and attack data. The attacks detected are, DoS, U2R, R2L, and probe. Here, the hidden layer’s activation functions are expounded. Transfer functions are an important aspect of a neural network’s architecture. The underlying layer’s activating parameter controls how often the routing algorithm absorbs the classification model. The kind of forecasts the system may produce is determined by the perceptron used in the output nodes. After attaining the output unit, its LF is calculated. If its LF is minimum (that is, the minimal loss is fixed as the threshold), then it is the last output unit. Else, the weight value is updated with the presence of the Quasi-Newton approach. Then, iterate the system till the lossless output is met.
Here, the proposed IDS based QN3 classifier’s performance is analyzed by implementing it in the JAVA platform.
Aimed at performance analysis, the data from the NSL-KDD dataset is regarded as input for the training phase. NSL-KDD is the extension of the actual KDD cup dataset and its test-set has certain unknown attacks. The NN is experimented with 22544 records of full test dataset devoid of feature reduction as required.
Here, the proposed QN3 classifier’s performance with that of the ANN, SVM, together with KB is analyzed utilizing statistical metrics, say recall, specificity, accuracy, precision, along with F-Measure. The parameters that are computed are ‘true positive’, ‘true negative’, ‘false positive’, and ‘false negative’ values. Tab. 1 elucidates the proposed and existing classifier’s performance.

The proposed classifier’s performance is contrasted with the existing algorithms regarding recall, specificity, precision, accuracy, sensitivity, along with F-Measure. The comparisons are individually elucidated using graphical representations. The sequential study is a technical strategy for investigating speech evolution that involves comparing various languages having common inherited from a common predecessor and also extrapolation downstream to deduce the attributes of that ancestral species.
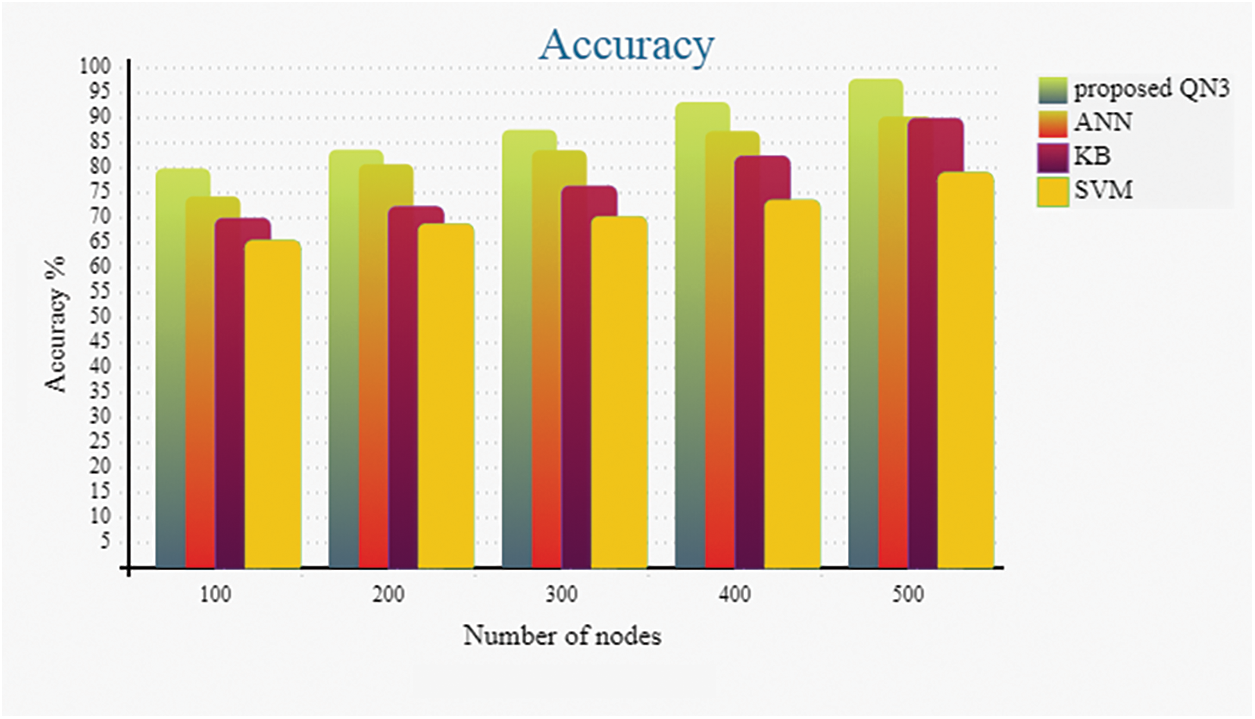
Figure 3: Accuracy analysis graph for proposed and existing classifiers
Discussion: Fig. 3 illustrates the accuracy comparative analysis for the proposed QN3 classifier with the SVM, KB along with ANN classifier. When the total SN is 100, the proposed classifier attains 79.90% accuracy; but for the same number of nodes, the ANN, KB, and SVM attains 74.34%, 69.89%, along with 65.46% accuracy correspondingly. This examination corroborates that the proposed QN3 gave a high accuracy. This achievement is not only for 100 nodes, but it also continued for every node variations, like 200 to 500 variations. The major objective of the proposed work is to enhance the accuracy, which it successfully execute i.e., it acquires high accuracy with the utilization of the QN3 classifier.
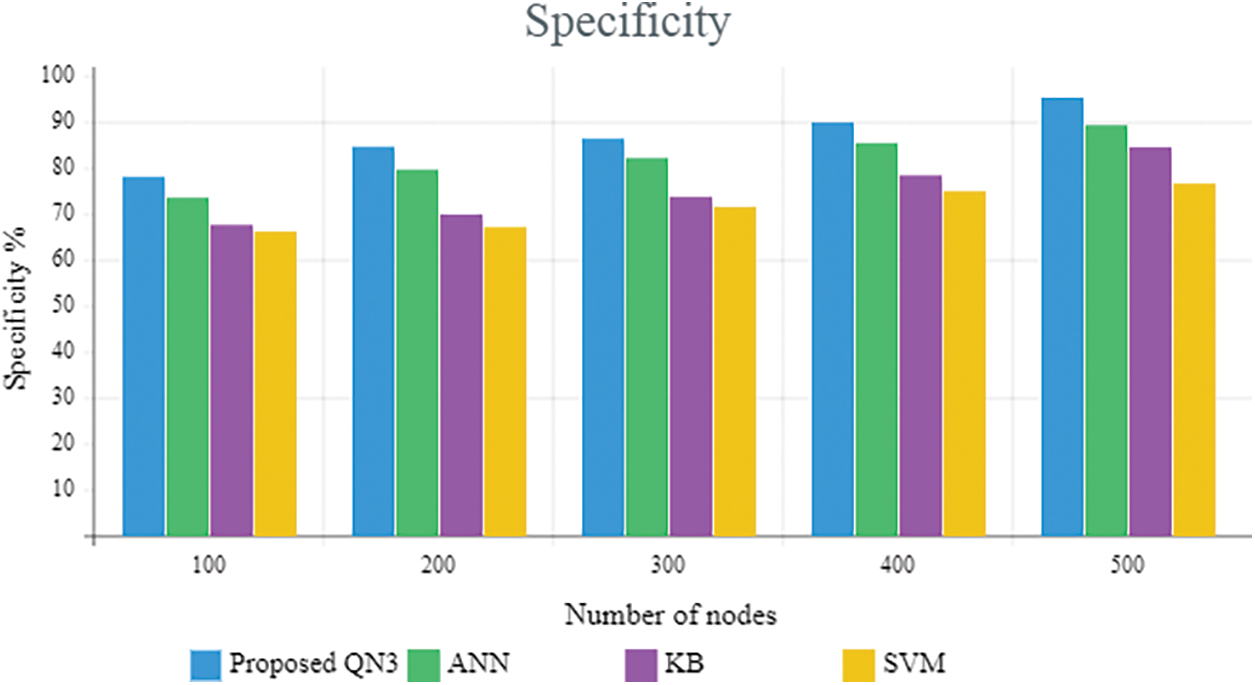
Figure 4: Comparative analysis based on the specificity metric
Discussion: Fig. 4 contrasted the proposed IDS utilizing the QN3 classifier with the prevailing classifiers’ performance. The specificity metric exhibits the number of negatives (explicitly, misbehaviour) recognized accurately. The proposed work highly recognized the misbehaviour of the scheme in the WSN, which is established with the aid of the above specificity graph. When the node count is 300, the specificity gamut of the prevailing classifiers is under 84%, however, for the same node count, the proposed one attains the 86.80% specificity, which obviously illustrates that the proposed classifier simply gains the improved outcome. Likewise, for other node counts, the proposed work acquires ameliorated performance. Therefore, the discussion illustrates that the proposed IDS utilizing the QN3 system is effectively performed for the ID on the WSN.
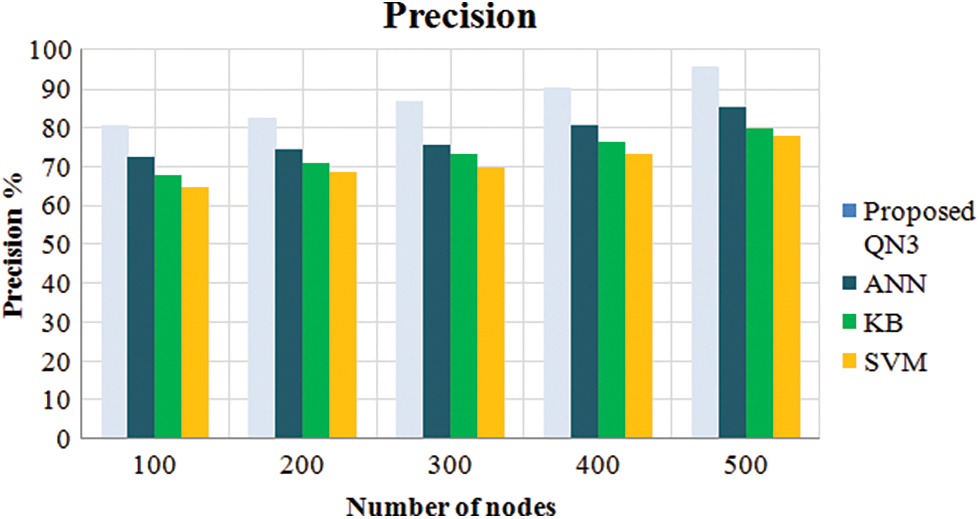
Figure 5: Compared the performance of the proposed classifier with the existing classifiers
Discussion: Fig. 5 is the graphical portrayal of the comparative analysis centred on the precision measure. The precision measure describes the number of features as of the solution that is correct as per the data. Here, the precision is examined centred on node counts (i.e., 100 to 500 nodes). When the node count is 400, the proposed classifier has 89.93% accuracy but the prevailing algorithms achieve lower precision. In addition, the prevailing algorithms also attain lesser precision value for all the remaining node counts. Therefore, it deduced that the proposed work offers improved performance.
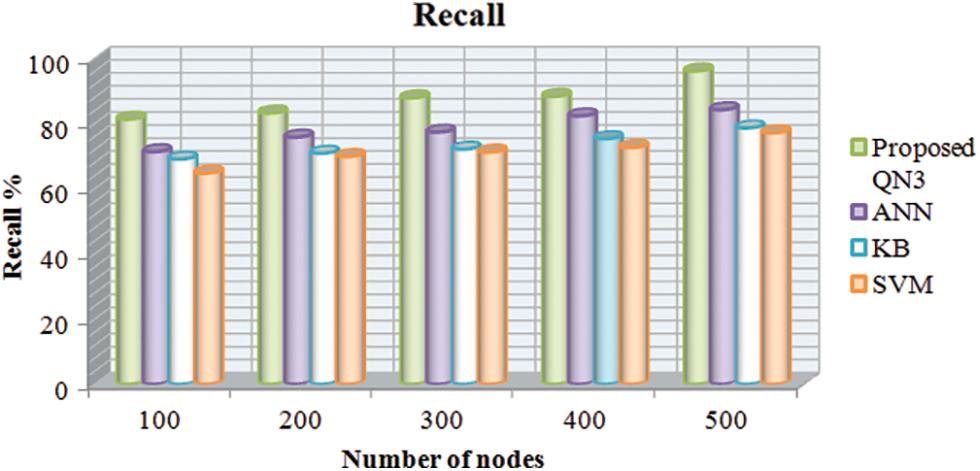
Figure 6: Compare the performance of the proposed classifier with the existing classifiers in terms of recall metric
Discussion: Fig. 6 compared the classifiers utilized for IDS grounded on the recall metric. For 200 node count, the QN3 classifier attains 83.23% recall but the existing classifiers, that is ANN, KB, and SVM has achieved 75.82%, 70.89%, together with 69.89%, which is low compared to the proposed system. The ANN and KB dramatization is not the lowest performance, which is much better contrasted to the SVM. In addition, the data amassed from the remaining number of node count is 100, 300, 400 as well as 500 wherein the proposed classifier attains better performance. It deduced that the proposed work offers improved performance than the prevailing classifiers.
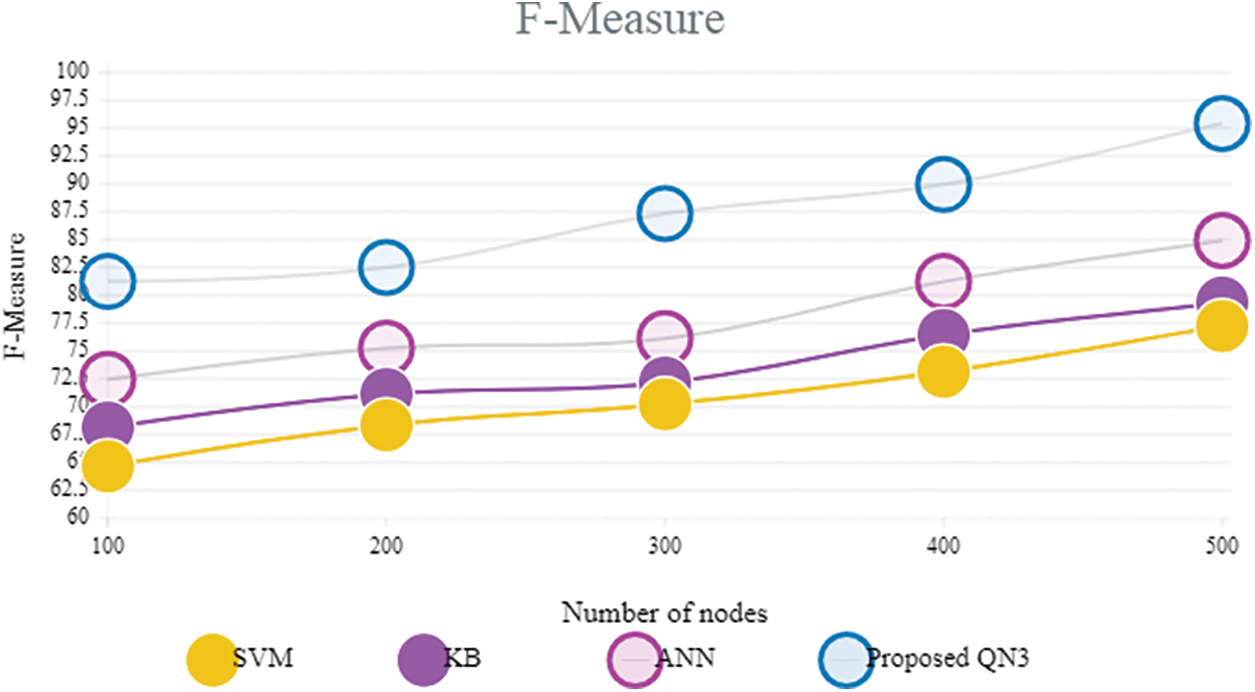
Figure 7: Comparative analysis based on F-measure terms
Discussion: Fig. 7 contrasts the proposed QN3 classifier with the prevailing classifiers in respect of F-measure. The metric “F-measure” signifies the harmonic mean of recall along with precision. Previously, centred on precision along with recall measure, the QN3 classifier attains improved outcome; though, grounded on the F-measure also, the proposed classifier achieves improved performance. For 500 node count, the proposed QN3 has 95.42% f-measure; similarly, for 100 to 400 nodes, it attains high results on considering the prevailing classifiers.
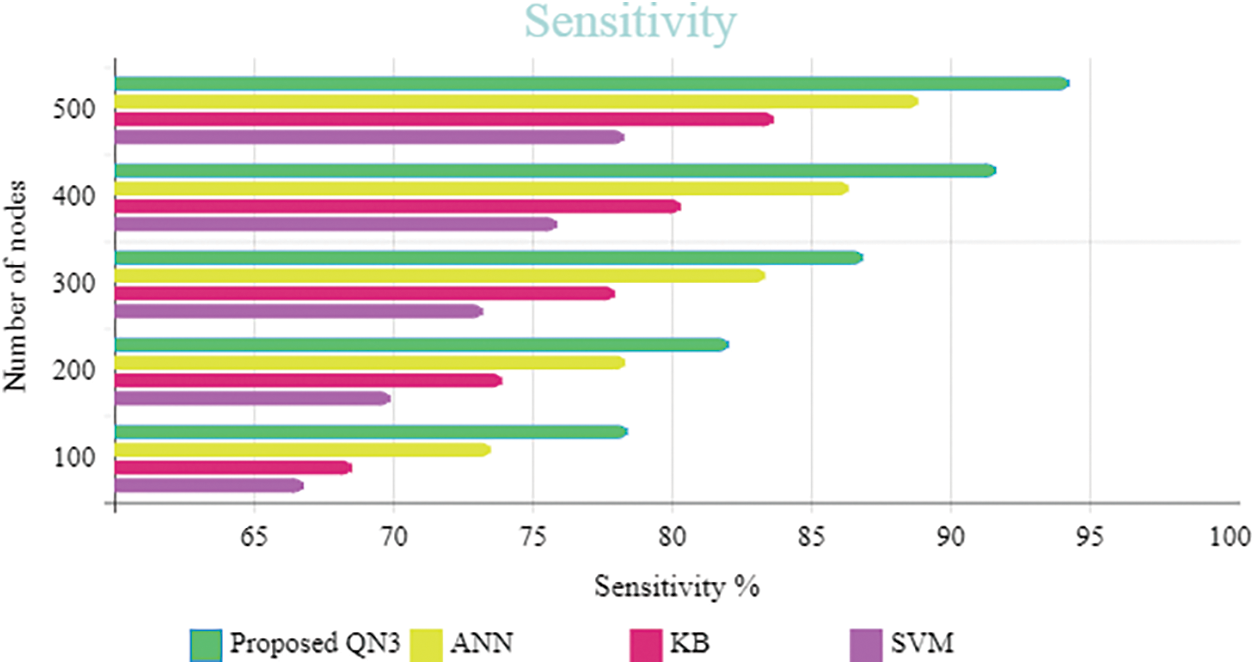
Figure 8: Performance analysis for the proposed and existing classifiers based on the sensitivity
Discussion: Fig. 8 demonstrates the graphical demonstration comparison of the QN3 with the SVM, KB, along with ANN centred on the sensitivity metric. The contrast is made centred on node count variation. The sensitivity measure describes the number of positives recognized rightly by the classifiers. The ID centred on the QN3 classifier scheme attains 94.17% sensitivity for 500 node count. For the similar node count, the prevailing classifier attains lower performance to the proposed classifiers. Therefore, this contrast illustrates that the proposed work attains improved performance than the prevailing classifiers.
ID is the defence mechanism utilized in sensor networks, which is more competent to detect unknown attacks. Researchers found that the IDS are more compatible to sensor networks. The existing research techniques rendered low performance in respect of accuracy measures. Hence, this research aims to ameliorate the IDS’s accuracy. For which, this work proposed Quasi-Newton Neural Network-centric IDS in the WSNs. The proposed work performs 2 chief phases like (i) the data gathering process in WSN, along with (ii) an ID phase encompassing training phase and testing phase. And, the proposed system’s performance is examined in this work by regarding a disparate number of nodes (100 to 500). The performance shown by the proposed and the existing ANN, KB, and SVM systems is contrasted in respect of F-Measure, recall, precision, sensitivity, accuracy, and specificity. The proposed one attains 97.84% accuracy for 500 nodes, which corroborated that the proposed classifier centric IDS attain superior performance on considering the existing methodologies. In the future, the proposed system could be extended by providing security in the WSN environment for protecting the system as of intrusion utilizing advanced cryptographic algorithms.
Funding Statement: The authors received no specific funding for this study.
Conflicts of Interest: The authors declare that they have no conflicts of interest to report regarding the present study.
References
1. O. Said and E. Alaa, “Scaling of wireless sensor network intrusion detection probability: 3D sensors, 3D intruders, and 3D environments,” EURASIP Journal on Wireless Communications and Networking, vol. 2015, no. 1, pp. 46, 2015. [Google Scholar]
2. G. Kalnoor and J. Agarkhed, “Preventing attacks and detecting intruder for secured wireless sensor networks,” in Int. Conf. on Wireless Communications, Signal Processing and Networking (WiSPNET), Chennai, India. IEEE, pp. 1062–1067, 2016. [Google Scholar]
3. M. Elrawy, A. Awad and H. Hamed, “Intrusion detection systems for IoT-based smart environments: A survey,” Journal of Cloud Computing, vol. 7, no. 1, pp. 21, 2018. [Google Scholar]
4. J. Agarkhed, G. Kalnoor and S. R. Patil, Intrusion detection system using pattern matching techniques for wireless sensor networks. In: Innovations in Computer Science and Engineering. Singapore: Springer, pp. 411–418, 2019. [Google Scholar]
5. R. Zhang and X. Xiao, “Intrusion detection in wireless sensor networks with an improved nsa based on space division,” Journal of Sensors, vol. 2019, no. 1, pp. 1–20, 2019. [Google Scholar]
6. W. Zhang, D. Han, K. -C. Li and F. I. Massetto, “Wireless sensor network intrusion detection system based on MK-ELM,” Soft Computing, vol. 1, pp. 1–14, 2019. [Google Scholar]
7. M. Abo-Zahhad, S. M. Ahmed, N. Sabor and S. Sasaki, “Mobile sink-based adaptive immune energy-efficient clustering protocol for improving the lifetime and stability period of wireless sensor networks,” IEEE Sensors Journal, vol. 15, no. 8, pp. 4576–4586, 2015. [Google Scholar]
8. B. -H. Liu, N. -T. Nguyen, V. -T. Pham and Y. -S. Luo, “On maximizing the lifetime for data aggregation in wireless sensor networks using virtual data aggregation trees,” Computer Networks, vol. 105, pp. 95–110, 2016. [Google Scholar]
9. A. Diaz and P. Sanchez, “Simulation of attacks for security in wireless sensor network,” Sensors, vol. 16, no. 11, pp. 1932, 2016. [Google Scholar]
10. E. V. Balan, M. K. Priyan, C. Gokulnath and G. U. Devi, “Fuzzy based intrusion detection systems in MANET,” Procedia Computer Science, vol. 50, no. 6, pp. 109–114, 2015. [Google Scholar]
11. V. Hajisalem and S. Babaie, “A hybrid intrusion detection system based on ABC-AFS algorithm for misuse and anomaly detection,” Computer Networks, vol. 136, pp. 37–50, 2018. [Google Scholar]
12. W. Meng, W. Li and L. -F. Kwok, “EFM: Enhancing the performance of signature-based network intrusion detection systems using enhanced filter mechanism,” Computers & Security, vol. 43, no. 6, pp. 189–204, 2014. [Google Scholar]
13. S. Behal, K. Kumar and M. Sachdeva, “D-FACE: An anomaly based distributed approach for early detection of DDoS attacks and flash events,” Journal of Network and Computer Applications, vol. 111, no. 18, pp. 49–63, 2018. [Google Scholar]
14. H. Liu and B. Lang, “Machine learning and deep learning methods for intrusion detection systems: A survey,” Applied Sciences, vol. 9, no. 20, pp. 4396, 2019. [Google Scholar]
15. H. M. Salmon, C. M. de Farias, P. Loureiro, L. Pirmez, S. Rossetto et al., “Intrusion detection system for wireless sensor networks using danger theory immune-inspired techniques,” International Journal of Wireless Information Networks, vol. 20, no. 1, pp. 39–66, 2013. [Google Scholar]
16. A. Alazab, M. Hobbs, J. Abawajy, A. Khraisat and M. Alazab, “Using response action with intelligent intrusion detection and prevention system against web application malware,” Information Management & Computer Security, vol. 22, no. 5, pp. 431–449, 2014. [Google Scholar]
17. K. Selvakumar, K. Marimuthu, L. SaiRamesh, S. K. Hafizul Islam, M. Mehedi Hassan et al., “Intelligent temporal classification and fuzzy rough set-based feature selection algorithm for intrusion detection system in WSNs,” Information Sciences, vol. 497, no. 11, pp. 77–90, 2019. [Google Scholar]
18. I. Almomani, B. Al-Kasasbeh and M. Al-Akhras, “WSN-DS: A dataset for intrusion detection systems in wireless sensor networks,” Journal of Sensors, vol. 2016, no. 2, pp. 1–16, 2016. [Google Scholar]
19. M. Gautam Borkar, L. H. Patil, D. Dalgade and A. Hutke, “A novel clustering approach and adaptive SVM classifier for intrusion detection in WSN: A data mining concept,” Sustainable Computing: Informatics and Systems, vol. 23, no. 5, pp. 120–135, 2019. [Google Scholar]
20. L. Han, M. Zhou, W. Jia, Z. Dalil and X. Xu, “Intrusion detection model of wireless sensor networks based on game theory and an autoregressive model,” Information Sciences, vol. 476, no. 3, pp. 491–504, 2019. [Google Scholar]
21. M. Riecker, S. Biedermann, R. El Bansarkhani and M. Hollick, “Lightweight energy consumption-based intrusion detection system for wireless sensor networks,” International Journal of Information Security, vol. 14, no. 2, pp. 155–167, 2015. [Google Scholar]
22. A. Mehmood, A. Khanan, M. Muneer Umar, S. Abdullah, K. A. Zainol Ariffin et al., “Secure knowledge and cluster-based intrusion detection mechanism for smart wireless sensor networks,” IEEE Access, vol. 6, pp. 5688–5694, 2017. [Google Scholar]
23. F. Niaz, M. Khalid, Z. Ullah, N. Aslam, M. Raza et al., “A bonded channel in cognitive wireless body area network based on IEEE 802.15.6 and internet of things,” Computer Communications, vol. 150, no. 3, pp. 131–143, 2020. [Google Scholar]
24. J. Bobadilla, F. Ortega, A. Gutiérrez and S. Alonso, “Classification-based deep neural network architecture for collaborative filtering recommender systems,” International Journal of Interactive Multimedia and Artificial Intelligence, vol. 6, no. 1, pp. 68–77, 2020. [Google Scholar]
25. N. Saleem and M. I. Khattak, “Deep neural networks for speech enhancement in complex-noisy environments,” International Journal of Interactive Multimedia and Artificial Intelligence, vol. 6, no. 1, pp. 84–90, 2020. [Google Scholar]
26. N. Nguyen, B. Liu, S. Chu and H. Weng, “Challenges, designs, and performances of a distributed algorithm for minimum-latency of data-aggregation in multi-channel WSNs,” IEEE Transactions on Network and Service Management, vol. 16, no. 1, pp. 192–205, 2019. [Google Scholar]
27. Y. Ibrahim, S. Kamel, A. Rashad, L. Nasrat and F. Jurado, “Performance enhancement of wind farms using tuned sssc based on artificial neural network,” International Journal of Interactive Multimedia and Artificial Intelligence, vol. 5, no. 7, pp. 118–124, 2019. [Google Scholar]
28. S. Lokesh, M. K. Priyan, M. Ramya Devi, P. Parthasarathy and C. Gokulnath, “An automatic tamil speech recognition system by using bidirectional recurrent neural network with self-organizing map,” Neural Computing and Applications, vol. 31, no. 5, pp. 1521–1531, 2019. [Google Scholar]
29. P. Mohamed Shakeel, T. E. E. Tobely, H. Al-Feel, G. Manogaran and S. Baskar, “Neural network-based brain tumor detection using wireless infrared imaging sensor,” IEEE Access, vol. 7, pp. 5577–5588, 2019. [Google Scholar]
Cite This Article
 Copyright © 2023 The Author(s). Published by Tech Science Press.
This work is licensed under a Creative Commons Attribution 4.0 International License , which permits unrestricted use, distribution, and reproduction in any medium, provided the original work is properly cited.
 Downloads
 Citation Tools