DOI:10.32604/csse.2023.027512
| Computer Systems Science & Engineering DOI:10.32604/csse.2023.027512 | |
| Article |
Hybrid Deep Learning Method for Diagnosis of Cucurbita Leaf Diseases
1M. Kumarasamy College of Engineering, Karur, Tamilnadu, India
2K. P. R. Institute of Technology, Coimbatore, Tamilnadu, India
*Corresponding Author: V. Nirmala. Email: nirmalavelusamyphd@gmail.com
Received: 19 January 2022; Accepted: 25 March 2022
Abstract: In agricultural engineering, the main challenge is on methodologies used for disease detection. The manual methods depend on the experience of the personal. Due to large variation in environmental condition, disease diagnosis and classification becomes a challenging task. Apart from the disease, the leaves are affected by climate changes which is hard for the image processing method to discriminate the disease from the other background. In Cucurbita gourd family, the disease severity examination of leaf samples through computer vision, and deep learning methodologies have gained popularity in recent years. In this paper, a hybrid method based on Convolutional Neural Network (CNN) is proposed for automatic pumpkin leaf image classification. The Proposed Denoising and deep Convolutional Neural Network (CNN) method enhances the Pumpkin Leaf Pre-processing and diagnosis. Real time data base was used for training and testing of the proposed work. Investigation on existing pre-trained network Alexnet and googlenet was investigated is done to evaluate the performance of the proposed method. The system and computer simulations were performed using Matlab tool.
Keywords: Cucurbita; farming; disease; diagnosis; classification; Convolutional Neural Network (CNN); preprocessing; deep learning
The Agricultural land is important source for feeding the society and the Indian economy is greatly relying on agricultural productivity. Hence in the field of agriculture, disease detection plays a major role. For the detection of plant disease, autonomous detection methods are advantageous. For example, a disease called “little leaf disease” that is highly hazardous is found in pine trees in United States. The Diseased tree dies within 6 years. This happened in Alabama, Georgia parts of Southern US. Due to these circumstances early detection of diseases is very beneficial [1]. The Requirement of greater safety and higher quality in agricultural products is now playing a major role. Various methods that include thermography [2], immune-fluorescence techniques [3], fluorescence imaging, gas chromatography techniques, chain reactions and DeoxyriboNucleic Acid (DNA)/RiboNucleic Acid (RNA) based affinity biosensor [4] etc., are widely used for evaluating the quality of the leaves. The above-mentioned methods contain some disadvantages which include, inefficiency, and inconsistency and broadly prolonged. Hence there is an urgent need to consider an automatic and accurate method that is less expensive and effective [5].
1.1 Data Mining in Image Processing Techniques
Data mining is defined as a process of collecting and gathering the required information from a voluminous resource. The development of data mining techniques is inherited in the plant disease prediction problems. At present many technologies are widely used for the prediction of plant diseases [6–8]. Machine learning algorithms for image classification are mainly suitable for prediction [9,10]. These types of ML approaches are simple to implement and they perform well when compared to other classical statistical approaches. Rather than beginning with an image data model, Machine learning (ML) works using algorithms that studies the relationship between the response and its predictors. Through the learning phase Machine Learning (ML) algorithm analyses the input and responses for the purpose of finding dominant patterns.
1.2 Needs for Pumpkin Leaf Disease Identification
India is one of the greatest international pumpkin producers. The downy mildew, powdery mildew, gummy stems blight diseases occur in pumpkin and destroys the leading fiscal progression in the agricultural sector. Over the years, right from the beginning to so far it has been observed that the Cucurbita pepo are harvested for the purpose to eat and it stays as a essential harvest crop endlessly. As a result of its wholesome requirements, it is produced greatly and accessible widely for its indoor and commercial purposes. This paper concentrates mainly on the classification of the above mentioned diseases in pumpkin leaves.
Jiang et al. (2019) [11] used deep learning approach based on improved Convolutional Neural Networks (CNNs) or ConvNet. A GoogLeNet Inception structure and Rainbow concatenation and Apple Leaf Disease Dataset (ALDD) was used to detect common types of apple leaf diseases such as Alternaria leaf spot, Brown spot, Mosaic, Grey spot, and Rust. Ashourloo et al. (2016) [12] coined a partial least square regression (PLSR), v support vector regression (v-SVR) and Gaussian Process Regression (GPR) methods for wheat leaf rust disease detection. A Non Imaging Spectroradiometer was used for detection of spectra of the infected and non infected leaves in different disease symptoms at 350 to 2500 nm of electromagnetic region. A Digital camera evaluates the disease severity and symptoms fractions. The Result are evaluated based on the coefficient of determination (R2) and Root Mean Square Error (RMSE). Kaur et al. (2018) [13] framed a rule based semi-automatic system in terms of k-means was designed and implemented to differentiate healthy Soybean leaves from diseased leaves. The Diseased Leaf was divided into three classifications namely Frog eye, Septoria leaf blight and downy mildew. The Support Vector Machine classifier evaluated to train three models individually by adopting colour and texture features. It also processed on detection of disease in Soybean. Singh et al. (2019) [14] invoked Multilayer Convolutional Neural Network (MCNN) for diagnosis and classification of the Mango leaves infected by the Anthracnose fungal disease. Schor et al. (2016) [15] used robotic detection system for detecting of two majority threats of greenhouse bell peppers namely Powdery mildew (PM) and Tomato Spotted Wilt Virus (TSWV). The Principal Component Analysis (PCA) and the Coefficient of Variation (CV) are used construct a number of detection algorithms. In Tomato spotted wilt virus (TSWV), Principal Component Analysis (PCA) based classification with leaf vein removal resulted with 90% of classification accuracy. Huang et al. (2014) [16] innovated New Spectral Indices (NSIs) obtaines from weighted combination of a single band and a normalized wavelength difference of two bands for detecting different diseases in crops. Luo et al. (2013) [17] used spectral features (SFs) by evaluation of four methods to detect aphid density of wheat leaf and estimation of aphid density based on Partial Least Square Regression (PLSR). The Experiment was made on 60 wheat leaves with different aphid densities. Lin et al. (2019) [18] stimulated a unified Convolutional Neural Network (CNN) designating the Matrix-based Convolutional Neural Network (M-bCNN). This Method is ahallmark convolutional kernel matrix. The Experimental samples are images of winter wheat leaf diseases collected from Shandong Province, China with a total of 16652 images ordered in eight categories and augmented into 83260 images. Kaur et al. (2017) [19] used Legumes a two stage method for detection of infected leaf region percentage. In First stage categorizes the disease and healthy leaf sample. In Second stage, identification of infected region and detection of infected area. Based on the texture feature classification of healthy and diseased leaves are identified accurately in infected region of legumes specially in Groundnut and Soybean. Shrivastava et al. (2014) [20] used colour image sensing and processing based infected lesion detection method for detecting the problems associated in soya bean cultivation. It used structural texture and normalized Discrete Cosine Transform (DCT)-based feature descriptors. Jadhav and Patil (2015) [21] innovated a k clustering. This K clustering has a Square Euclidian distances method. The Experiment was made on samples of Bacterial Leaf Blight Septoria Brown spot, Bean Pod Mottle Virus infected soybean leaf images. The K clustering detects automatically classifies the infected leaf and evaluate the pest control measurement based on segmented diseased region and ratio of unit pixel in the leaf region.
Gharge and Singh (2016) [22] framed an Image enhancement technique and used k-means segmentation algorithm for detection of Frogeye, Downy mildew and Bacterial Pustule disease of Soybean and also processed with Neural Network. The Experiment resulted with 93.3% of accuracy for 30 images in detection of Soybean disease severity and diagnosis the diseases infected area. Gavhale and Gawande (2014) [23] coined a detection system to diagnosis of diseases in the crops and examined benefits and limitations of these potential methods. This Technique used multiple steps namely features extraction, neural network based classification, image pre-processing, image pre-processing with a proper management strategies for obtaining a quality and quantity agricultural products with diseases control measurements. Barbedo (2016) [24] revealed the challenges in the techniques and its recovery problems in diseases detection for the last two decades. It had a risk evaluation task in acquirement of simultaneous diseases at same time, complex backgrounds, detection in boundaries symptoms, image analysis of unconfined capture at a condition and a extended range of diseases characteristics with the subjects. It defines few recovery methods for the problems in diseases detection. Chouhan et al. (2018) [25] stimulated a bacterial foraging optimization based radial basis function neural network (BRBFNN). It used soft computing approach for automatic segmentation of diseases in the leaf images from plants and a region growing algorithm used for finding and merging of seed points with common attributes. It also used a Bacterial Foraging optimization for allocation of optimal weight to radial basis function neural network and authors also performed an experiment on some common fungal diseases. Sujatha et al. (2017) [26] used image processing for detecting diseases in the leaf of a plant by utilizing the Matlab. The Detection of diseases is made with a followed process namely, features extraction, Red, Green, And Blue (RGB) to Hue, Saturation, and Intensity (HIS) conversion, augmentation of image and Support Vector Machine (SVM) respectively. It helps to identify diseased crop and diagnosis diseases in agriculture field and ensure it to an economical value of market. Zhang et al. (2018) [27] used an improved GoogLeNet and Cifar10 models based on deep learning. It had lesser number of parameter than Visual Geometry Group Network(VGGnet) and AlexNet structures. The Eight varieties of maize leaf diseases are made to an experiment in terms of varying pooling combinations, adding dropout operations and rectified linear unit functions, and lowering the number of classifiers. The Experiment resulted with an average identification accuracy of 98.9% by GoogLeNet and average identification accuracy of 98.8% by Cifar10 model. Martinelli et al. (2014) [28] used modern methods based on nucleic acid and protein analysis. Bashish et al. (2011) [29] used image processing based software solution for automatic detection and classification of plant leaf diseases. The Developed Neural Network classifier based on statistical classification evaluates all sampled types of leaf diseases and results with a precision of 93% than K-means clustering technique result in segmentation RGB images. The FNN is very apt for value prediction, but this study focuses on directional prediction that paved a way for classification with the use of probabilistic neural network (PNN).
2.1 Fundamentals of Image Classification
The Image classification process is done in three various levels of evaluations such as image preprocessing, feature extraction and classification. Lastly, the affected disease if detected with the help of image classification algorithm and the accuracy of the classification results are estimated. In the current section, the above given three steps are described in detail.
2.1.1 Image Pre-Processing Algorithms
A Standard median filter is produced by orderly arranging the input samples in ascending order and choosing the input one as the median value, if there exists odd number of samples. Else the medial filter, will take any value of input sample that is placed between the two median values (it is usually an arithmetic average) (G. Mikolajczak and Peksinski, 2016) [30].
The Digital images are indicated by a set of pixels that have intensity values (Lyakhov et al. 2019) [31]. Considering the straightforwardness of the statement, let us consider grayscale images, that have intensity values which are encoded with 8-bit numbers and vary from 0 (black color) to 255 (white color). At this stage, many models of impulse noise are familiar. The variation among these models is necessary unless the fact of the existence of distortion in the image pixel is established. For the purpose of removal of noise a wavelet transform is used, that removes the noise which exists in the image in high and low frequency regions with different size and structures. By using 2D discrete wavelet transform (DWT) four frequency sub-band images Low-Low (LL), Low- High (LH), High-Low (HL) And High-High (HH) are obtained. This contains one sub-band image (LL) for approximation and three detailed sub-band images (LH, HL, and HH). (Choi and Jeong, 2018) [32].
Once the filtering algorithms are applied, the image undergoes segmentation process that includes, Sobel, Prewitt, Roberts, LoG, Canny edge detection, basic global thresholding and Otsu’s global thresholding (Adatrao and Mittal, 2016) [33]. The thresholding process changes the given image into binary image which clearly differentiates between the object and the background by gray levels of 1 and 0 accordingly. The Basic Global Thresholding (BGT) (Chaubey, 2016) [34] calculates the gio-bai threshold T for the given image by following an iterative procedure. By calculating the mean of all gray level images the initial estimate of T is found. Next segmentation is done for the image with the help of T, this yields two pixel groups G1 and G2. G1 contains all pixels that have greater intensity when compared to T and G2 contains all pixels that have less intensity or equal intensity when compared with T. Then the calculation of average intensities of m1 and m2 is done for the pixels in region G1 and G2 respectively. The Eq. (1) expresses the value for new threshold.
The above steps are followed repeatedly till the difference of T in the successive iterations is lesser than few predefined value, ΔT. Along with basic global thresholding (BGT), there exists another two active contour models on the basis of image segmentation is accessible. One of them is edge based method and the other is region based. In edge based active contours an edge detector is present, and it is on the basis of the image gradient approach, which locates the sub-region boundary and for the drawing the contours to the boundaries detected. Edge based approaches are similar to the edge based segmentation. In region based active contours usually make use of statistical information of image intensity within every subset rather than searching for geometrical boundaries. Region-based approaches are also similar to the region-based segmentation (Baswaraj et al. 2012) [35].
2.3 Feature Extraction Algorithms
Feature extraction is a process of extracting the features of the leaves such as color, texture etc., The Extraction of texture features can be done by using of many algorithms namely Fractal based description, Gabor filter and Markov Random field etc., The reason behind the texture analysis of the leaf is that it gives relationship between various gray levels of the image and it gives a detailed analysis about the nature of the texture other than the frequency based texture.
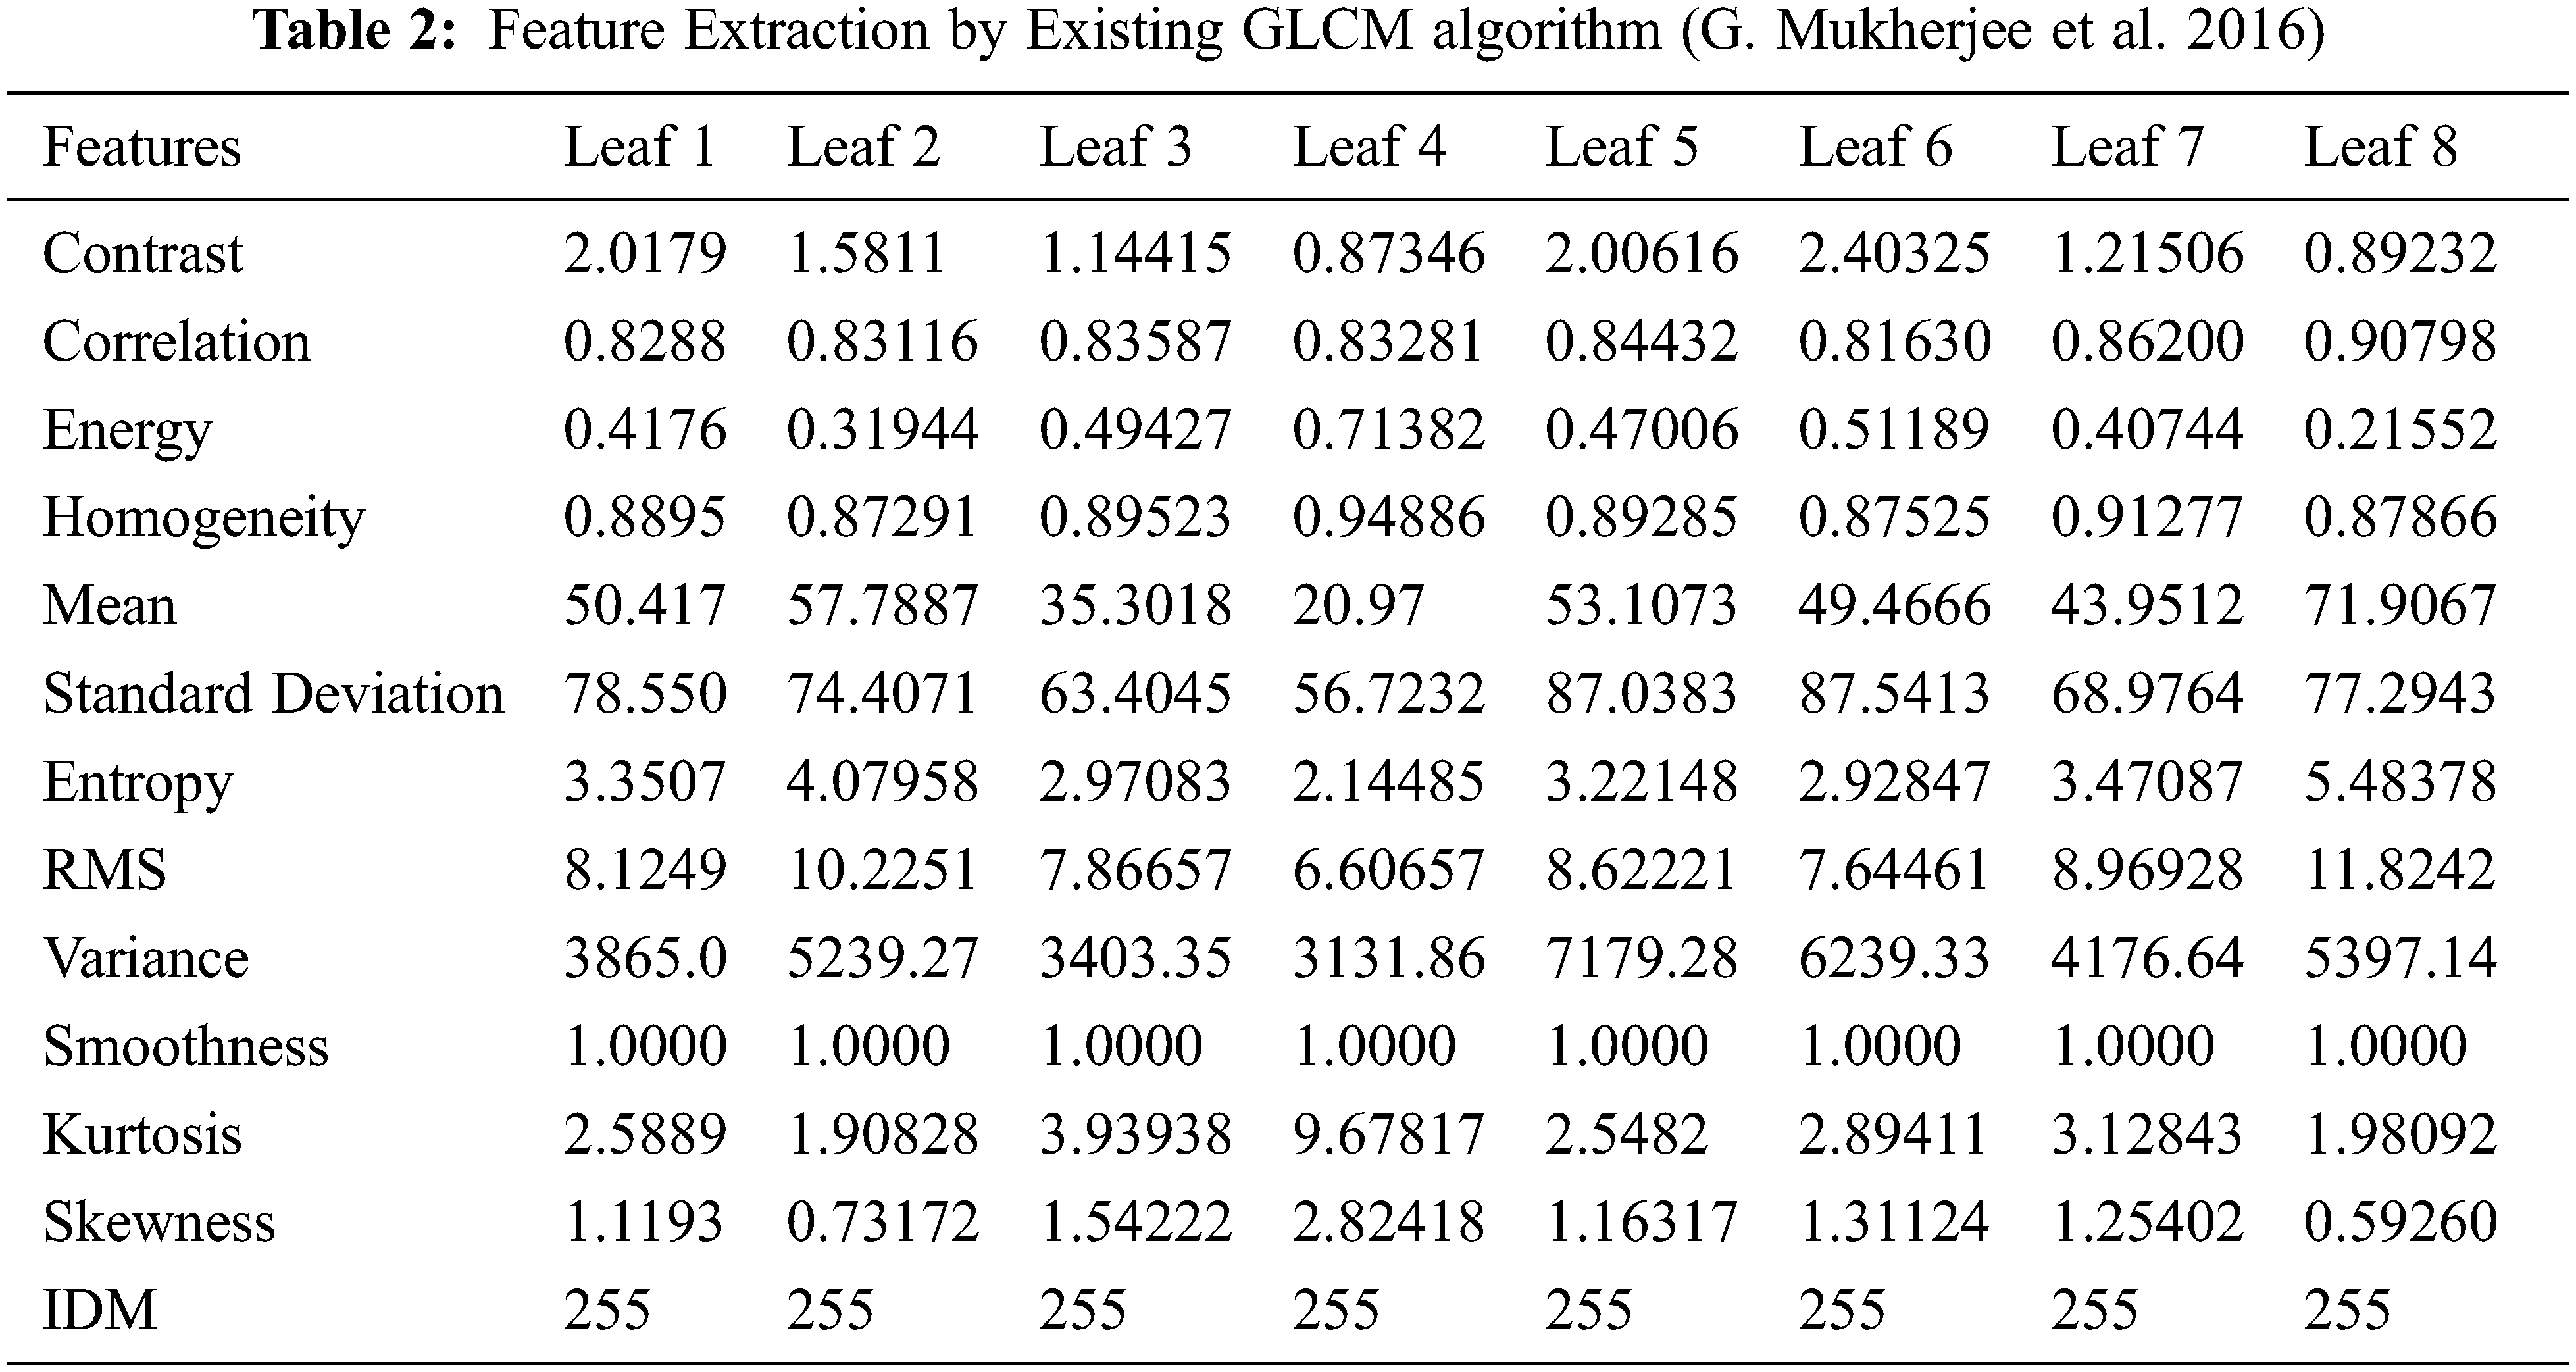
2.3.1 Gray-Level Co-Occurrence Matrix (GLCM) Based Feature Extraction
GLCM matrix is used for the computation of the second order statistical features (Kiaee et al. 2019) [36]. It is the illustration of statistical joint probability of two pixels (i, j) placed at a distance of ‘d’ in a given direction ‘Ĭ’ viz. the probability that i and j have similar intensity. P is the square array in which the image under examination has the number of rows and columns equals to the number of distinct gray levels of the image (Mukherjee et al. 2016) [37]. For a given displacement vector the GLCM matrix consists of eight number of rows and eight number of columns. Calculation of GLCM matrix is time consuming and difficult since the computation for different angles and for different distances are laborious.
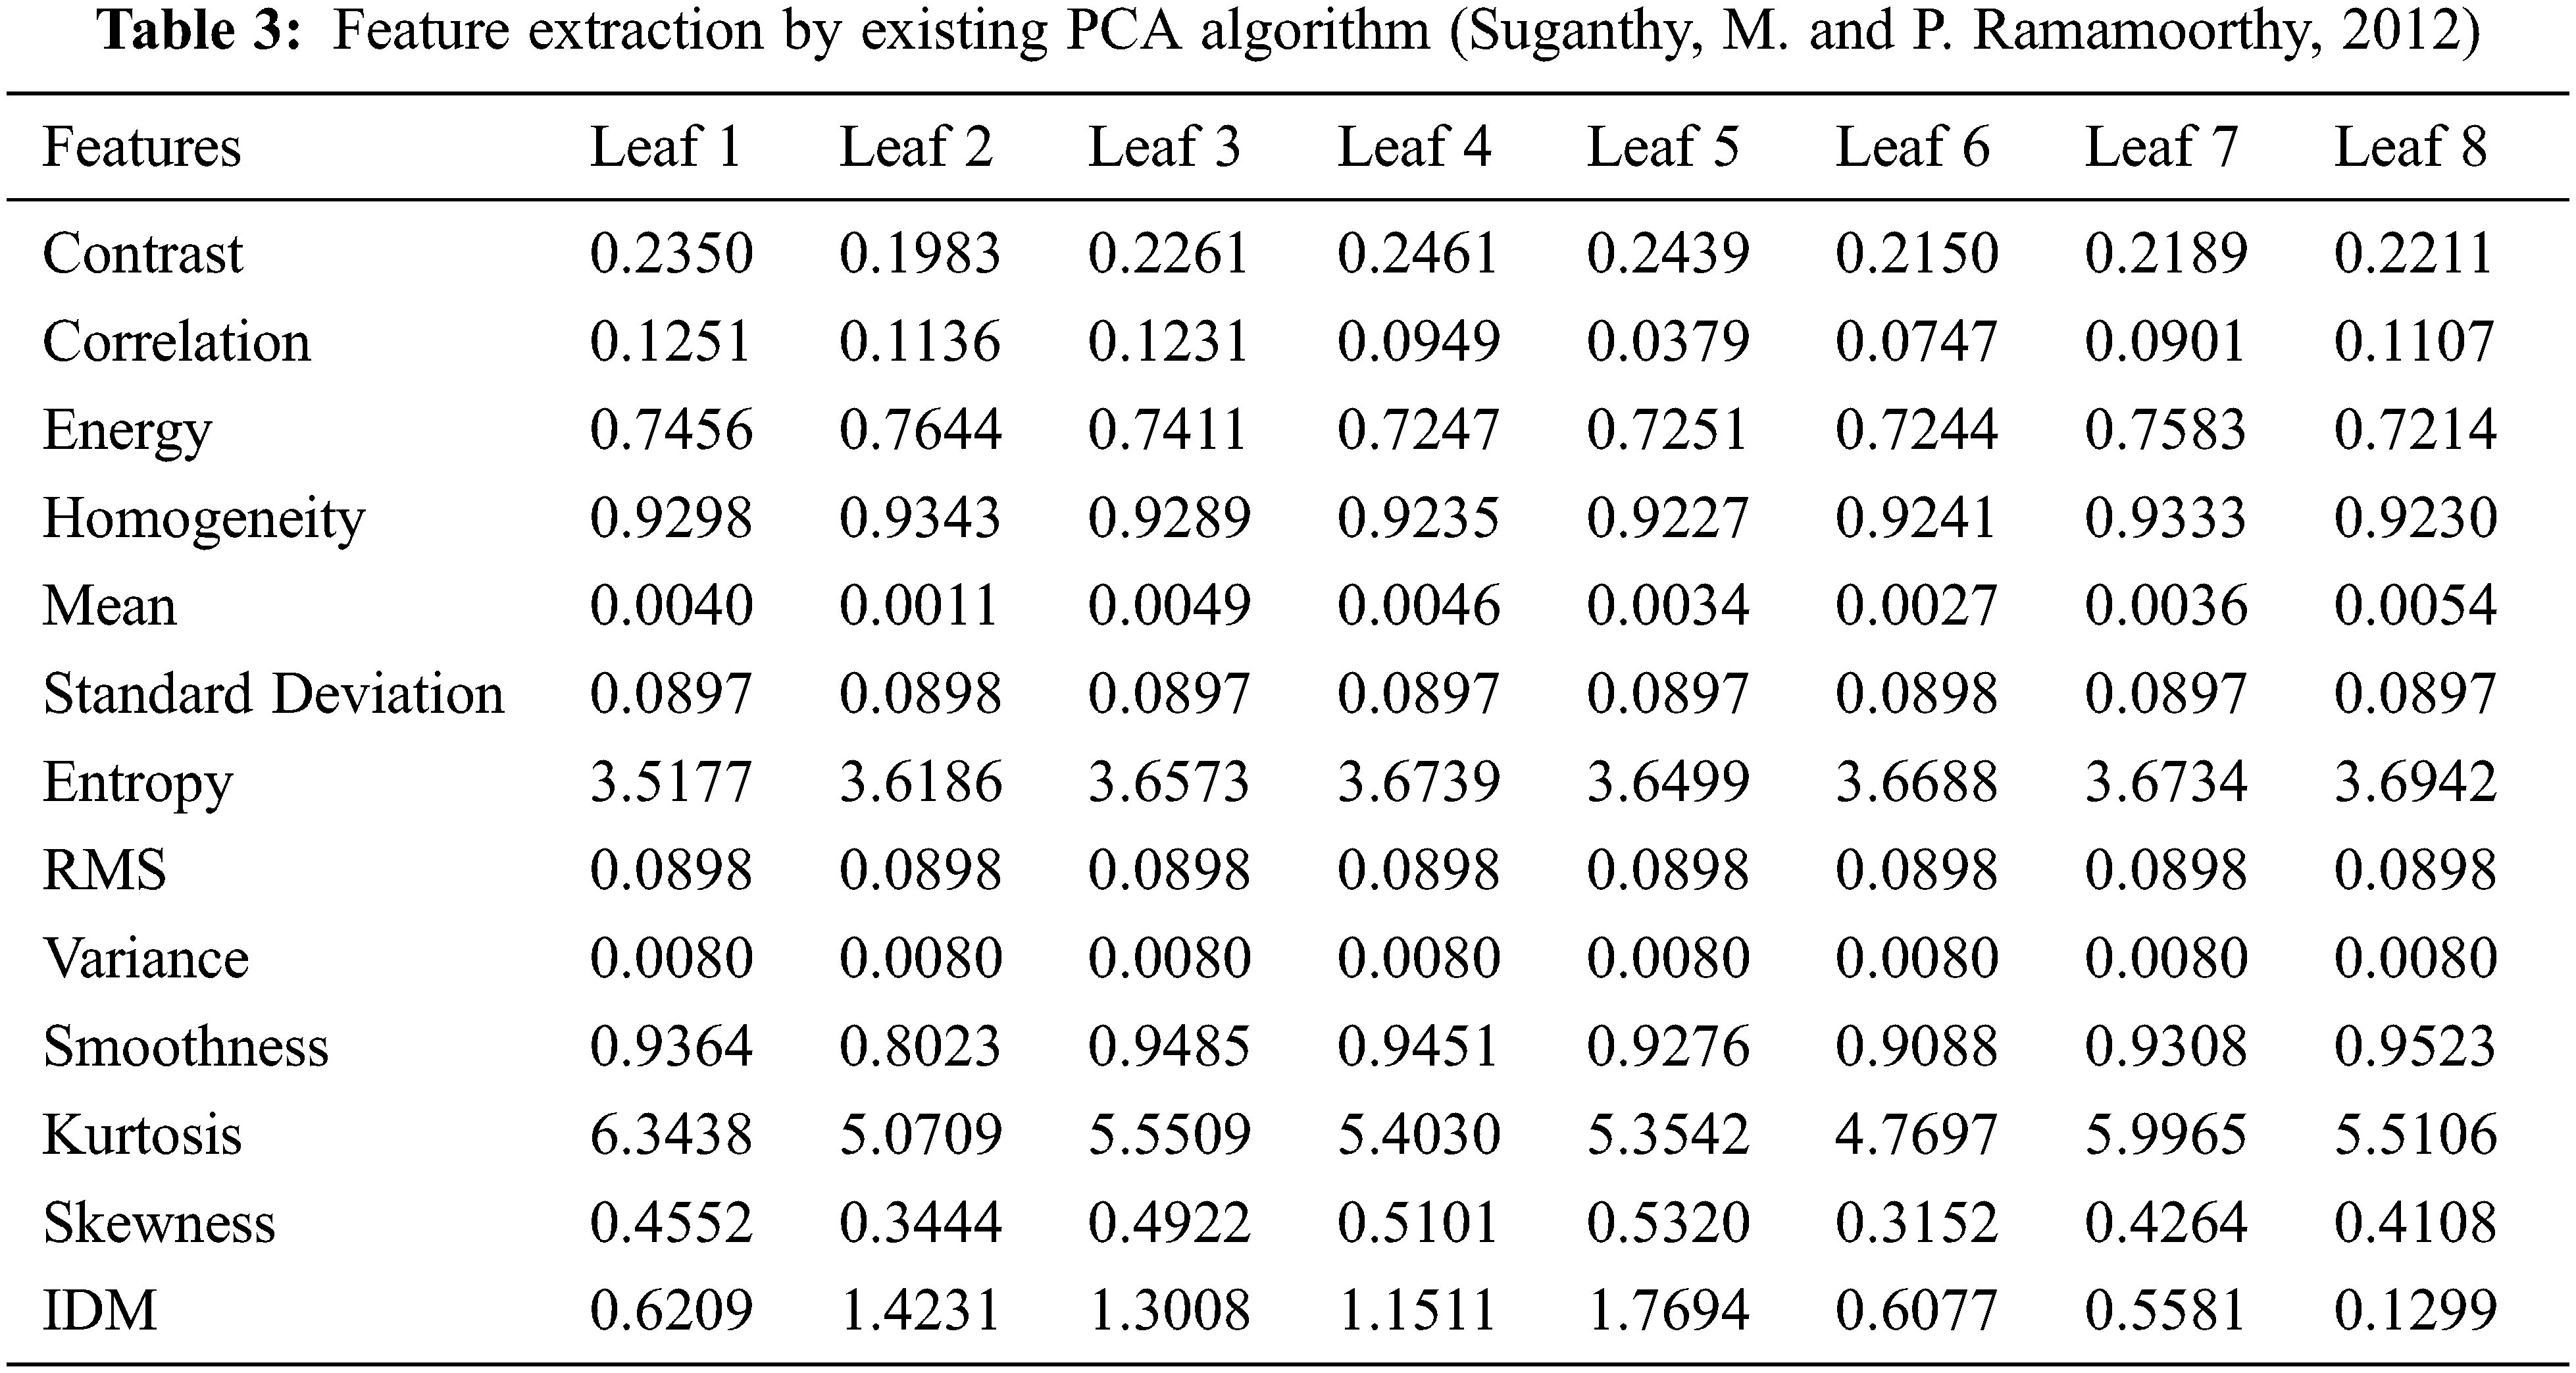
2.3.2 PCA Based Feature Extraction
Principal Component Analysis (PCA) is a process that makes use of linear transformation for mapping the data from higher dimensional space to a lower dimensional space. By use of Eigen vectors of the covariance matrix the lower dimensional space can be calculated (Suganthy and Ramamoorthy, 2012)] [38].
The step-by-step procedure associated with PCA is as follows
• From the given dataset S, the mean value S’ is estimated
• The mean value is subtracted from S, this forms a new matrix “A”
• Covariance of the matrix is calculated from the matrix as C = AAT, from the covariance matrix the eigen values are obtained as V1V2V3V4…VN.
• Now eigen vectors are determined for the covariance matrix C
• Any vector S or S S − can be given as linear combination of eigen vectors as described in Eq. (2)
• Since the covariance matrix is symmetric it form basis V1V2V3V4…
• Only eigen values that are larger are used to form lower dimension data set in Eq. (3)
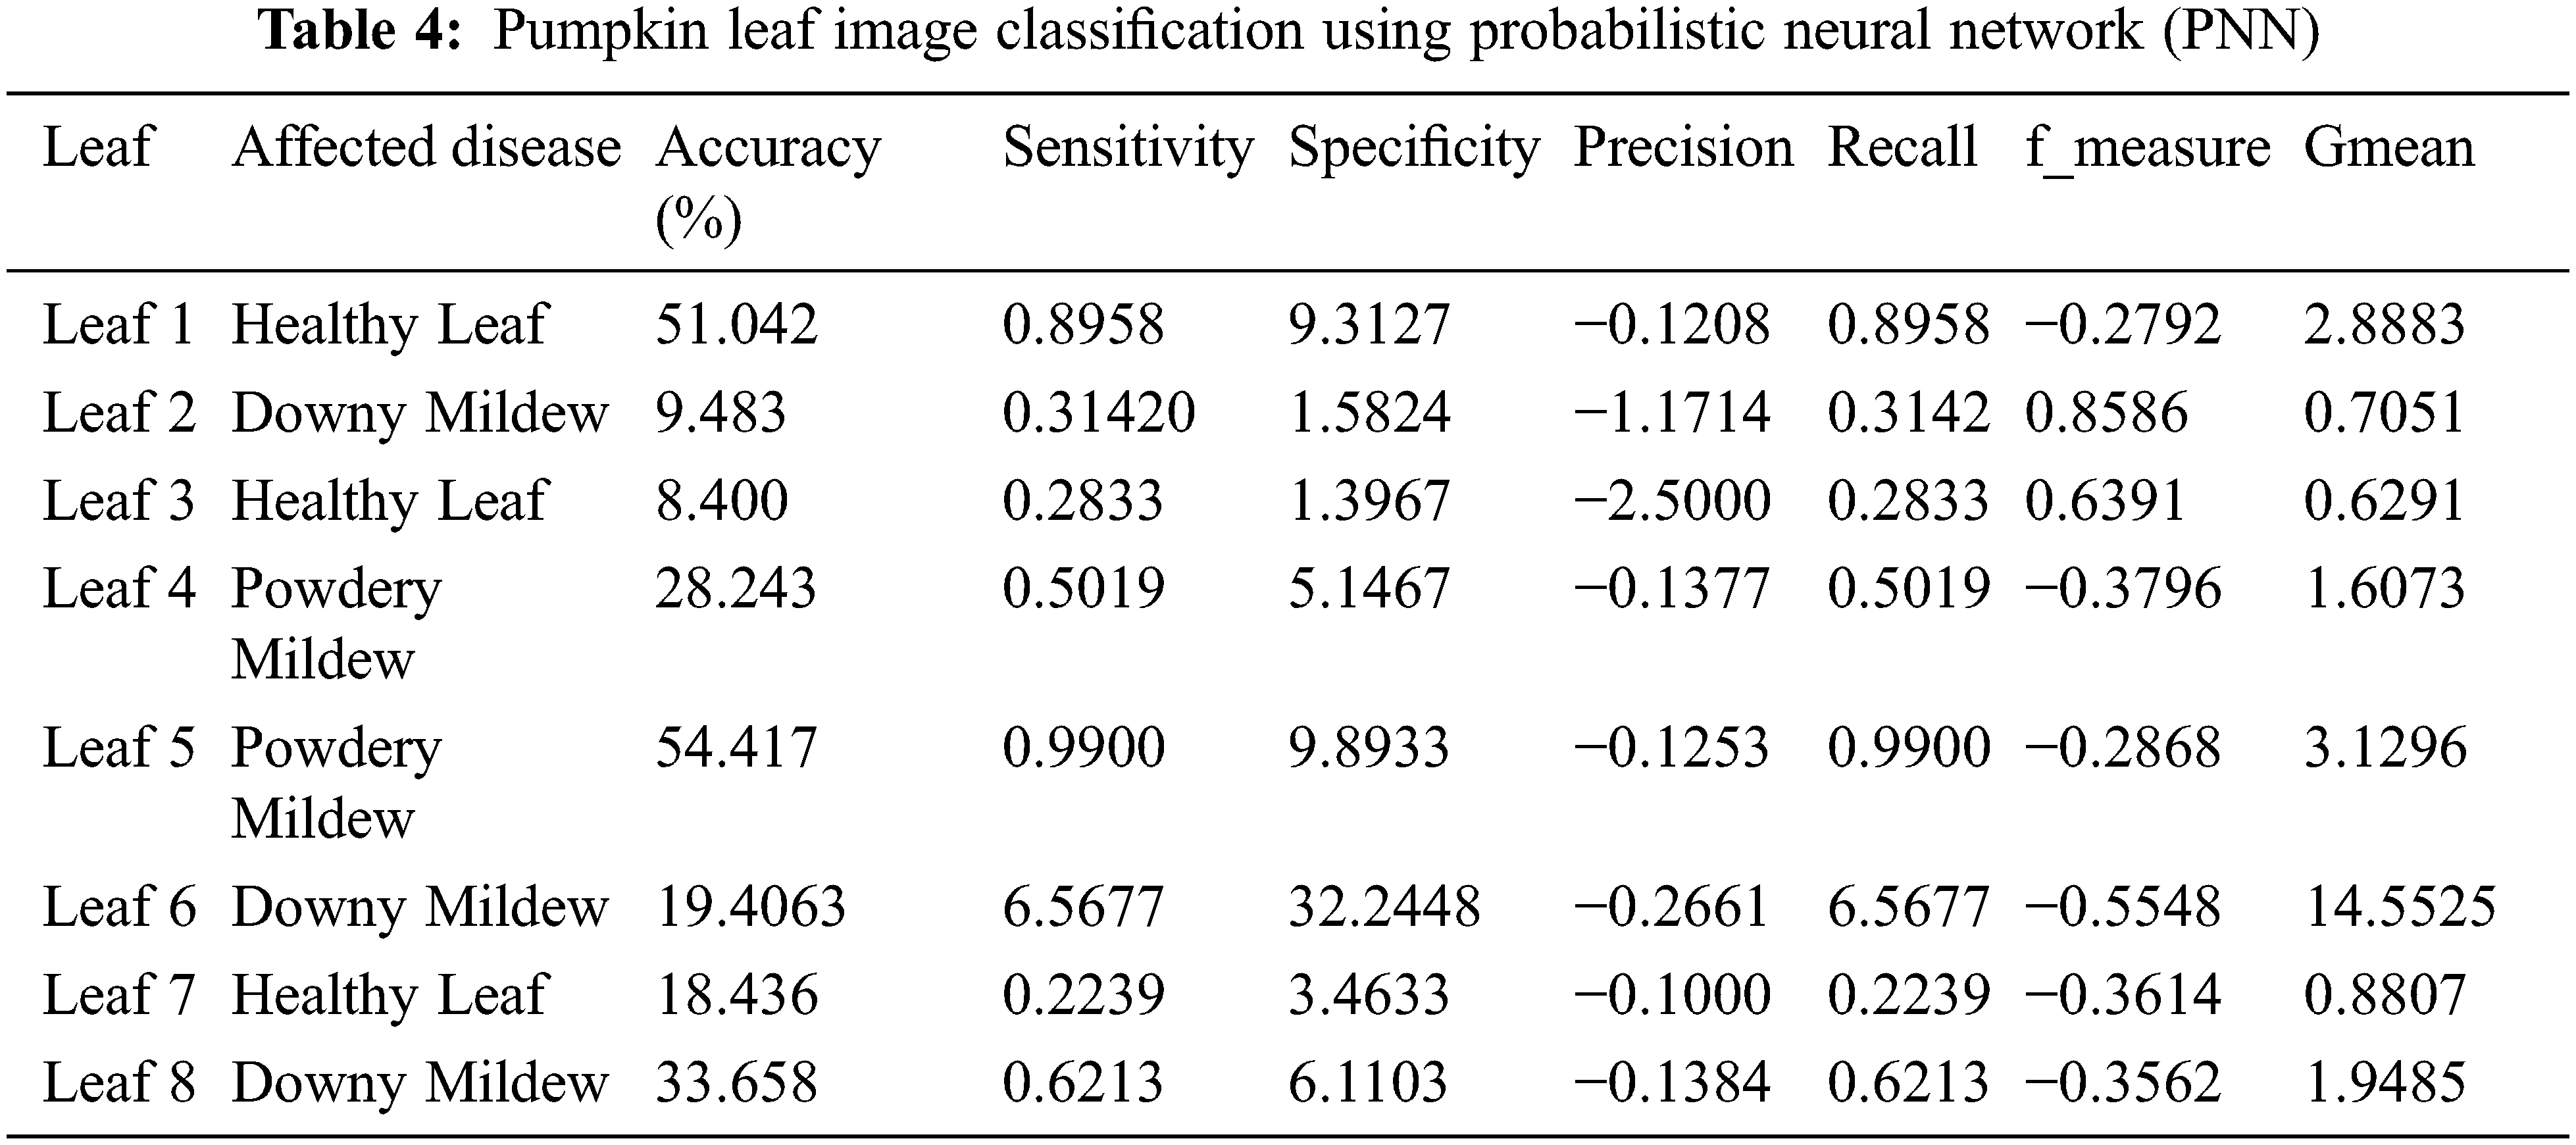
2.4 Feature Extraction Algorithms
The Feed-Forward Neural Network (FNN) is very apt for value prediction, but this study focuses on directional prediction that paved a way for classification with the use of probabilistic neural network (PNN). Probabilistic Neural Network (PNN) is very effective than usual FNN due to the above reasons. If FNN is employed for classification in this study, deciding the threshold or making necessary adjustments is difficult, these requirements are not necessary for probabilistic neural network (PNN). The Probabilistic neural network (PNN) gives global optimal solutions, that results in a very precise output results. Probabilistic Neural Network (PNN) was introduced in the year 1966 by D.F. Specht mainly for classification problems. Probabilistic neural network (PNN) is a feed-forward neural network and it consists of four layers namely input layer, pattern layer, summation layer and output layer,(Chandrasekara et al. 2019) [39]. Probabilistic neural network works on the basis of Bayesian method of classification, and it can classify the image sample with highest probability of success. The Basic principle behind the Bayesian classifier lies in choosing the class C that contains largest product term in the Bayesian classification theorem as described in Eq. (4).
Here, Pc denotes the priori probability for class C, Lc denotes the loss caused due to the misclassification of a sample that truly belongs to class C, let X = (x1, x2, , xk), be the input vector needed to be classified and fc(x) (Eq. (5)) represents the probability of X given the density function of class C. Usually, the distribution of the vector X considered to be Gaussian
Here, k denotes the number of elements in X, nc represents the number of training samples that belong to class C, Yic corresponds to the ith training sample in class C, and σc gives the smoothing parameter.
3 Description of Proposed Approach for Pumpkin Leaf Disease Detection
The Proposed method for pumpkin leaf disease detection is demonstrated in Fig. 1. The Proposed architecture consists of three steps that include preprocessing stage done based on evolutionary algorithm, feature extraction done on the basis of computer vision technology and for classification of pumpkin leaf disease, convolution neural network is followed. The Above sections are clearly explained in this section.
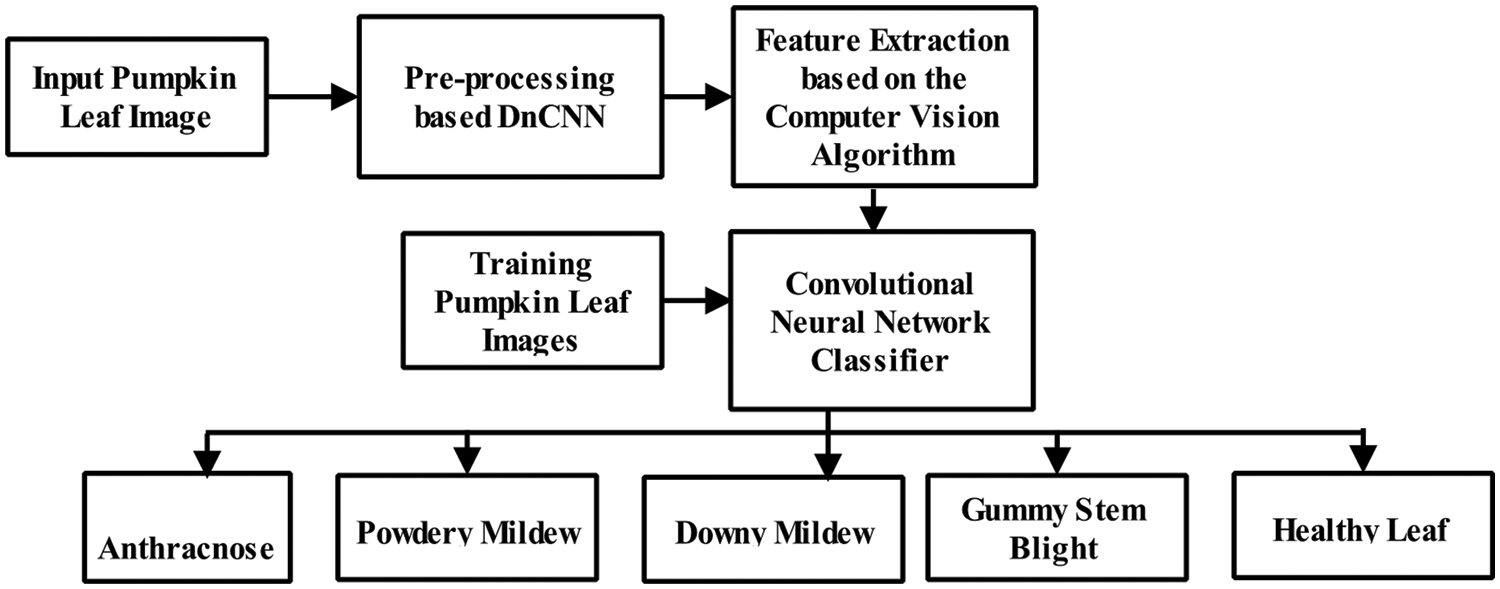
Figure 1: Proposed architecture for pumpkin leaf disease detection
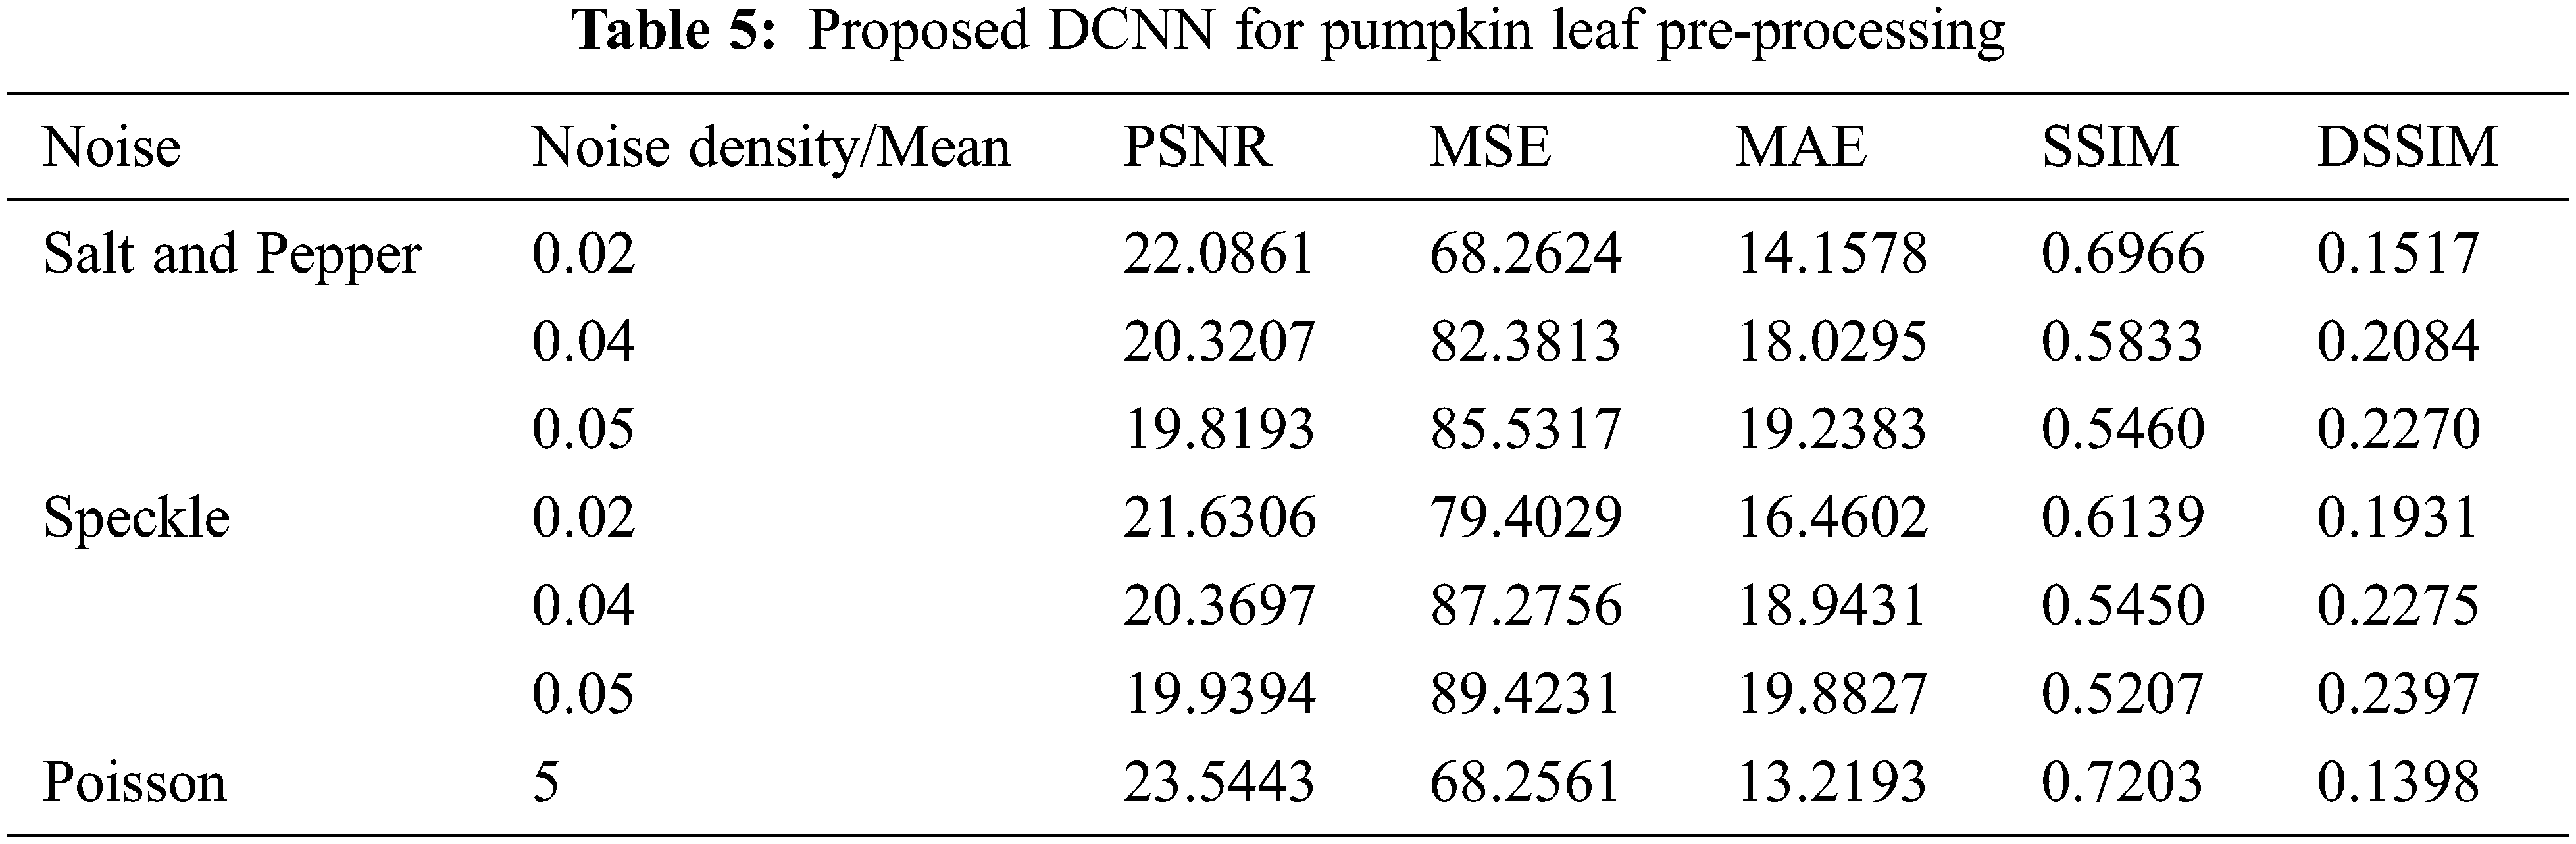
3.1 Denoising CNN for Pumpkin Leaf Preprocessing
The Architecture diagram of Denoising Convolutional Neural Network (DnCNN) is given in Fig. 2. The DnCNN input is observed to be noisy and it is gives as y = x + v. The Discriminative denoising models namely MLP and CSF targets to learn the original mapping function F(y) = x directly for the sake of predicting the latent clean image of pumpkin leaf. In DnCNN, the residual learning formulation is done for the purpose of training the residual mapping R(y) = v, and in the next step x is derived from x = y − R(y). The Convolutional filters size is set about to 3 × 3. Hence, the receptive field of DnCNN with depth of d must be (2d + 1) × (2d + 1). By increasing the depth of the network makes the context information to look larger and have larger image region and thereby increases the burden in computation. For obtaining a good trade- off with performance and efficiency, a major issue that arises in the architecture design is to give a apt depth for DnCNN. In Gaussian denoising the receptive field size of DnCNN with a particular noise level is set to 35 × 35 with the respective depth of 17. For the given DnCNN that have depth D, consists of three different types of layers (as given in Fig. 2 along with three various colors. (i) Conv + ReLU: for the first layer contains 64 filters of size 3 × 3 × c helps us in the generation of 64 feature maps, and rectified linear units (ReLU, max(0, •)) are used to rectify the nonlinearity, where c denotes the number of image channelsm such that, c = 1 for grayscale image and c = 3 for color image. (ii) Conv + BN + ReLU: for layers 2 ∼ (D − 1) contains 64 filters of size 3 × 3 × 64 and a batch normalization is added on between the convolution and ReLU. (iii) Conv: for the layer 3 contain c filters of size 3 × 3 × 64 that are utilized for the reconstruction of the denoising result. For summing up, there are two features in DnCNN. They include the residual learning formulation for learning R(y), and the batch normalization used for speeding up the training and also for boosting the denoising performance. Generally the residual learning and batch normalization turns out to be more beneficial to each other, upon integrating them they become very effective in speeding up the training and boosting the denoising performance.
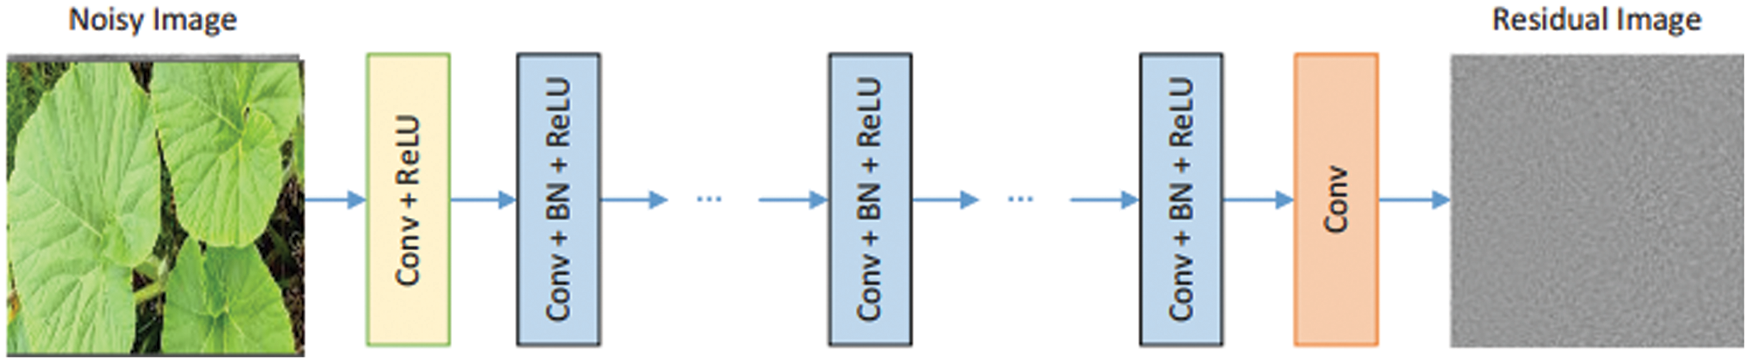
Figure 2: Proposed DCNN architecture for pumpkin leaf image pre-processing
3.2 Computer Vision Based Pumpkin Leaf Feature Extraction
The Building blocks of computer vision algorithms are the local features and its descriptors. The Use of local features in these algorithms is done for efficient handling of scale changes, rotation, and occlusion. The Computer Vision Toolbox algorithms contain features from accelerated segment test (FAST), Harris, and Shi & Tomasi corner detectors, and the SURF and MSER blob detectors.
3.2.1 BRISK (Binary Robust Invariant Scalable Keypoints) Algorithm
Binary Robust Invariant Scalable Keypoints (BRISK) algorithm belongs to the binary descriptors family and it is found to be similar to Oriented FAST and rotated BRIEF(ORB) algorithm. The Feature extraction is done with the help of variant of AGAST algorithm (Adaptive and Generic Accelerated Segment Test) (Mair et al. 2010) [40] that is an extension of FAST. For the purpose of gaining scale invariance the detector goes a step beyond ORB. To achieve this, the algorithm searches for maxima in the image plane and the continuous scale space (via quadratic fitting). Binary Robust Invariant Scalable Keypoints (BRISK) utilizes handcrafted sampling pattern that consists of concentric circles centered at the feature (Fig. 3) which is in contrast with ORB. For accounting to aliasing effect the Gaussian smoothing relating to the distance of the circle centre to the feature is done earlier to the tests. Sampling pairs are divided into short and long pairs depending on the distance between them, such that, if the distance is lower than the certain threshold dmax, or if the distance is greater than the certain threshold dmin. The Long pairs are used for the calculation of the local gradient (of the patch) which gives the feature orientation. The Short pairs are later rotated to get the sought rotation invariance and they are helpful to calculate the binary descriptor by means of intensity tests.
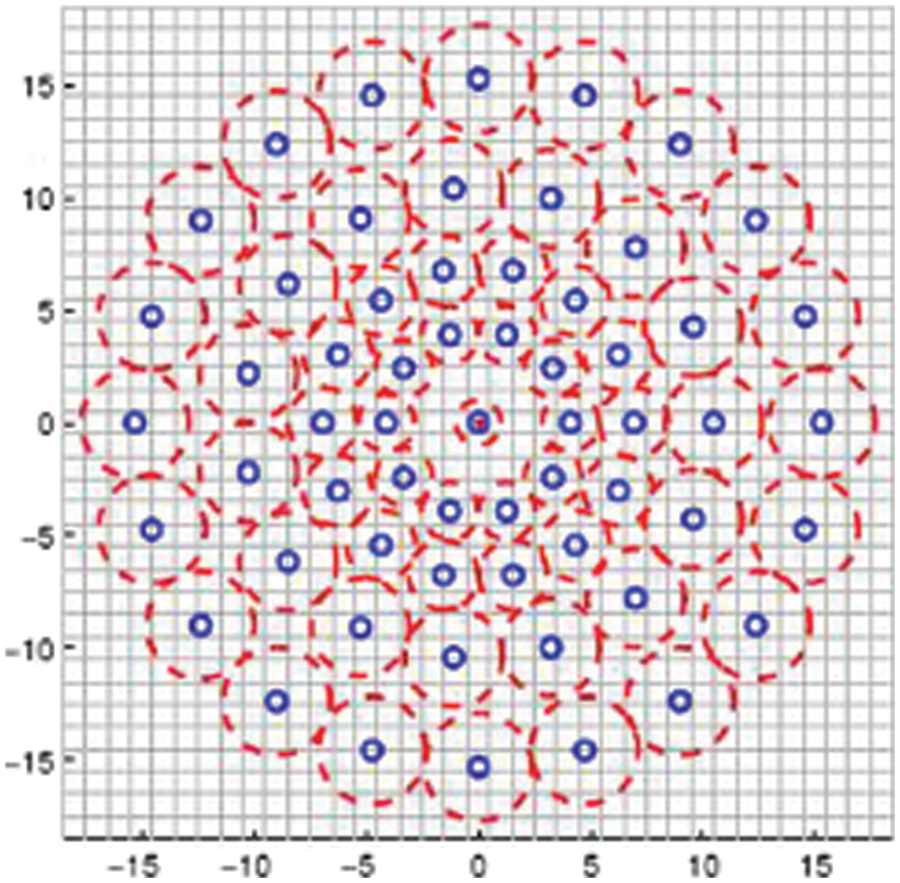
Figure 3: Sampling patterns of the binary descriptors using BRISK pattern
3.2.2 FAST (Features from Accelerated Segment Test) Algorithm
For Pumpkin leaf image pixel plays vital role and each Pumpkin leaf image has Features from Accelerated Segment Test (FAST) score. The Pumpkin leaf image pixel has limit threshold which are pre-defined score to identify interest point. By using some brightness comparison tests 512 binary feature vector of length gets develops. The Image pairs and Interest points were accord up by computing the Hamming distance between the feature descriptors. The Features from Accelerated Segment Test (FAST) Algorithm outperformed Speeded Up Robust Features (SURF) in order of magnitude.
The Texture parameter is important factor at image pixel. Because when pumpkin leaf images are obtained under a complex imaging conditions it results with lesser texture data mostly corner data gets overflows. To avoid this Harris operator used to have superior stability and anti-noise performance. The Harris operator has to compute only on first order gradient of the image. The Harris feature extraction algorithm has no scale invariance by that feature it has been used to extract gradient magnitude space image features. The Multiscale Harris detection matrix is expressed in Eq. (6)
where X denotes the pixel position, σn denotes the scale of X, denotes a two-dimensional Gaussian function with a standard deviation of, and Lxn and Lyn , respectively. The response value for each Harris corner is calculated using the function of Eq. (7).
where det(.) denotes the determinant of the square matrix, tr(.) denotes the trace of the square matrix, and D exists only in the shape of the regulating function.
3.2.4 MSER (Maximally Stable Extremal Region Detector) Algorithm
In order to express a pumpkin leaf image regions within its frame according to the intensity Maximally Stable Extremal Region detector (MSERs) algorithm used because it has improved based on the color gradient which obtained from color threshold. So that colored objects identify and tracked by using color gradient threshold feature. The Maximally Stable Regions (MSR) decides higher stability range by setting threshold parameter for different intensity images, I, to binary images are expressed in Eq. (8).
In sample words, Maximally Stable Extremal Region detector (MSERs) technique does the following Eq. (9). Intensity function will be used to compute the stability ψ of the region.
3.2.5 SURF (Speeded Up Robust Features) Algorithm
The Extracting of feature points are made for obtaining scale invariance from parameters of feature points, also reference ideas are obtained by using the Scale Invariant Feature Transform (SIFT) algorithm by combining Harris and LoG. At particular point x = (x, y) on I, the expression of scale σ Hessian matrix H(x, σ) is expressed in Eq. (10).
Among them, Lxx(x, σ) is a convolution of Gaussian second-order differential ∂2 g(σ)/∂x2 point X = (x, y). g(σ) = (1/2πσ2)exp( − (x2 + y2)/2σ2). Lxy(x, σ) and Lyy(x, σ) have similar meanings. The Matrix H(x, σ) has determinant extreme points that denote the feature points of the desired image to improve the calculation speed of Gaussian convolutions, The Determinant of the matrix is expressed in Eq. (11).
where, w is the weight, its function is to balance the deviation caused by the approximation.
3.3 CNN Based Pumpkin Leaf Image Disease Classify
The Automatic Pumpkin leaf image classification systems uses a popular convolutional neural networks (CNN) (Fig. 4). It consists of convolutional, nonlinear, pooling layers and fully connected layers. Consider among them first layer is Convolution layer in that image (matrix with pixel values) will get enters where input pumpkin leaf image is passed first in which input matrix beginning at the top left of image are read and passes to next layers. A Filter (or neuron, or core) is used produces convolution and this convolution continues thought entire process with input leaf image. The Filter role in reading image only in the upper left corner it multiply its values by the original pixel values and all these multiplications values are summed and at the end it is obtained with one number and process is continued as same on the further right by 1 unit and passed among filter across all positions where a smaller matrix was obtained than an input matrix. The Convolution layer output is passed as input to second layer known as nonlinear layer and occurs at every further convolutional layer. After each convolution operation nonlinear layer was added which acts an activation function to extract nonlinear property for getting a sufficient intense and if not with sufficient intense it will not able to model the response variable (as a class label). Then next layer known as pooling layer which process input in terms of its width and height of the image and it also performs a down sampling operation. The End result was obtained with reduced image volume. After completion of process on all layers it is necessary to attach with fully connected layer. The Output information from convolutional networks has to be attached to a fully connected layer till end of the network results be N dimensional vector, where N denotes the number of classes from which the model selects the desired class. The accuracy is more, and identification of the disease is efficient. The Optimization and convergence behavior is more when compared to existing method. The Method is also suitable for semantic dictionary and attention maps.
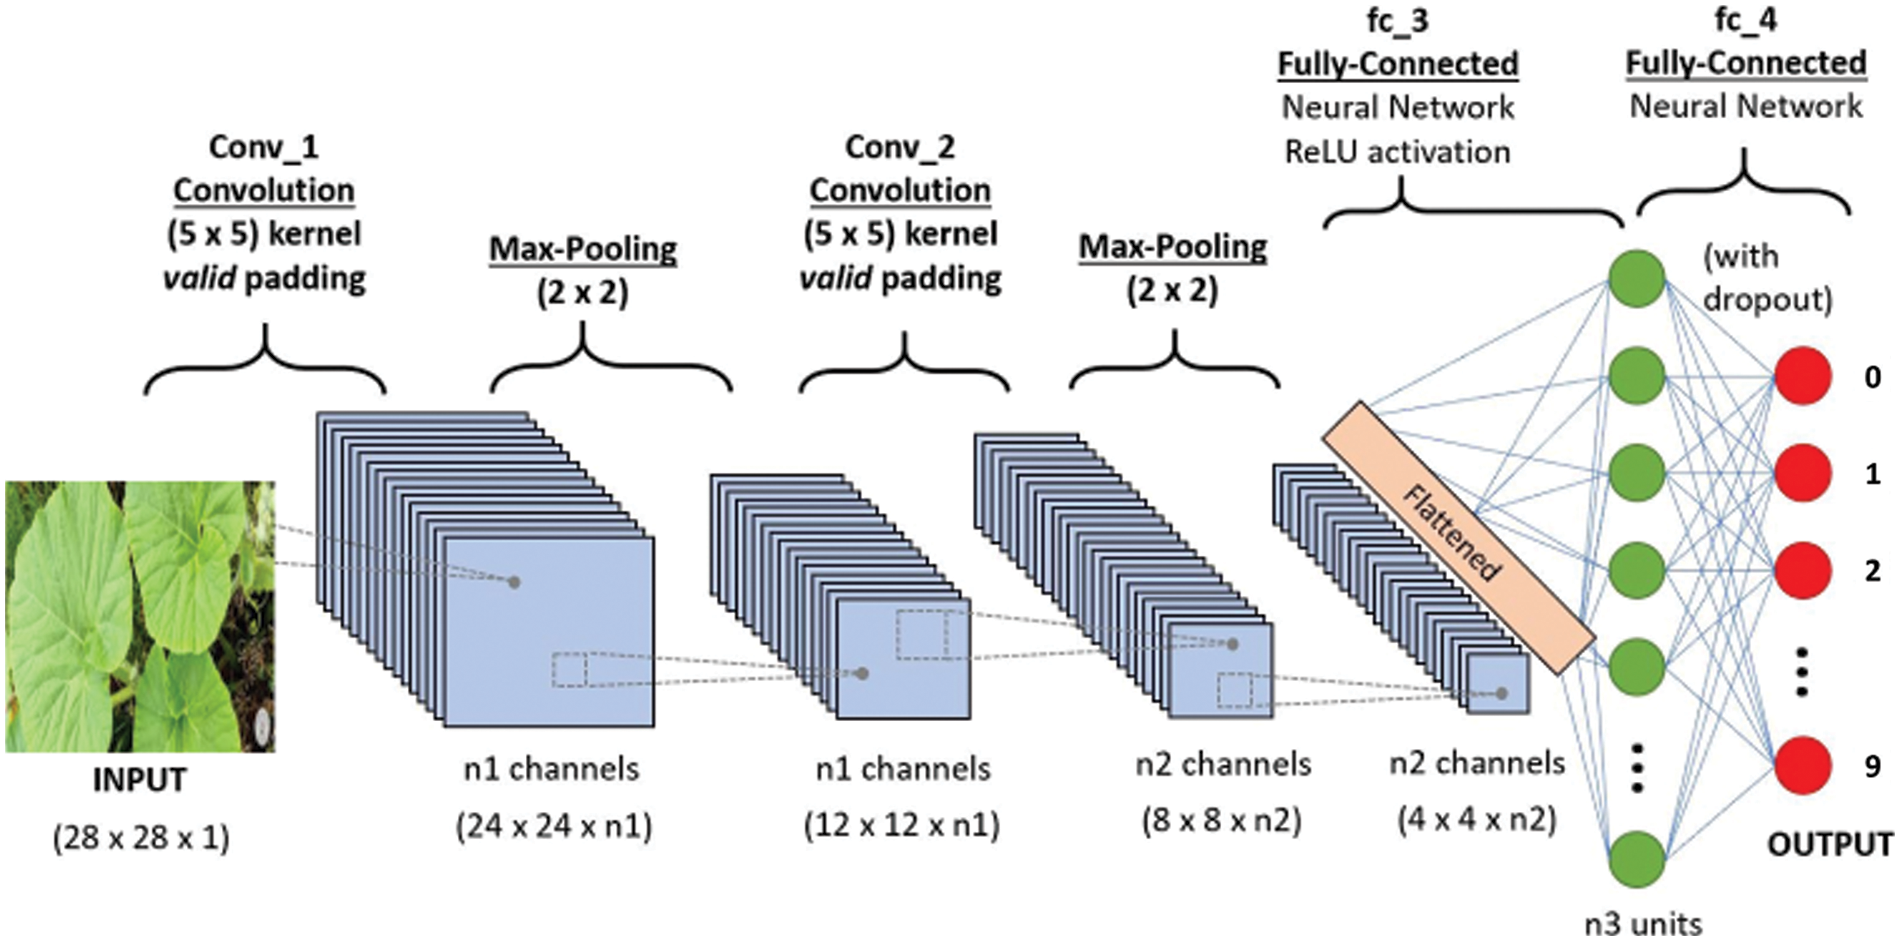
Figure 4: Proposed convolutional neural networks (CNN) classifier for pumpkin leaf disease classification
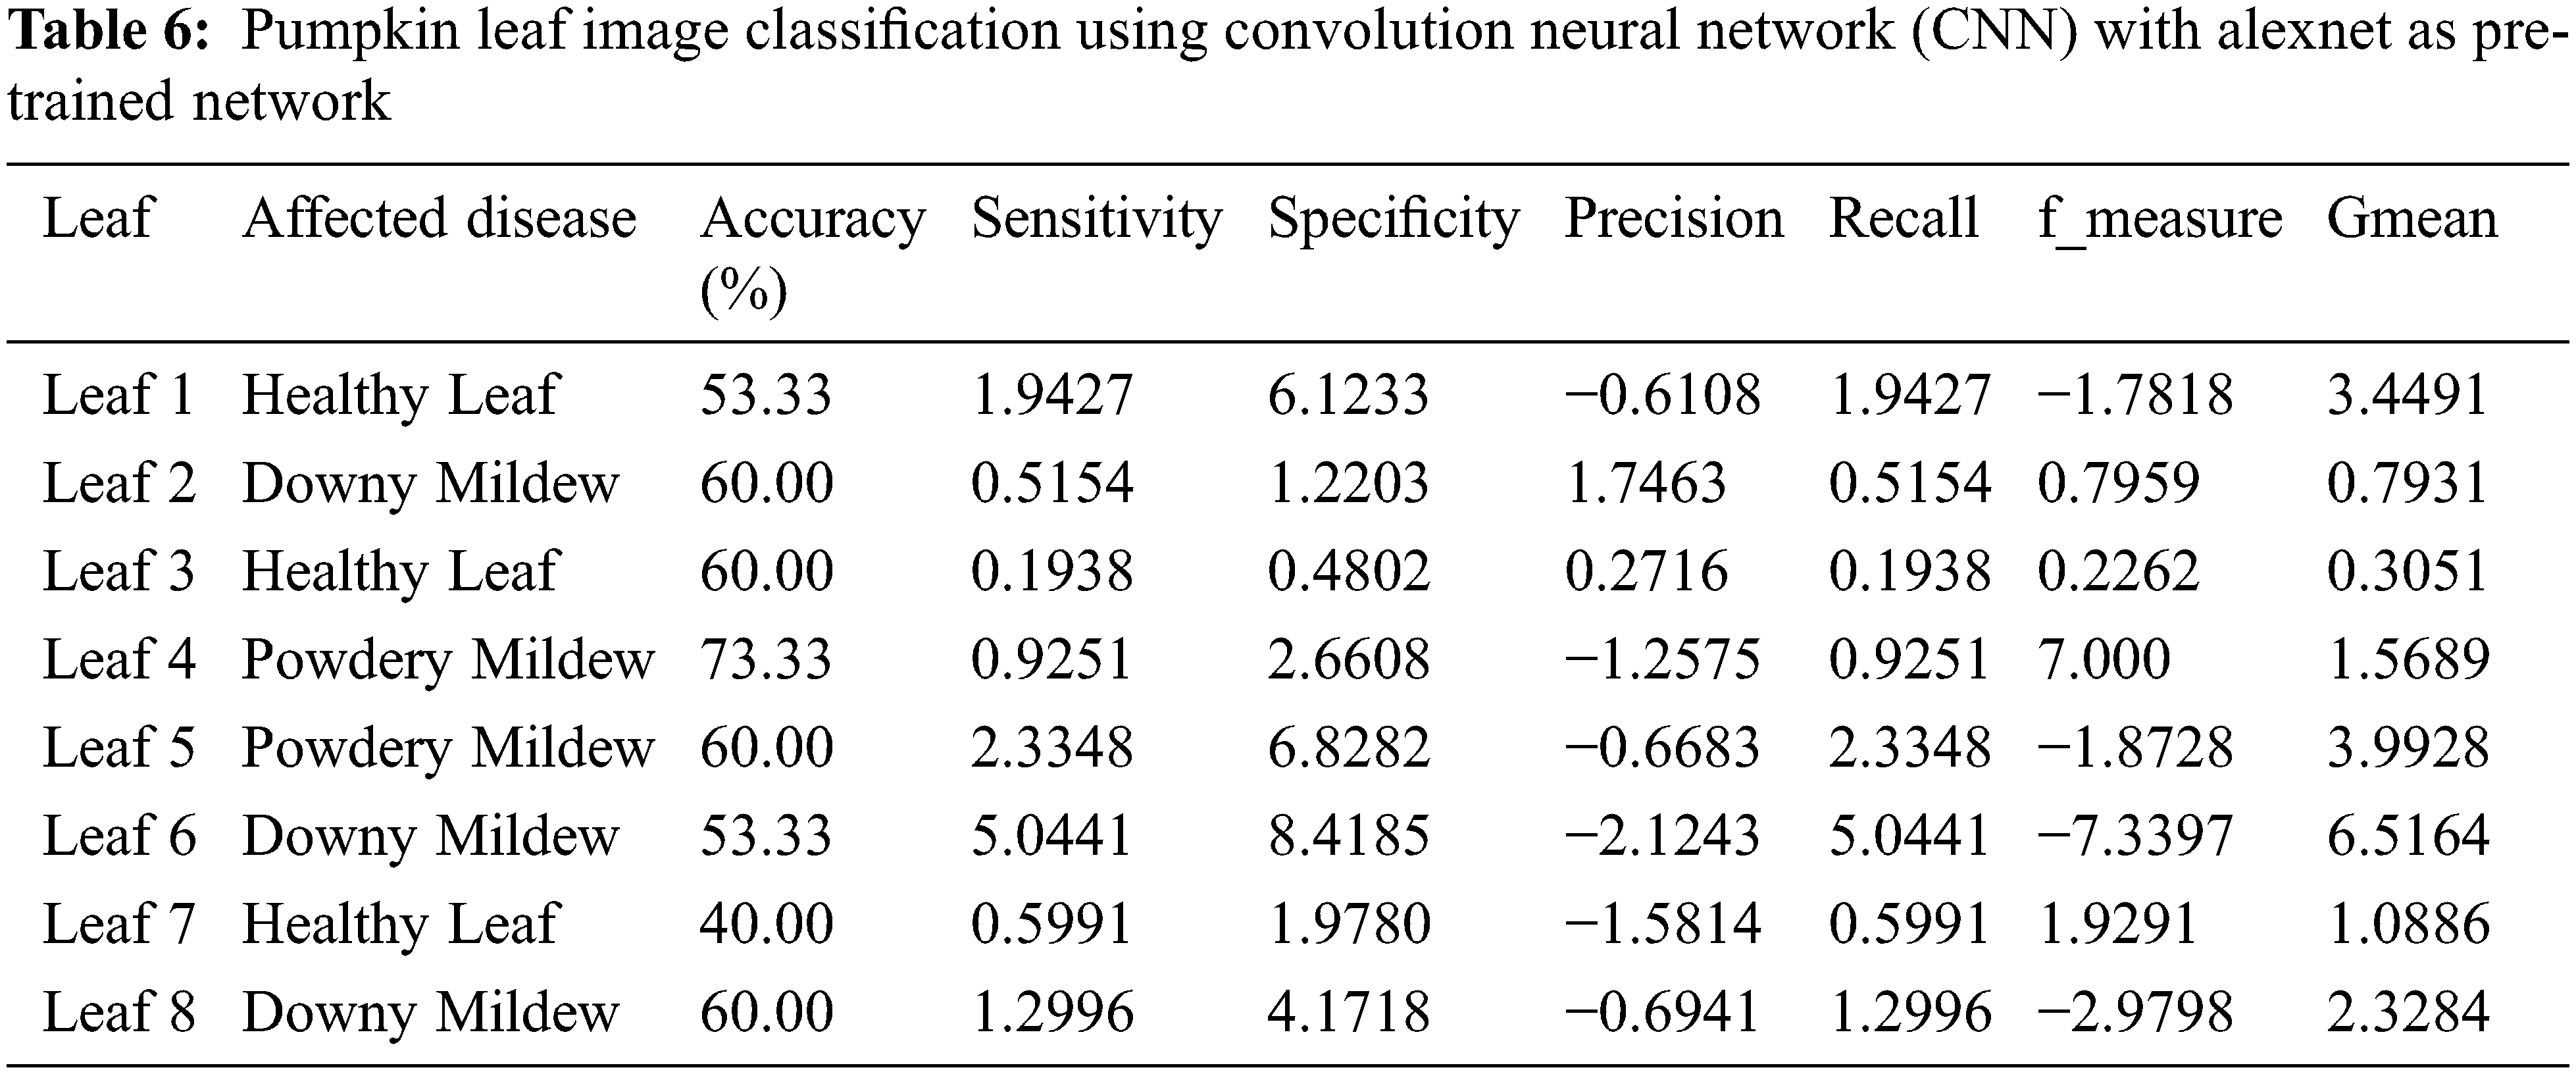
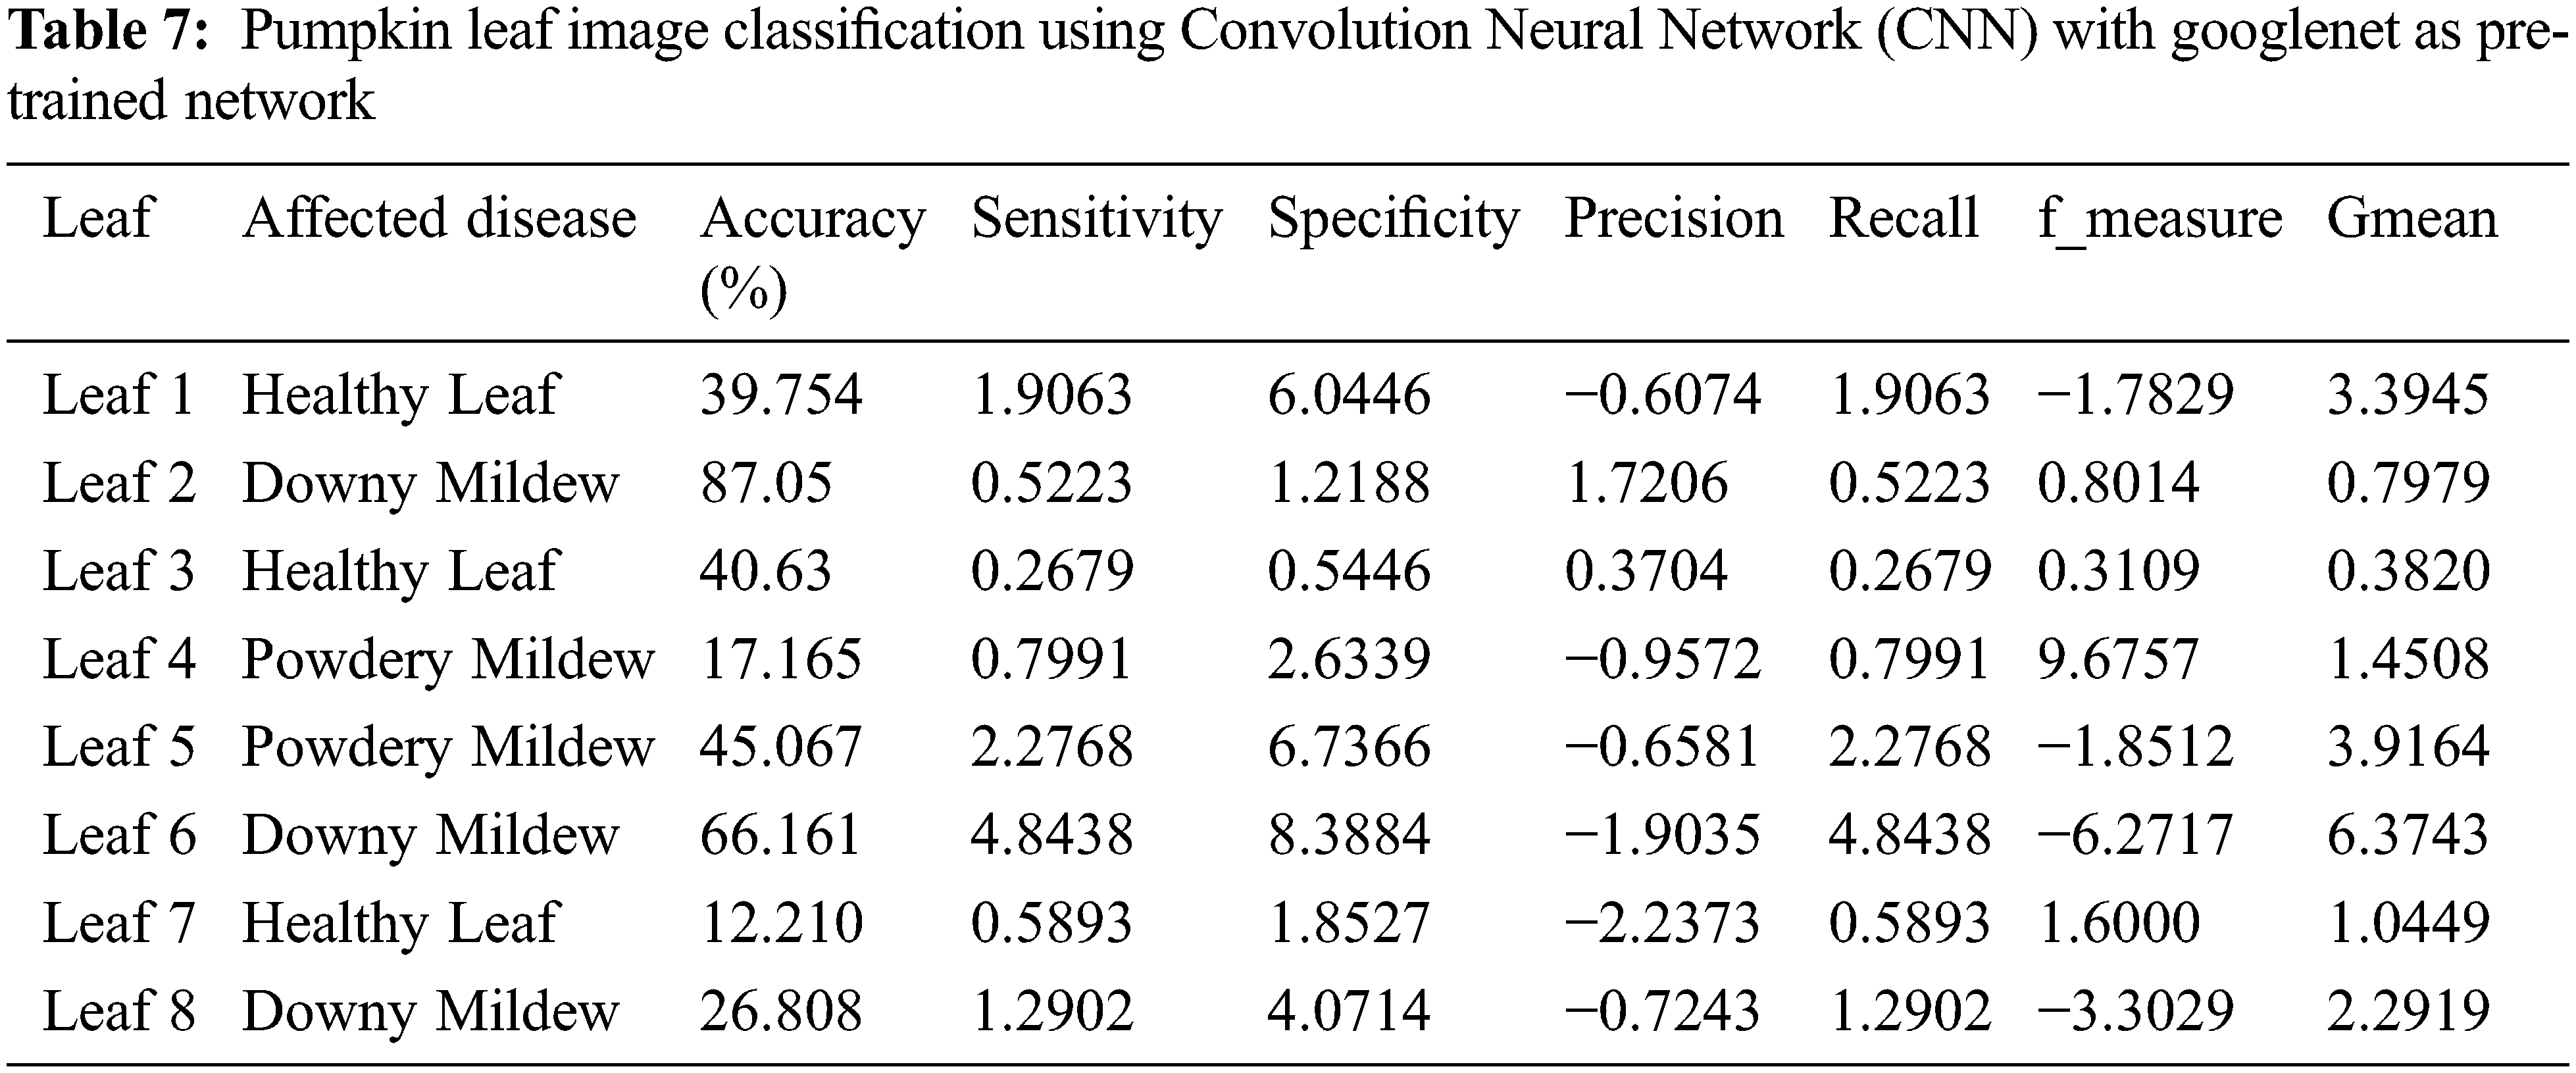
The Evaluation indexes used in this paper were top 1 accuracy, precision, recall value, and F1 score. Four conditions existed in each image, which were True Positive (TP), False Positive (FP), True Negative (TN), and False Negative (FN). The corresponding formulas are described in Eqs. (12)–(15). The Results are tabulated in the Tabs. 1–7.
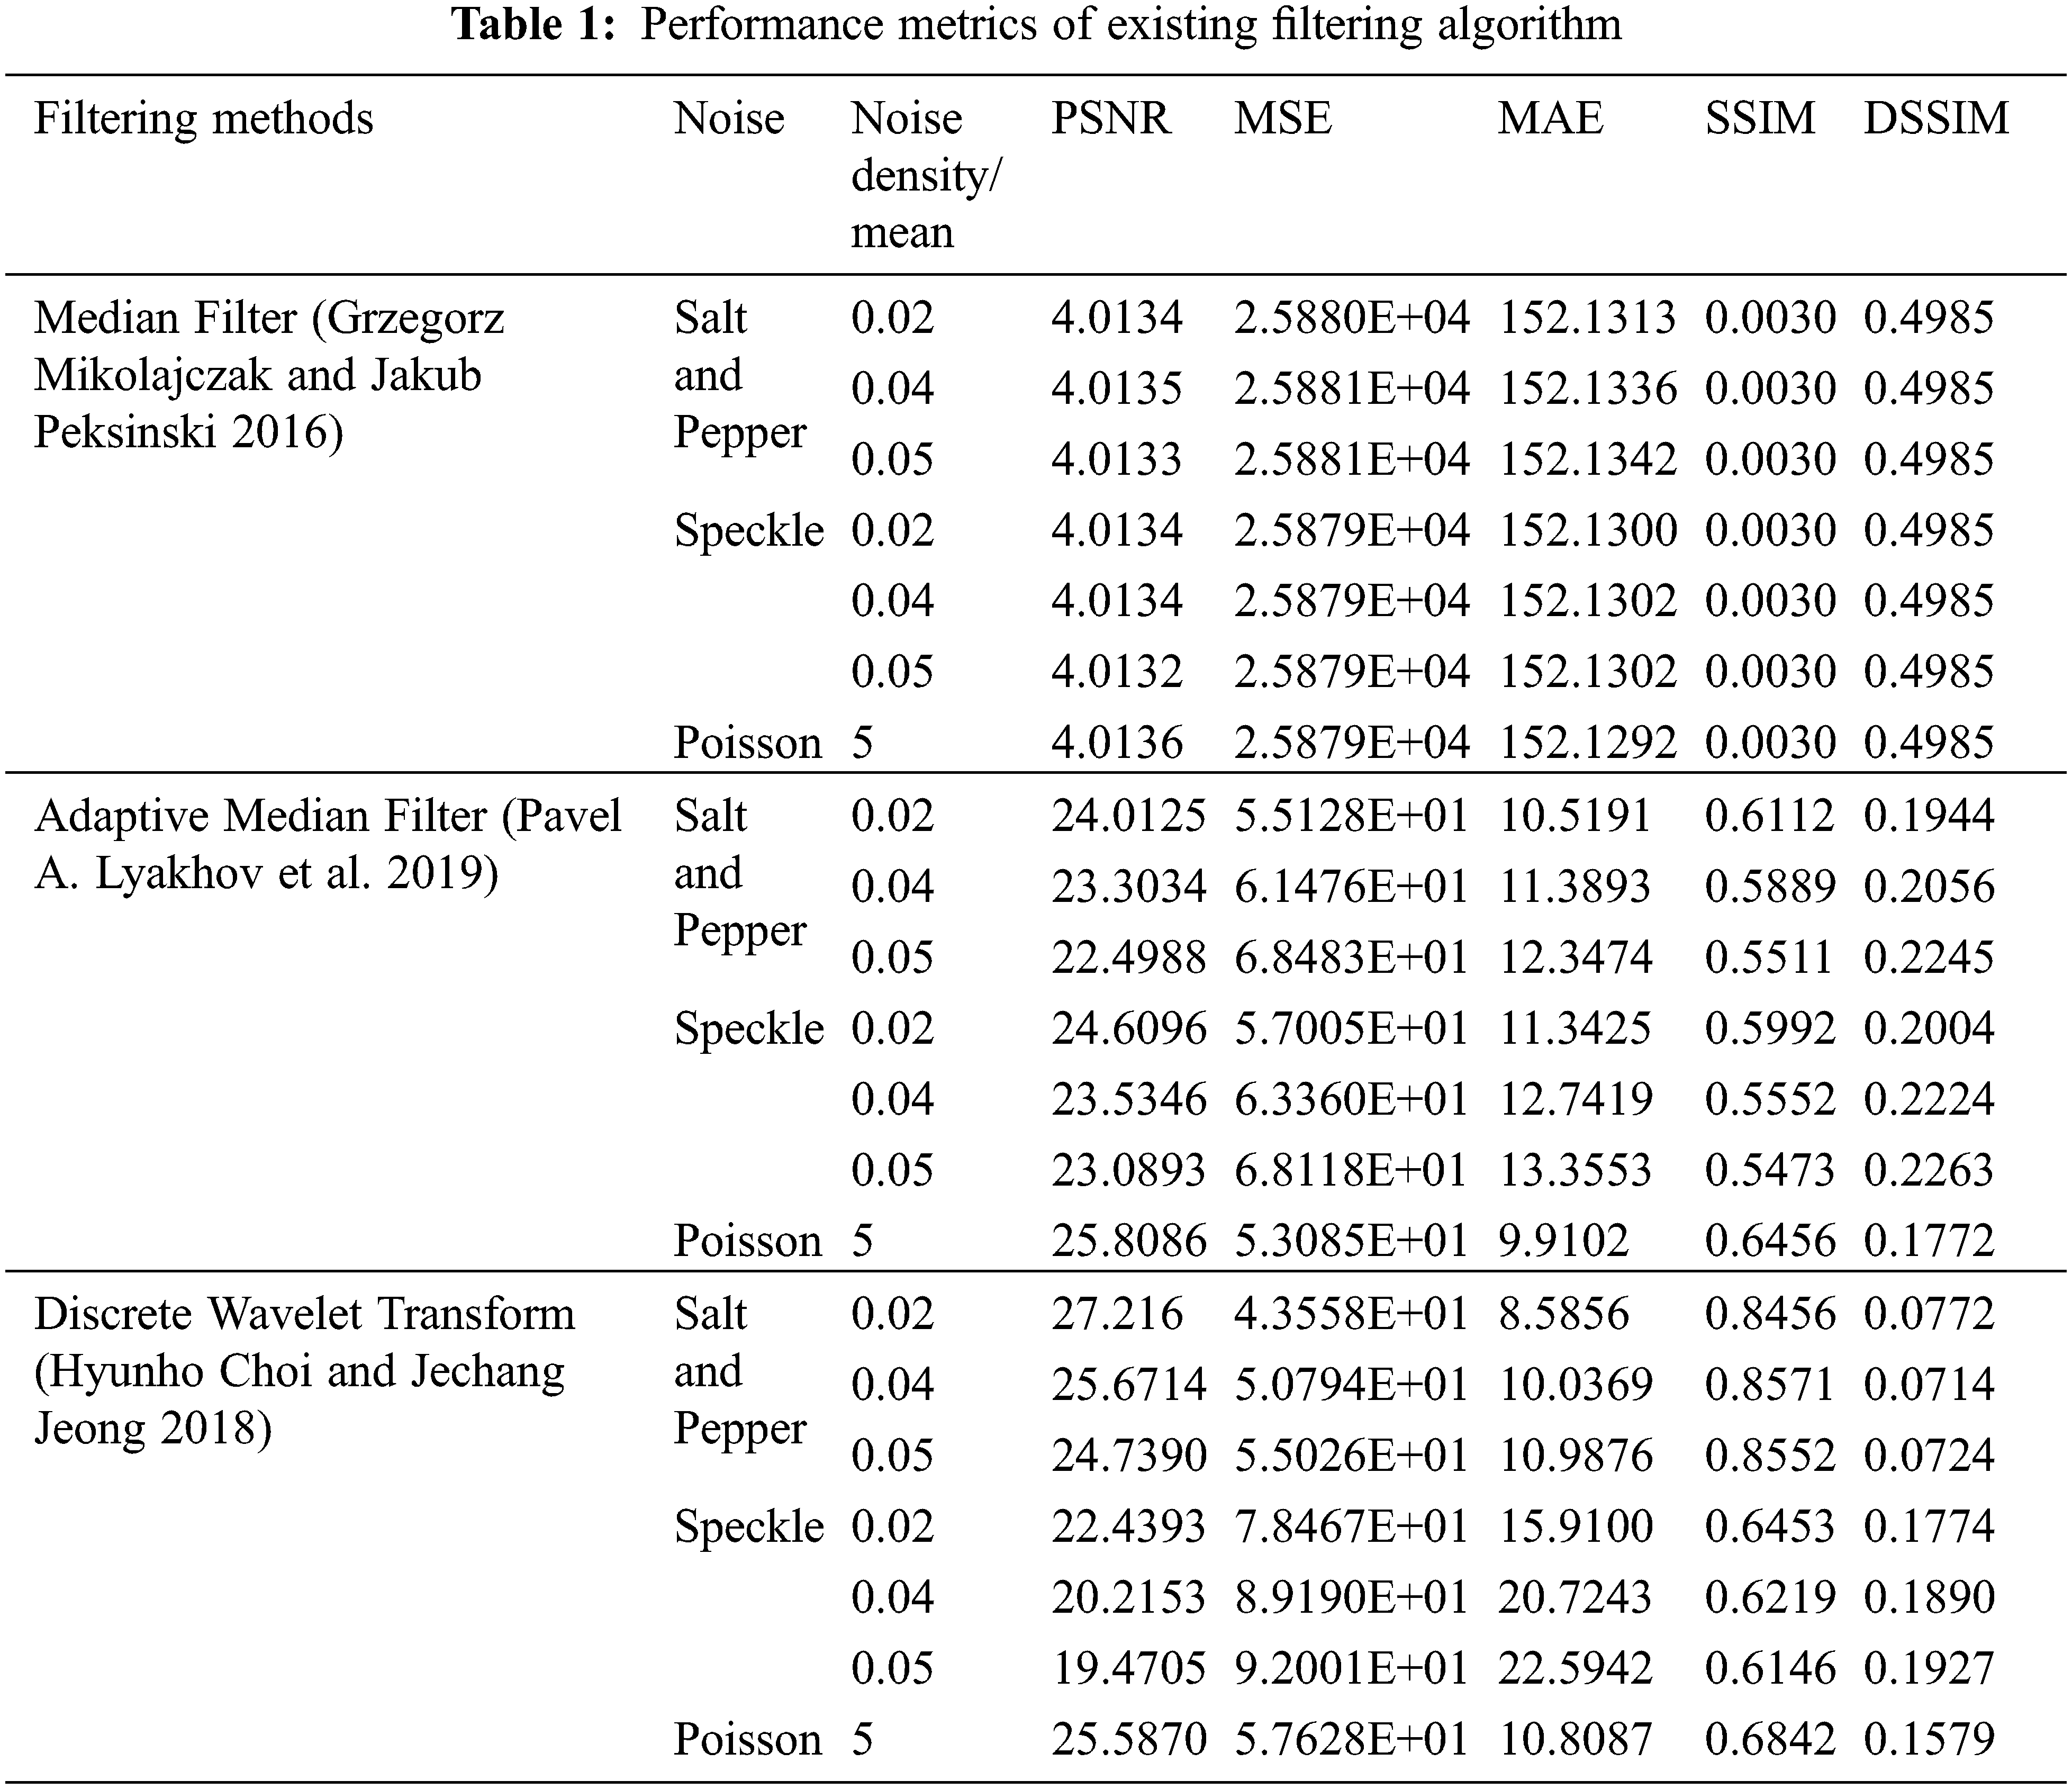
The Disadvantages of existing methods is that it produces some breakup in image edges and the adaptive filter takes additional computational times. The proposed method is autonomous and does an effective feature extraction process. The computational time is less compared to median and Discrete Wavelet Transform (DWT) methods. Even though DWT method is easy to implement, the sensitivity is more. The performance of filtering and segmentation is shown in Fig. 5 and Fig. 6. Similarly the various feature outputs are shown in Fig. 7 and Fig. 8.
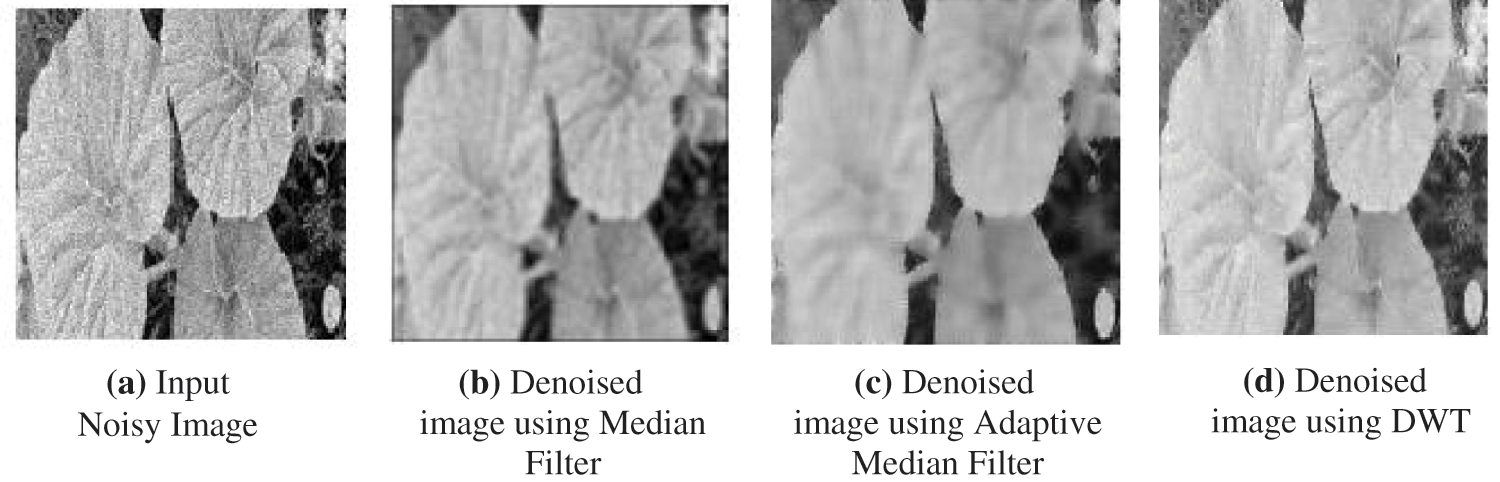
Figure 5: (a): Input noisy image (b): Denoised image using median filter (c): Denoised image using adaptive median filter (d): Denoised image using DWT
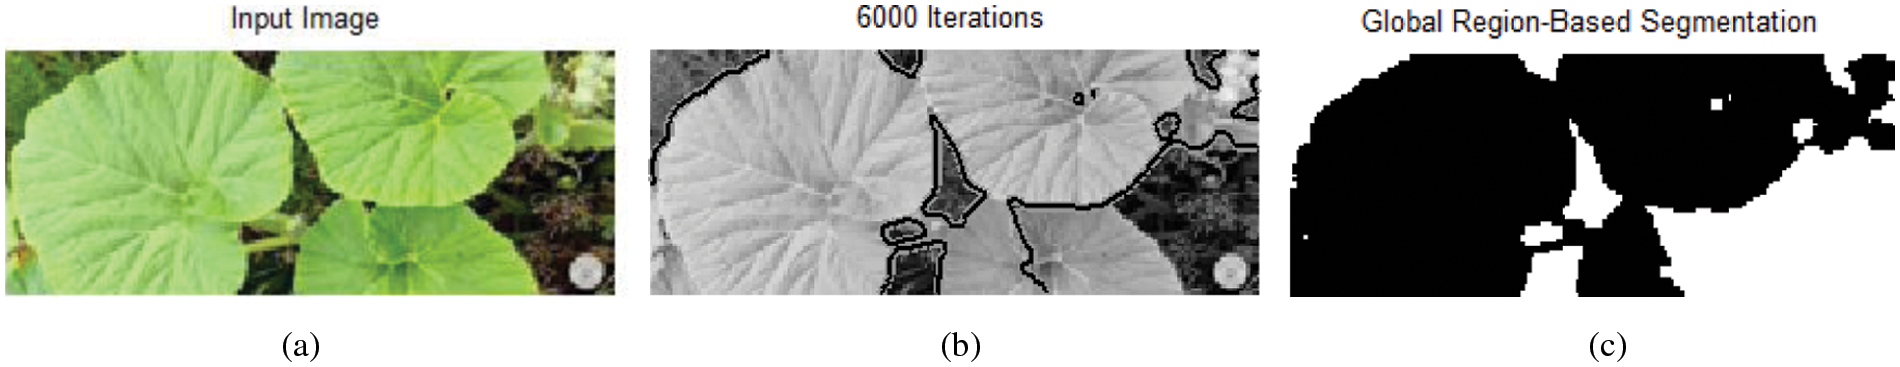
Figure 6: Leaf segmentation using contour segmentation algorithm
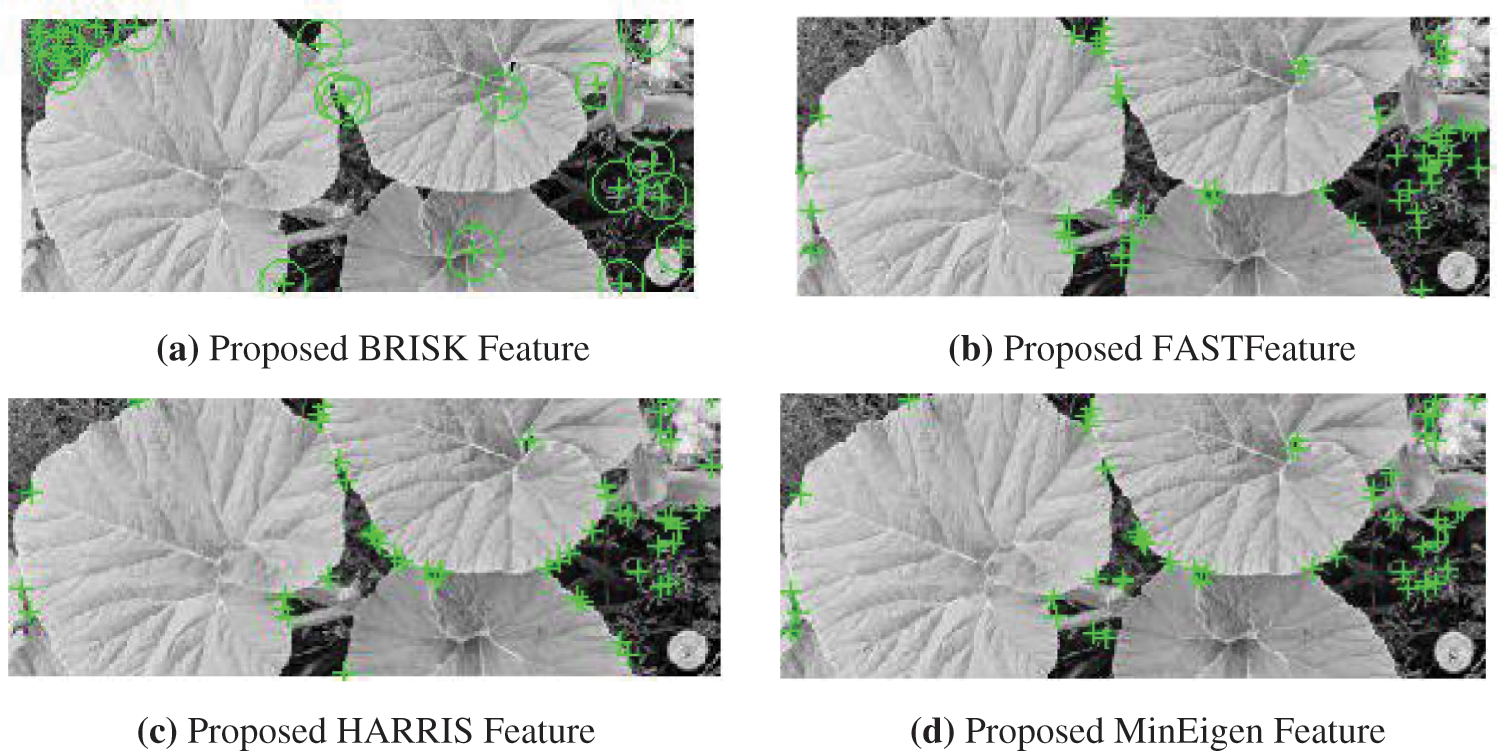
Figure 7: (a): Proposed BRISK feature (b): Proposed FAST feature (c): Proposed HARRIS feature (d): Proposed MinEigen feature
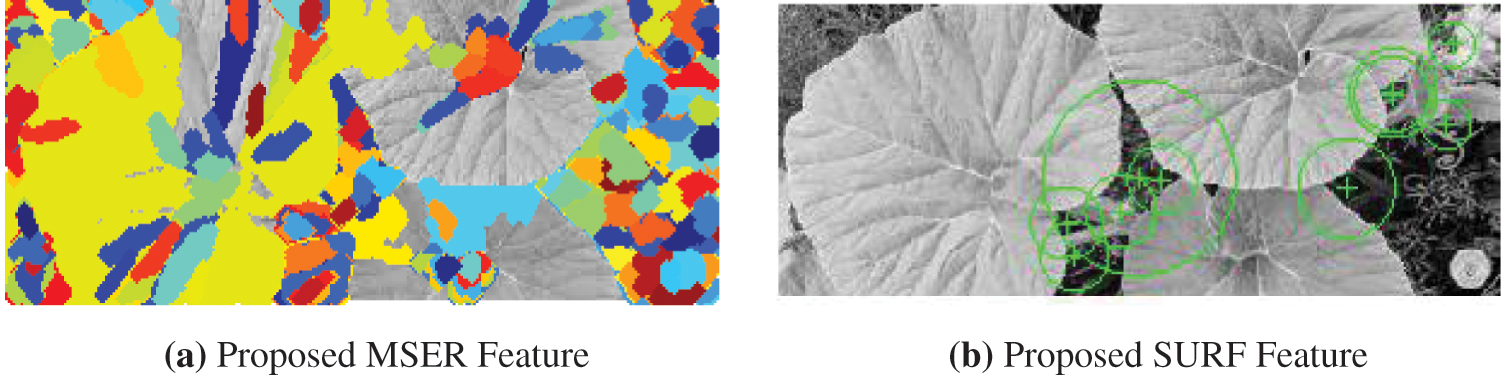
Figure 8: (a): Proposed MSER feature (b): Proposed SURF feature
4.2 Implementation of Existing Approaches of Pumpkin Leaf Disease Classification
4.3 Implementation of Proposed Pumpkin Leaf Disease Classification
Machine learning based methods were presented in the paper alternative to the manual methods which are depends on the manual experience. The Paper presented a proposed method for disease diagnosis and classification of diseases in Cucurbita gourd family. Convolutional neural network (CNN) was proposed for disease severity examination of leaf samples through computer vision. The automatic pumpkin leaf image classification using proposed DCNN was efficient compared to other methods. The Simulation was done using Matlab.
Acknowledgement: Authors we thank our colleges and university who have been motivating us in the course of the work.
Funding Statement: The authors received no specific funding for this study.
Conflicts of Interest: The authors declare that they have no conflicts of interest to report regarding the present study.
1. V. Singh and A. K. Misra, “Detection of plant leaf diseases using image segmentation and soft computing techniques,” Information Processing in Agriculture, vol. 4, no. 1, pp. 41–49, 2017. [Google Scholar]
2. L. Chaerle, I. Leinonen, H. G. Jones and D. V. D. Straeten, “Monitoring and screening plant populations with combined thermal and chlorophyll fluorescence imaging,” Journal of Experimental Botany, vol. 58, no. 4, pp. 773–784, 2007. [Google Scholar]
3. E. Ward, S. J. Foster, B. A. Fraaije and H. A. Mccartney, “Plant pathogen diagnostics: Immunological and nucleic acid-based approaches,” Annals of Applied Biology, vol. 145, no. 1, pp. 1–16, 2004. [Google Scholar]
4. A. J. C. Eun, L. Huang, F. T. Chew, S. F. Y. Li and S. M. Wong, “Detection of two orchid viruses using quartz crystal microbalance (QCM) immune-sensors,” Journal of Virology Methods, vol. 99, no. 1, pp. 71–79, 2002. [Google Scholar]
5. G. Dhingra, V. Kumar and H. D. Joshi, “Study of digital image processing techniques for leaf disease detection and classification,” Multimedia Tools and Applications, vol. 77, pp. 19951–20000, 2018. [Google Scholar]
6. R. M. Prakash, G. P. Saraswathy, G. Ramalakshmi, K. H. Mangaleswari and T. Kaviya, “Detection of leaf diseases and classification using digital image processing,” in 2017 Int. Conf. on Innovations in Information, Embedded and Communication Systems (ICIIECS), Coimbatore, pp. 1–4, 2017. [Google Scholar]
7. G. Kumar and P. K. Bhatia, “A detailed review of feature extraction in image processing systems,” in Fourth Int. Conf. on Advanced Computing & Communication Technologies, Rohtak, India, pp. 5–12, 2014. [Google Scholar]
8. N. Thakur and D. Maheshwari, “A review of image classification techniques,” International Research Journal of Engineering and Technology (IRJET), vol. 4, no. 11, pp. 1588–1591, 2017. [Google Scholar]
9. G. Saradhambal, R. Dhivya, S. Latha and R. Rajesh, “Plant disease detection and its solution using image classification,” International Journal of Pure and Applied Mathematics, vol. 119, no. 14, pp. 879–884, 2018. [Google Scholar]
10. S. Loussaief and A. Abdelkrim, “Machine learning framework for image classification,” in 2016 7th Int. Conf. on Sciences of Electronics, Technologies of Information and Telecommunications (SETIT), Hammamet, pp. 58–61, 2016. [Google Scholar]
11. P. Jiang, Y. Chen, B. Liu, D. He and C. Liang, “Real-time detection of apple leaf diseases using deep learning approach based on improved convolutional neural networks,” IEEE Access, vol. 7, pp. 59069–59080, 2019. [Google Scholar]
12. D. Ashourloo, H. Aghighi, A. A. Matkan, M. R. Mobasheri and A. M. Rad, “An investigation into machine learning regression techniques for the leaf rust disease detection using hyperspectral measurement,” IEEE Journal of Selected Topics in Applied Earth Observations and Remote Sensing, vol. 9, no. 9, pp. 4344–4351, 2016. [Google Scholar]
13. S. Kaur, S. Pandey and S. Goel, “Semi-automatic leaf disease detection and classification system for soybean culture,” IET Image Processing, vol. 12, no. 6, pp. 1038–1048, 2018. [Google Scholar]
14. U. P. Singh, S. S. Chouhan, S. Jain and S. Jain, “Multilayer convolution neural network for the classification of mango leaves infected by anthracnose disease,” IEEE Access, vol. 4, pp. 1–10, 2019. [Google Scholar]
15. N. Schor, A. Bechar, T. Ignat, A. Dombrovsky, Y. Elad et al., “Robotic disease detection in greenhouses: Combined detection of powdery mildew and tomato spotted wilt virus,” IEEE Robotics and Automation Letters, vol. 1, no. 1, pp. 354–360, 2016. [Google Scholar]
16. W. Huang, Q. Guan, J. Luo, J. Zhang, J. Zhao et al., “New optimized spectral indices for identifying and monitoring winter wheat diseases,” IEEE Journal of Selected Topics in Applied Earth Observations and Remote Sensing, vol. 7, no. 6, pp. 2516–2524, 2014. [Google Scholar]
17. J. Luo, W. Huang, J. Zhao, J. Zhang, C. Zhao et al., “Detecting aphid density of winter wheat leaf using hyperspectral measurements,” IEEE Journal of Selected Topics in Applied Earth Observations and Remote Sensing, vol. 6, no. 2, pp. 690–698, 2013. [Google Scholar]
18. Z. Lin, S. Mu, F. Huang, K. Mateen, M. Wang et al., “A unified matrix-based convolutional neural network for fine-grained image classification of wheat leaf diseases,” IEEE Access, vol. 7, pp. 1–22, 2019. [Google Scholar]
19. S. Kaur, S. Pandey and S. Goel, “An automatic leaf disease detection system for legume species,” Journal of Biology and Today’s World, vol. 6, no. 6, pp. 115–122, 2017. [Google Scholar]
20. S. Shrivastava, S. K. Singh and D. S. Hooda, “Statistical texture and normalized discrete cosine transform-based automatic soya plant foliar infection cataloguing,” British Journal of Mathematics & Computer Science, vol. 4, no. 20, pp. 2901–2916, 2014. [Google Scholar]
21. S. B. Jadhav and S. B. Patil, “Grading of soybean leaf disease based on segmented image using k-means clustering,” International Journal of Advanced Research in Electronics and Communication Engineering (IJARECE), vol. 4, no. 6, pp. 1816–1822, 2015. [Google Scholar]
22. S. Gharge and P. Singh, “Image processing for soybean disease classification and severity estimation,” Emerging Research in Computing, Information, Communication and Applications, pp. 493–500, 2016. [Google Scholar]
23. K. R. Gavhale and U. Gawande, “An overview of the research on plant leaves disease detection using image processing techniques,” IOSR Journal of Computer Engineering (IOSR-JCE), vol. 16, no. 1, pp. 10–16, 2014. [Google Scholar]
24. J. G. A. Barbedo, “A review on the main challenges in automatic plant disease identification based on visible range images,” Bio Systems Engineering, vol. 144, pp. 52–60, 2016. [Google Scholar]
25. S. S. Chouhan, A. Kaul, U. P. Singh and S. Jain, “Bacterial foraging optimization based radial basis function neural network (BRBFNN) for identification and classification of plant leaf diseases: An automatic approach towards plant pathology,” IEEE Access, vol. 6, pp. 1–12, 2018. [Google Scholar]
26. R. Sujatha, Y. S. Kumar and G. U. Akhil, “Leaf disease detection using image processing,” Journal of Chemical and Pharmaceutical Sciences, vol. 10, no. 1, pp. 670–672, 2017. [Google Scholar]
27. X. Zhang, Y. Qiao, F. Meng, C. Fan and M. Zhang, “Identification of maize leaf diseases using improved deep convolutional neural networks,” IEEE Access, vol. 6, pp. 1–8, 2018. [Google Scholar]
28. F. Martinelli, R. Scalenghe, S. Davino, S. Panno, G. Scuderi et al., “Advanced methods of plant disease detection. A review,” Agronomy for Sustainable Development, vol. 35, no. 1, pp. 1–25, 2014. [Google Scholar]
29. D. A. Bashish, M. Braik and S. B. Ahmad, “Detection and classification of leaf diseases using k-means-based segmentation and neural-networks-based classification,” Information Technology Journal, vol. 10, no. 2, pp. 267–275, 2011. [Google Scholar]
30. G. Mikolajczak and J. Peksinski, “Estimation of the variance of noise in digital images using a median filter,” in 2016 39th Int. Conf. on Telecommunications and Signal Processing (TSP), Vienna, pp. 489–492, 2016. [Google Scholar]
31. P. A. Lyakhov, A. R. Orazaev, N. I. Chervyakov and D. I. Kaplun, “A new method for adaptive median filtering of images,” in 2019 IEEE Conf. of Russian Young Researchers in Electrical and Electronic Engineering (EIConRus), Saint Petersburg and Moscow, Russia, pp. 1197–1201, 2019. [Google Scholar]
32. H. Choi and J. Jeong, “Despeckling images using a preprocessing filter and discrete wavelet transform-based noise reduction techniques,” IEEE Sensors Journal, vol. 18, no. 8, pp. 3131–3139, 2018. [Google Scholar]
33. S. Adatrao and M. Mittal, “An analysis of different image preprocessing techniques for determining the centroids of circular marks using hough transform,” in 2016 2nd Int. Conf. on Frontiers of Signal Processing (ICFSP), Warsaw, pp. 110–115, 2016. [Google Scholar]
34. A. K. Chaubey, “Comparison of the local and global thresholding methods in image segmentation,” World Journal of Research and Review (WJRR), vol. 2, no. 1, pp. 1–4, 2016. [Google Scholar]
35. D. Baswaraj, A. Govardhan and P. Premchand, “Active contours and image segmentation: The current state of the art,” Global Journal of Computer Science and Technology Graphics & Vision, vol. 12, no. 11, pp. 1–12, 2012. [Google Scholar]
36. N. Kiaee, E. Hashemizadeh and N. Zarrinpanjeh, “Using GLCM features in haar wavelet transformed space for moving object classification,” IET Intelligent Transport Systems, vol. 13, no. 7, pp. 1148–1153, 2019. [Google Scholar]
37. G. Mukherjee, A. Chatterjee and B. Tudu, “Study on the potential of combined GLCM features towards medicinal plant classification,” in 2016 2nd Int. Conf. on Control, Instrumentation, Energy & Communication (CIEC), Kolkata, pp. 98–102, 2016. [Google Scholar]
38. M. Suganthy and P. Ramamoorthy, “Principal component analysis based feature extraction, morphological edge detection and localization for fast iris recognition,” Journal of Computer Science, vol. 8, no. 9, pp. 1428–1433, 2012. [Google Scholar]
39. V. Chandrasekara, C. Tilakaratne and M. Mammadov, “An improved probabilistic neural network model for directional prediction of a stock market index,” Applied Science, vol. 9, pp. 1–21, 2019. [Google Scholar]
40. E. Mair, G. D. Hager, D. Burschka, M. Suppa and G. Hirzinger, “Adaptive and generic corner detection based on the accelerated segment test,” in 11th European Conf. on Computer Vision, Crete,Greece, pp. 183–196, 2010. [Google Scholar]
 | This work is licensed under a Creative Commons Attribution 4.0 International License, which permits unrestricted use, distribution, and reproduction in any medium, provided the original work is properly cited. |