DOI:10.32604/csse.2023.026482
| Computer Systems Science & Engineering DOI:10.32604/csse.2023.026482 | |
| Article |
Optimal Sparse Autoencoder Based Sleep Stage Classification Using Biomedical Signals
1Department of Computer Science and Information Systems, College of Applied Sciences, AlMaarefa University, Ad Diriyah, Riyadh, 13713, Kingdom of Saudi Arabia
2Department of Computer Engineering, College of Computers and Information Technology, Taif University, Taif, 21944, Kingdom of Saudi Arabia
3Department of Respiratory Care, College of Applied Sciences, AlMaarefa University, Ad Diriyah, Riyadh, 13713, Kingdom of Saudi Arabia
4Department of Archives and Communication, King Faisal University, Al Ahsa, Hofuf, 31982, Kingdom of Saudi Arabia
*Corresponding Author: Ashit Kumar Dutta. Email: drashitkumar@yahoo.com
Received: 28 December 2021; Accepted: 21 February 2022
Abstract: The recently developed machine learning (ML) models have the ability to obtain high detection rate using biomedical signals. Therefore, this article develops an Optimal Sparse Autoencoder based Sleep Stage Classification Model on Electroencephalography (EEG) Biomedical Signals, named OSAE-SSCEEG technique. The major intention of the OSAE-SSCEEG technique is to find the sleep stage disorders using the EEG biomedical signals. The OSAE-SSCEEG technique primarily undergoes preprocessing using min-max data normalization approach. Moreover, the classification of sleep stages takes place using the Sparse Autoencoder with Smoothed Regularization (SAE-SR) with softmax (SM) approach. Finally, the parameter optimization of the SAE-SR technique is carried out by the use of Coyote Optimization Algorithm (COA) and it leads to boosted classification efficiency. In order to ensure the enhanced performance of the OSAE-SSCEEG technique, a wide ranging simulation analysis is performed and the obtained results demonstrate the betterment of the OSAE-SSCEEG technique over the recent methods.
Keywords: Biomedical signals; EEG; sleep stage classification; machine learning; autoencoder; softmax; parameter tuning
Sleep, a natural physiological behaviour, is an integral part of our day to day lives, it plays a significant role in peoples’ health, cognition, and emotion, as well as has an impact on physiological and physical recovery [1]. Consequently, the efficient monitoring of sleep has gained considerable interest among the researchers that is the basis of treatment and diagnosis of sleep disorders [2]. The Sleep Stage Classification (SSC) system is the diagnosis of different sleeping stages by utilizing polysomnographic (PSG) that contains thirty second sleep duration as an epoch. Furthermore, every stage can give a certain application by using distinct classification processes [3]. By categorizing the rapid eye movement (REM) and non-rapid eye movement (NREM) stages, we could perform the REM-based sleep disease diagnoses. Sleep EEG signal is one of the effective and reliable methods, it comprises large number of data associated with mental states, age, and gender. Therefore, different approaches were analyzed for Electroencephalography (EEG) based SSC systems [4].
Generally, in conventional method for Automatic Sleep Stage Classification (ASSC), three special operations were made, classification, preprocessing, and feature extraction. The initial phase involves transforming, modifying, and cleaning the raw information as to understandable format for feature extraction [5]. In the second phase, the transformation of the primary data as to group of data with a limited amount of variables, and the classifier search for discovering an ideal mapping of the class label from the input feature [6]. Various approaches have been widely employed for extracting features from the signals. Generally, this feature is determined by previous knowledge of experts and is separated into i) frequency domain features ii) non-linear features, and ii) time-domain features. The efficacy is heavily based on data pre-processing and feature engineering. As well, because of the heterogeneity of the patterns amongst the subjects, this approach has generalized weakly for the information from other subjects [7]. The alternative method to resolve the abovementioned problems is deep learning (DL) technique that leads to great achievement in several domains. It finds its own pattern in information. Hence, it might be more generalizable [8].
This article develops an Optimal Sparse Autoencoder based Sleep Stage Classification Model on EEG Biomedical Signals, named OSAE-SSCEEG technique. The OSAE-SSCEEG technique primarily undergoes preprocessing using min-max data normalization approach. Moreover, the classification of sleep stages takes place using the Sparse Autoencoder with Smoothed Regularization (SAE-SR) with softmax (SM) approach. Finally, the parameter optimization of the SAE-SR technique is carried out by the use of Coyote Optimization Algorithm (COA) and it leads to boosted classification efficiency. In order to ensure the enhanced performance of the OSAE-SSCEEG technique, a wide ranging simulation analysis is performed on benchmark dataset.
The rest of the paper is organized as given here. Section 2 provides related works, section 3 elaborates the proposed model, Section 4 offers the result analysis, and Section 5 concludes the work.
An et al. [9] examined the EEG signals classifier issue and present a novel unsupervised multi-subepochs feature learning and hierarchical classifier technique to ASSC. Initial, it can be separate the EEG epoch as to several signal subepochs, and all subepochs were mapped to amplitude as well as time axis correspondingly for obtaining 2 types of features data with amplitude–time dynamic features. Afterward, the statistical classifier features were removed in the mapped feature data.
Eldele et al. [10] presented a new adversarial learning framework for tackling the field shift issue under the unlabeled target field. Primary, it can be established unshared attentions process for preserving the domain-specific features from the source and target domains. Secondary, it can be proposal an iterative self-trained approach for aligning the fine-grained class distribution to source and target fields using target region pseudo label. In [11], a deep multilayer perceptron neural network (MLPNN) has been established for classifying sleep-wake state utilizing multi-channel bipolar EEG signal that gets an input vector of size 108 involving the combined features of 9 channels. The network avoids some post-modelling stage for working as complete-fledged real time applications.
An et al. [12] devised an effectual multi-model fusion technique by utilizing hybrid-channel EEG signal that has 2 parts: the recognition of combined step of S1 as well as REM sleeps and the classifier amongst these 2 steps. Primary, it can be identified S1 as well as REM sleeps with characteristic the combined step in another sleep phases utilizing centered support vector machine (C-SVM) method and single-channel EEG signal. For overcoming the control due to class imbalances, a one-class OC-SVM technique of combined phase was recognized for correcting S1 as well as REM sleeps in the misclassified negative instances.
An et al. [13] studied the EEG signal classifier issue and present the multi-subbands and multi-subepochs time series feature learning (MMTSFL) technique to ASSC. Especially, MMTSFL primary decomposes several subbands with distinct frequency in raw EEG signal and partition the attained subbands as to several succeeding subepochs, and afterward utilizes time series feature learning for obtaining effectual discriminant features. Gurrala et al. [14] organized the sleep stage as way for allowing/helping physicians for coming across sleep problems. Let us consider the single EEG before multiple or multi-channel signals assume by previous works. Therefore, it can name our technique as single channel-SSC (SC-SSC). During this manner, it can be regarded time region as well as frequency domain features and the experimental machine learning (ML) technique called support vector machine (SVM) that outcomes superior implements to previous techniques.
3 The Proposed Sleep Stage Classification Model
In this study, a new OSAE-SSCEEG technique has been developed to effectually find sleep stage disorders using the EEG biomedical signals. The OSAE-SSCEEG technique involves several subprocesses namely min-max data normalization, SAE-SR based classification, and COA based parameter optimization. The parameter optimization of the SAE-SR technique is carried out by the use of COA and it leads to boosted classification efficiency.
At first, the pre-processing phase is executed for the transformation of non-conventional data set into conventional data set for enhancing the performance of the presented model [15]. The Neural network (NN) training becomes more efficient on the achievement of some pre-processing stages on the network targets and inputs. This method rescales the feature or output in one range of values to novel range of values. Generally, the feature is rescaled to be in the interval of zero to one or from -l to 1. It can be expressed as follows
In which (ymax − ymin) = 0; when (xmax − xmin) = 0 for a feature, it indicates a constant rate to that features in the data. When a value of feature was identified by a continuous value in the data, it shouldn't be concerned since it doesn't transport any data to NN system. When the min-max normalization was performed, all the features would lie in the novel range of values that remain unchanged.
3.2 Design of SAE-SR Based Classification Model
In SAE-SR technique, it can be providing a labeled m amount of input feature vectors are

Figure 1: SAE architecture
Then learning the optimum values of W and b with executing SAE on unlabeled data xu. It is regenerating as well as learning their resultant values
During the above calculations, maximum dimension input data has = (x1, x2, x3, …, xm), the reform vector of input data has
The smoothed l1 regularized contained from ML. The l1 regularization is non-differentiable and their outcomes are effort of optimization. The infimal convolutional of 1st and 2nd order entire difference as the regularized terms from penalization maximal probability reconstruction. The application of novel techniques provided as:
between μ > 0 is a hyperparameter that controls the resemblances amongst l1 and smoothed l1 regularized. If μ = 0, it develops as l1 regularized. The SAE executes back propagation (BP) for diminishing the cost function that is projected under the subsequent in Eq. (6):
In Eq. (5), S(.) refers the function that induces sparsity. The average outcome of jth hidden unit is tj.
The SM layer [17] is applied to forecast the label possibility of input data xi with utilizing the features learned in 3rd hidden layer representation
where W and b refers the weight as well as bias of entire deep network, collected of SAE-SR and the SM layer,
where
3.3 Design of COA Based Parameter Tuning
For optimally adjusting the parameters involved in the SAE-SR model, the COA is utilized. The population in COA has separated to equivalent amount of coyotes per pack. All coyote places are assumed that feasible solutions and their social conditions (the group of decision variables) signify the main purpose. At the primary, this technique begins with arbitrarily allocated coyotes’ place utilizing the subsequent formula.
where ubi and lbi refers the upper as well as lower bounds, ri signifies the arbitrary number amongst zero and one and Xi refers the place of coyote of ith dimensional. In COA, the amount of coyotes per pack are restricted to 14. It can promise the exploration ability of technique. An optimum coyote was determined as optimum one modified to environment. Specifically, it can be one with minimal cost function to minimize issue and the one with maximal cost function to maximize issue. During the COA, the coyotes were structured to contribute to the pack keep and for sharing the social condition. The social tendency of pack was calculated utilizing the subsequent formula. Fig. 2 demonstrates the flowchart of COA.
where Nc refers the amount of coyotes,
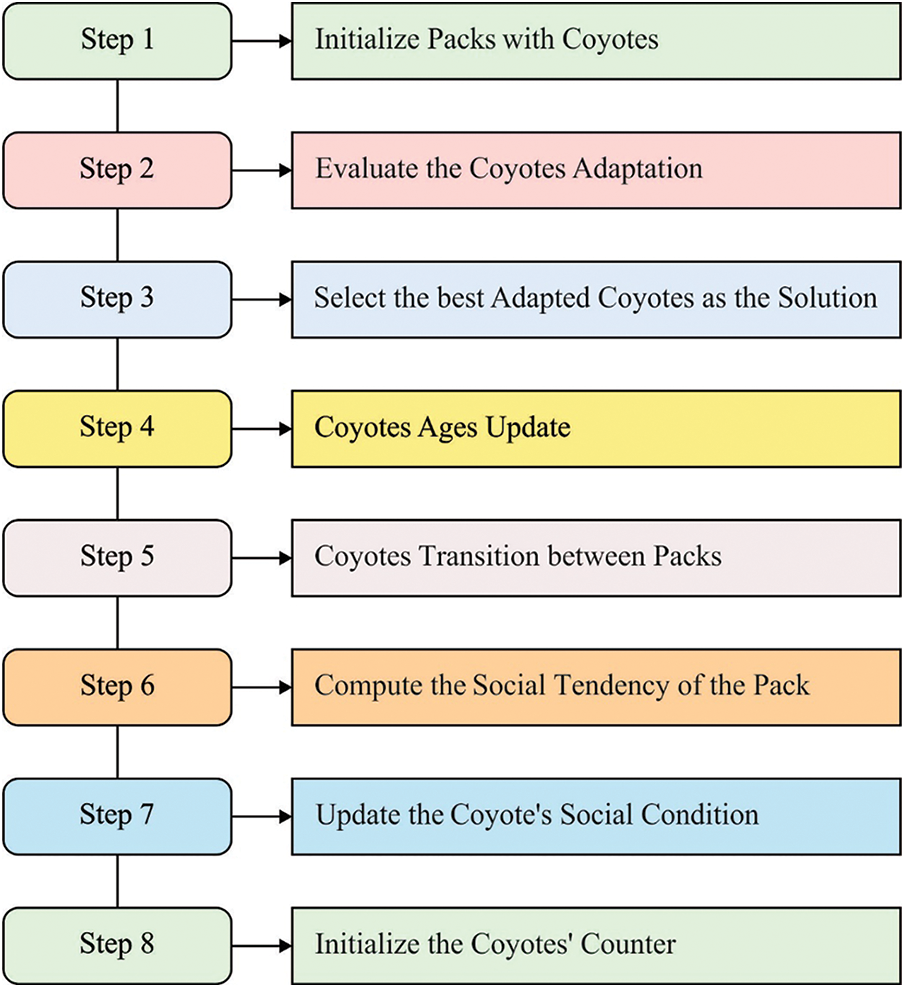
Figure 2: Flowchart of COA
where i1 and i2 denotes the 2 arbitrary dimensional, r1 and r2 implies the 2 coyotes arbitrarily chosen in pth pack, ri denotes the arbitrary number created from range zero and one, Pra indicates the connection probabilities and Prs stands for the scatter probabilities. Pra and Prs refers the computed as:
During all the iterations, every cth coyote from the pth pack upgrades their social conditions utilizing the subsequent formula [18]:
where σ1 and σ2 defines the alpha and pack influence correspondingly. It can be determined as:
where alphap,t refers the alpha coyotes.
At last, an optimum coyote was chosen dependent upon the social condition costs as optimum result attained of this issue.
The performance validation of the OSAE-SSCEEG technique takes place using two benchmark datasets namely Sleep-EDF-2013 and Sleep-EDF-2018 datasets. They contain a set of sample EEG recordings under five class labels. Tab. 1 and Fig. 3 provide a detailed classification result analysis of the OSAE-SSCEEG technique on the test Sleep-EDF-2013 dataset. The results demonstrated that the OSAE-SSCEEG technique has effectually identified all sleep stages. For instance, the OSAE-SSCEEG technique has classified the instances into ‘W’ class with the PREN, RECL, ACCY, and FSCORE of 0.987, 0.9827, 0.9898, and 0.9848 respectively. Furthermore, the OSAE-SSCEEG method has classified the instances into ‘REM’ class with the PREN, RECL, ACCY, and FSCORE of 0.9547, 0.94, 0.9862, and 0.9473 correspondingly.
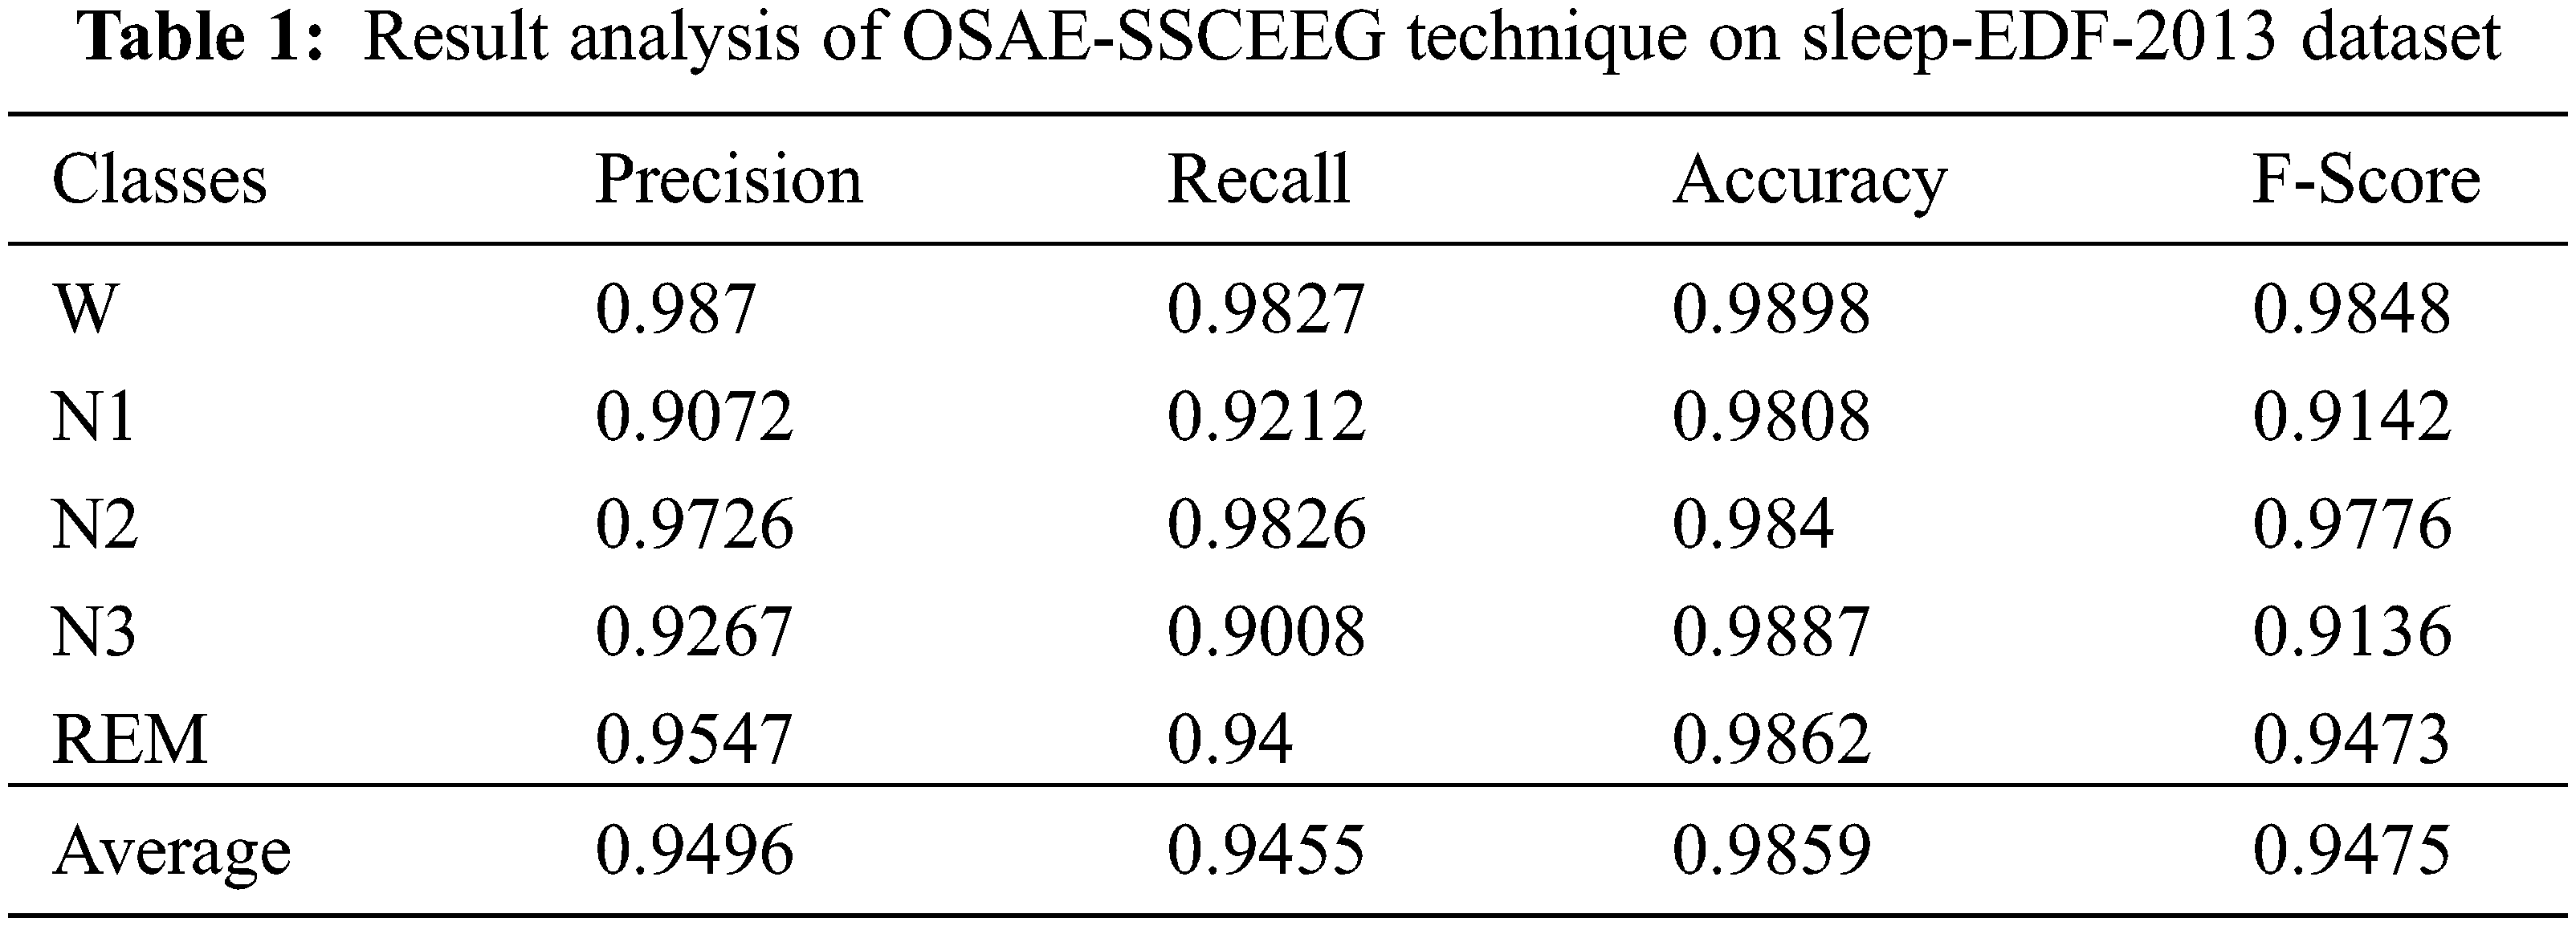
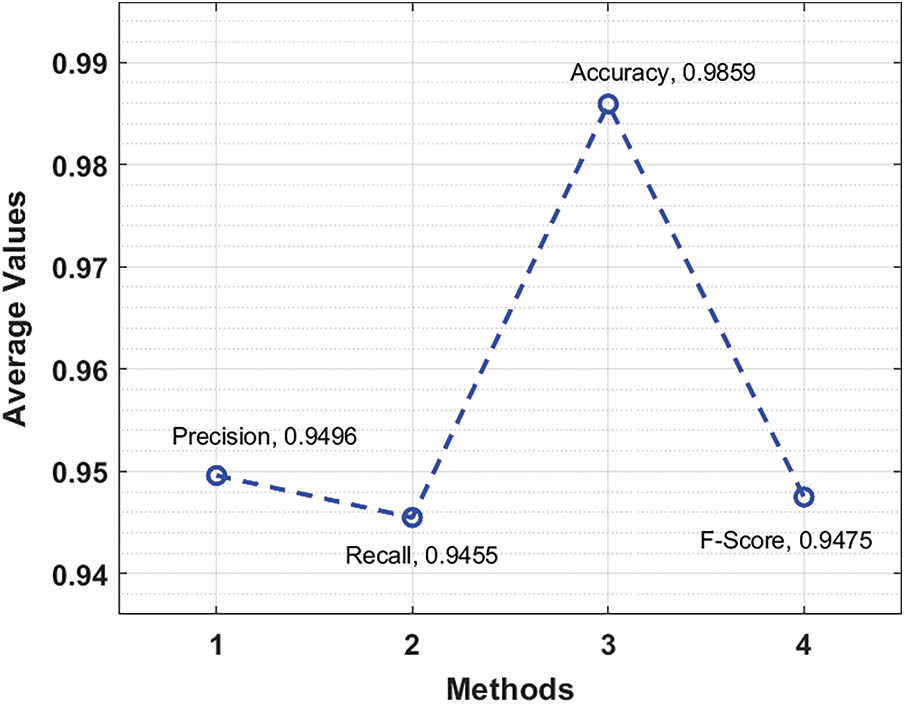
Figure 3: Result analysis of OSAE-SSCEEG technique on sleep-EDF-2013 dataset
Fig. 4 showcases the ROC analysis of the OSAE-SSCEEG approach on Sleep-EDF-2013 Dataset. The figure outperformed that the OSAE-SSCEEG system has attained improved outcomes with the minimal ROC of 97.9295.
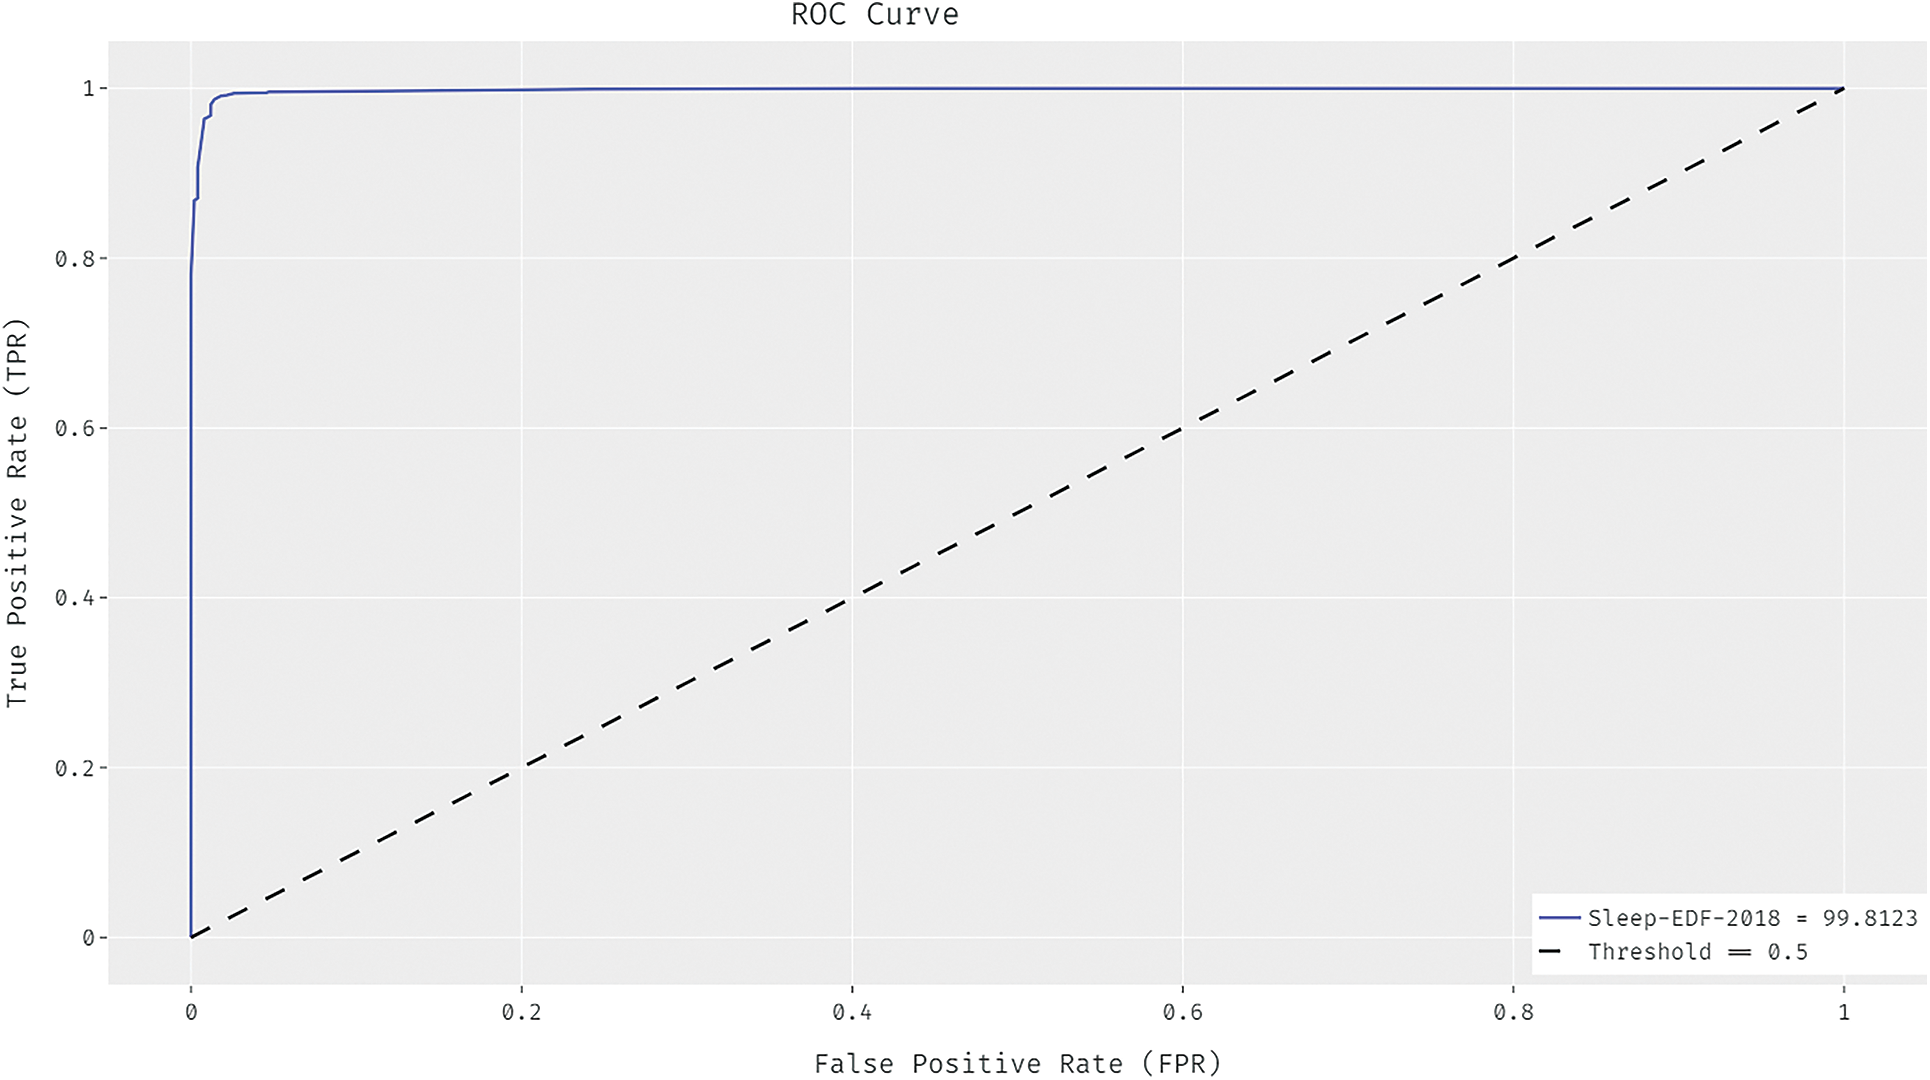
Figure 4: ROC analysis of OSAE-SSCEEG technique on sleep-EDF-2013 dataset
Tab. 2 and Fig. 5 offer a detailed classification outcome analysis of the OSAE-SSCEEG approach on the test Sleep-EDF-2018 dataset. The results exhibited that the OSAE-SSCEEG method has effectively identified all sleep stages. For instance, the OSAE-SSCEEG technique has classified the instances into ‘W’ class with the PREN, RECL, ACCY, and FSCORE of 0.9723, 0.9571, 0.9867, and 0.9647 correspondingly. Furthermore, the OSAE-SSCEEG algorithm has classified the instances into ‘REM’ class with the PREN, RECL, ACCY, and FSCORE of 0.9595, 0.9475, 0.9830, and 0.9534 correspondingly.
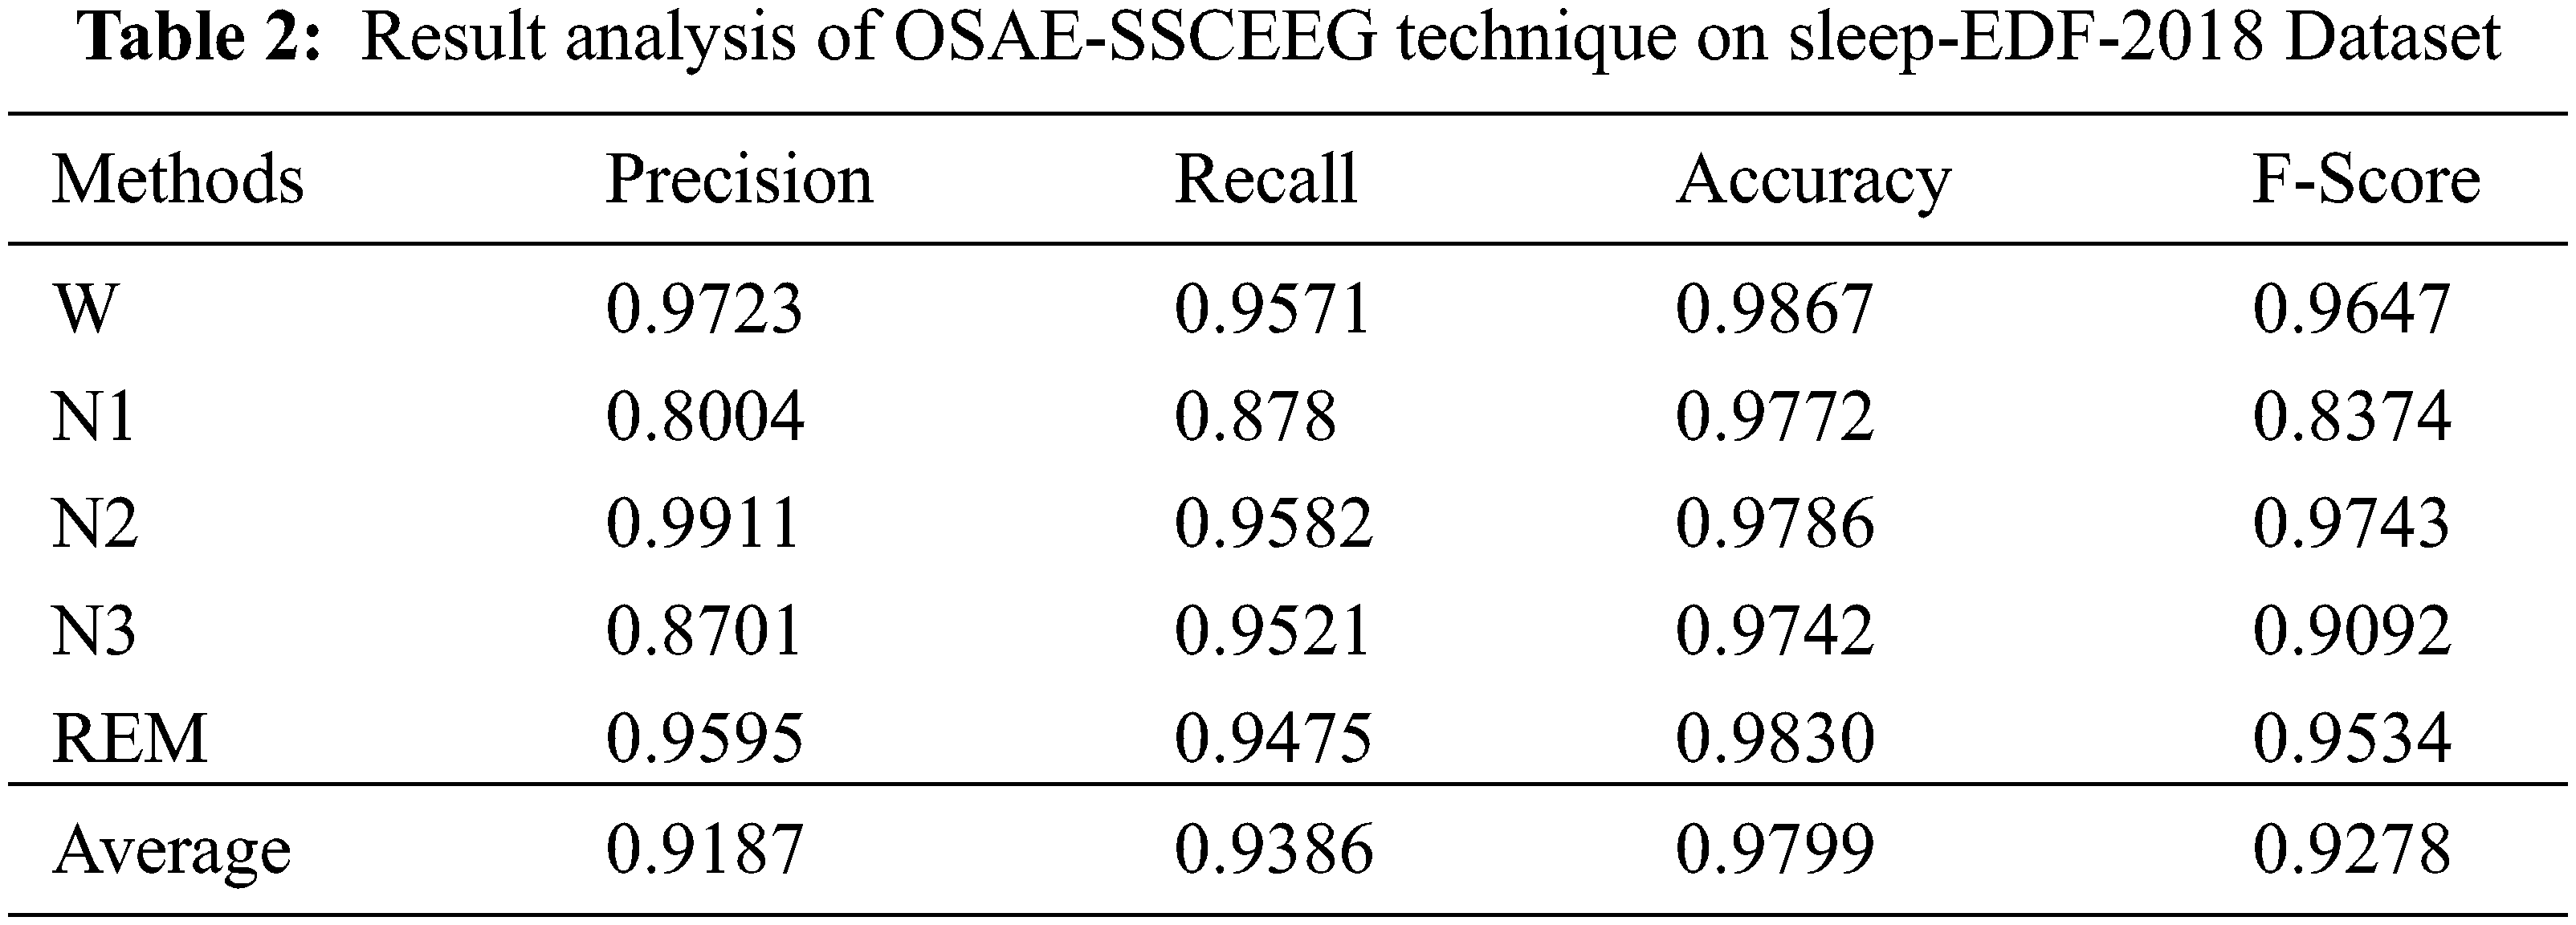
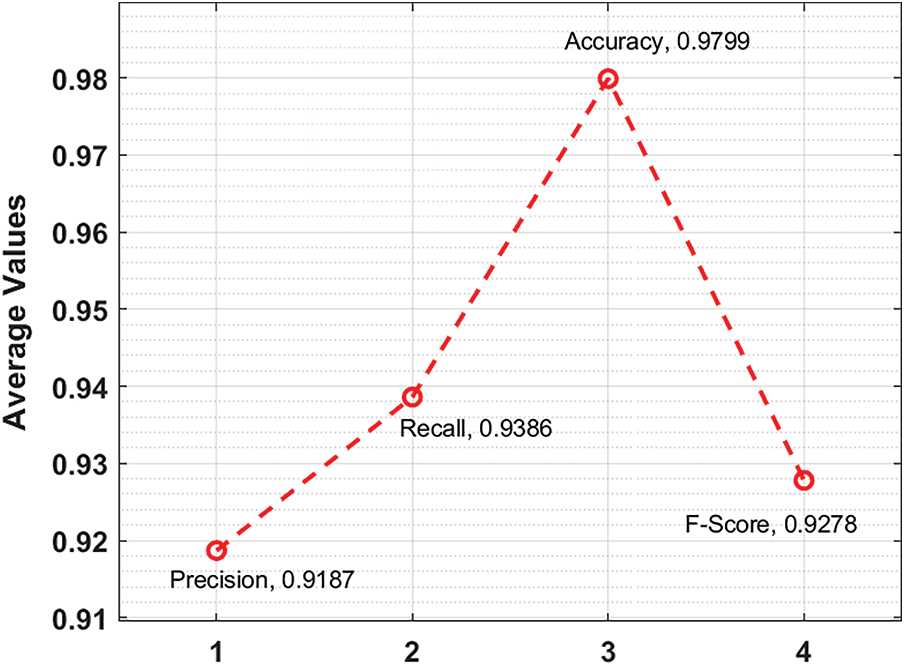
Figure 5: Result analysis of OSAE-SSCEEG technique on sleep-EDF-2018 dataset
Fig. 6 portrays the ROC analysis of the OSAE-SSCEEG system on Sleep-EDF-2018 Dataset. The figure stated that the OSAE-SSCEEG algorithm has obtained improved outcomes with the minimum ROC of 99.9137.
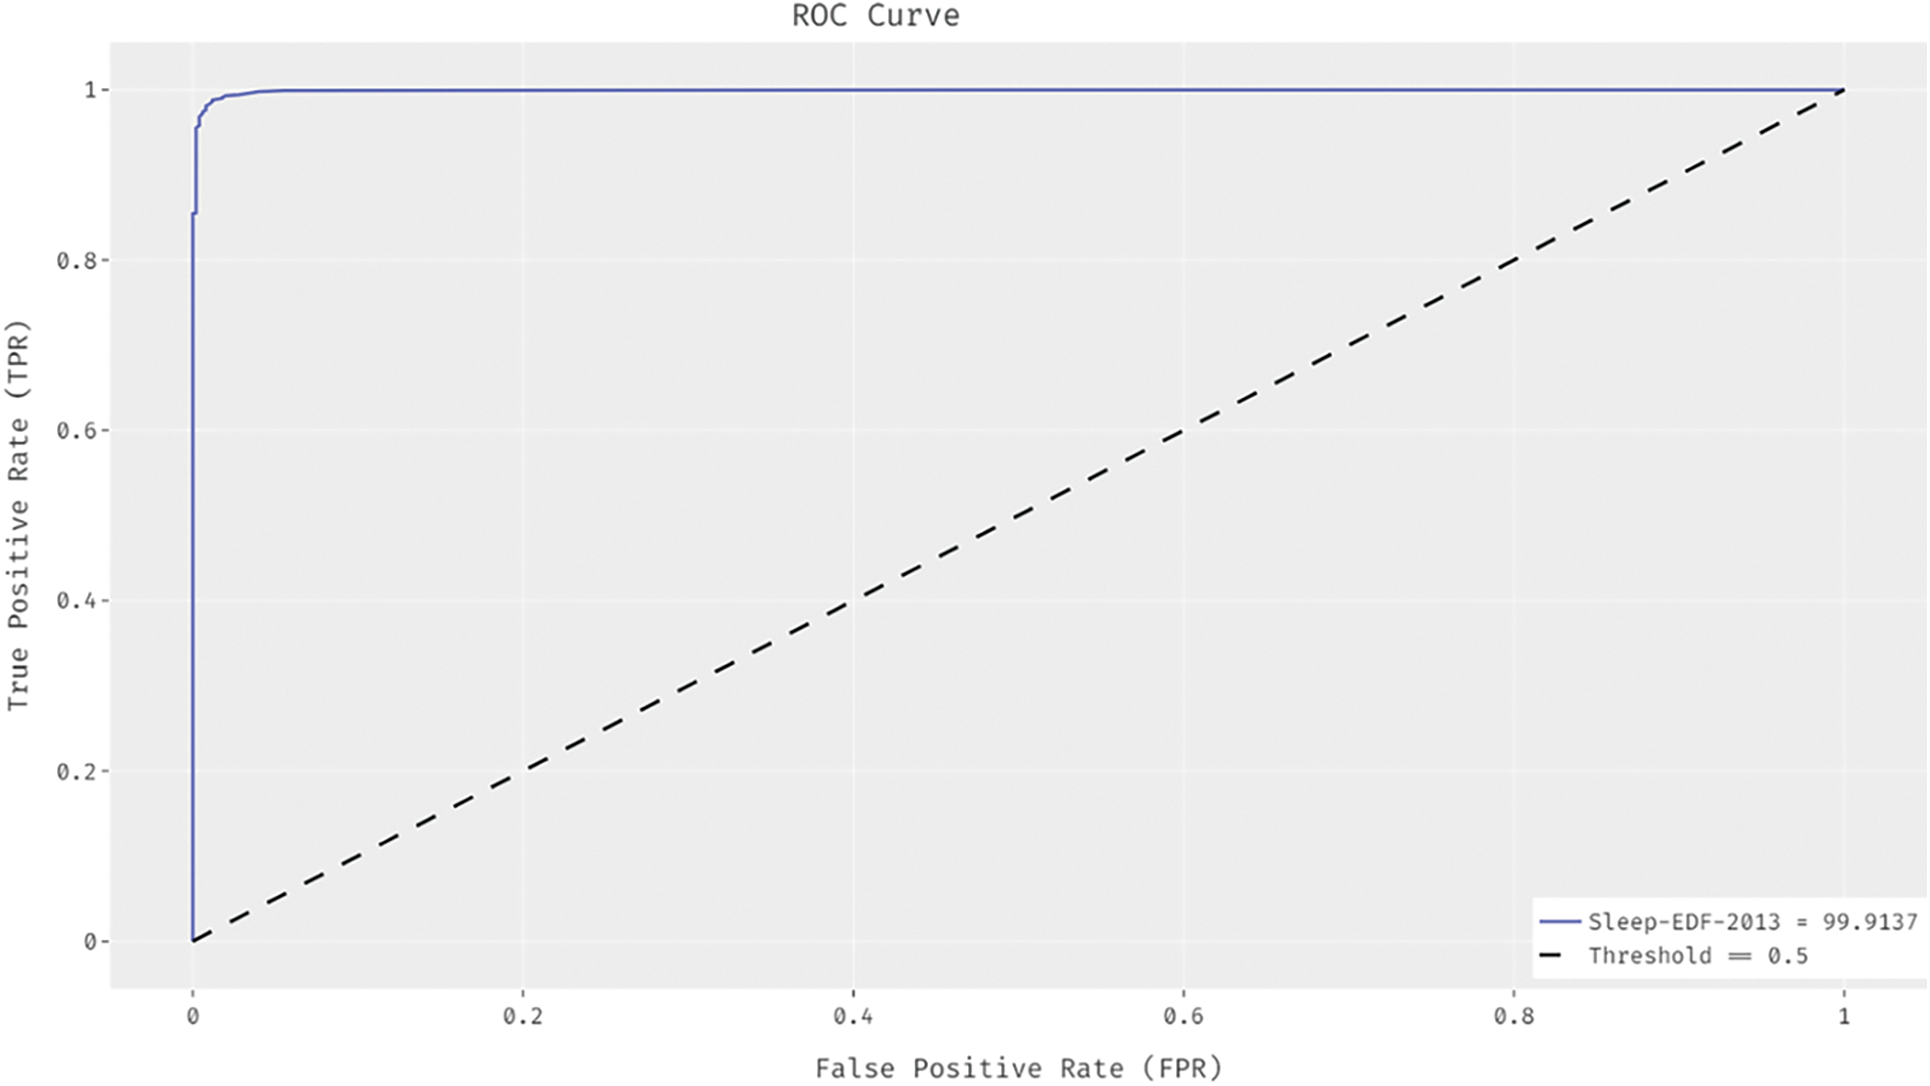
Figure 6: ROC analysis of OSAE-SSCEEG technique on sleep-EDF-2018 dataset
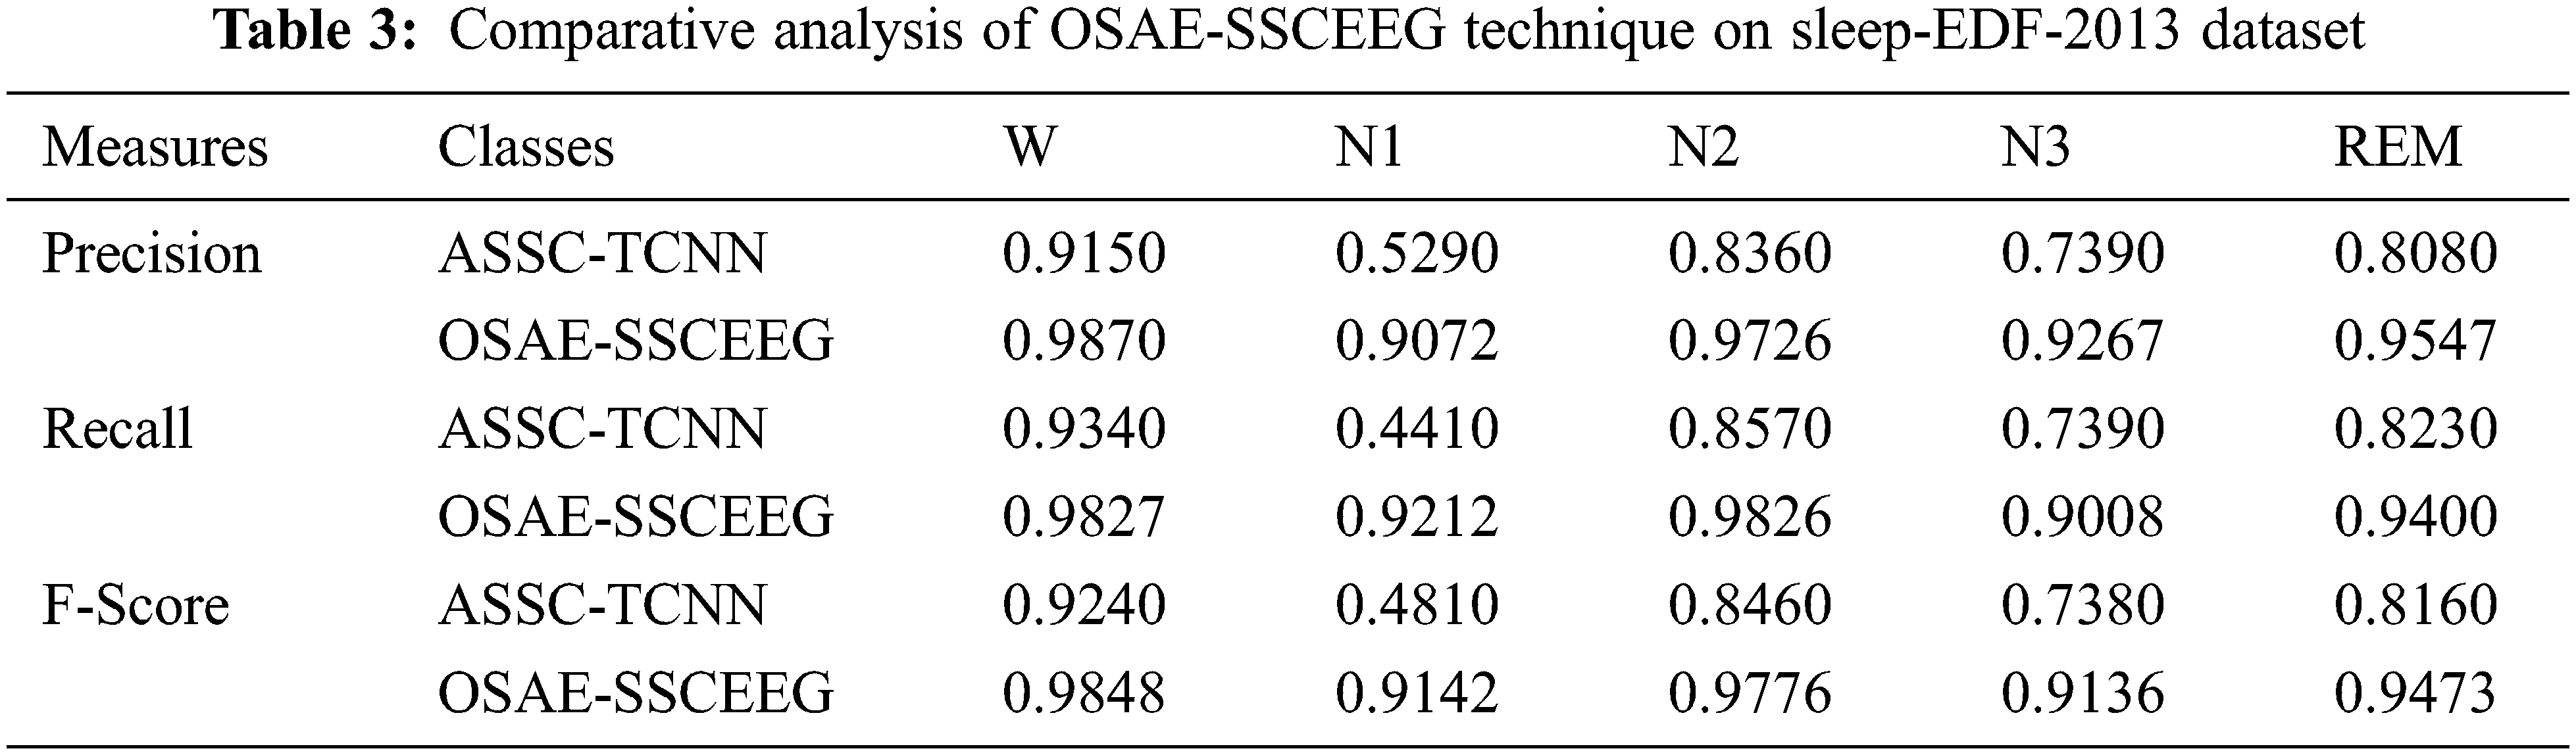
A comparative classification result analysis of the OSAE-SSCEEG technique with the existing ASS with temporal convolutional neural network (ASSC-TCNN) technique on the test sleep-EDF-2013 dataset is shown in Tab. 3. The experimental results exhibited that the OSAE-SSCEEG technique has gained improved outcomes over the ASSC-TCNN technique. For instance, under W class, the OSAE-SSCEEG technique has obtained increased PREN, RECL, and FSCORE of 0.9870, 0.9827, and 0.9848 whereas the ASSC-TCNN technique has attained reduced PREN, RECL, and FSCORE of 0.9150, 0.9340, and 0.9240 respectively. Besides, under REM class, the OSAE-SSCEEG approach has gained higher PREN, RECL, and FSCORE of 0.9547, 0.9400, and 0.9473 but the ASSC-TCNN algorithm has obtained lower PREN, RECL, and FSCORE of 0.8080, 0.8230, and 0.8160 correspondingly.
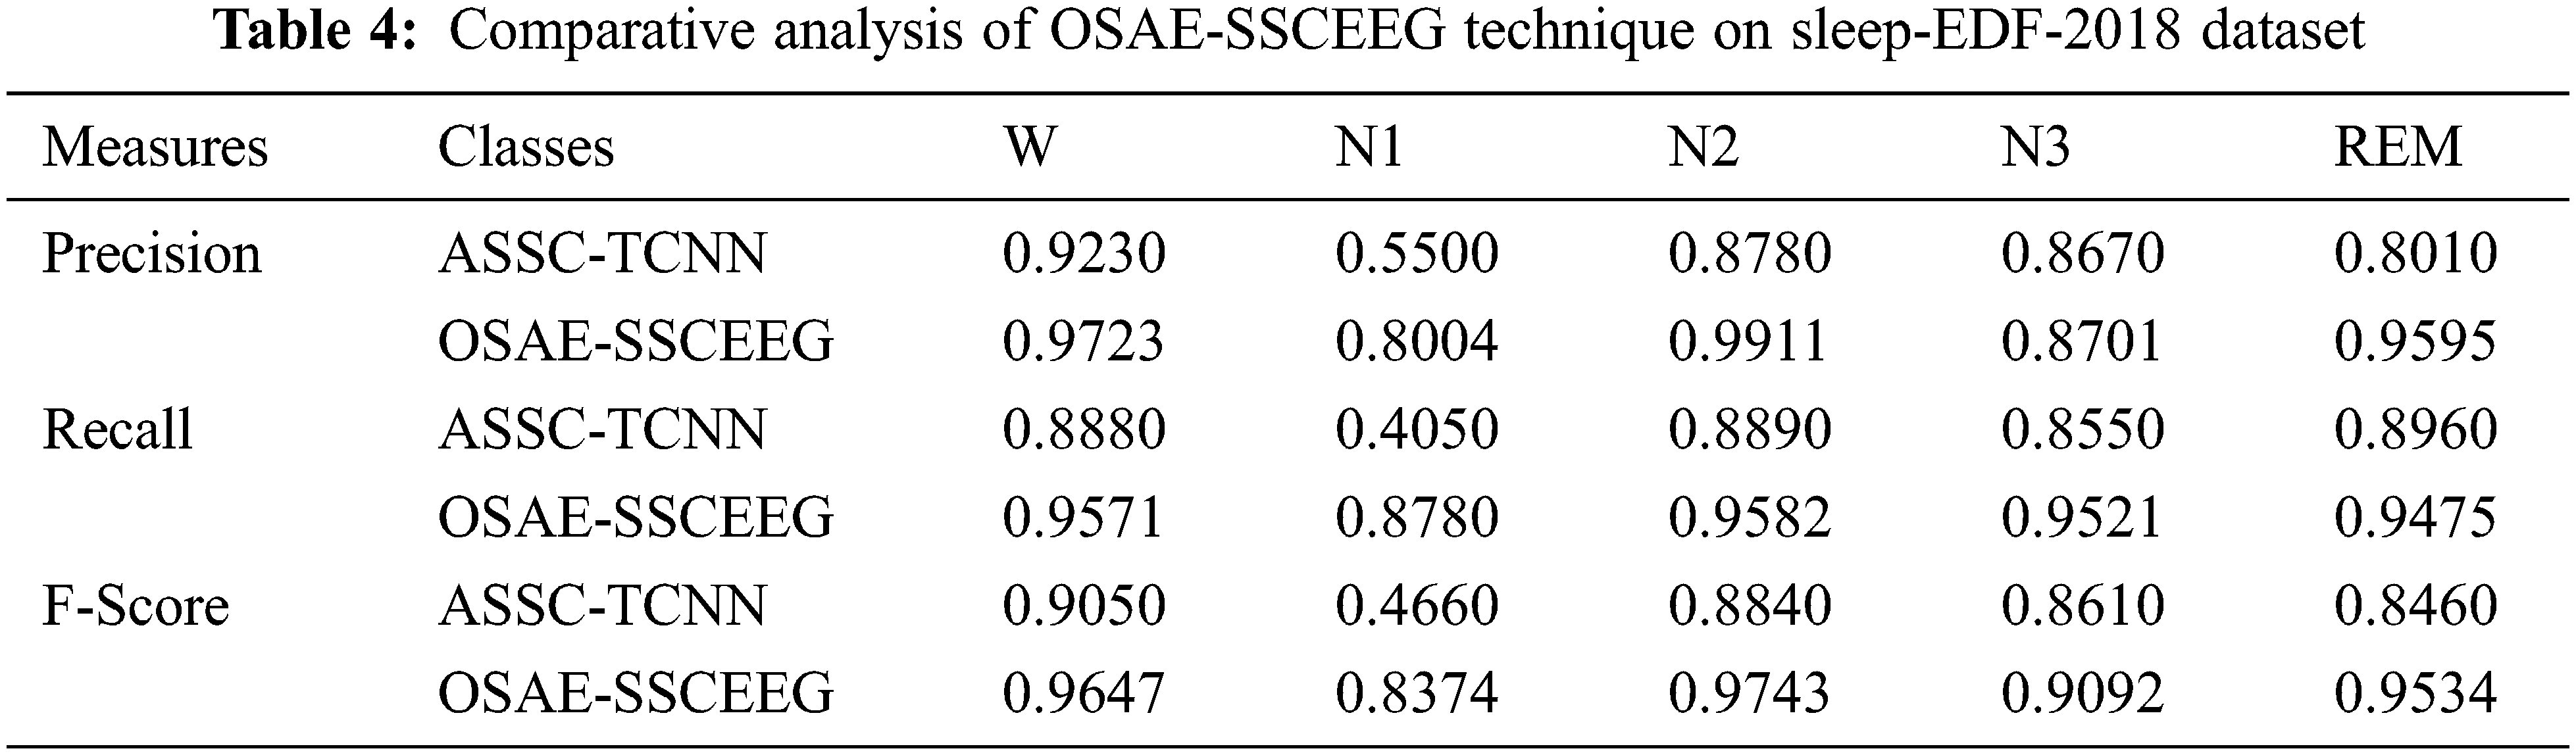
A comparative classification outcome analysis of the OSAE-SSCEEG algorithm with the present ASSC-TCNN approach on the test sleep-EDF-20138 dataset is illustrated in Tab. 4. The experimental outcomes displayed that the OSAE-SSCEEG methodology has attained increased outcomes over the ASSC-TCNN algorithm. For instance, under W class, the OSAE-SSCEEG approach has obtained increased PREN, RECL, and FSCORE of 0.9723, 0.9571, and 0.9647 whereas the ASSC-TCNN system has attained reduced PREN, RECL, and FSCORE of 0.9230, 0.8880, and 0.9050 correspondingly. In addition, under REM class, the OSAE-SSCEEG technique has achieved improved PREN, RECL, and FSCORE of 0.9595, 0.9475, and 0.9534 whereas the ASSC-TCNN methodology has attained decreased PREN, RECL, and FSCORE of 0.8010, 0.8960, and 0.8460 correspondingly.
For showcasing the enhanced performance outcome of the OSAE-SSCEEG technique, a comparative ACCY analysis is made in Tab. 5 and Fig. 7. The figure reported that the CNN-ASSS0SC and ASSS-TFA techniques have obtained lower ACCY values of 78.90% and 74.80% respectively. Eventually, the ASSS-SSDL, ASSS-RSC, and ASSC-TCNN techniques have demonstrated moderate ACCY values of 84.26%, 82%, and 82.46% respectively. However, the OSAE-SSCEEG technique has gained maximum performance with ACCY of 98.59%. Therefore, it is concluded that the OSAE-SSCEEG technique has accomplished effective sleep stage classification performance.
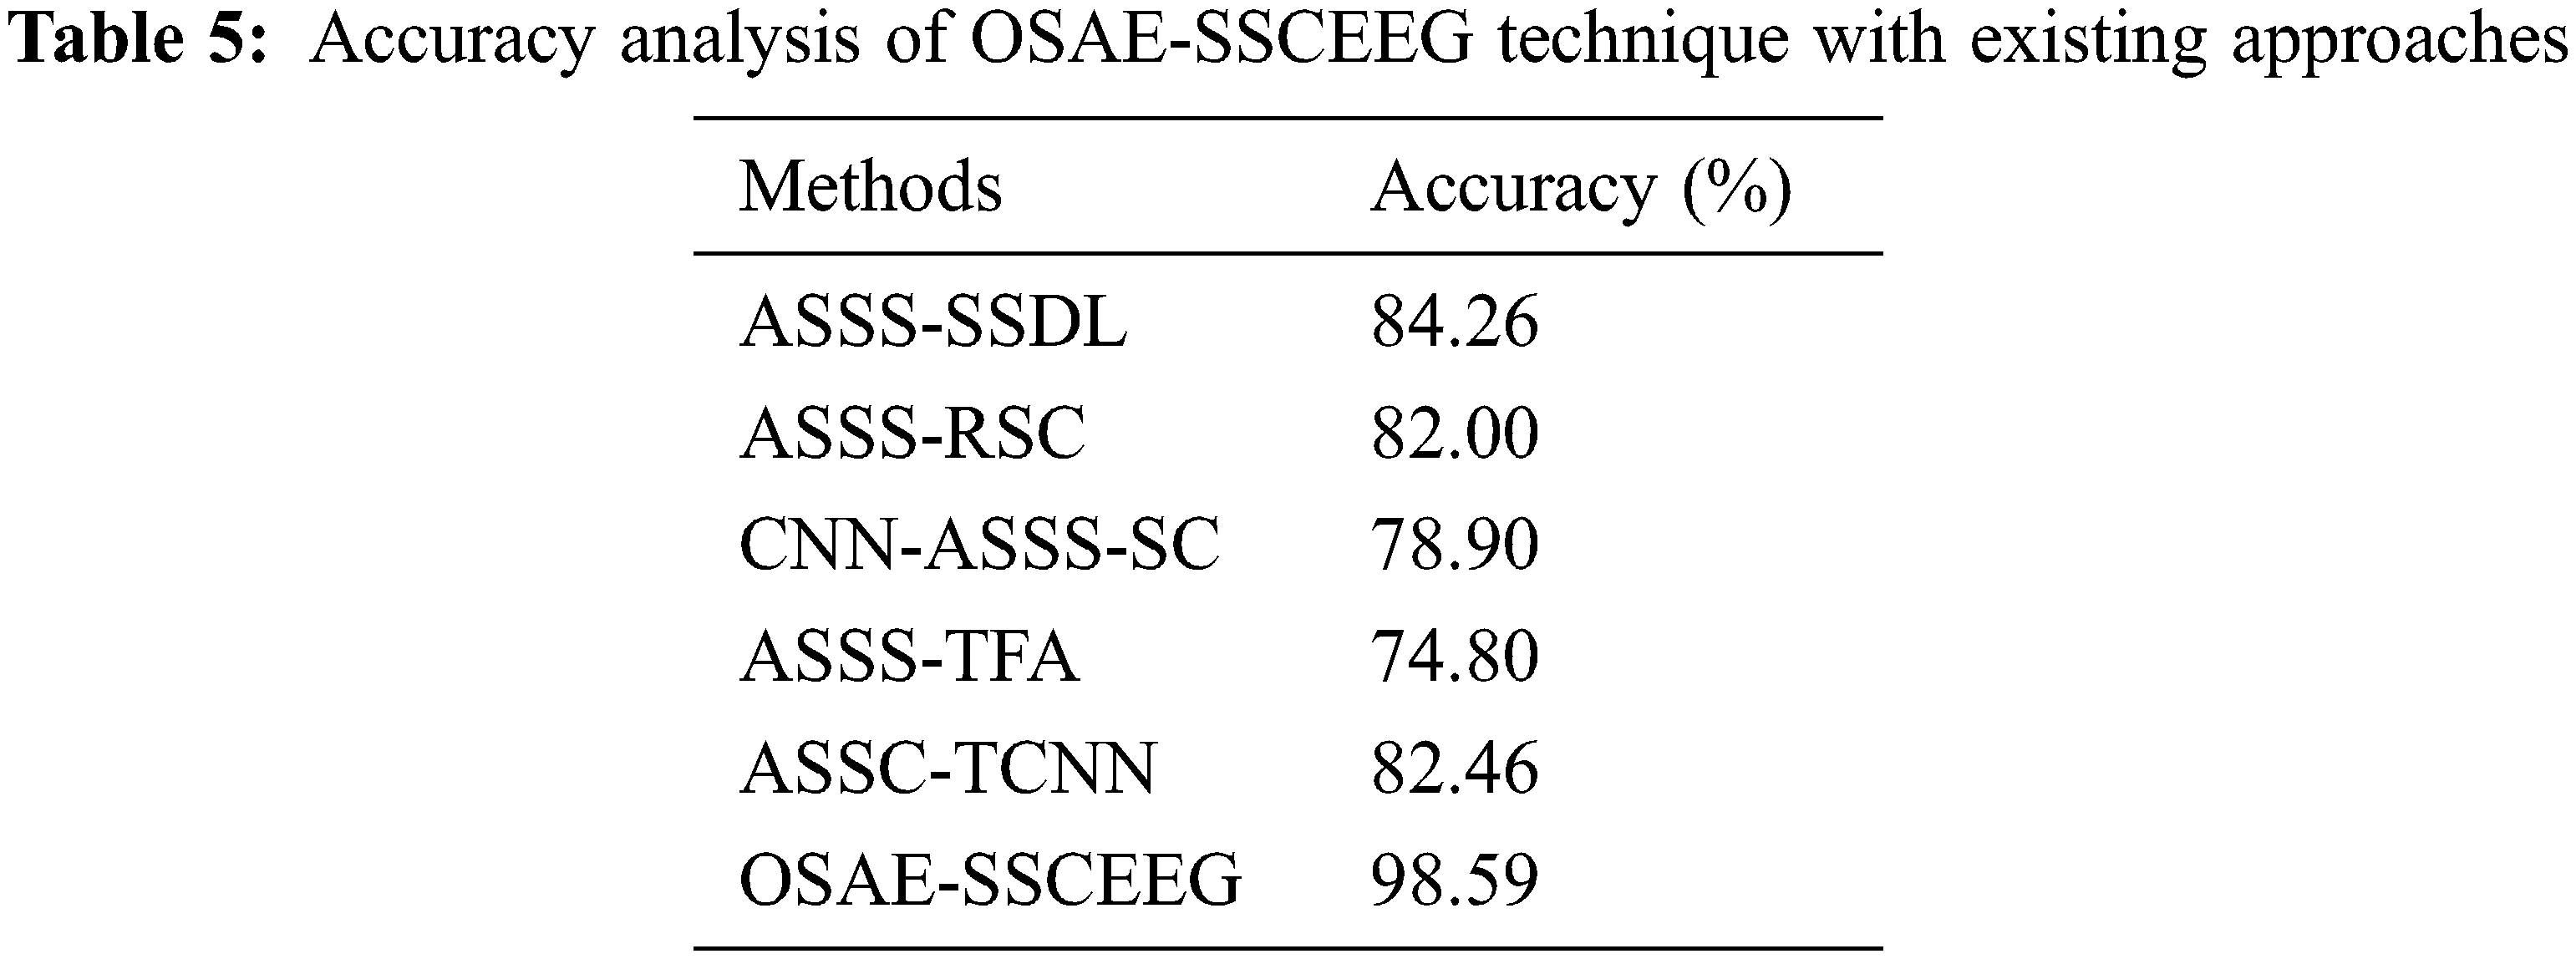
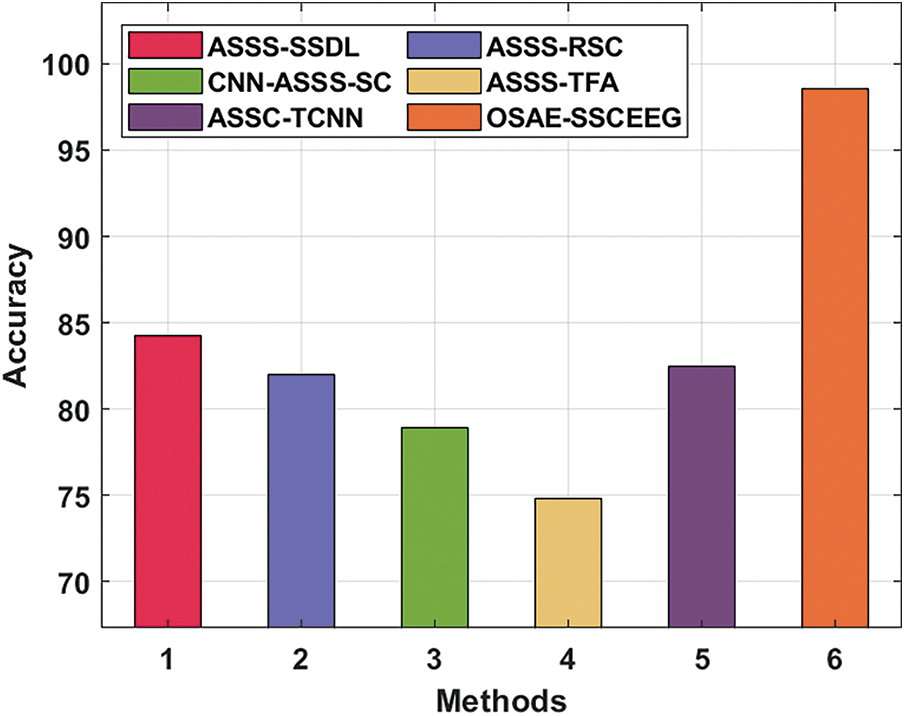
Figure 7: Accuracy analysis of OSAE-SSCEEG technique with existing approaches
In this study, a new OSAE-SSCEEG technique has been developed to effectually find sleep stage disorders using the EEG biomedical signals. The OSAE-SSCEEG technique involves several subprocesses namely min-max data normalization, SAE-SR based classification, and COA based parameter optimization. The parameter optimization of the SAE-SR technique is carried out by the use of COA and it leads to boosted classification efficiency. In order to ensure the enhanced performance of the OSAE-SSCEEG technique, a wide ranging simulation analysis is performed and the obtained results demonstrate the betterment of the OSAE-SSCEEG technique over the recent methods. Therefore, the OSAE-SSCEEG technique has the ability to accomplish improved sleep stage classification performance. In future, hybrid DL models can be included to enhance the efficiency of the OSAE-SSCEEG technique.
Acknowledgement: The authors would like to acknowledge the support provided by AlMaarefa University while conducting this research work.
Funding Statement: Taif University Researchers Supporting Project Number (TURSP-2020/161), Taif University, Taif, Saudi Arabia.
Conflicts of Interest: The authors declare that they have no conflicts of interest to report regarding the present study.
1. A. R. Hassan and A. Subasi, “A decision support system for automated identification of sleep stages from single-channel EEG signals,” Knowledge-Based Systems, vol. 128, pp. 115–124, 2017. [Google Scholar]
2. P. Ghasemzadeh, H. Kalbkhani, S. Sartipi and M. G. Shayesteh, “Classification of sleep stages based on LSTAR model,” Applied Soft Computing, vol. 75, pp. 523–536, 2019. [Google Scholar]
3. R. Yan, C. Zhang, K. Spruyt, L. Wei, Z. Wang et al., “Multi-modality of polysomnography signals’ fusion for automatic sleep scoring,” Biomedical Signal Processing and Control, vol. 49, pp. 14–23, 2019. [Google Scholar]
4. F. Dehnavi, S. Moghimi, S. S. Haghighi, M. Safaie and M. Ghorbani, “Opposite effect of motivated forgetting on sleep spindles during stage 2 and slow wave sleep,” Sleep, vol. 42, no. 7, pp. zsz085, 2019. [Google Scholar]
5. M. Sokolovsky, F. Guerrero, S. Paisarnsrisomsuk, C. Ruiz and S. A. Alvarez, “Deep learning for automated feature discovery and classification of sleep stages,” IEEE/ACM Transactions on Computational Biology and Bioinformatics, vol. 17, no. 6, pp. 1835–1845, 2020. [Google Scholar]
6. M. M. Rahman, M. I. H. Bhuiyan and A. R. Hassan, “Sleep stage classification using single-channel EOG,” Computers in Biology and Medicine, vol. 102, pp. 211–220, 2018. [Google Scholar]
7. H. Ghimatgar, K. Kazemi, M. S. Helfroush and A. Aarabi, “An automatic single-channel EEG-based sleep stage scoring method based on hidden markov model,” Journal of Neuroscience Methods, vol. 324, pp. 108320, 2019. [Google Scholar]
8. E. Khalili and B. M. Asl, “Automatic sleep stage classification using temporal convolutional neural network and new data augmentation technique from raw single-channel EEG,” Computer Methods and Programs in Biomedicine, vol. 204, pp. 106063, 2021. [Google Scholar]
9. P. An, Z. Yuan and J. Zhao, “Unsupervised multi-subepoch feature learning and hierarchical classification for EEG-based sleep staging,” Expert Systems with Applications, vol. 186, pp. 115759, 2021. [Google Scholar]
10. E. Eldele, M. Ragab, Z. Chen, M. Wu, C. K. Kwoh et al., “ADAST: Attentive cross-domain EEG-based sleep staging framework with iterative self-training,” arXiv preprint arXiv:2107.04470, 2021. [Google Scholar]
11. S. F. Abbasi, J. Ahmad, A. Tahir, M. Awais, C. Chen et al., “EEG-Based neonatal sleep-wake classification using multilayer perceptron neural network,” IEEE Access, vol. 8, pp. 183025–183034, 2020. [Google Scholar]
12. P. An, Z. Yuan, J. Zhao, X. Jiang and B. Du, “An effective multi-model fusion method for EEG-based sleep stage classification,” Knowledge-Based Systems, vol. 219, pp. 106890, 2021. [Google Scholar]
13. P. An, Z. Yuan, J. Zhao, X. Jiang, Z. Wang et al., “Multi-subband and multi-subepoch time series feature learning for EEG-based sleep stage classification,” in 2021 IEEE Int. Joint Conf. on Biometrics (IJCB), Shenzhen, China, pp. 1–8, 2021. [Google Scholar]
14. V. Gurrala, P. Yarlagadda and P. Koppireddi, “A novel single channel EEG-based sleep stage classification using SVM,” International Journal of Biomedical Engineering and Technology, vol. 36, no. 2, pp. 119, 2021. [Google Scholar]
15. R. Ramani, K. V. Devi and K. R. Soundar, “MapReduce-Based big data framework using modified artificial neural network classifier for diabetic chronic disease prediction,” Soft Computing, vol. 24, no. 21, pp. 16335–16345, 2020. [Google Scholar]
16. K. N. Rao, K. V. Rao and P. V. G. D. P. Reddy, “A hybrid intrusion detection system based on sparse autoencoder and deep neural network,” Computer Communications, vol. 180, pp. 77–88, 2021. [Google Scholar]
17. B. Abraham and M. S. Nair, “Computer-aided classification of prostate cancer grade groups from MRI images using texture features and stacked sparse autoencoder,” Computerized Medical Imaging and Graphics, vol. 69, pp. 60–68, 2018. [Google Scholar]
18. J. Pierezan, G. Maidl, E. M. Yamao, L. D. S. Coelho and V. C. Mariani, “Cultural coyote optimization algorithm applied to a heavy duty gas turbine operation,” Energy Conversion and Management, vol. 199, pp. 111932, 2019. [Google Scholar]
 | This work is licensed under a Creative Commons Attribution 4.0 International License, which permits unrestricted use, distribution, and reproduction in any medium, provided the original work is properly cited. |