DOI:10.32604/csse.2023.026260
| Computer Systems Science & Engineering DOI:10.32604/csse.2023.026260 | |
| Article |
Haemoglobin Measurement from Eye Anterior Ciliary Arteries through Borescope Camera
1Department of Electronics and Communication Engineering, Vel Tech Multi Tech Dr Rangarajan Dr Sakunthala Engineering College, Chennai, 600062, India
2Department of Electronics and Communication Engineering, R.M.D Engineering College, Chennai, 601206, India
3Department of Computer Science and Engineering, Aalim Muhammed Salegh College of Engineering, Chennai, 600055, India
*Corresponding Author: Mohamed Abbas Ahamed Farook. Email: abbas_nice786@yahoo.co.in
Received: 20 December 2021; Accepted: 02 March 2022
Abstract: Nowadays, smartphones are used as self-health monitoring devices for humans. Self-health monitoring devices help clinicians with big data for accurate diagnosis and guidance for treatment through repetitive measurement. Repetitive measurement of haemoglobin requires for pregnant women, pediatric, pulmonary hypertension and obstetric patients. Noninvasive haemoglobin measurement through conjunctiva leads to inaccurate measurement. The inaccuracy is due to a decrease in the density of goblet cells and acinar units in Meibomian glands in the human eye as age increases. Furthermore, conjunctivitis is a disease in the eye due to inflammation or infection at the conjunctiva. Conjunctivitis is in the form of lines in the eyelid and covers the white part of the eyeball. Moreover, small blood vessels in eye regions of conjunctiva inflammations are not visible to the human eye or standard camera. This paper proposes smartphone-based haemoglobin (SBH) measurement through a borescope camera from anterior ciliary arteries of the eye for the above problem. The proposed SBH method acquires images from the anterior ciliary arteries region of the eye through a smartphone attached with a high megapixel borescope camera. The anterior ciliary arteries are projected through transverse dyadic wavelet transform (TDyWT) and applied with delta segmentation to obtain blood cells from the ciliary arteries of the eye. Furthermore, the Gaussian regression algorithm measures haemoglobin (Hb) with more accuracy based on the person, eye arteries, red pixel statistical parameters obtained from the left and right eye, age, and weight. Furthermore, the experimental result of the proposed SBH method has an accuracy of 96% in haemoglobin measurement.
Keywords: Hemoglobin measurement; borescope camera; smartphone; anterior ciliary arteries region
Fifty percent of women of reproductive age are affected by anaemia, and continuous monitoring of haemoglobin (Hb) becomes a global priority [1]. Haemoglobin is due to red cells in human blood. Insufficiency of red cells in the blood leads to anaemia. Anaemia causes because of any reason such as low production or fast destruction in red blood cells, iron and vitamin deficiency. The vitamins are B12, vitamin folate, a parasitic infection. Anaemia is measured through haemoglobin in the blood through a haematology analyzer. Analyzer measures haemoglobin in serum from the human body collected via piercing. The continuous piercing in the human body causes infection, blood poisoning, nerve pain and permanent pain, rashes, swelling, and in severe cases, difficulty breathing. The measurement of haemoglobin classifies as a clinical method and a noninvasive method. In the clinical method, a haemoglobin test was performed by adding distilled water in the blood of measured volume and compared to the artificial colour standard [2]. The following clinical method performs with saturated blood with coal gas to change haemoglobin in a stable state of carboxyhemoglobin [3]. The noninvasive method implies spectrophotometry and the haemoglobin cyanide (cynamethemoglobin) method. In recent years, the development of Point-of-Care Testing has been considered for haemoglobin measurement.Moreover, the haemoglobin cyanide (HiCN) method performs with the dilution of blood via potassium ferricyanide and potassium cyanide. The potassium ferricyanide oxidizes haemoglobin as methemoglobin due to iron in blood as a ferric state. The methemoglobin converts to haemoglobin cyanide through potassium cyanide. HiCN is exposed to a spectrophotometric method for the measurement of haemoglobin. However, the haemoglobin cyanide method has disadvantages such as requiring accurate pipetting and spectrophotometer, hazardous reagent-cyanide, photometer signal inferences due to raised lipids, leucocyte numbers and plasma proteins. Moreover, Sodium Lauryl Sulphate (SLS) method is an alternative to HiCN due to being cyanide free. SLS method consists of surfactant of lyses erythrocytes forms complex due to haemoglobin, and after few hours, the characteristic spectrum of absorption of the complex is about 539 nm. The complex obeys Beer- Lambert’s Law in a linear correlation between red cells concentration and absorption. SLS method calibrates with a haemoglobin concentration of blood concerning the HiCN method. Azide-methemoglobin performs better than HiCN due to toxic potassium cyanide being replaced with sodium azide [3]. However, sodium azide is an explosive method. The above method measures the concentration of blood inside the laboratory. Point-of-care instruments use various sensors such as a spectrophotometer, NIR, IR in finger clips for haemoglobin measurement. Finger clips measurements lead to variations in Hb values due to thickness and colour of finger skin. Inaccurate measurements arise due to vasoconstriction and pressure in the capillary region of the human finger. The Hb measurement from the finger is inaccurate due to inter-reflections, wavelength accuracy, photometric polarization, finger angle and tilt, multireflection due to the bone, tissue, skin, capillary and obliquity effects.Moreover, Hb measurement from Palpebral Conjunctiva leads to inaccurate measurement of Hb due to variations in density of goblet cells and acinar units in Meibomian glands in the human eye as age increases and influences the conjunctiva region of the eye. Furthermore, conjunctivitis is a disease of inflammation or infection at the conjunctiva. Conjunctivitis is in the form of lines in the eyelid and covers the white part of the eyeball. Moreover, small blood vessels in eye regions of conjunctiva inflammations are not visible to the human eye or standard camera. High levels of conjunctivitis lead to the white of the eye region appearing reddish or pink.
Noninvasive haemoglobin measurements from various regions such as finger [4], palmar region of hand, and Bulbar or palpebral conjunctiva region [5] have less accuracy in haemoglobin measurement due to various reasons than haemoglobin serum. Noninvasive measurement of haemoglobin from finger and palmar region of hand accuracy measurement affect due to tissue interference in skin region and skin colour [6]. Furthermore, error due to capillary and venous haematological value leads to inaccurate haemoglobin measurement. Moreover, a smoking person’s skin surfaces consist of carboxyhaemoglobin, leading to error in haemoglobin measurement due to frequency change in hand and finger vibration [7]. However, haemoglobin measurement from the conjunctive area of the eye, such as the Bulbar or palpebral conjunctiva region, leads to inaccurate measurement due to Meibomian Glands, which changes according to human age [8]. Moreover, measurement during conjunctiva diseases eyes such as dry eye, conjunctivochalasis, gross tissue irregularities or abnormalities and Sjogren syndrome leads errors and such diseases increases with age. Age-related changes in conjunctiva confirm through laser scanning confocal microscopy imaging and imaging analysis prove the decrease in goblet cells’ densities in palpebral conjunctiva and acinar units in meibomian glands affect haemoglobin measurement from conjunctiva regions.
In this paper, the above problems are overcome by measuring haemoglobin from anterior ciliary arteries of the eye, above the Bulbar and palpebral conjunctiva regions. In the human body, measurement of various parameters such as heart rate and oxygen saturation (Spo2) through various sensors such as optical Light Emitting Diode (LED) and Light Amplification by Stimulated Emission of Radiation (LASER) obtains the values from blood flow in arteries. The radiation from the sensor such as LED [9], LASER reflects from blood in finger arteries after passing through skin regions for measurement of heart rate, Spo2 and haemoglobin [10]. However, the proposed SBH method measures haemoglobin from the arteries of the eye, which avoids errors due to direct measurement from arteries, with no layers such as skin and muscles.
i) The proposed SBH method increases accuracy in measuring haemoglobin due to direct measurement from arteries of the eye because arteries (in red) are the blood vessels that deliver blood to the body.
ii) The proposed SBH method uses a borescope camera to magnify the artery region in the eye and avoids errors related to an artefact such as eyeball movement such as nystagmus, vergence, saccade, pursuit, miniature during image acquisition.
iii) The proposed SBH method improves the accuracy due to the perspective projection of arteries in the eye, which varies the size of the artery inversely proportional with distance and provides the accurate image of eye arteries through TDyWT transform and Delta-E segmentation for identifying anterior ciliary artery colour.
In this paper, a borescope camera is used to acquire arteries image from the eyeball region for haemoglobin measurement because the camera has a higher degree of field of view, such as 120 degrees and brighter light, compared with an endoscope camera. Brighter light in borescope camera avoids ambient noises in eye image during acquisition. Brighter light in the borescope camera increases the distance between eye and camera during image acquisition. A higher field of view leads to a maximum area of regions in an image. This paper uses a borescope camera Model No AN98B (High Definition: 1280 x 720) for eye artery image acquisition. Borescope camera consists of six white LED lights, 5 cm to infinite of the focal distance with LED and photo control switch. Fig. 1 shows the proposed SBH methodology of haemoglobin measurement.
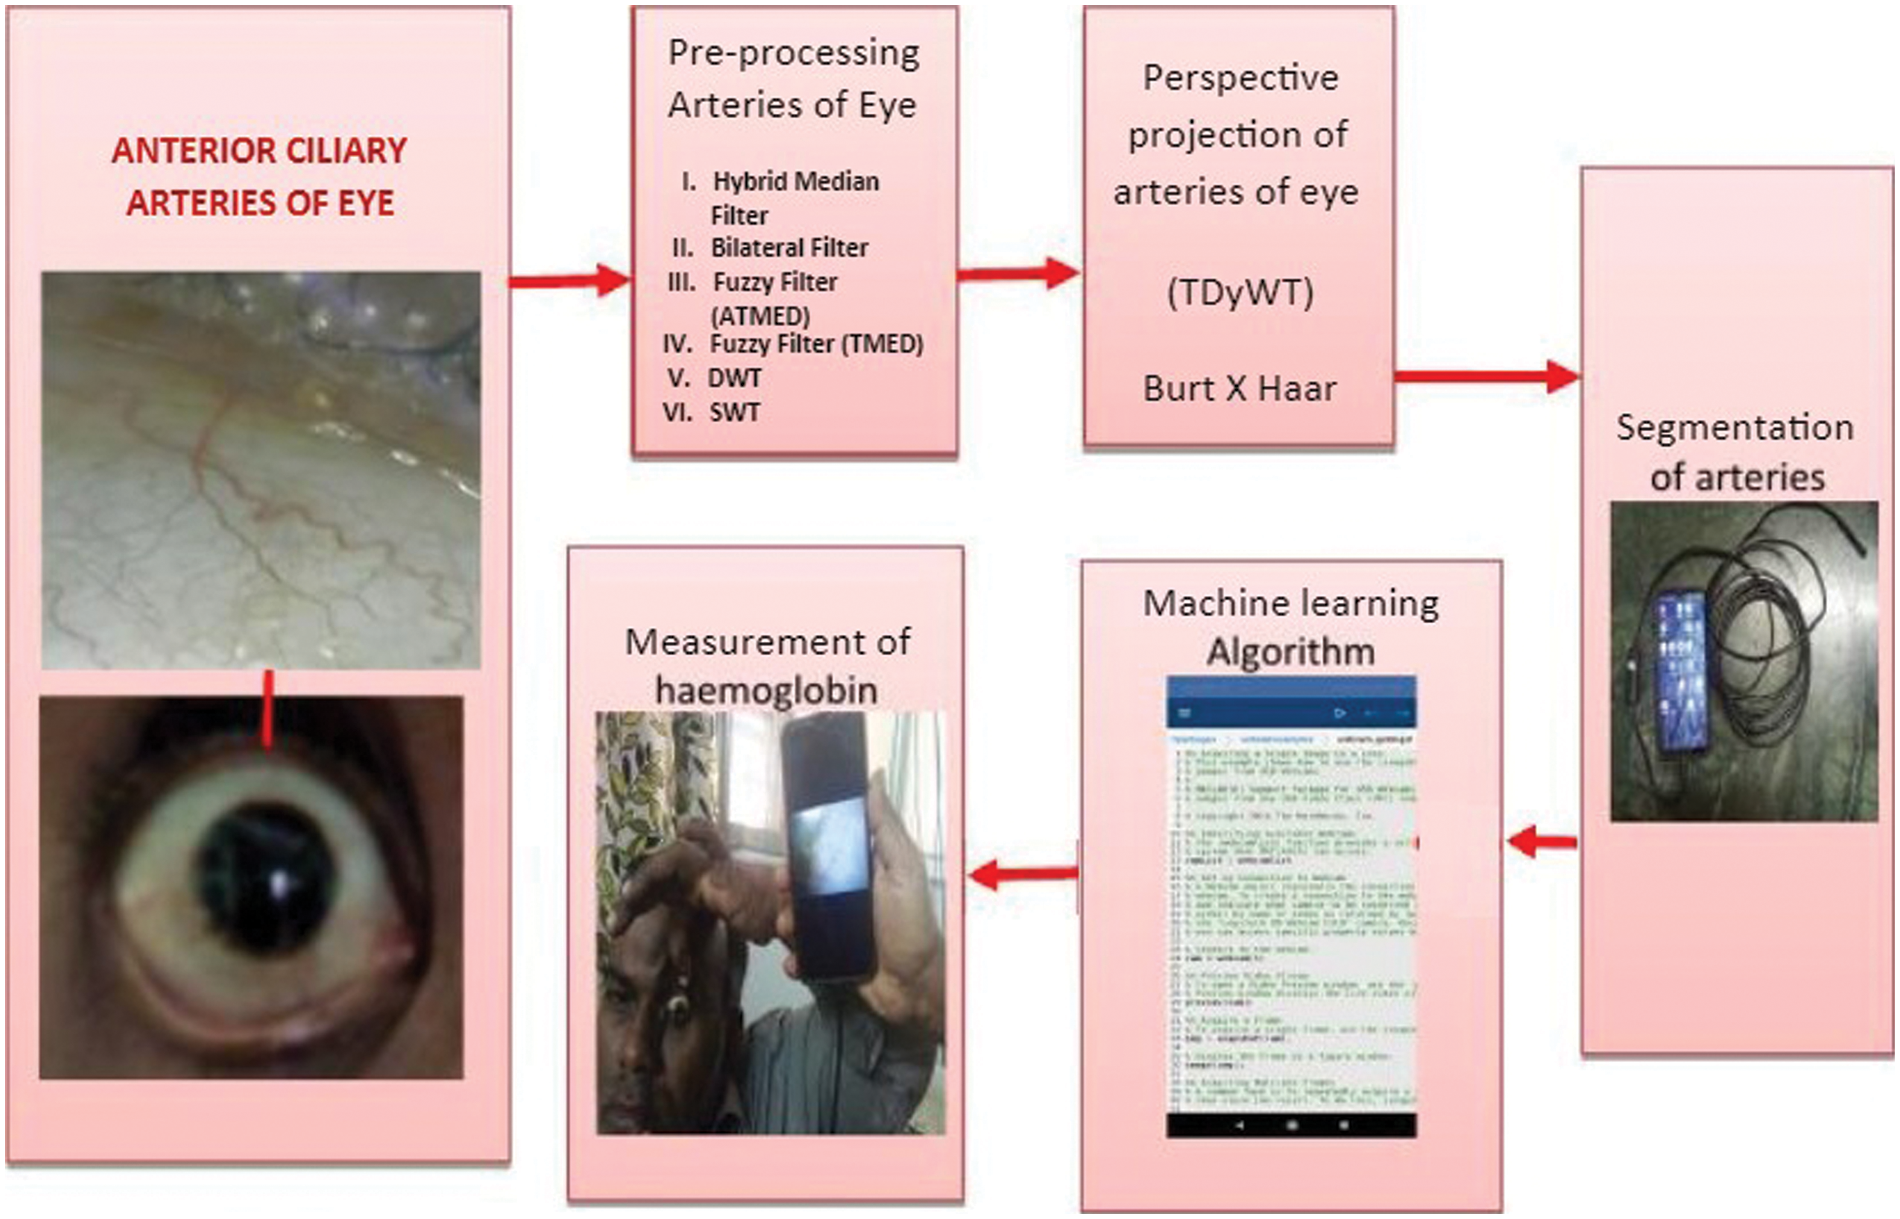
Figure 1: Hemoglobin measurement from anterior ciliary arteries of the eye through smartphone and borescope camera-SBH
2.1 Denoising Reflection in Anterior Ciliary Arteries Eye Image
In the human eye, anterior ciliary arteries consist of 7 small arteries in each eye socket and supply blood to eye regions such as the conjunctiva, sclera and rectus muscles. Ciliary arteries are the branches of the ophthalmic artery. In the human eye, the anterior ciliary arteries are in the front side of the eyeball and extraocular muscles. They form a vascular zone beneath the conjunctiva and then pierce the sclera a short distance from the cornea and end in the circulus arteriosus major. Three of the four rectus muscles, the superior, inferior, and medial, are supplied by two ciliary arteries, while the lateral rectus only receives one branch. Ciliary arteries over the sclera region consist of noise during image acquisition due to reflections, luminosity, contrast [11], eyeball rotation and Intraocular pressure. Among the above noises relative to reflections, luminosity and contrast variations in image occur due to distance between borescope and eye, long camera exposure during image acquisition, and need to be reduced. For noise reduction, various filters are applied, such as hybrid median filter, bilateral filter, and fuzzy filter.
2.2 Hybrid Median and Fuzzy Filters to Reduce Contrast and Brightness
A hybrid median filter reduces contrast and improves edges and features compared to a median filter. Furthermore, the hybrid median filter maintains a difference in brightness in contrast to the median filter. The non-linear hybrid mean filter does not smooth the image excessively and reduces less noise in the image. The hybrid median filter of the anterior ciliary artery image is shown in Fig. 2. Moreover, a bilateral filter enhances the edges during noise removal and smoothen the image. The bilateral filter shows colour blurriness reduction in the eye artery region, as shown in Fig. 2. A bilateral filter has certain drawbacks, such as reducing reflective noise or mixed noise removal and never sharpening the images. Next, fuzzy filters are applied to artery eye images. Fuzzy filtering such as triangular fuzzy filter with moving average centre (TMAV), asymmetrical triangular fuzzy filter with moving average centre (ATMAV), fuzzy filter with symmetrical triangular with median centre (TMED) and fuzzy filter with asymmetrical triangular with median centre (ATMED) are applied to artery eye images for removing noises. The fuzzy filters such as TMAV, ATMAV, TMED and ATMED employ a weighted function and calculate centre pixel in anterior ciliary artery image inside a window. These fuzzy filters suppress noises at various levels. The filtering performance of fuzzy filters like TMED, ATMED, TMAV and ATMAV increases for the noise of higher level for images acquired in an ambient environment. Wavelet denoising is applied for noise reduction in anterior ciliary artery image, as shown in Fig. 2.
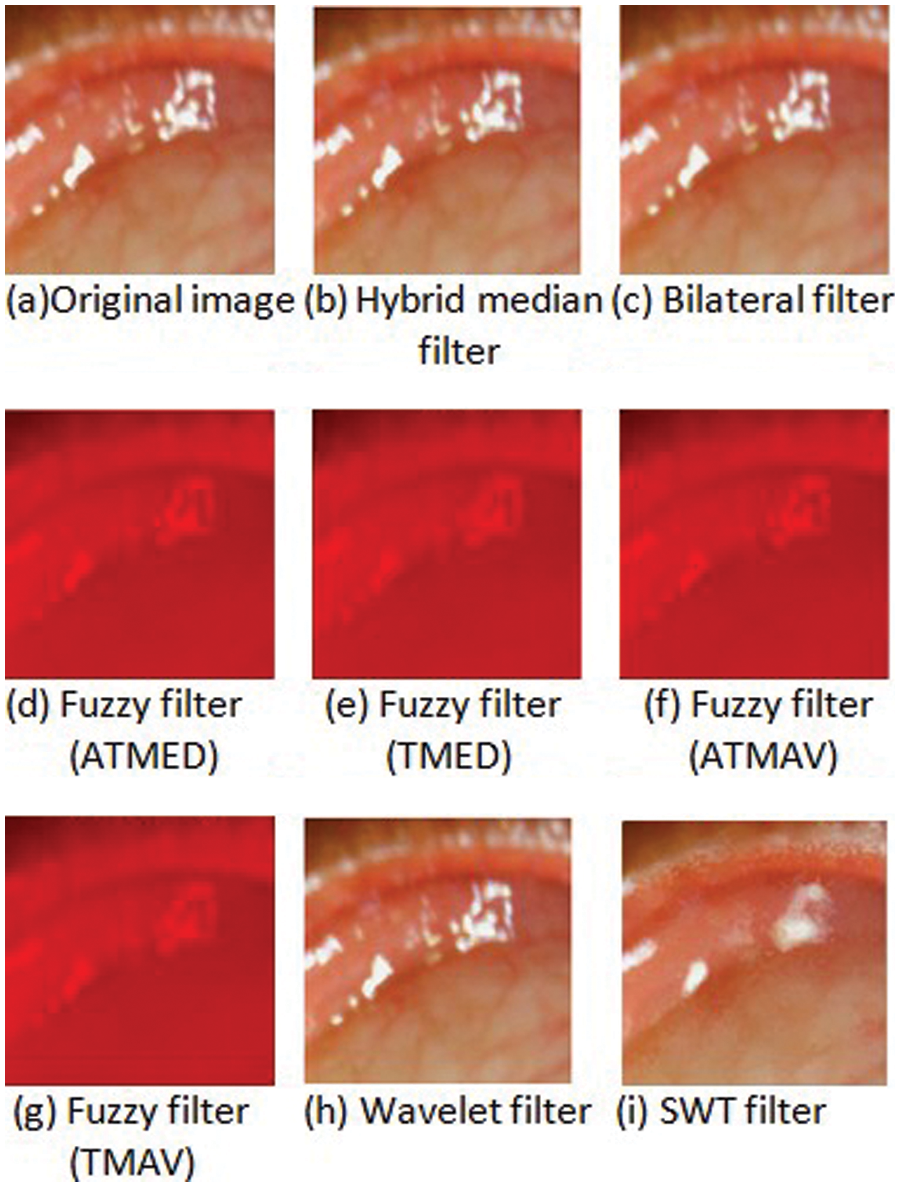
Figure 2: Filtering anterior ciliary artery region to reduce relative reflections and luminosity
2.3 DWT and SWT Denoising For Luminosity and Contrast Reduction
Discrete Wavelet Transform (DWT) remove noises due to luminosity, contrast and reflections in anterior ciliary artery image [12]. Discrete Wavelet transforms an image into multiple images based on the space-frequency input image. For removing noise in an image, thresholding and statistical modelling are applied. Denoising in Discrete Wavelet transforms wavelet coefficients into the spatial domain as fixed basis dictionaries to entire images. Discrete Wavelet-based denoising in anterior ciliary artery image uses soft and hard-thresholding. From the denoised anterior ciliary artery image after soft threshold consists of noisy wavelet coefficients, and images have reflection noise, and whereas hard threshold leads to wavelet coefficients to zero, resultant anterior ciliary artery image is smooth with blur and artefacts. DWT based denoising ciliary image has quantitative results, never in qualitative, and artefacts present in filter image due to decimation process and filter images are shown in Fig. 2.
To improve qualitative results in anterior ciliary artery image, non-decimated Wavelet transforms such as Stationary Wavelet is applied. Stationary wavelet transform (SWT) is an undecimated wavelet transform never performs coefficient decimation at each level of transformation. SWT has a redundancy property, where wavelet coefficients possess equal samples similar to the input image. The 2N redundancy requires N level decomposition; N represents decomposition level. Furthermore, SWT avoids downsampling during decomposition. Thresholding techniques in stationary wavelet transform perform on a single wavelet coefficient at a particular time. Each wavelet coefficient lesser than the threshold value, can be set as zero or further changed.
The noise predominates wavelet coefficients with a value less than a threshold value; wavelet coefficients exceeding the threshold value have the image information than noise. The advantage of wavelet thresholding includes the automatic selection of threshold level for denoising process without a prior idea of image. In the proposed SBH method, hard thresholding is performed, which involves multiplication of wavelet coefficient value larger than threshold value with standard deviation value of noise. The hard thresholding method reduces the noise level to a great extent by thresholding wavelet coefficients. SWT possess a time-invariant property that suits image denoising of anterior ciliary artery image as shown in Fig. 2. Moreover, stationary wavelet transform has enhanced performance in denoising anterior ciliary artery image due to non-decimation and downsampling compared to existing discrete wavelet transform. The various filter images apply to Transverse dyadic transform for perspective projection.
2.4 TDyWT for Perspective Projection of Arteries
Filtered images of the anterior ciliary artery are applied to Dyadic Wavelet transform (DyWT) for perspective projection of arteries in the eye region. DyWT is similar to DWT; discrete wavelet transform does not possess shift-invariant property. DWT uses the downsampling method. Furthermore, during the convolution process of decomposition stage, the coefficients of the second Wavelet alone are considered for downsampling and hence the discrete Wavelet transform is said as decimated Wavelet transform. Due to the lack of shift-invariance property, DWT results in poor performance in enhancement and edge detection in the anterior ciliary artery region of the eye. Hence, for better results, dyadic wavelet transform is proposed in SBH method for perspective enhancement of arteries of the eye image. Dyadic wavelet transform, an undecimated discrete wavelet transform, comes under the redundant waveform category. Dyadic wavelet transform’s shift-invariant property improves sampling in the time domain. Moreover, the dyadic wavelet transform performs comparatively better than the DWT wavelet transform.DWT possess less compression and denoising performance. Dyadic wavelet transform is relatively flexible and attains symmetric and smoothened anterior ciliary artery region pixels. Furthermore, downsampling is avoided, dyadic Wavelet transforms suit for texture analysis. For the computation of dyadic wavelet transform of anterior ciliary artery region image, consider the decomposable image to be I and let p[k] and q[k] are the scaling and wavelet filters. Initially, for scale r = 0 and considering I0 = I, the Wavelet and scaling coefficients are computed as follows: For scales, r = 1, 2 … R, the Wavelet and scaling coefficients are given as:
Consider pj [k] and gj [k] are the two filters got by insertion of 2r–1 zeros to p [k] and q [k].Then the dyadic Wavelet transform using filtering can be performed in the following manner: initialize with I, for which the scale is considered zero, (i.e.,) I0 = I. To express the Wavelet and scaling coefficients Ir and Dr for scales r = 1, 2, . . ., R as filter Ir−1 with qr−1[k] and filter Ir−1 with pr−1[k]. Since dyadic wavelet transform does not involve downsampling, Ir and Dr represent the low pass (scaling) and high pass (Wavelet) sub-bands. Similarly, the 2D anterior ciliary artery region image decomposition using dyadic Wavelet transform computed along row-wise and column-wise. However, perspective projection of anterior ciliary artery regions needs Transverse Dyadic Wavelet transform (TDyWT).In transverse dyadic Wavelet, decomposition and reconstruction play a vital role in extracting an image or signal information. During the decomposition process, coefficients are in the 2D array; initially, rows are performed with symmetric periodic extensions. The decomposition process uses the bio-orthogonal filter for better reconstruction of the image. Symmetric periodic extension array is applied low and high passed filter and downsampled by two. By downsampling, odd samples are removed after convolution. A similar process, such as filtering and convolution, is applied in column and row arrays. Finally, the resultant arrays are low pass (L) and high pass (H) filtered array values and obtain four sub-bands such as, i.e., LL, LH, HL and HH after the stage of decomposition. In dyadic transform, Haar wavelet transform is applied for decomposition. Haar system on the line is orthonormal basis in L2(R). The Haar wavelet performs better for continuous real functions through linear combinations and shifted functions. Any continuous real function on [0,1] has been approximated uniformly on [0,1] through linear combinations of the constant function 1, {01} and their shifted functions. Wavelet scaling function with different scale and has a functional relationship. In transverse dyadic transform, Burt wavelet transform is applied on columns and rows during reconstruction anterior ciliary artery region image. Periodic symmetric extension applied to LL, LH, HL and HH sub-bands and obtains decomposed image. The resultant array such as LL, LH, HL and HH are applied with periodic extension and coefficients are padded with 0, and low pass and high pass filtering are applied. A similar process is iterated and applied on rows for obtaining a reconstructed image. After reconstruction with bi-orthogonal filters, the output anterior ciliary artery region image is obtained, and the image is perspective projected. In the Burt wavelet transform, the basis function performs through local operators with more scales, identical in shape. Burt wavelet differs from traditional methods through the localized spatial frequency and space. For enhancing the anterior ciliary artery region image, correlated pixel-to-pixel is eliminated through subtracting low pass filtered output image. The resultant enhanced anterior ciliary artery region image is with less sample density, low variance and entropy. The iterated process of correlated pixel eliminations leads to a pyramid data structure. The pixel is encoded with Laplacian operators in different scales and enhances the salient image features such as the anterior ciliary artery region in the eye images.
2.5 Haar Decompose and Burt 24x7 Reconstruct For Perspective Projection of Artery
Haar decomposition effectively enhances transient features and enhances the features in the entire spectrum without a dominant frequency band. Burt reconstruction has scale-frequency and translation time shift properties for a short and big window for low scales-high frequencies and high scales-low frequencies. In traditional, decomposition and reconstruction are performed with a single wavelet family. In proposed SBH method, transverse dyadic wavelet transform performs through individual pixels or the permutation of their grey levels. In transverse dyadic shifting performs through dyadic correlations and enhances the anterior ciliary artery region image without loss of information. In transverse dyads, the local extrema play a vital role in perspective projection and enhance the edges of the anterior ciliary artery region. Local extrema are the magnitude value and correspond to the edges of the anterior ciliary artery region in the image object for enhancement. In TDyWT, lower minor edges are enhanced at lower transform levels. When the input anterior ciliary artery region image is of N x M, decomposition of Wavelet is processed for Log2 (N) levels. A desired number of iterations is performed for perspective projections. TDyWT resultant anterior ciliary artery region image provides high resolution in time for high-frequency components and more excellent resolution in frequency for low-frequency components. Fig. 3 shows the anterior ciliary artery region Enhancement using TDyWT.
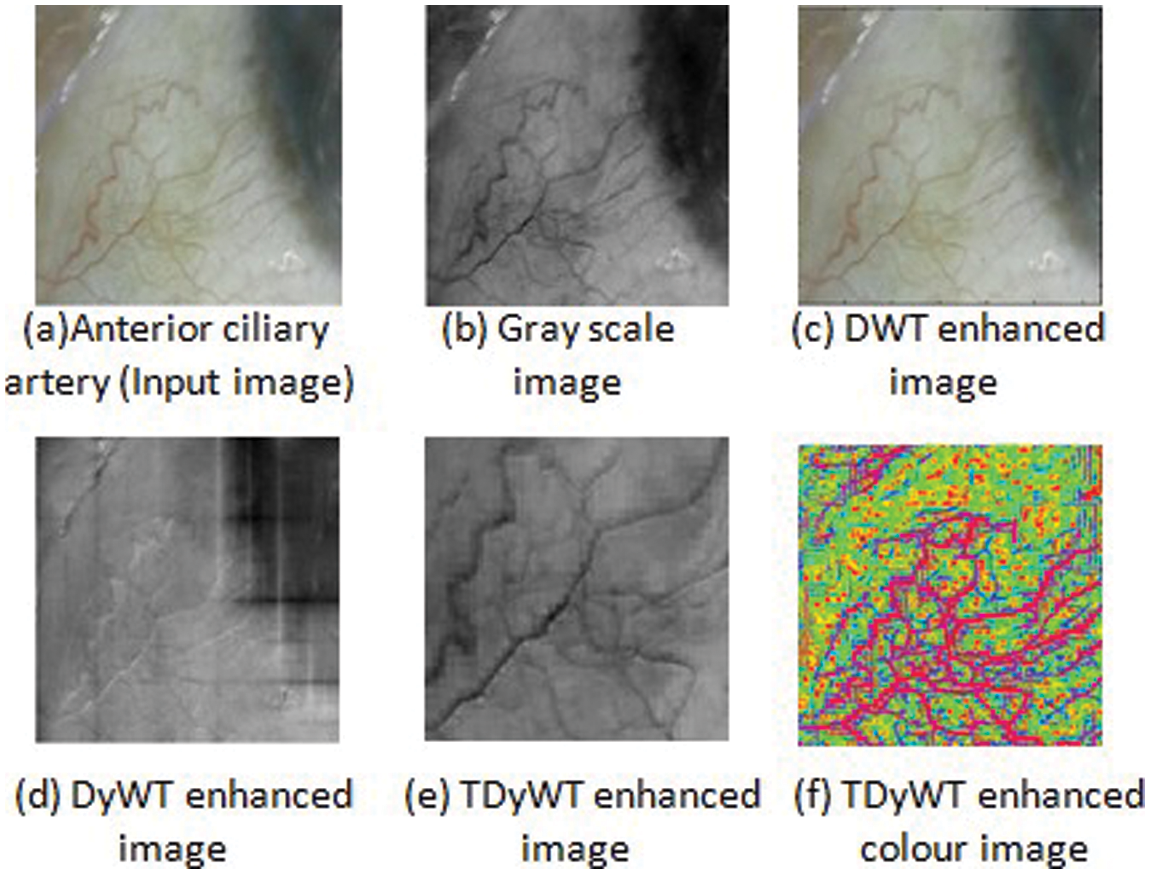
Figure 3: Anterior ciliary artery region enhancement using TDyWT
2.6 Delta E Segmentation for Extracting Perspective Projected Anterior Ciliary Artery
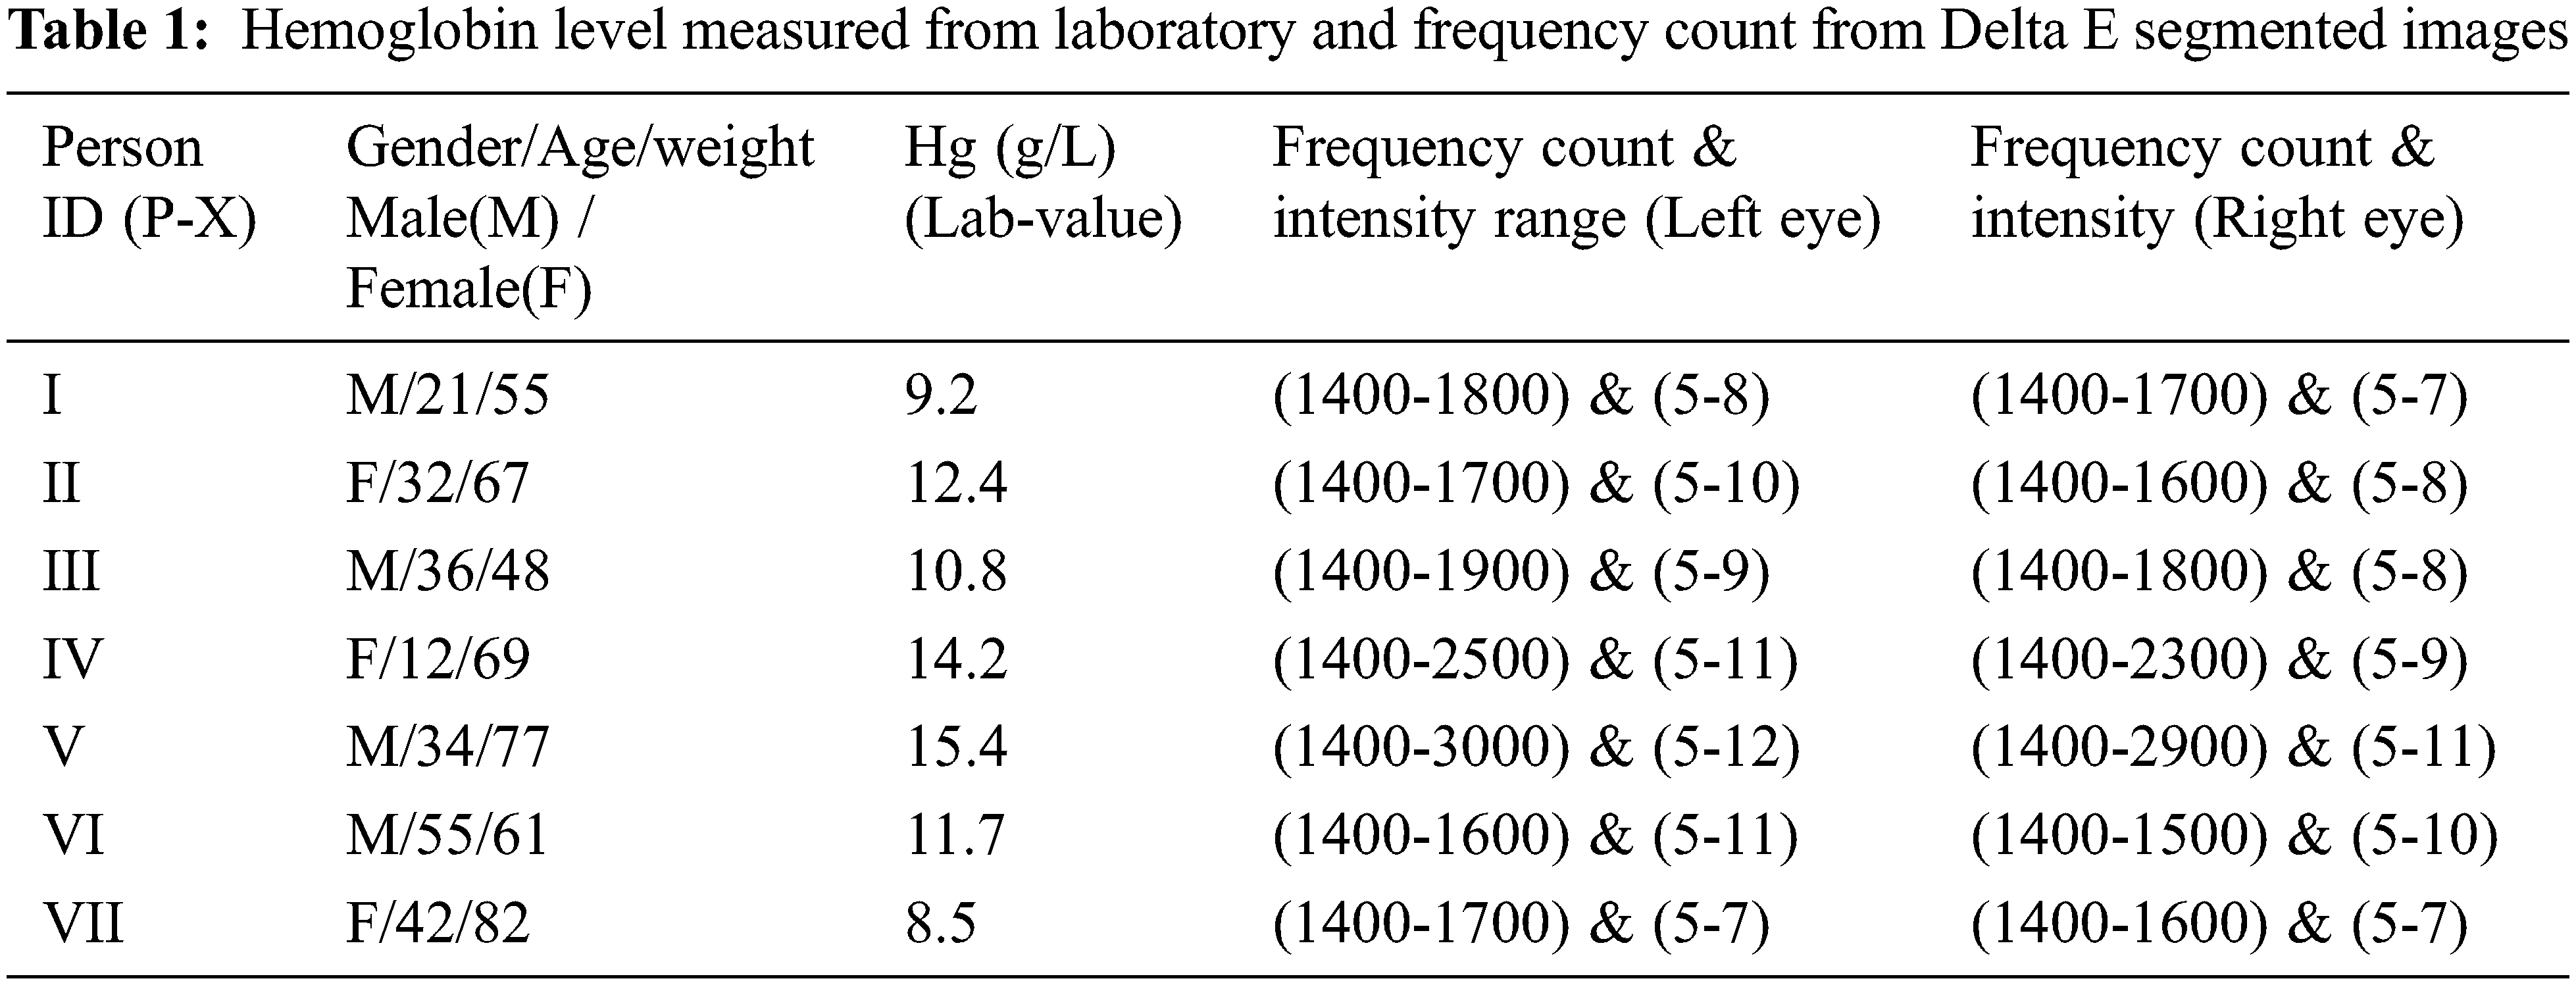
Delta Segmentation shows the colour difference between a selected anterior ciliary artery and sclera or conjunctiva of the eye region. Delta E segmented pixels have Delta L*, delta a* and Delta b* colour values. Delta L stands for lightness difference among the anterior ciliary artery and conjunctiva. Delta a* is the redness difference between the anterior ciliary artery and conjunctiva. Delta b* is the blueness-yellowness difference between the anterior ciliary artery and conjunctiva. Total colour difference (Delta E*) obtained from delta L*, a*, b* colour difference shows the distance of a line between anterior ciliary artery and conjunctiva. Delta E segmentation shows between two colour regions: ciliary artery and conjunctiva or sclera. The RGB image is converted to LAB colour space in delta segmentation of the ciliary artery. The user can select an irregular shaped region by freehand drawing to identify the colour of the anterior ciliary artery. To extract the original image’s anterior ciliary artery region colour bands, separate them into three 2D arrays or channels as shown in Fig. 4. Fig. 4 shows Delta E segmentation for extraction of anterior ciliary artery region. Figs. 4a–4c shows band channels of a, b and L, whereas (d) shows the Delta E image darker. Fig. 4e shows the mask of the matching colour of the anterior ciliary artery region, and (f) shows the matching colour of the anterior ciliary artery region. Fig. 4g shows the non-matching colour of the anterior ciliary artery region. Fig. 4h shows the histogram for the masked region of the anterior ciliary artery region. The histogram is used for measuring haemoglobin from the anterior ciliary artery region. The histogram analyses the anterior ciliary artery region through the frequency count and the intensity. Fig. 5 shows Delta E Segmentation with and without applying TDyWT on Anterior Ciliary Artery Region with measured haemoglobin values from the laboratory. From Fig. 5 frequency component of the anterior region of the ciliary artery shows higher and low-frequency components enhanced. Tab. 1 shows the haemoglobin level measured from the laboratory and frequency count from the Delta E segmented images.
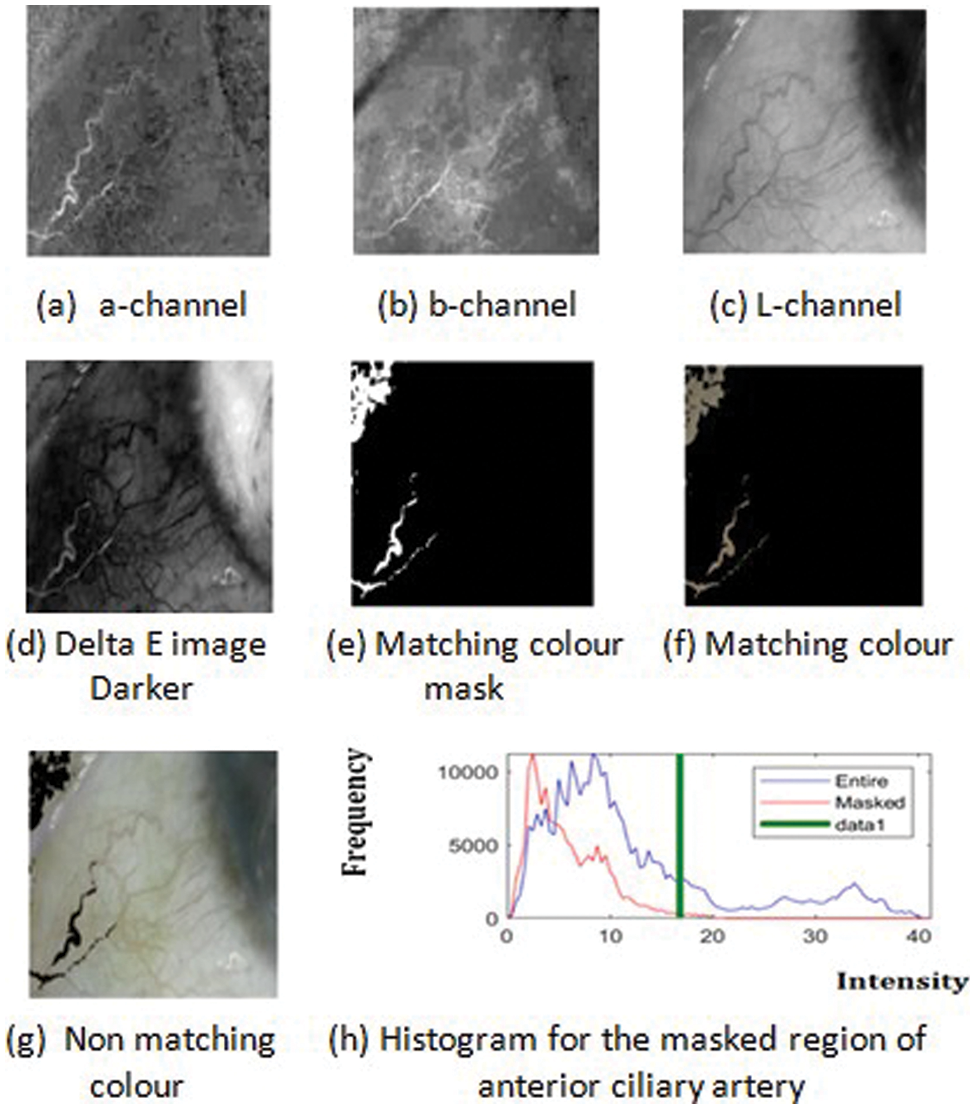
Figure 4: Delta E segmentation for extracting anterior ciliary artery region
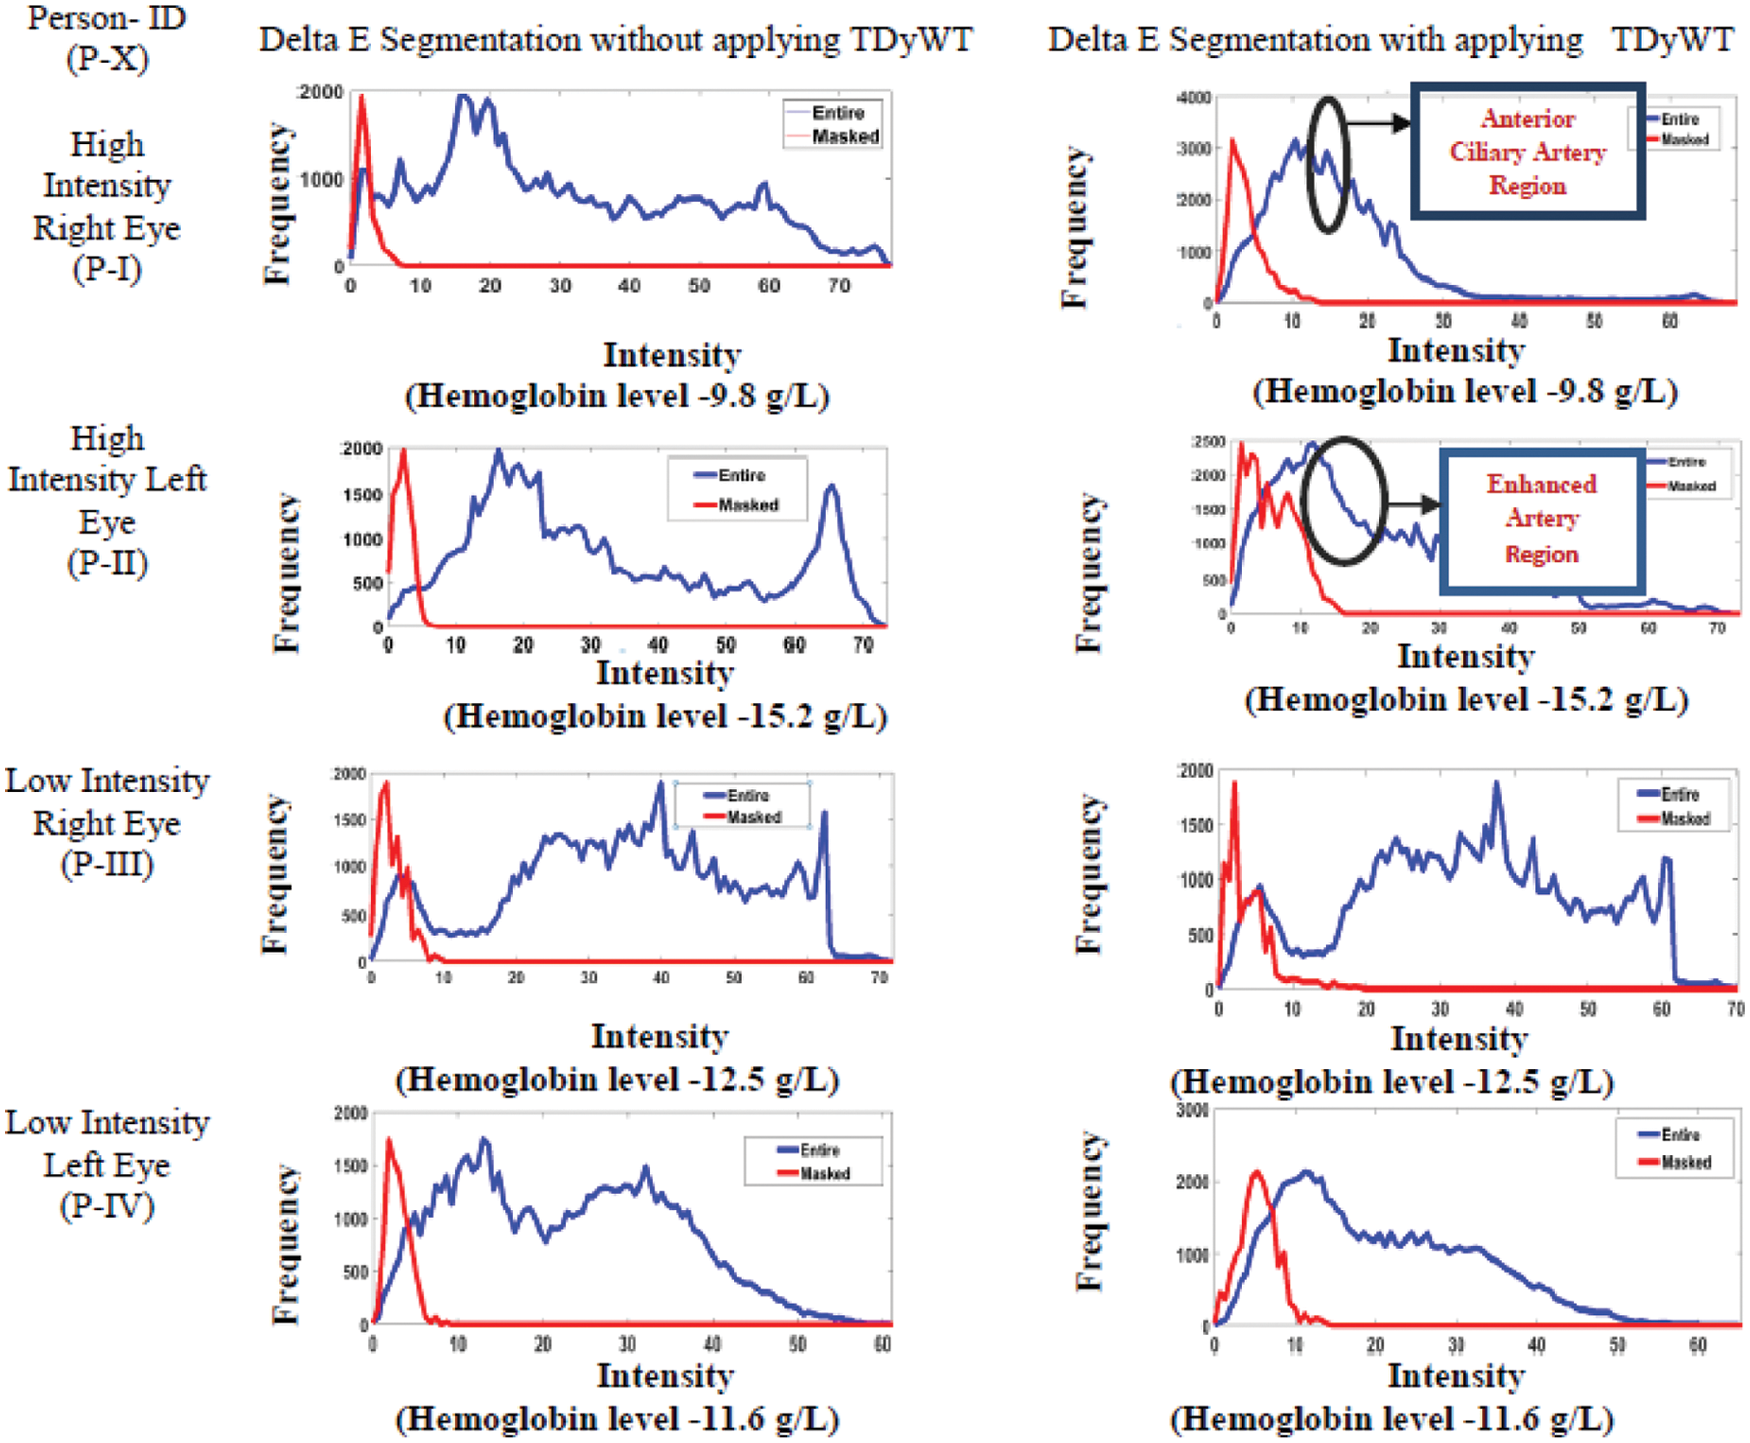
Figure 5: Delta E segmentation with and without applying TDyWT on anterior ciliary artery region
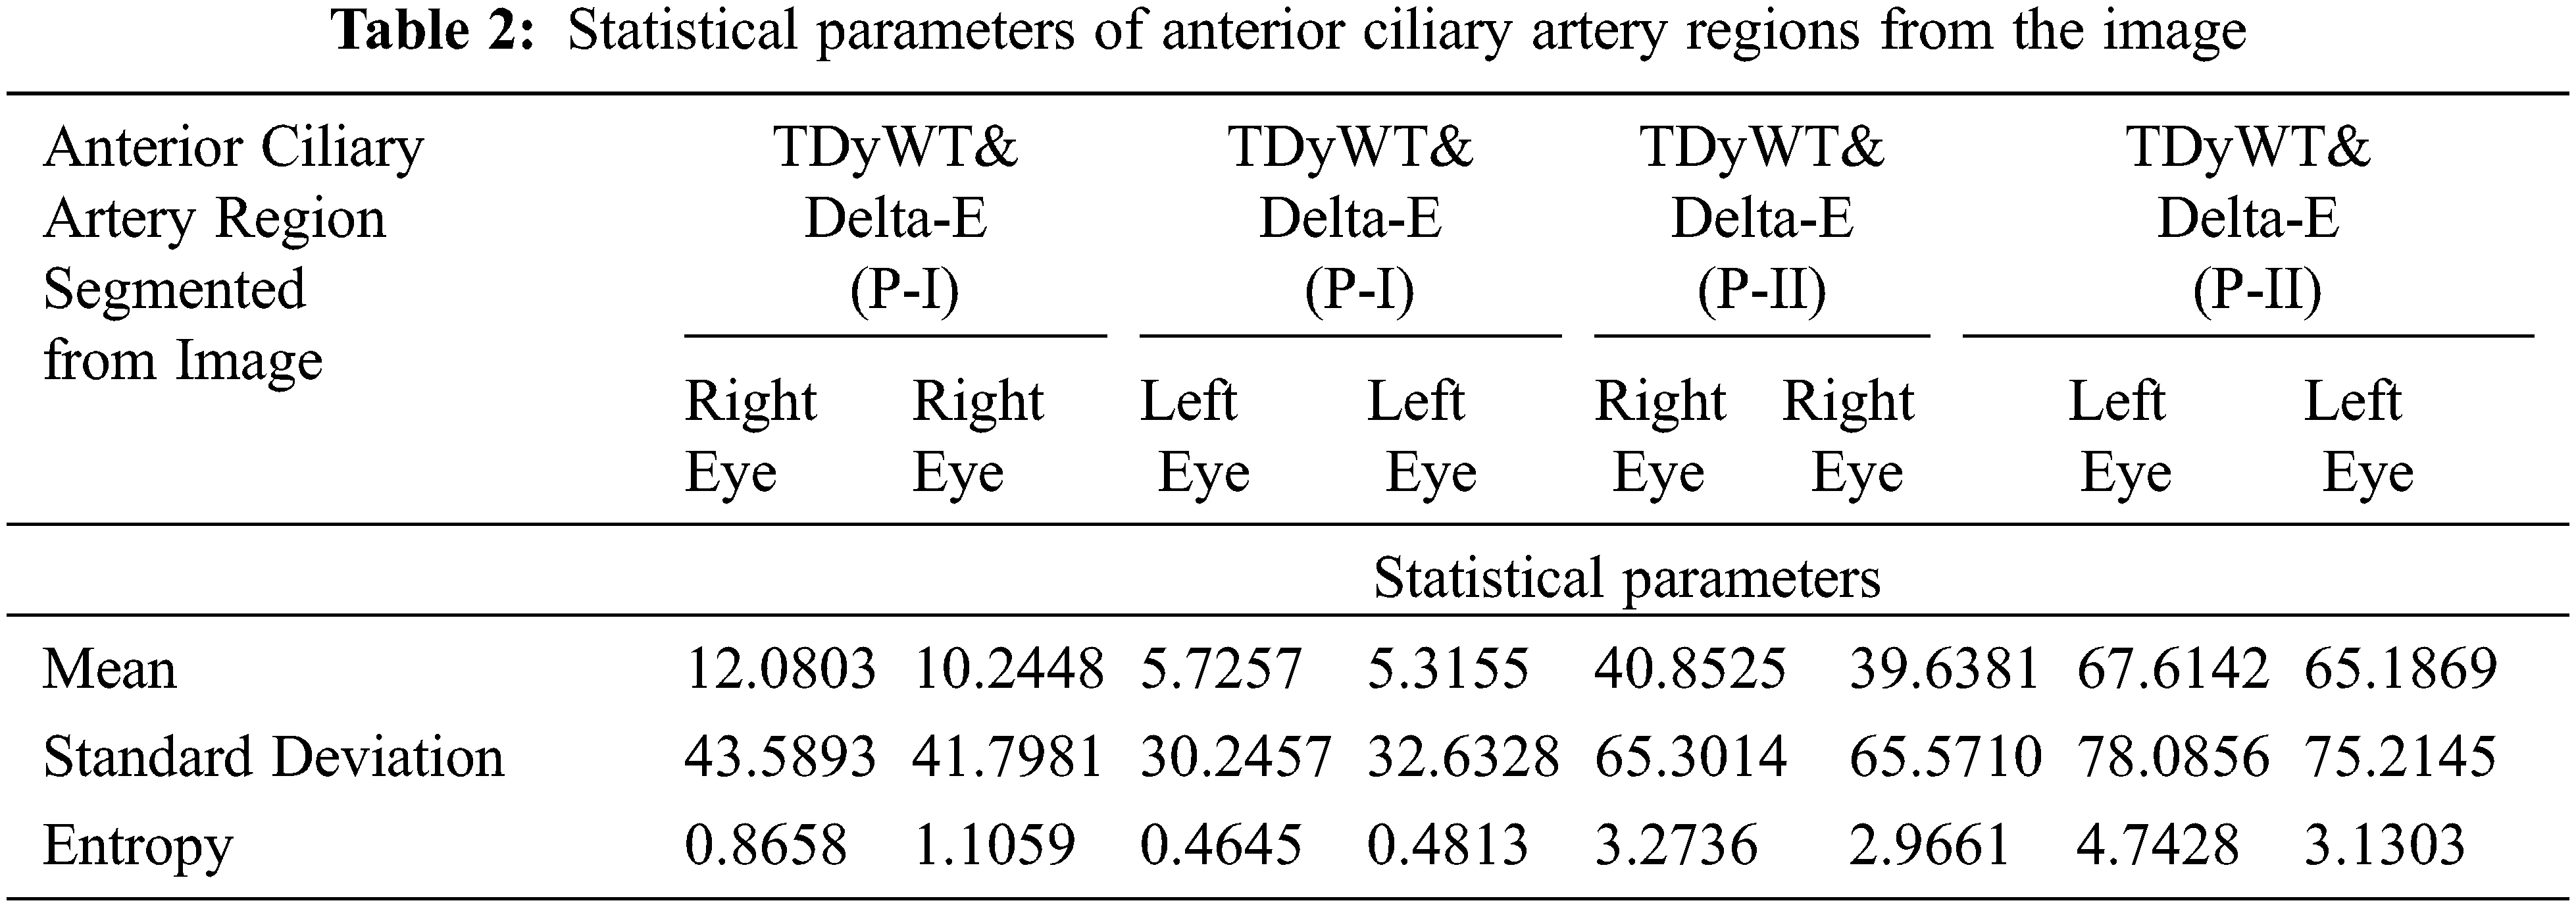
Each channel represents a colour component and calculates the average value of lab colour. The delta E image represents the colour difference. The difference in anterior ciliary artery region colour in LAB colour space (Delta E) is computed for each pixel in the image between that pixel’s colour and the average LAB colour of the anterior ciliary artery region drawn. The delta E is the square root of the sum of the squares of the delta anterior ciliary artery region images. The value of delta E in the mask anterior ciliary artery region gives the mean delta E value. Calculate the value of the standard deviation of the delta E. The proposed SBH method predicts the haemoglobin from the anterior ciliary artery region using average mean value and intensity count from the image and laboratory value through a Gaussian regression model. Tab. 2 shows the image’s mean and standard deviation value of anterior ciliary artery regions.
2.7 Measurement of Hemoglobin through Regression Modeling
Gaussian process regression (GPR) predicts haemoglobin through the mean value of the eye, intensity range, frequency count and laboratory value. GPR is non-parametric performs well for small datasets, and uncertainty prediction-based measurement is obtained. GPR is a tuned version of the Bayesian method. In linear function y = wx+ £, p (w) is the prior distribution on parameter w, and the Bayes rule is applied. The predictive posterior distribution for GPR is given by Eq. (3):
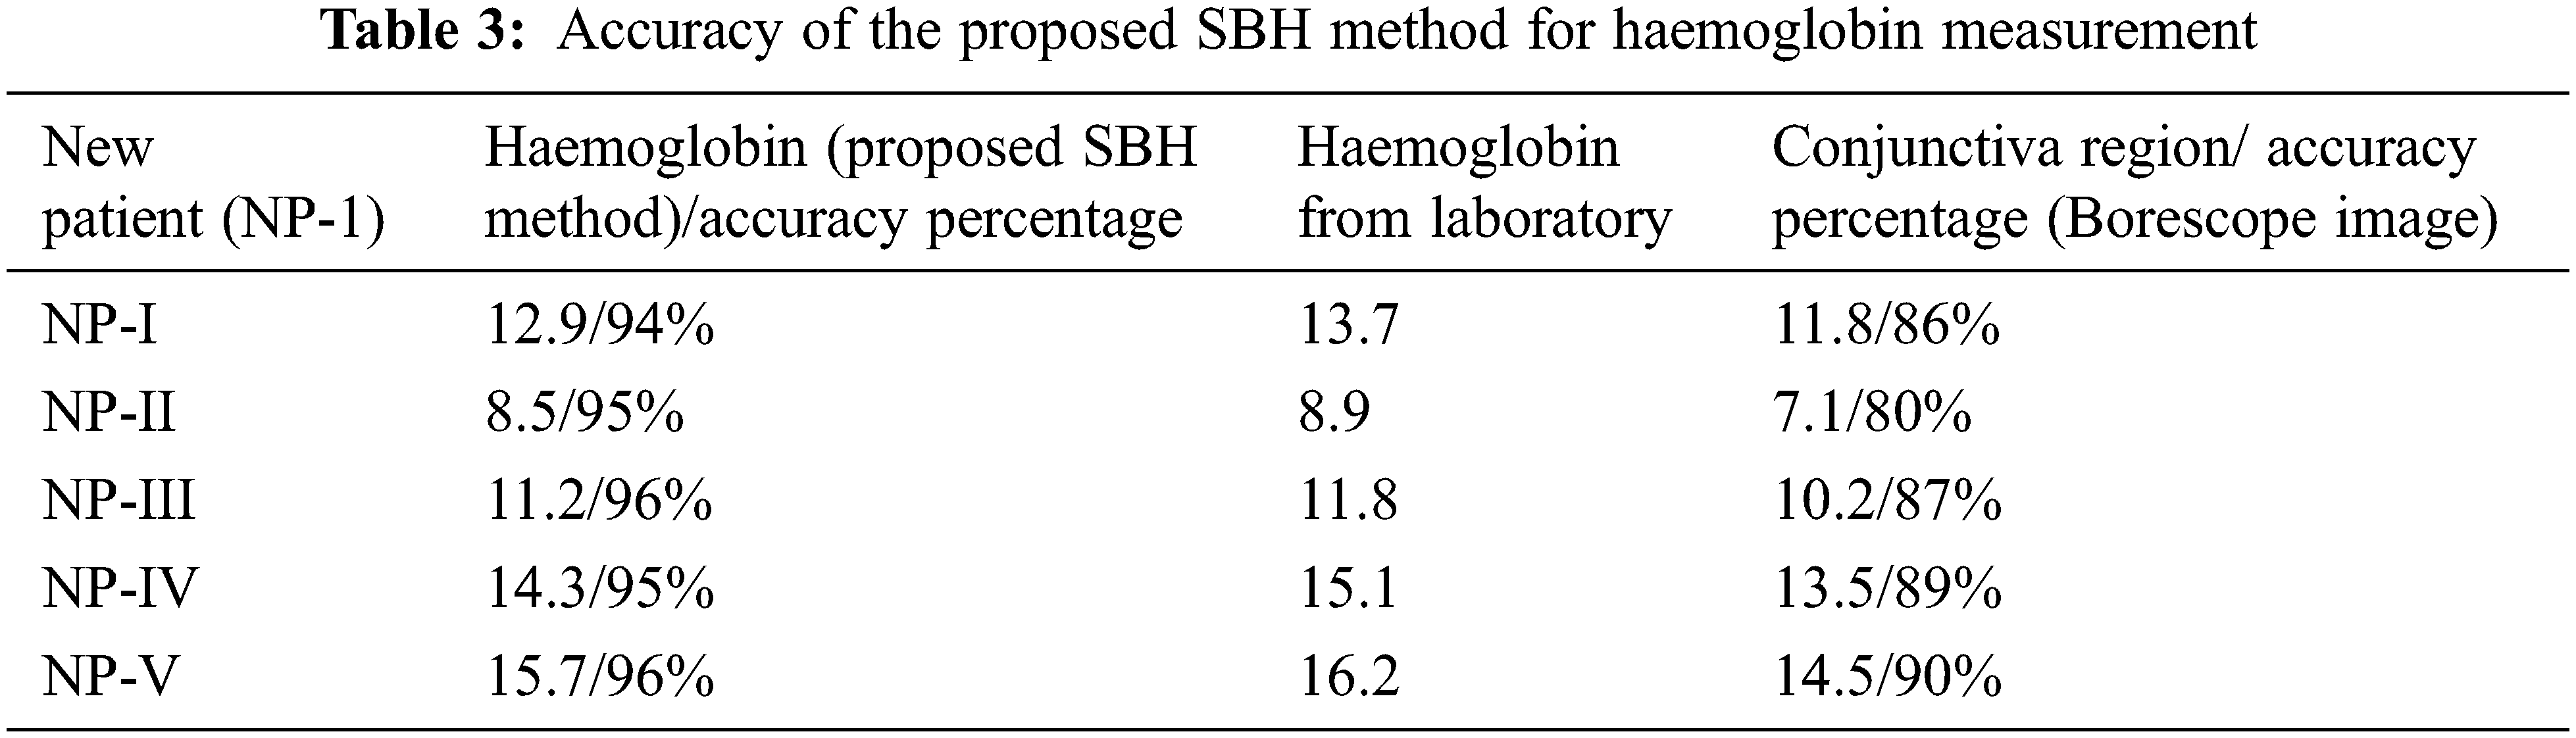
Tab. 3 shows the accuracy of the proposed SBH method for haemoglobin measurement for new patients, and the accuracy of prediction is shown in percentage.
Repetitive measurement of haemoglobin for pulmonary hypertension patients and pregnant women help clinicians for analyzing the swing in haemoglobin values. Repetitive measurement through invasive haemoglobin measurement leads to bacterial infections. For avoiding invasive measurement of haemoglobin, the noninvasive measurement through anterior ciliary arteries region pixels obtained from borescope camera attached smartphone is proposed. The proposed SBH method has more accuracy in haemoglobin measurement than the conjunctiva region due to measurement from red blood cells in the blood from ciliary arteries of the eye. The problem of a decrease in the density of goblet cells and acinar units in the conjunctiva region-based haemoglobin measurement leads to inaccuracy. The above problem-solve by measuring haemoglobin levels from ciliary arteries of left and right eye red blood cells. Red blood cells are initially projected in the anterior ciliary artery region and then delta segmented to extract only red blood cells. Perspective projection of the anterior ciliary artery region reduces the noise pixels from the sclera region of the eye.
Moreover, the frequency count and intensity values of red cells of the artery are considered for the haemoglobin measurement through the Gaussian regression method. The red blood cells average values from the image, frequency count and intensity values, age, and weight-based measurement leads to more accuracy in predicting the haemoglobin in human. Furthermore, anterior ciliary artery region-based Polycythemia Vera condition can be predicted, which causes a blood clot.
Funding Statement: The authors received no specific funding for this study.
Conflicts of Interest: The authors declare that they have no conflicts of interest to report regarding the present study.
1. E. McLean, M. Cogswell, I. Egli, D. Wojdyla and B. Benoist, “Worldwide prevalence of anaemia, WHO vitamin and mineral nutrition information system, 1993-2005,” Public Health Nutrition, vol. 12, no. 4, pp. 444–454, 2009. [Google Scholar]
2. W. R. Gowers, “An apparatus for the clinical estimation of haemoglobin,” Trans. Clin. Soc. Lond, vol. 12, pp. 64–67, 1879. [Google Scholar]
3. L. Berkow, “Factors affecting haemoglobin measurement,” Journal of Clinical Monitoring and Computing, vol. 27, no. 5, pp. 499–508, 2013. [Google Scholar]
4. M. R. Macknet, M. Allard, R. L. Applegate and J. Rook, “The accuracy of noninvasive and continuous total haemoglobin measurement by pulse CO-oximetry in human subjects undergoing hemodilution,” Anesthesia & Analgesia, vol. 111, no. 6, pp. 1424–1426, 2010. [Google Scholar]
5. S. Collings, O. Thompson, E. Hirst, L. Goossens, A. George et al., “Noninvasive detection of anaemia using digital photographs of the conjunctiva,” PLoS One, vol. 11, no. 4, pp. 1–10, 2016. [Google Scholar]
6. V. Kannagi and A. Jawahar, “Epidermal antenna in the palmar arch region for anaemia detection to avoid peripheral perfusion artefact in optical sensor during haemoglobin measurement,” Microsystem Technologies, vol. 26, no. 5, pp. 1427–1435, 2020. [Google Scholar]
7. B. Santra, D. P. Mukherjee and D. Chakrabarti, “A noninvasive approach for estimation of haemoglobin analyzing blood flow in the palm,” in IEEE 14th Int. Sym. on Biomedical Imaging (ISBI 2017), Melbourne, VIC, Australia, pp. 1100–1103, 2017. [Google Scholar]
8. F. Fan, X. Li, K. Li and Z. Jia, “To find out the relationship between levels of glycosylated haemoglobin with meibomian gland dysfunction in patients with type 2 diabetes,” Therapeutics and Clinical Risk Management, vol. 2021, no. 17, pp. 797–807. [Google Scholar]
9. R. S. Al-Baradie and A. S. C. Bose, “Portable smart noninvasive haemoglobin measurement system,” in 10th Int. Multi-Conf. on Systems, Signals & Devices 2013 (SSD13), Hammamet, Tunisia, pp. 18–21, 2013. [Google Scholar]
10. L. Berkow, S. Rotolo and E. Mirski, “Continuous noninvasive haemoglobin monitoring during complex spine surgery,” Anesthesia & Analgesia, vol. 113, no. 6, pp. 1396–1402, 2011. [Google Scholar]
11. V. Bevilacqua, G. Dimauro, F. Marino, A. Brunetti, F. Cassano et al., “A novel approach to evaluate blood parameters using computer vision techniques,” in IEEE Int. Sym. on Medical Measurements and Applications (MeMeA), Benevento, Italy, pp. 1–6, 2016. [Google Scholar]
12. H. Proenca and L. A. Alexandre, “UBIRIS: A noisy iris image database,” International Conference on Image Analysis and Processing, vol. 3617, pp. 970–977, 2005. [Google Scholar]
 | This work is licensed under a Creative Commons Attribution 4.0 International License, which permits unrestricted use, distribution, and reproduction in any medium, provided the original work is properly cited. |