DOI:10.32604/csse.2023.026119
| Computer Systems Science & Engineering DOI:10.32604/csse.2023.026119 | |
| Article |
Detection and Classification of Hemorrhages in Retinal Images
1College of Computer Science and Information Systems, Najran University, Najran, 61441, Saudi Arabia
2Department of Studies in Computer Science, University of Mysore, Mysore, India
*Corresponding Author: Thamer Mitib Ahmad Al Sariera. Email: th_670@yahoo.com
Received: 16 December 2021; Accepted: 02 March 2022
Abstract: Damage of the blood vessels in retina due to diabetes is called diabetic retinopathy (DR). Hemorrhages is the first clinically visible symptoms of DR. This paper presents a new technique to extract and classify the hemorrhages in fundus images. The normal objects such as blood vessels, fovea and optic disc inside retinal images are masked to distinguish them from hemorrhages. For masking blood vessels, thresholding that separates blood vessels and background intensity followed by a new filter to extract the border of vessels based on orientations of vessels are used. For masking optic disc, the image is divided into sub-images then the brightest window with maximum variance in intensity is selected. Then the candidate dark regions are extracted based on adaptive thresholding and top-hat morphological techniques. Features are extracted from each candidate region based on ophthalmologist selection such as color and size and pattern recognition techniques such as texture and wavelet features. Three different types of Support Vector Machine (SVM), Linear SVM, Quadratic SVM and Cubic SVM classifier are applied to classify the candidate dark regions as either hemorrhages or healthy. The efficacy of the proposed method is demonstrated using the standard benchmark DIARETDB1 database and by comparing the results with methods in silico. The performance of the method is measured based on average sensitivity, specificity, F-score and accuracy. Experimental results show the Linear SVM classifier gives better results than Cubic SVM and Quadratic SVM with respect to sensitivity and accuracy and with respect to specificity Quadratic SVM gives better result as compared to other SVMs.
Keywords: Diabetic retinopathy; hemorrhages; adaptive thresholding; support vector machine
Analysis of retinal images is used for diagnosing and treatment of several diseases related to the eye such as DR and glaucoma. The benefits of using computerized retina image analysis are many such as (i) manual diagnosis is usually performed by analyzing the images from a patient, as not all images show signs of DR; (ii) there are insufficient number of healthcare specialists to perform eye examination for huge population of diabetics, (iii) computer-assisted diagnosis of retinal images; used in large screening of diabetics for retinopathy is economical.
Every part of our human body thrives on nourishment derived from the circulating blood. Whenever blood supply to a particular tissue is compromised, the vitality of that tissue is threatened. Diabetes mellitus damages the small blood vessels of the body. As the retina is nourished by small microscopic blood vessels, DR is the damage to the retina due to the diseased blood vessels. Damage to the blood vessels cause the major type of DR [1]. Hemorrhages appear either as small red dots or blots indistinguishable from micro-aneurysms or as larger flame-shaped as shown in Fig. 1.
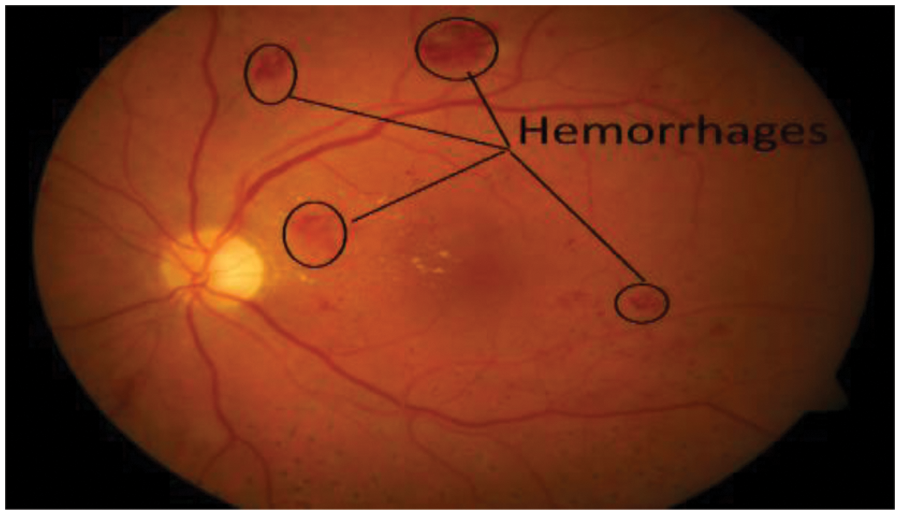
Figure 1: Retinal image with hemorrhages
Early detection of lesions is very important for ophthalmologists in clinical diagnostic and successful treatment. So this paper aims at building a system for early detection and classification of major type of DR.
Hemorrhages in retinal images can be difficult to identify because regions that appear to be small red dots could really be normal. In addition, the blood vessels and fovea are difficult to distinguish from red dots in the retinal image. These can lead to ophthalmologists being misled. The proposed method in this paper is to detect normal objects such as blood vessels, optic disc and fovea and which aids in the detection of red dots. These objects are masked and subsequently hemorrhages are identified. This type of DR are detected and classified using three steps: (i) segmentation of the dark regions in the image using adaptive thresholding algorithm, followed by top hat morphological technique (ii) statistical features and pattern recognition techniques are extracted from each region (iii) SVM classifier is used to classify the regions either as healthy or non-healthy.
The main contributions of this paper are summarized as follows:
1) A new technique to segment normal objects to distinguish them from hemorrhages.
2) Segmentation candidates dark regions in the image after masking normal objects.
3) The features based on pattern recognition and ophthalmologist selection are extracted from these candidates dark regions then the SVM is employed to classify the candidates to detect the presence of hemorrhages.
This paper is organized in five sections. In Section 2 the related work is discussed. The technique for segmentation of hemorrhages is described in Section 3. In Section 4 feature extraction is presented. Experimental results and comparative analysis with some existing methods are presented in Section 5.In Section 6 the conclusion is presented.
Different techniques have been used for the detection of hemorrhages in retinal images. Mamilla et al. [2] presented a new technique to extract small red dots based on phase congruency and mathematical morphology. Adem et al. [3] proposed a technique to extract dark regions by iterative thresholding approach based on firefly and particle swarm optimization. Thresholding, morphology and geometrical features are used to detect lesions from retinal images [4].
Bae et al. [5] employed a method for the extraction of candidate dark lesions using a circular template matching with cross correlation. Then the candidates are segmented by two methods of region growing: local threshold and adaptive seed region growing segmentation.
Zhou et al. [6] used a method based on super-pixel to extract the candidate hemorrhages. This is followed by extracting features from these candidates. Subsequently, Fisher Discriminant Analysis classifier is applied to classify the candidates as either healthy or red dots.
Chowdhury et al. [7] applied a new technique to segment the hemorrhages using K means clustering in fundus images and is followed by Random Forest Classifier to classify the retinal images. Hatanaka et al. [8] suggested a rule-based method and three Mahalonobis distance classifiers to classify the candidate hemorrhages. Tang et al. [9] utilized a splat feature classifier for lesions detection in fundus images. A supervised method was used for partitioning image into non-overlapping segments called clusters, consisting of similar color pixels. Features are extracted from these clusters which describes its characteristics. Optimal feature subset is selected by the wrapper approach.
Orlando et al. [10] in this research employed a new technique to extract dark lesions in retinal images based on combining both deep learned and domain knowledge. Features learned by a convolutional neural network (CNN) are augmented by incorporating hand crafted features.
Preprocessing of retinal images is initially performed by Aziz et al. [11]. After that, red dots are segmented using a smart windowing-based adaptive threshold. Finally, the regions conventional and handcrafted features are extracted and classified using a SVM.
A new convolutional neural network (CNN) architecture is presented to detect DR. Features are extracted from the identified blots indistinguishable from micro-aneurysms using a modified pre-trained CNN model. Finally, the multi-logistic regression controlled entropy variance methodology is used to select the best features [12]. For extracting candidates for large red-lesions, Asiri et al. [13] developed a new deep learning-based technique. They have used two different candidate generating algorithms, one for small red lesions and the other for large red lesions, as well as two different stream structures based on candidate type. Also, they utilized the VGG-16 model with ROI pooling, regression, and classification layers for each stream. Khojasteh et al. [14] used probabilistic output from CNN to automatically and simultaneously detect lesions in retinal images. Image pre-processing, training data refining, and object detection employing a convolutional neural network with label smoothing are the three parts of the suggested system to extract hemorrhages used by Huang et al. [15].
The methods described in the literature are focused on identifying a certain type of dark lesion. However, the blood vessels and fovea inside the retinal image have same the features with hemorrhages that lead to false detection. So the proposed strategy for locating hemorrhages is based on the following steps: Locating dark areas in the remainder of retinal image after masking segmented regular objects (vessels, optic disc and fovea) from retinal image.
• Selecting the clinical descriptive features to describe these candidate areas.
• Classifying these candidate areas as either hemorrhages or healthy.
3 Proposed Method for Segmentation of Hemorrhages
The segmentation of dark regions in fundus retinal images is a difficult step because the normal objects inside retinal images such as blood vessels and fovea have the same color, shape and size features as the hemorrhages. Therefore, as a preprocessing step, the blood vessels, optic disc and fovea are segmented and masked. The sequence of steps is as shown in Fig. 2.
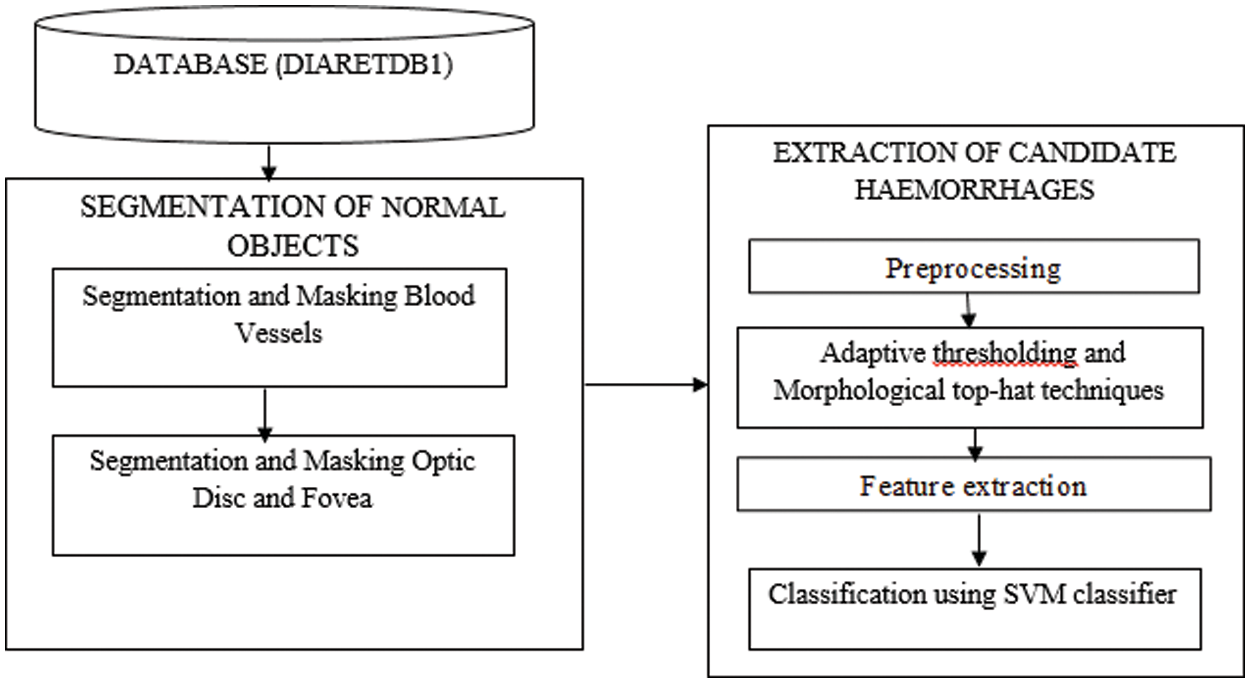
Figure 2: Architecture of the proposed method
3.1 Segmentation and Masking of Blood Vessels
The identification of DR in retinal images such as hemorrhages requires detecting and masking of the blood vessels. In the first step, extracting the green channel from the color retinal image because it carries the most contrast for blood vessels. Then select the threshold value (T) that separates blood vessels and background intensity. Through extensive experiments, T is fixed to be 60.
Finally, a new filter is developed to extract the border of vessels based on orientations of vessels. We assume one pixel P to be a vessel border and the neighboring pixels Q have two groups (group A contains three pixels inside the blood vessels and group B contains five pixels representing the background of P) [16].
The variation between the two groups will be determined by the contrast between vessels and the neighbor pixels of current pixel P. Almost in all orientations, at most three pixels out of eight-neighboring pixels lie inside the blood vessel and may take one of eight possible orientations. Average intensity of all possible group A pixels are computed (It is to be observed that group A pixels are three adjacent pixels of the eight neighboring pixels). The minimum of all average intensities is determined and the corresponding pixels are declared to be inside the blood vessel as described in Eq. (1).
where p(x, y) represents the new intensity value of the current pixel P, avg(…) represents to the average value. Fig. 3b illustrates the extracted blood vessels.
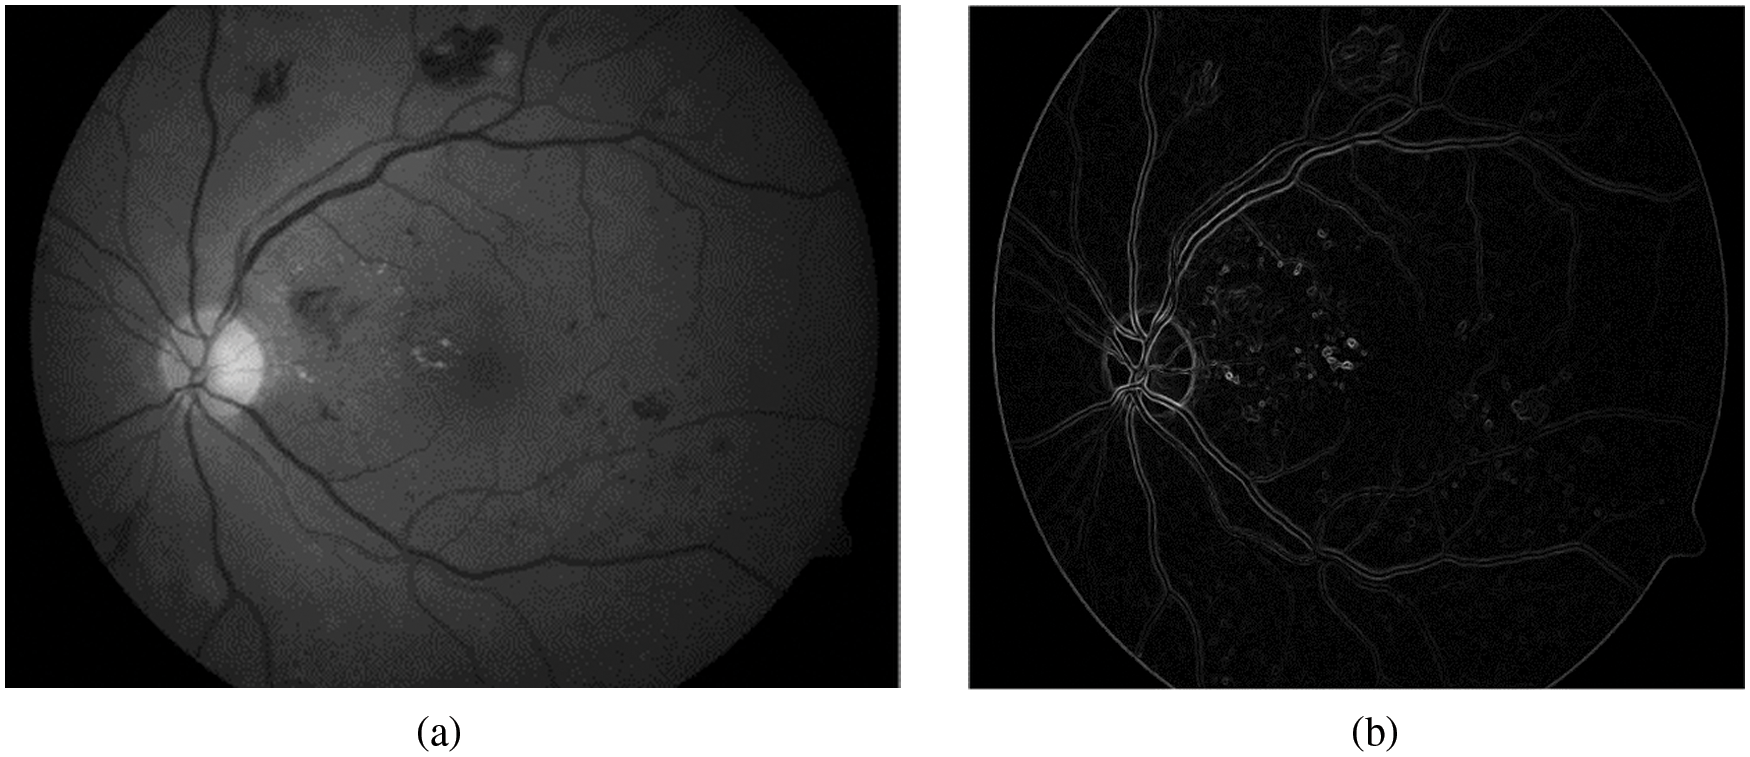
Figure 3: Segmentation of blood vessels (a) Green retinal image. (b) Blood vessels after removal background
3.2 Segmentation and Masking of Optic Disc
Optic disc needs to be masked to identify hemorrhages. In this section, the proposed models for segmentation of optic disc and fovea are discussed. Further, optic disc segmentation helps in the detection of fovea as that has a fixed distance from the optic disc.
Maximum Variance Window
The selection of the candidate regions is done by dividing the image into non-overlapping sub-images (100 × 100) to ensure that the whole optic disc region resides within the window (number of sub-image for each image is 3 × 3) as shown in Fig. 4b. Further, the window size is chosen empirically using extensive experimentation, searching for the brightest window with maximum variance in intensity. Searching for the brightest region inside the retinal image is a challenge because of the presence of vascular trees in the region. These vascular trees have different intensity levels and are obscured by optic disc. These obscured vessels may reduce brightness in the optic disc region. To overcome this problem, the proposed algorithm takes only the pixels having intensity greater than the mean value inside the candidate window [17]. The region brightness is computed as described in Eq. (2).
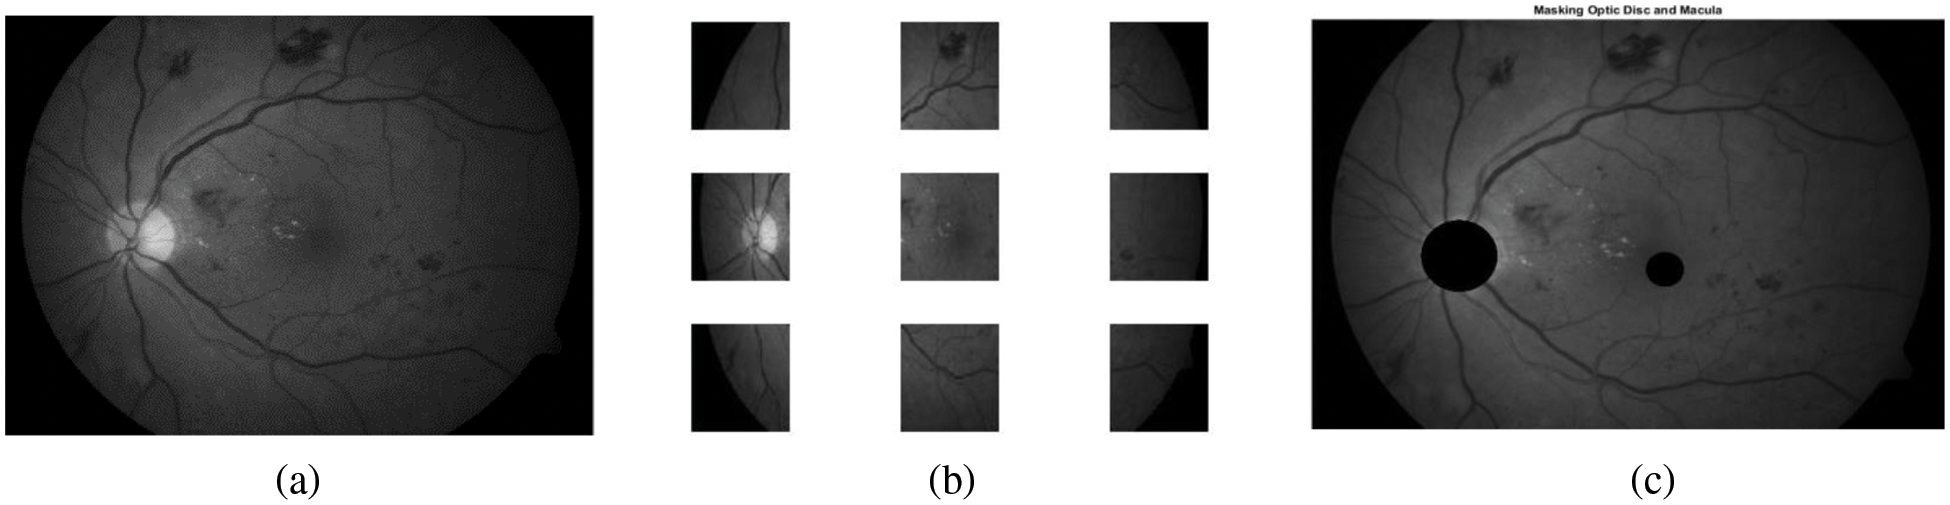
Figure 4: Extraction of optic disc and fovea (a) Green retinal image. (b) Retinal image after dividing it into sub-images. (c) Retinal image after masking optic disc and fovea
where Pmean is the mean intensity value of the current window, and n is the number of pixels inside the current window. We selected the pixels that have value greater than Pmean. Eq. (2) is taken as a guide for determining brightness of the examined current window. In addition to the brightness criteria, the variance in intensity levels inside the candidate optic disc region is also considered for selection of window. The variance of each region is computed by Eq. (3) as follows:
Window with maximum variance is selected. Then pixels are located pixels with these intensities (>160) and these pixels are likely to be lying in the circumference of the optic disc and will be referred as border pixels. Then we have used Circular Hough Transform (CHT) to segment the optic disc in the retinal image [18]. It is an efficient technique to detect circles in the image. Radius of CHT is chosen to be 20 pixels as most optic disc images have this radius.
3.3 Segmentation and Masking of Fovea
The fovea is a dark area in the central region of the retina, which measures about 4 to 5 mm in diameter, and is often located in the same vertical plane with the optic disc at a distance of about twice the diameter of the optic disc. Masking of fovea enhances detection of some lesions that have the same features as hemorrhages. After extracting the optic disc, search for the darkest region that lies in the vertical plane of the optic disc. Radius of the fovea is chosen to be 8 pixels as most images have this radius and the distance between optic disc and fovea is chosen to be 80 pixels. Fig. 4c shows masked optic disc and fovea in the retinal image.
4 Extraction of Candidate Dark Regions
The purpose of this process is to detect the candidate hemorrhages from the retinal image. The first step is the enhancement of the image using Contrast Limited Adaptive Histogram Equalization (CLAHE) to improve the contrast between hemorrhages and background. A local adaptive thresholding technique is applied first to separate hemorrhages image objects from the background based on the local mean intensity. (Subsequently, black morphological top hat is applied to the image in two steps (i) closing is done on the image to obtain the candidates dark regions in the image using disk shape structuring element (ii) subtracting the input image from the output of the previous step.
Here A is the input image in green channel and SE is symmetrical disc structuring element with radius 12. Fig. 5b shows the binary image of the hemorrhage candidates in white color and the background in black color.
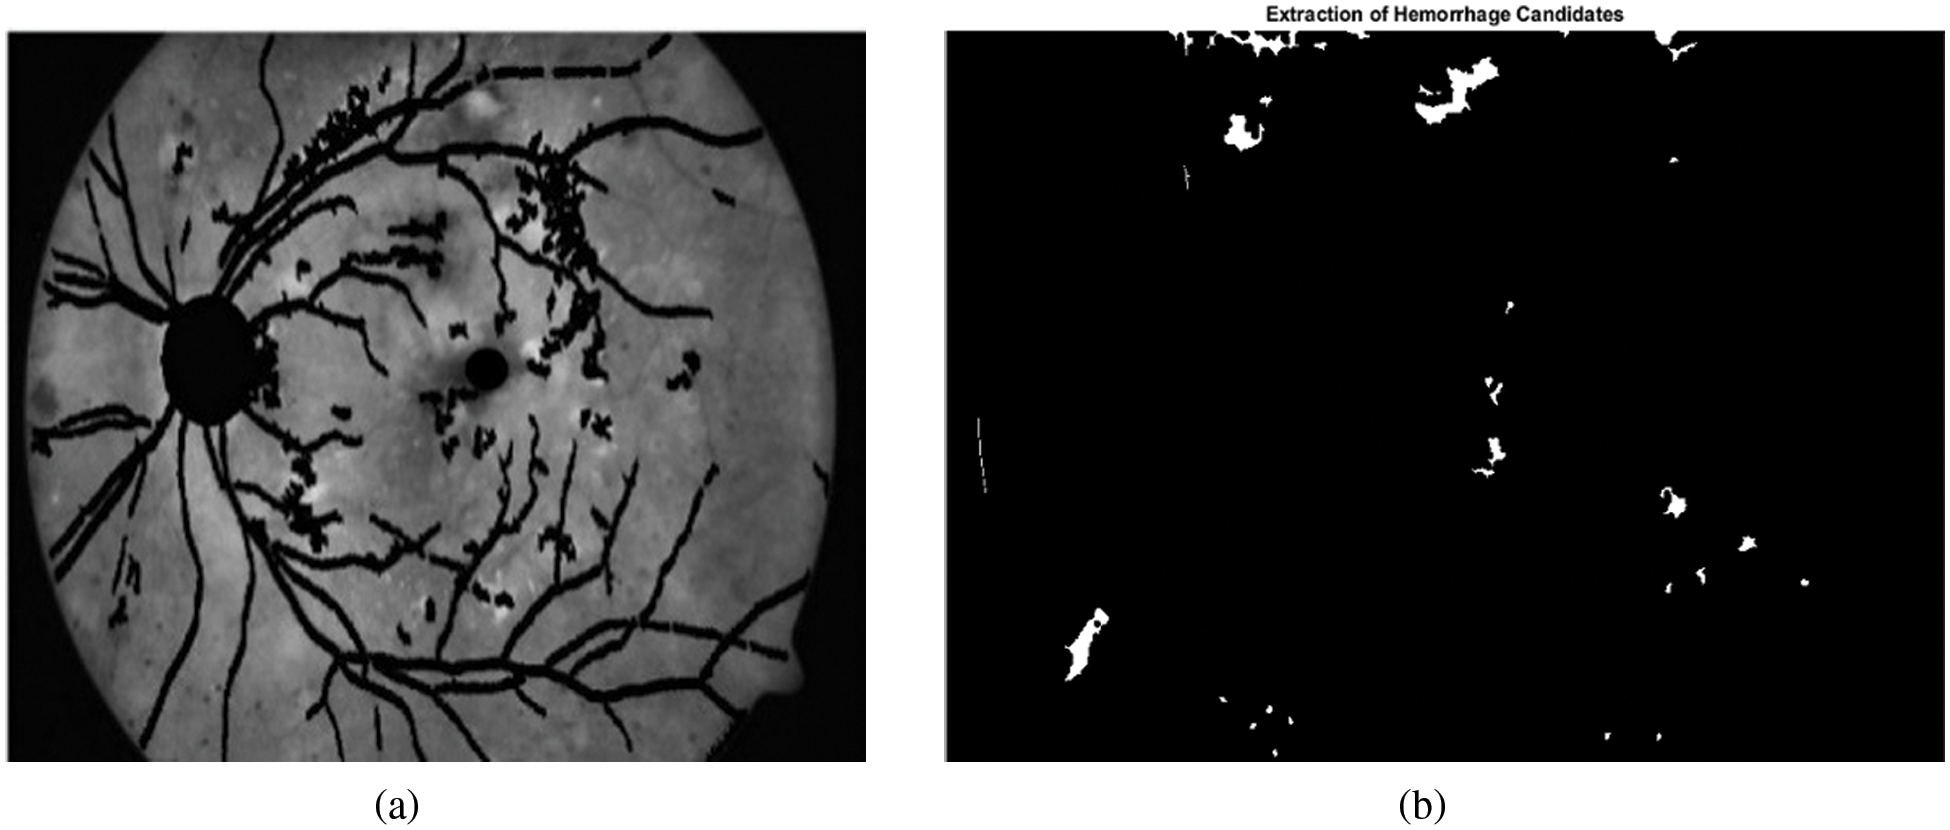
Figure 5: Extraction of candidate hemorrhages. (a) Retinal image after masking blood vessels, optic disc and fovea. (b) Candidate hemorrhages
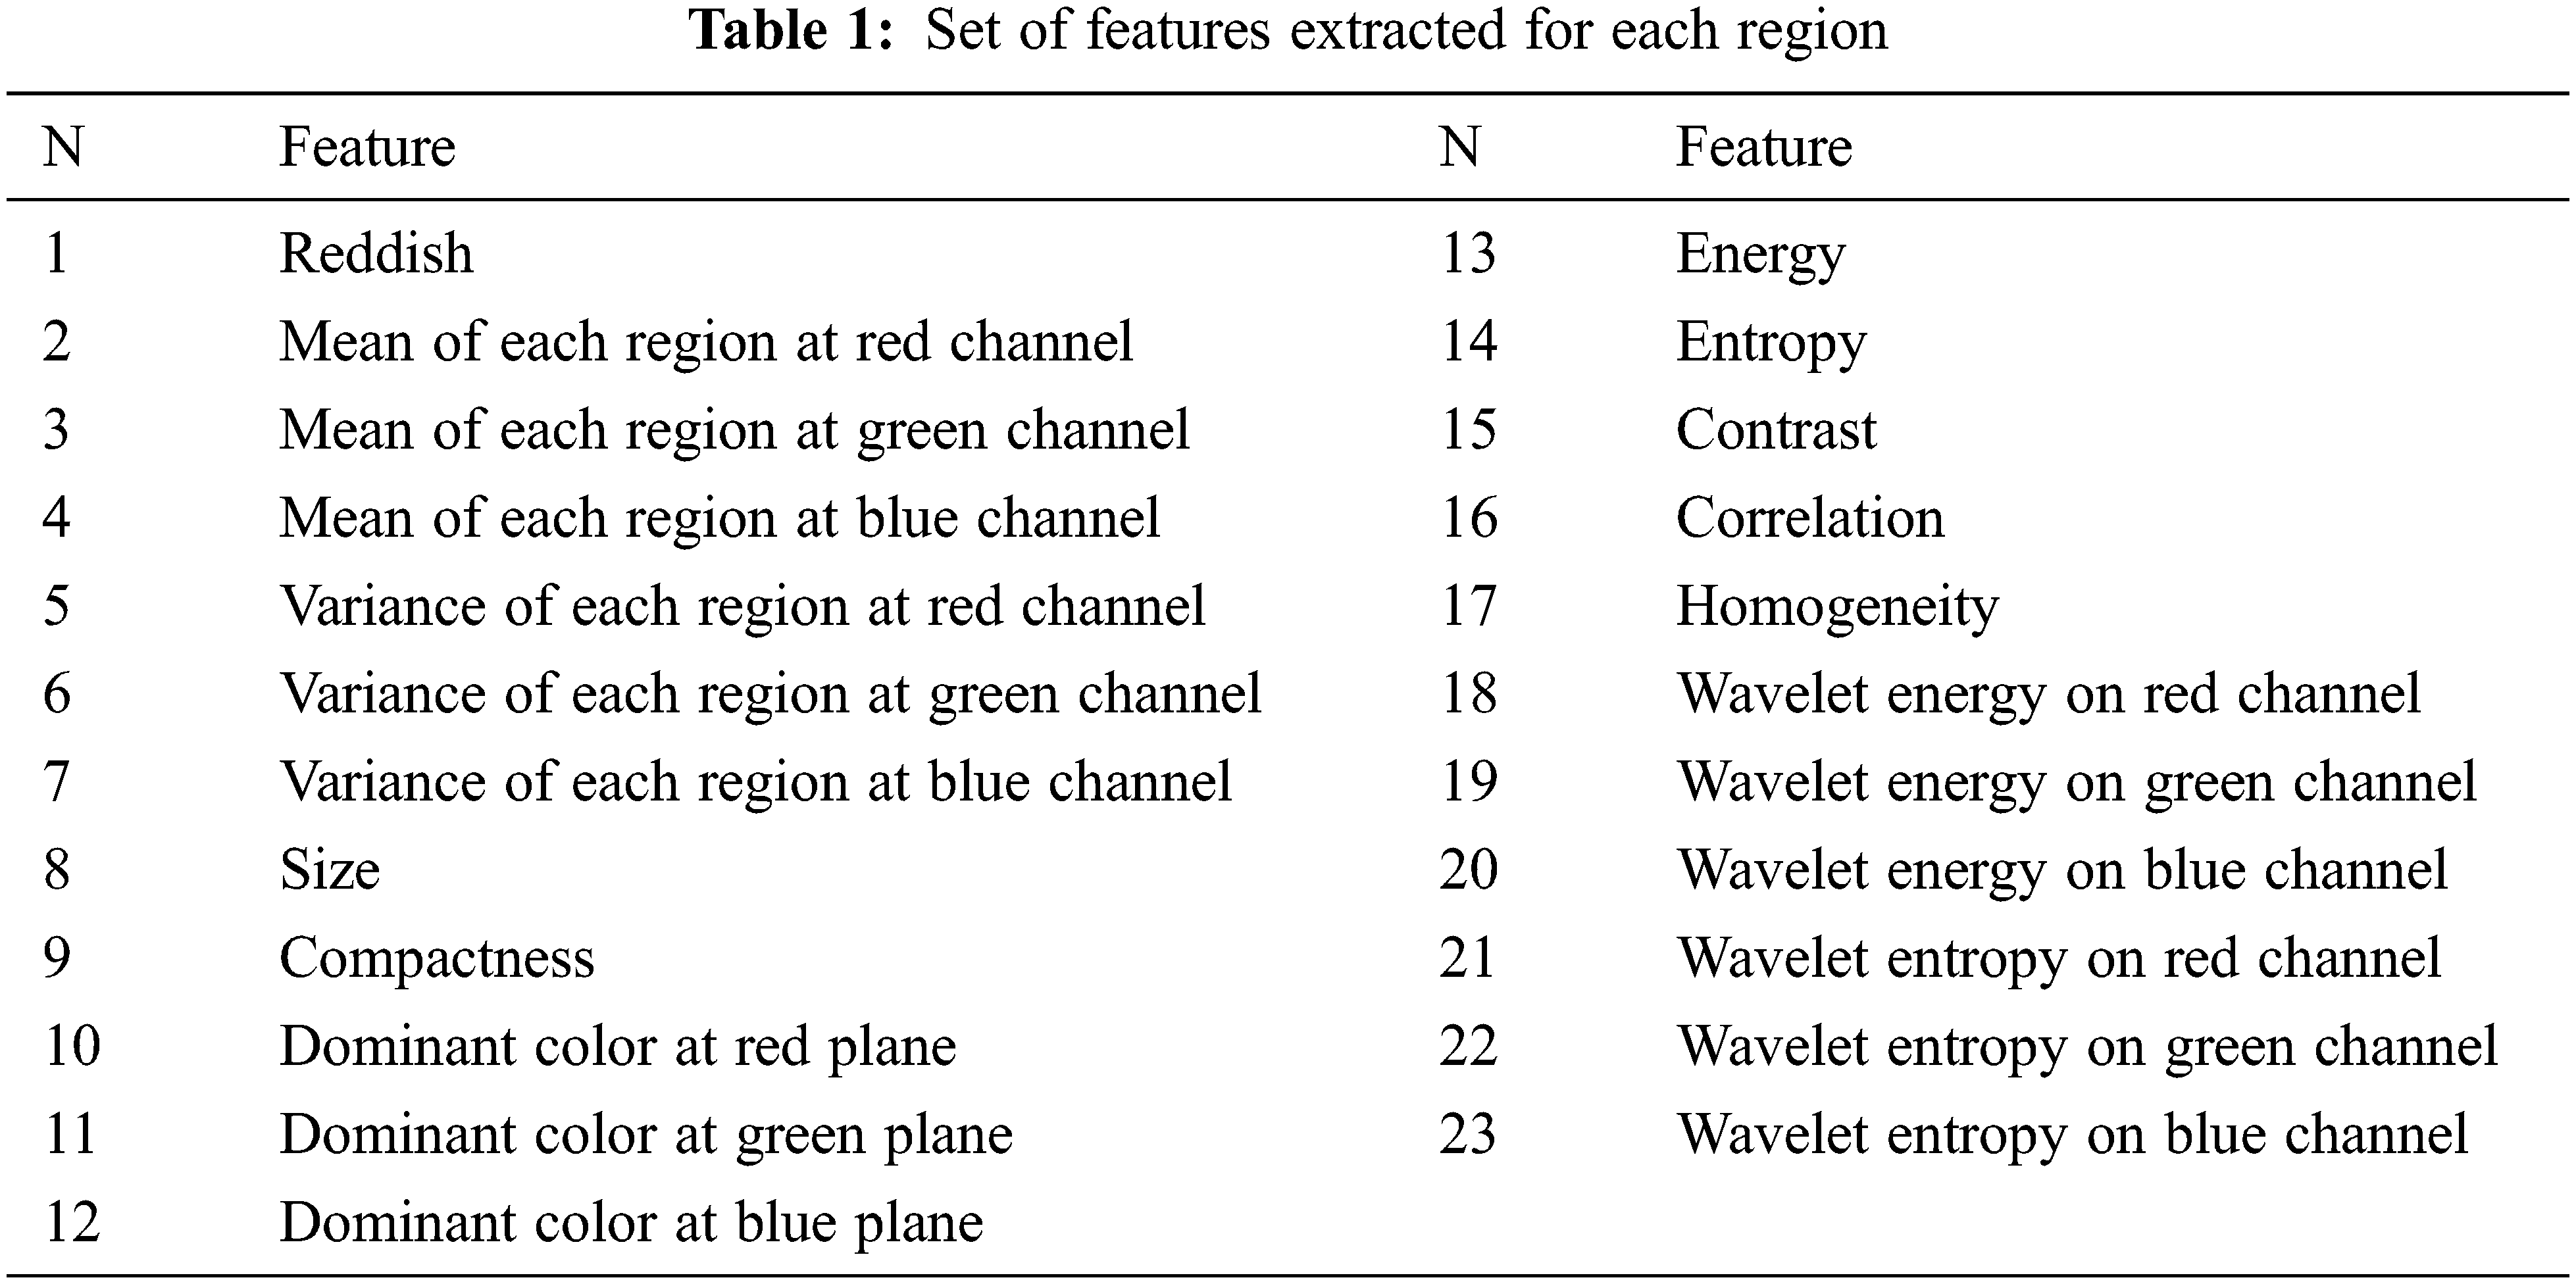
Not all the extracted dark regions are hemorrhages. The extracted dark areas need to be checked carefully in order to decide; if they are hemorrhages or normal background. This task is achieved by selecting a set of features for each region. The technique for selecting features is based on grouping features into two main categories: One is based on the ophthalmologist's recognition of lesions using color and size; and the other is based on pattern recognition techniques by extracting texture, dominant color and wavelet features.
5.1 Features Based on Ophthalmologist Selection
1. Reddish
Given a pixel represented in RGB, its redness will depend on its values in each color channel; R, G, and B. The redness value increases as the value of R channel increases and both values of G, and B channels decrease and vice versa. So, each pixel can be replaced by Eq. (6) to indicate the amount of redness.
where Rn represents the new value of the current processed pixel, and (R, G, B) represent RGB components of the current processed pixel. Putting “255” in the dominator aims to avoid dividing by zero and normalizing output from “0” (at R = 0) to “1” (at R = 255 and both G, B = 0). Even Eq. (6) describes a suggested equation to determine redness feature for a given pixel. Extending this equation for a given region can easily be implemented by taking the mean value for all pixels in that region.
2. Size
The total number of pixels inside the region.
5.2 Pattern Recognition Techniques
1) Mean
The mean value of each region for each color space is determined as follows:
where μ( i, p) is the mean intensity value of the color components P at the region i, j all pixels belonging to region i, and X j (P) represents the intensity value of color component P at pixel j.
2) Variance
The variance of each region at each color space is determined by:
where v(i, p) represents the square of the standard division value of the color component P at the region i.
3) Compactness
A compactness feature gives a measure about how far an object is from a circular shape.
4) Dominant Colors
The dominant color for each region is determined as color with the maximum frequency in this region. To avoid the effect of spurious noise in determining dominant color, the color space of each region is classified into a set of bins before determining number of occurrences for each bin in the processed region. The dominant color of each region is taken as the bin with maximum frequency occurrences.
5) Co-occurrence Matrix
From Co-occurrence Matrix we have used 5 formulas [19].
Energy:
Entropy:
Contrast:
Correlation:
Homogeneity:
Based on experimental work, the distance at which co-occurrence matrix is calculated is taken as 2 equals pixels. The angle varies from 0 to135 with a difference of 35 steps. To make the features invariant to the orientations of regions, an average of these features at each pixel is extracted from 4 different orientations.
6) Wavelets
Applying first level DWT on a given color channel of the processed retinal image results in 4 images. The features extracted are energy and entropy from the approximation matrix.Tab. 1 shows a list of all features in the proposed method for the classification of hemorrhages.
-Wavelet Energy: Wavelet energy of the candidate region is the sum of squares of all elements in the approximation matrix.
where ca(i, j) are intensities of the approximation matrix computed through various processing steps.
-Wavelet Entropy: Wavelet entropy is used to recognize the randomness texture of each candidate region.
SVM are supervised learning models with associated learning algorithms that analyze data and recognize patterns in the input data. In our approach three different types of SVM are applied; Linear SVM, Quadratic SVM and Cubic SVM that takes a set of input data and predicts the output, which forms two possible classes.
In our work, we have extracted 3386 candidate dark regions from the dataset. Each region is represented with 23 extracted features. The experiment is conducted by varying the number of candidate areas. The candidate areas (testing data set size) are 30%, 40%, 50% and 60%.
The proposed technique has been experimented on the publicly available database DIARETDB1 [20].This dataset consists of 89 fundus images with 50° field-of-view. Each image has a resolution of 1500 × 1152 pixels. Further, the ground truth label for segmentation of optic disc and hemorrhages are available from the dataset. The dataset contains 59 abnormal images with the labels.
To measure the performance of the proposed method, experiments are done using proposed and state-of-the-art methods to segment optic disc and classify the hemorrhages. Metrics such as the average sensitivity, specificity, average predictive value and F-score are taken to quantify the performance.
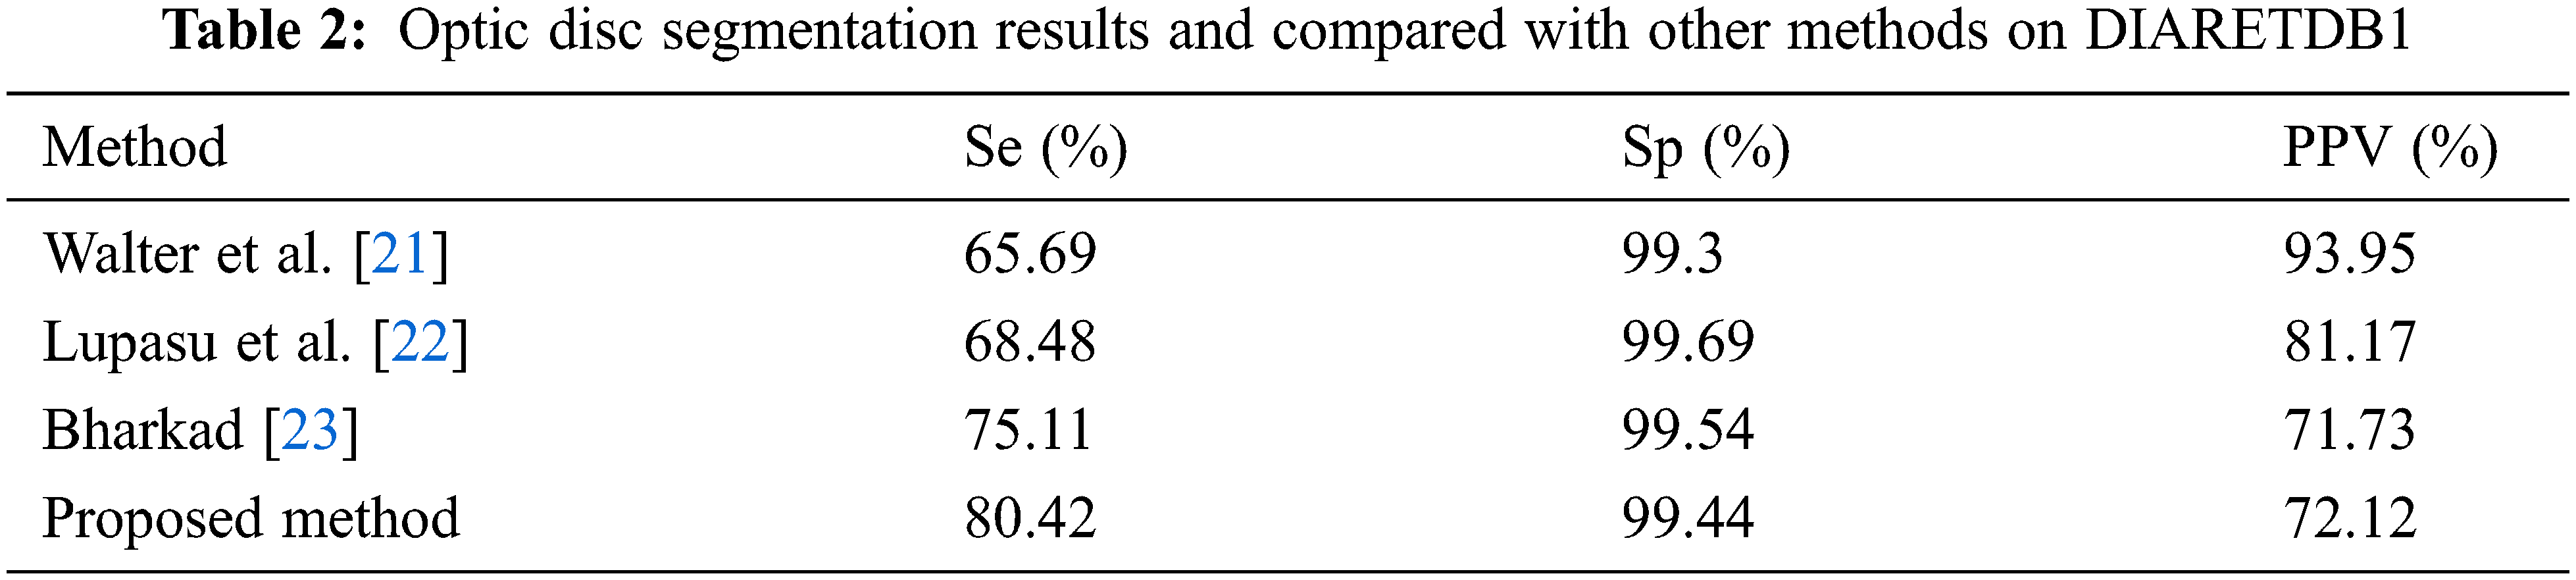
The results of candidate window selection and extraction of the optic disc on two images using variance are shown in Fig. 6. Tab. 2 shows the performance of the proposed method in three terms and is compared with state-of-art-methods for segmentation optic disc.
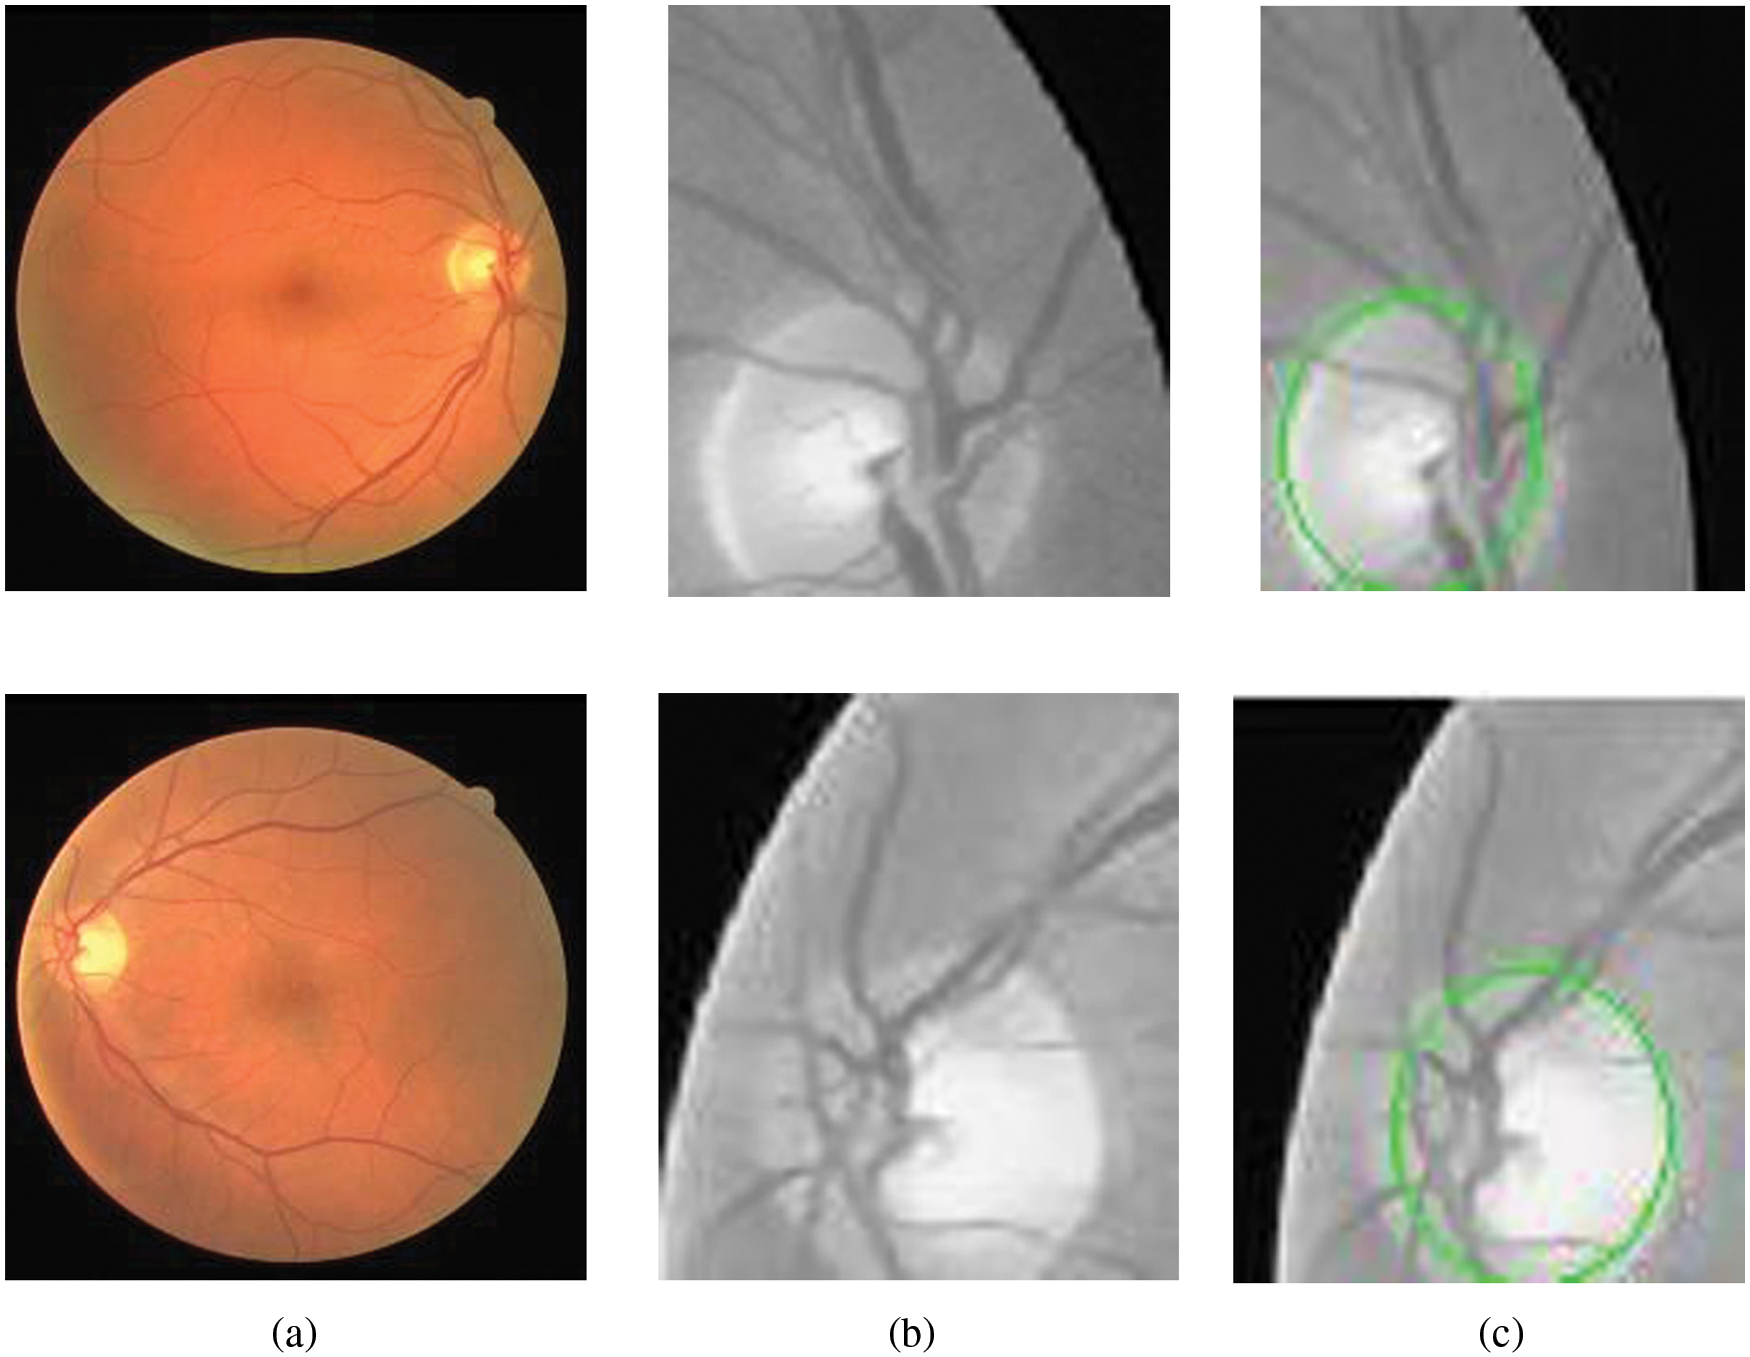
Figure 6: Segmentation of optic disc. (a) Retinal images. (b) Extracted candidate window. (c) Window with optic disc
The overall algorithm for segmentation of optic disc is given below
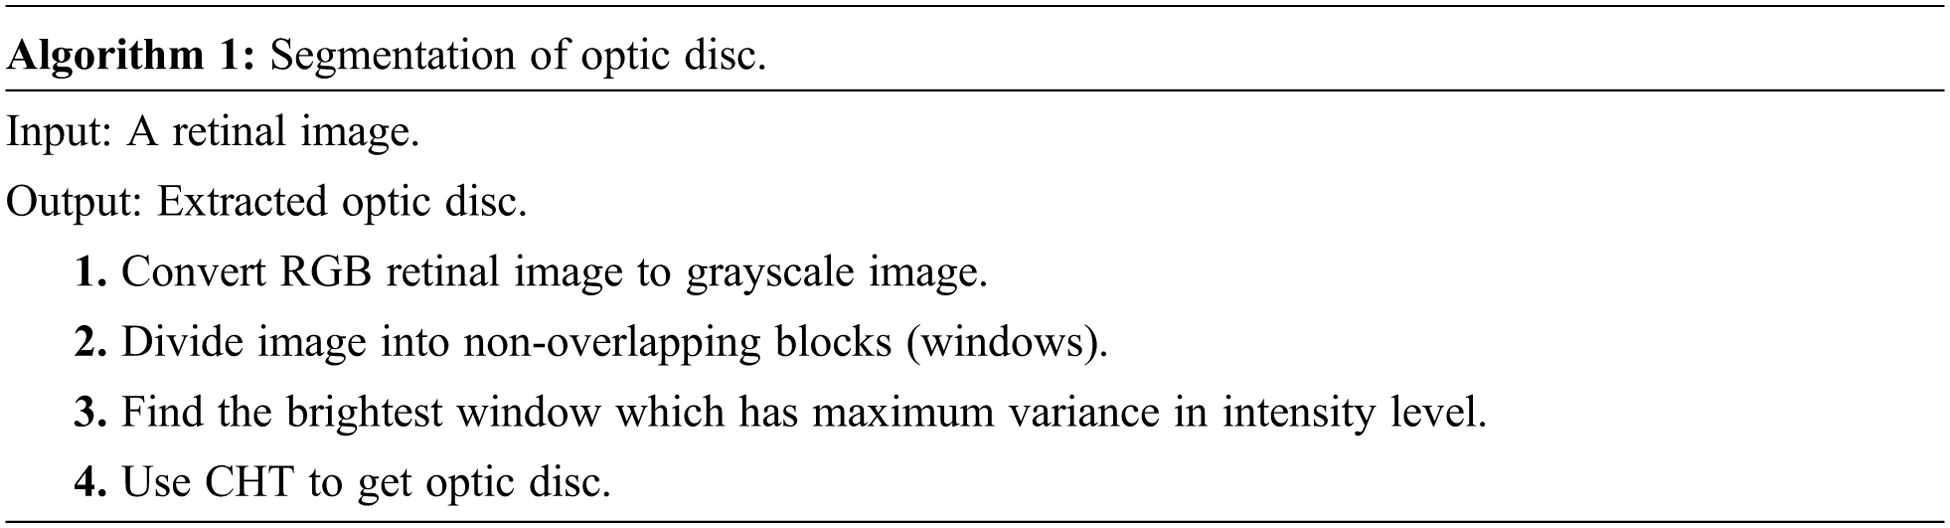
Extensive experimentation with different thresholds on various parameters are used, and found the best threshold value to extract optic disc is 160.
From Tab. 2 it is evident that the proposed method achieves better performance than the other methods with respect to average sensitivity for segmentation of optic disc. Fig. 7 shows green channel retinal images after masking normal objects and the candidate region of hemorrhages.
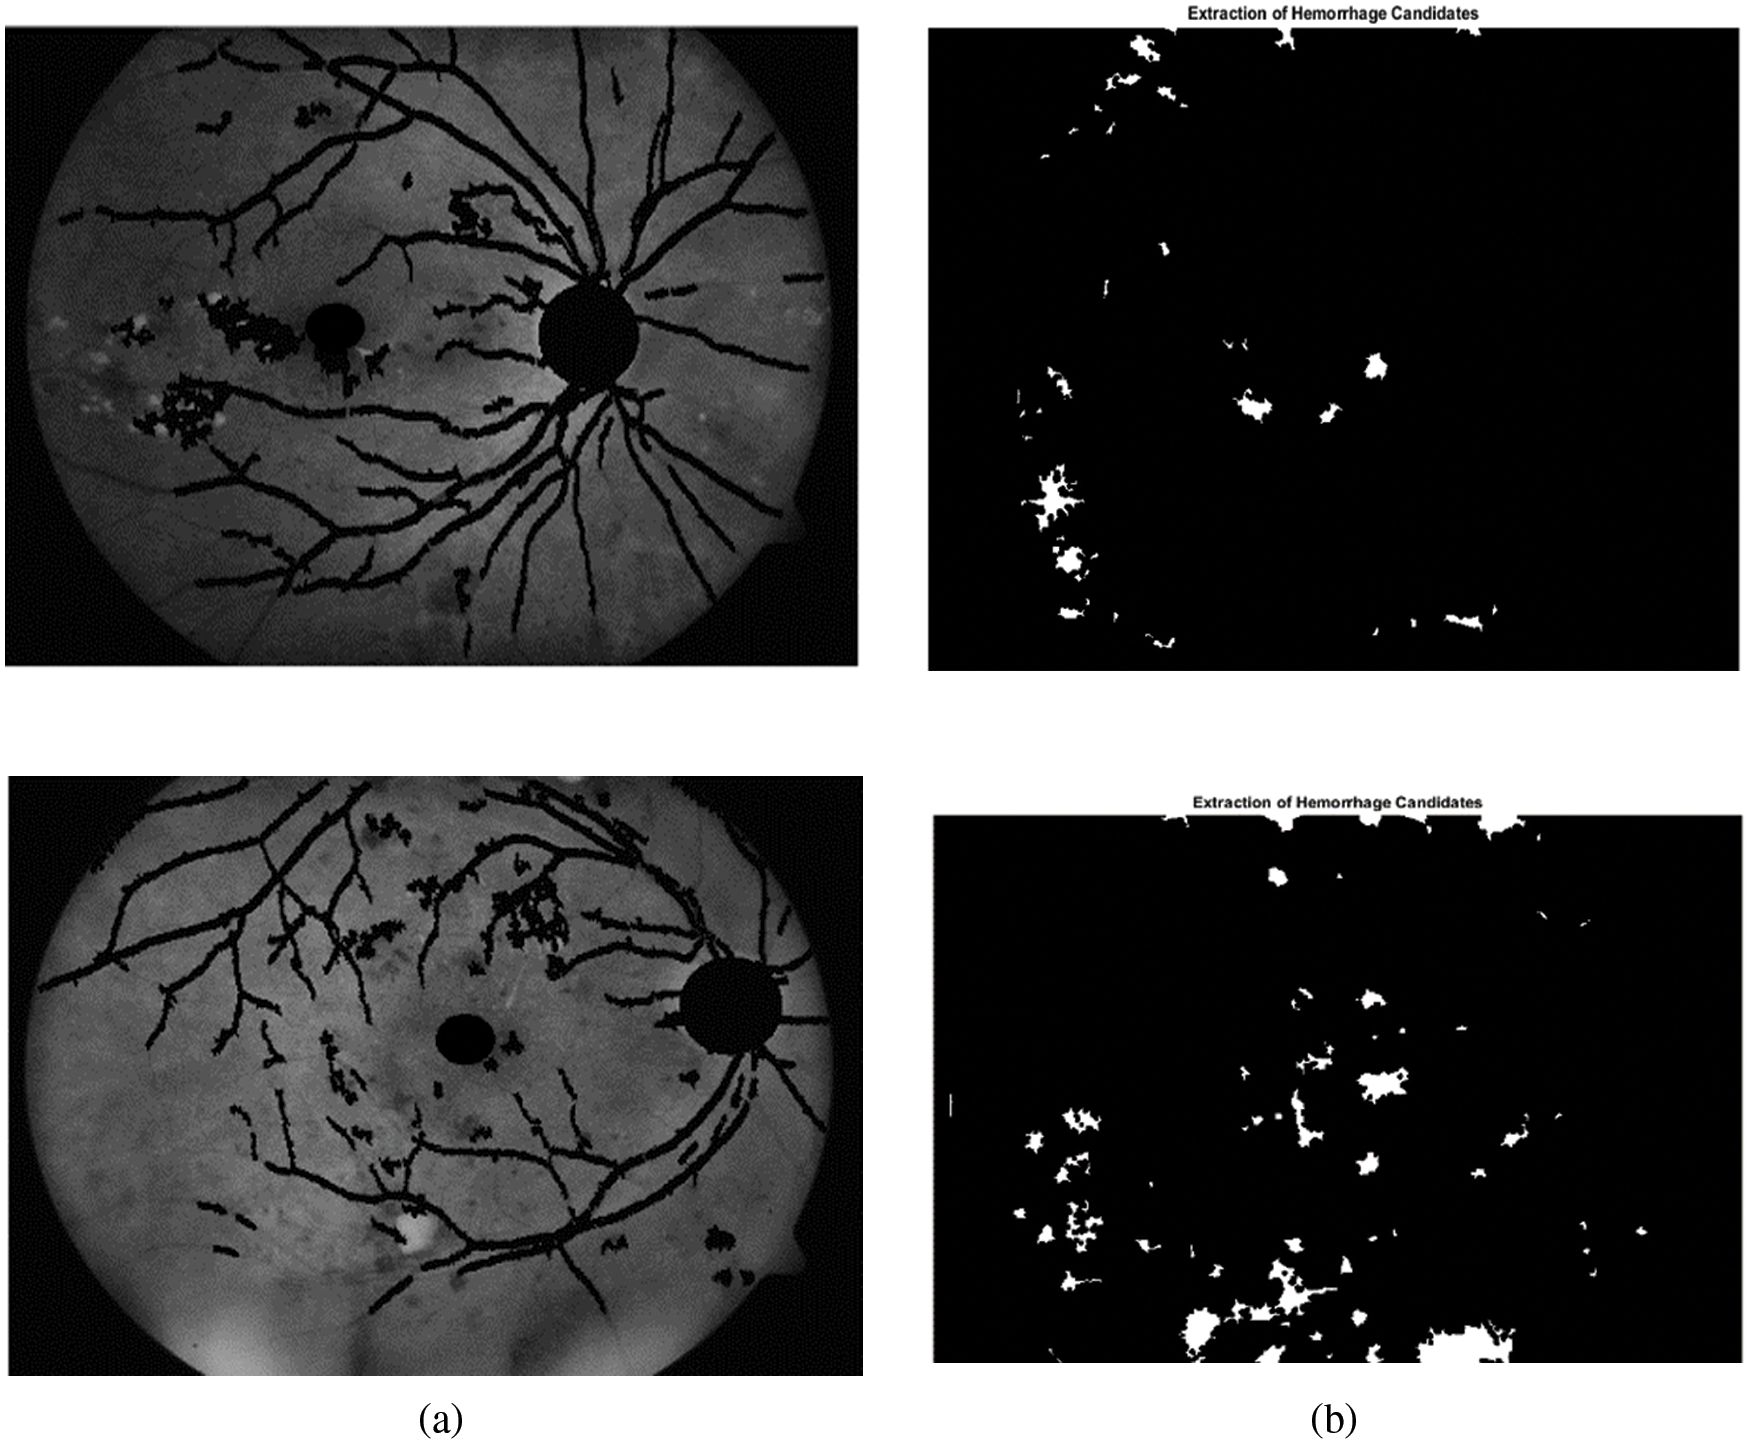
Figure 7: Extraction candidates region of hemorrhages. (a) Green channel retinal images after normal objects. (b) Candidates region of hemorrhages
The overall algorithm for detection and classification of hemorrhages is given below
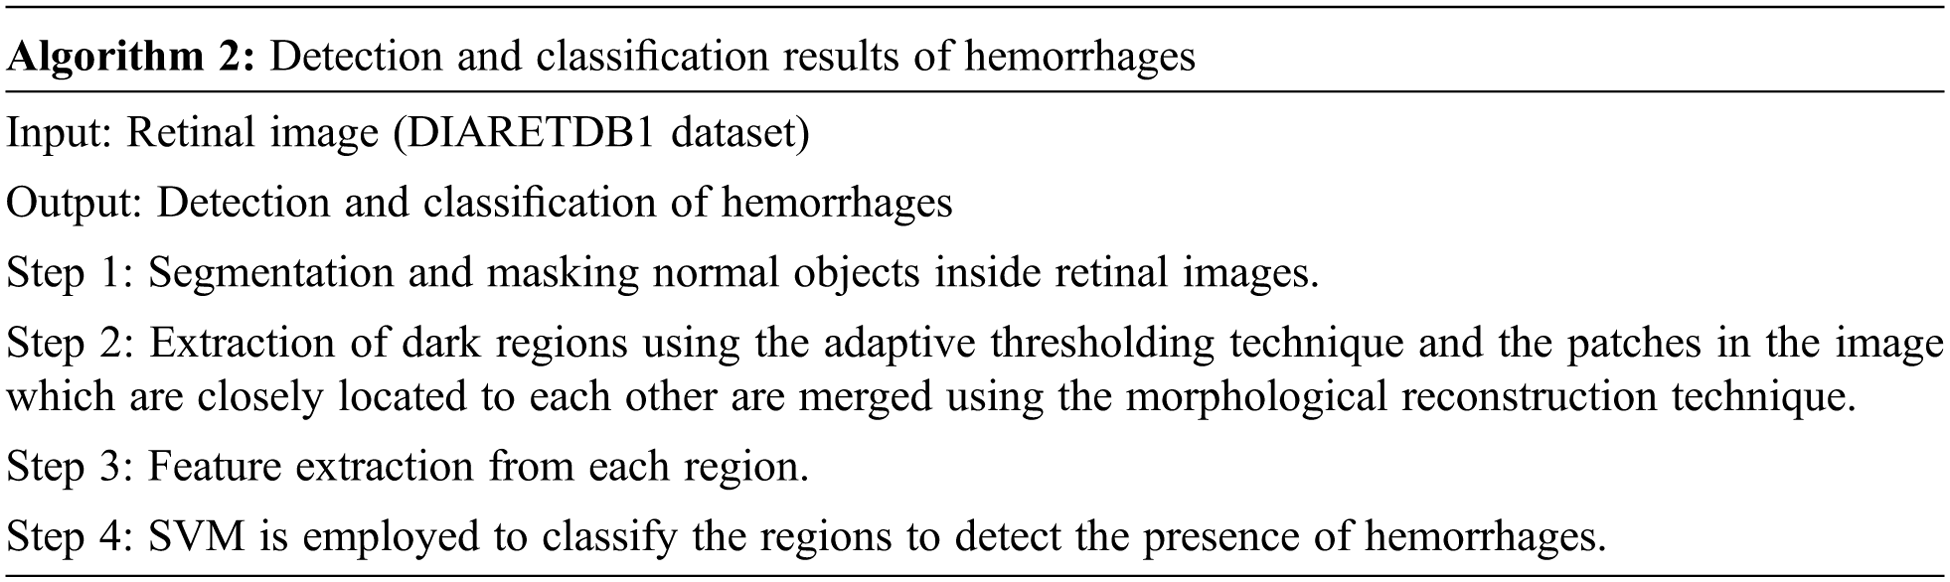
The performance of the proposed method for detection hemorrhages are tabulated (Tabs. 3 to 5) for linear SVM, quadratic SVM and cubic SVM respectively and compared with the other state-of-art-methods as shown in (Tab. 6). Figures 8 and 9 show the graph ofcomparison on different techniques for detection of haemorrhages.
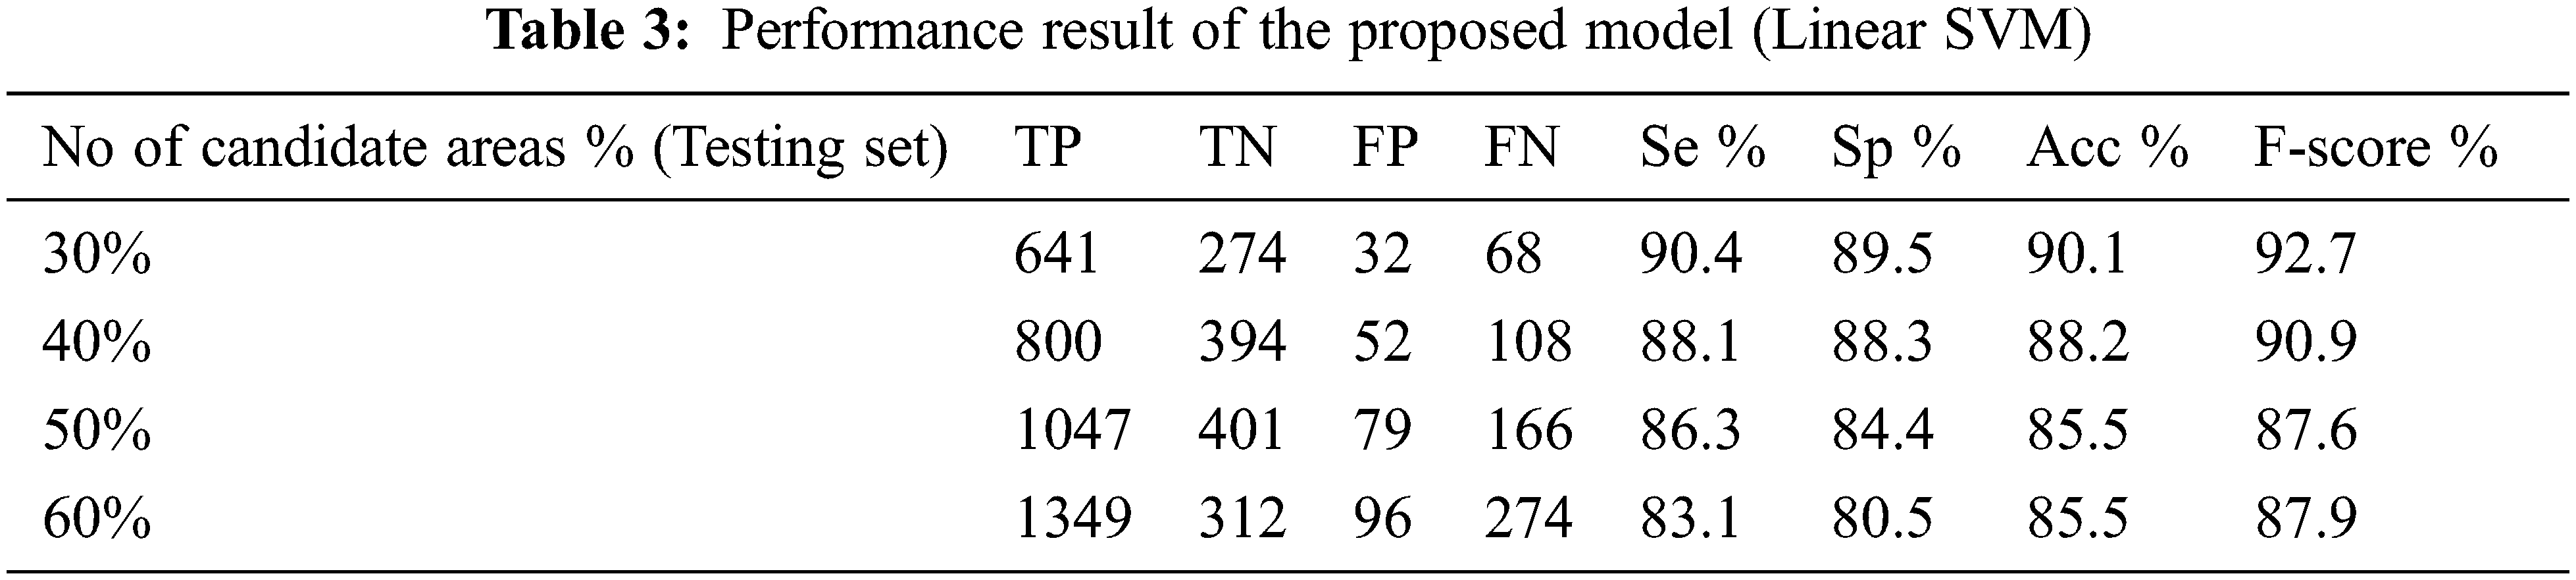
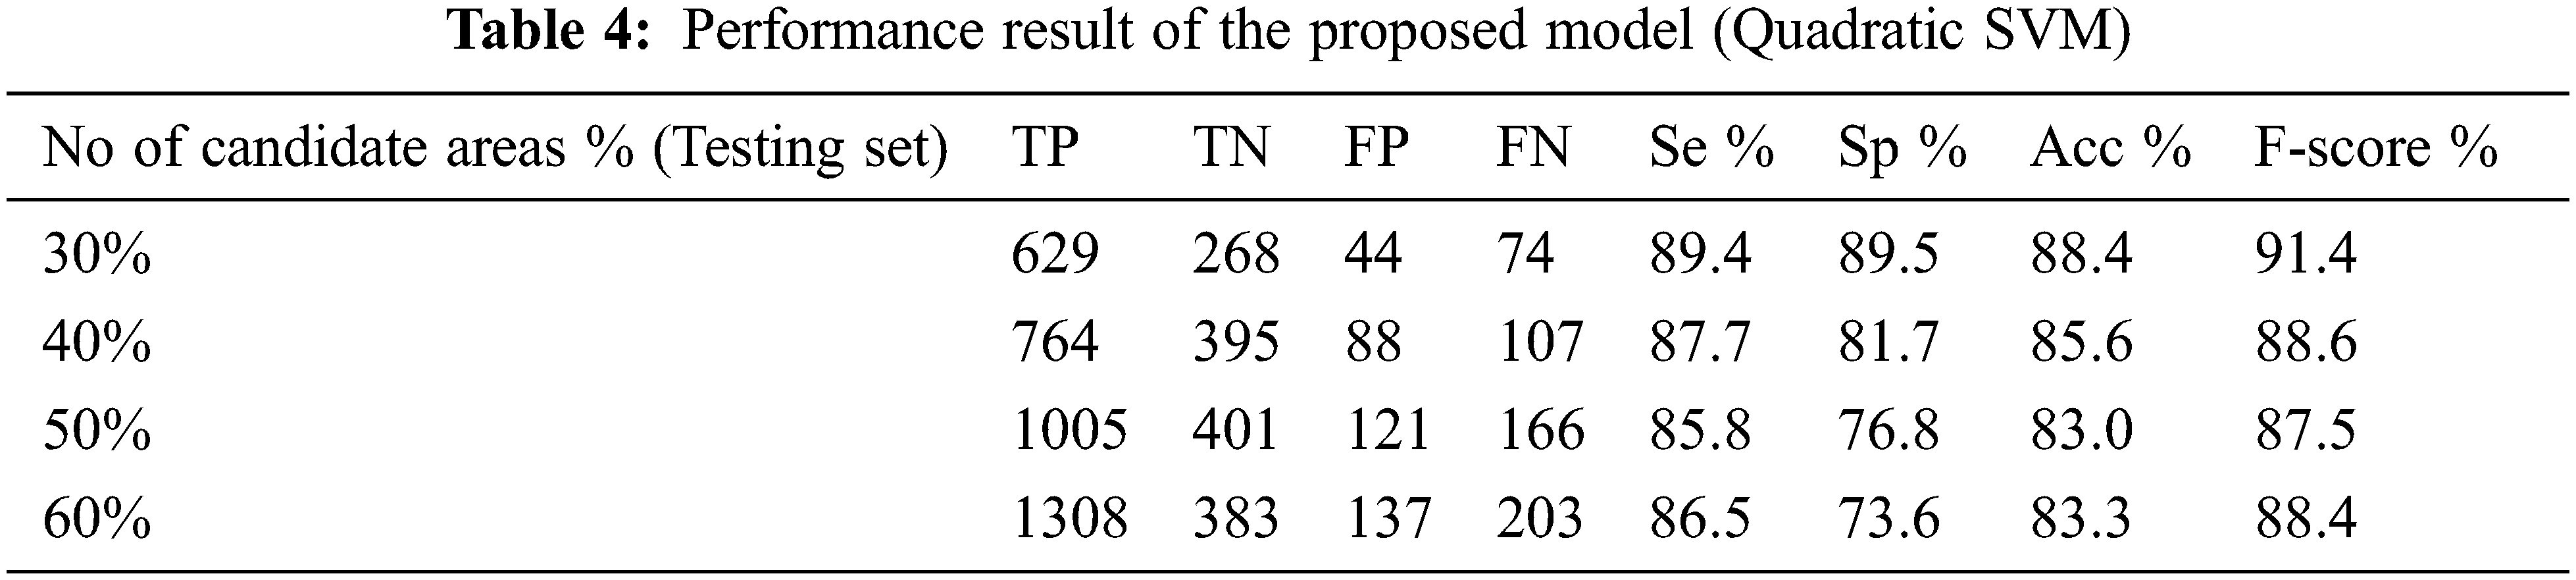
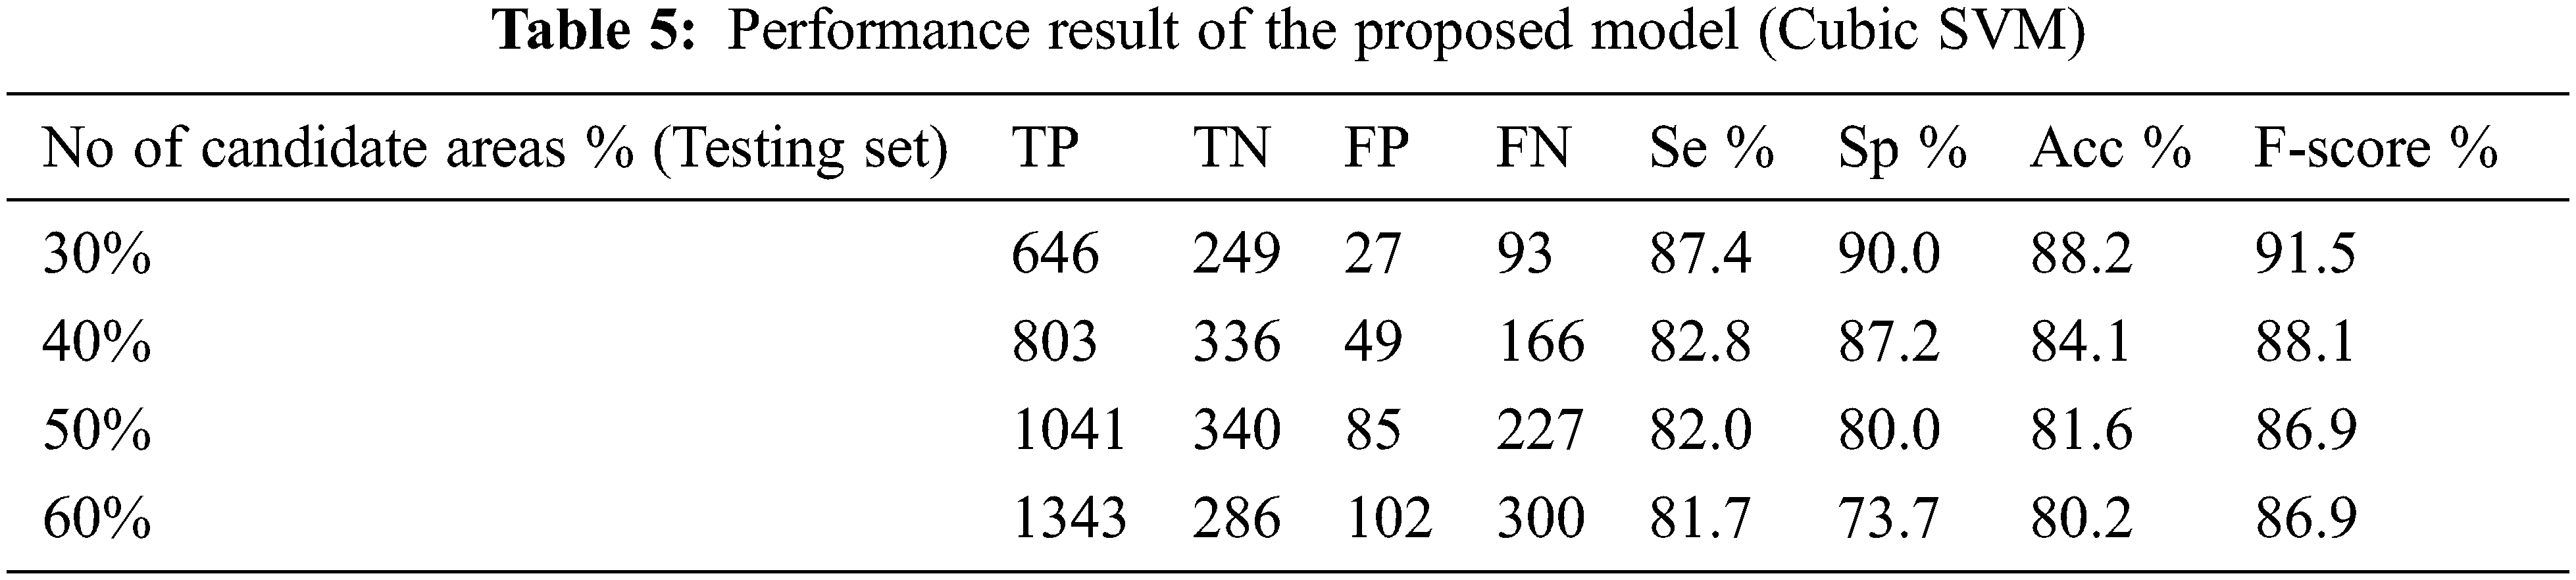
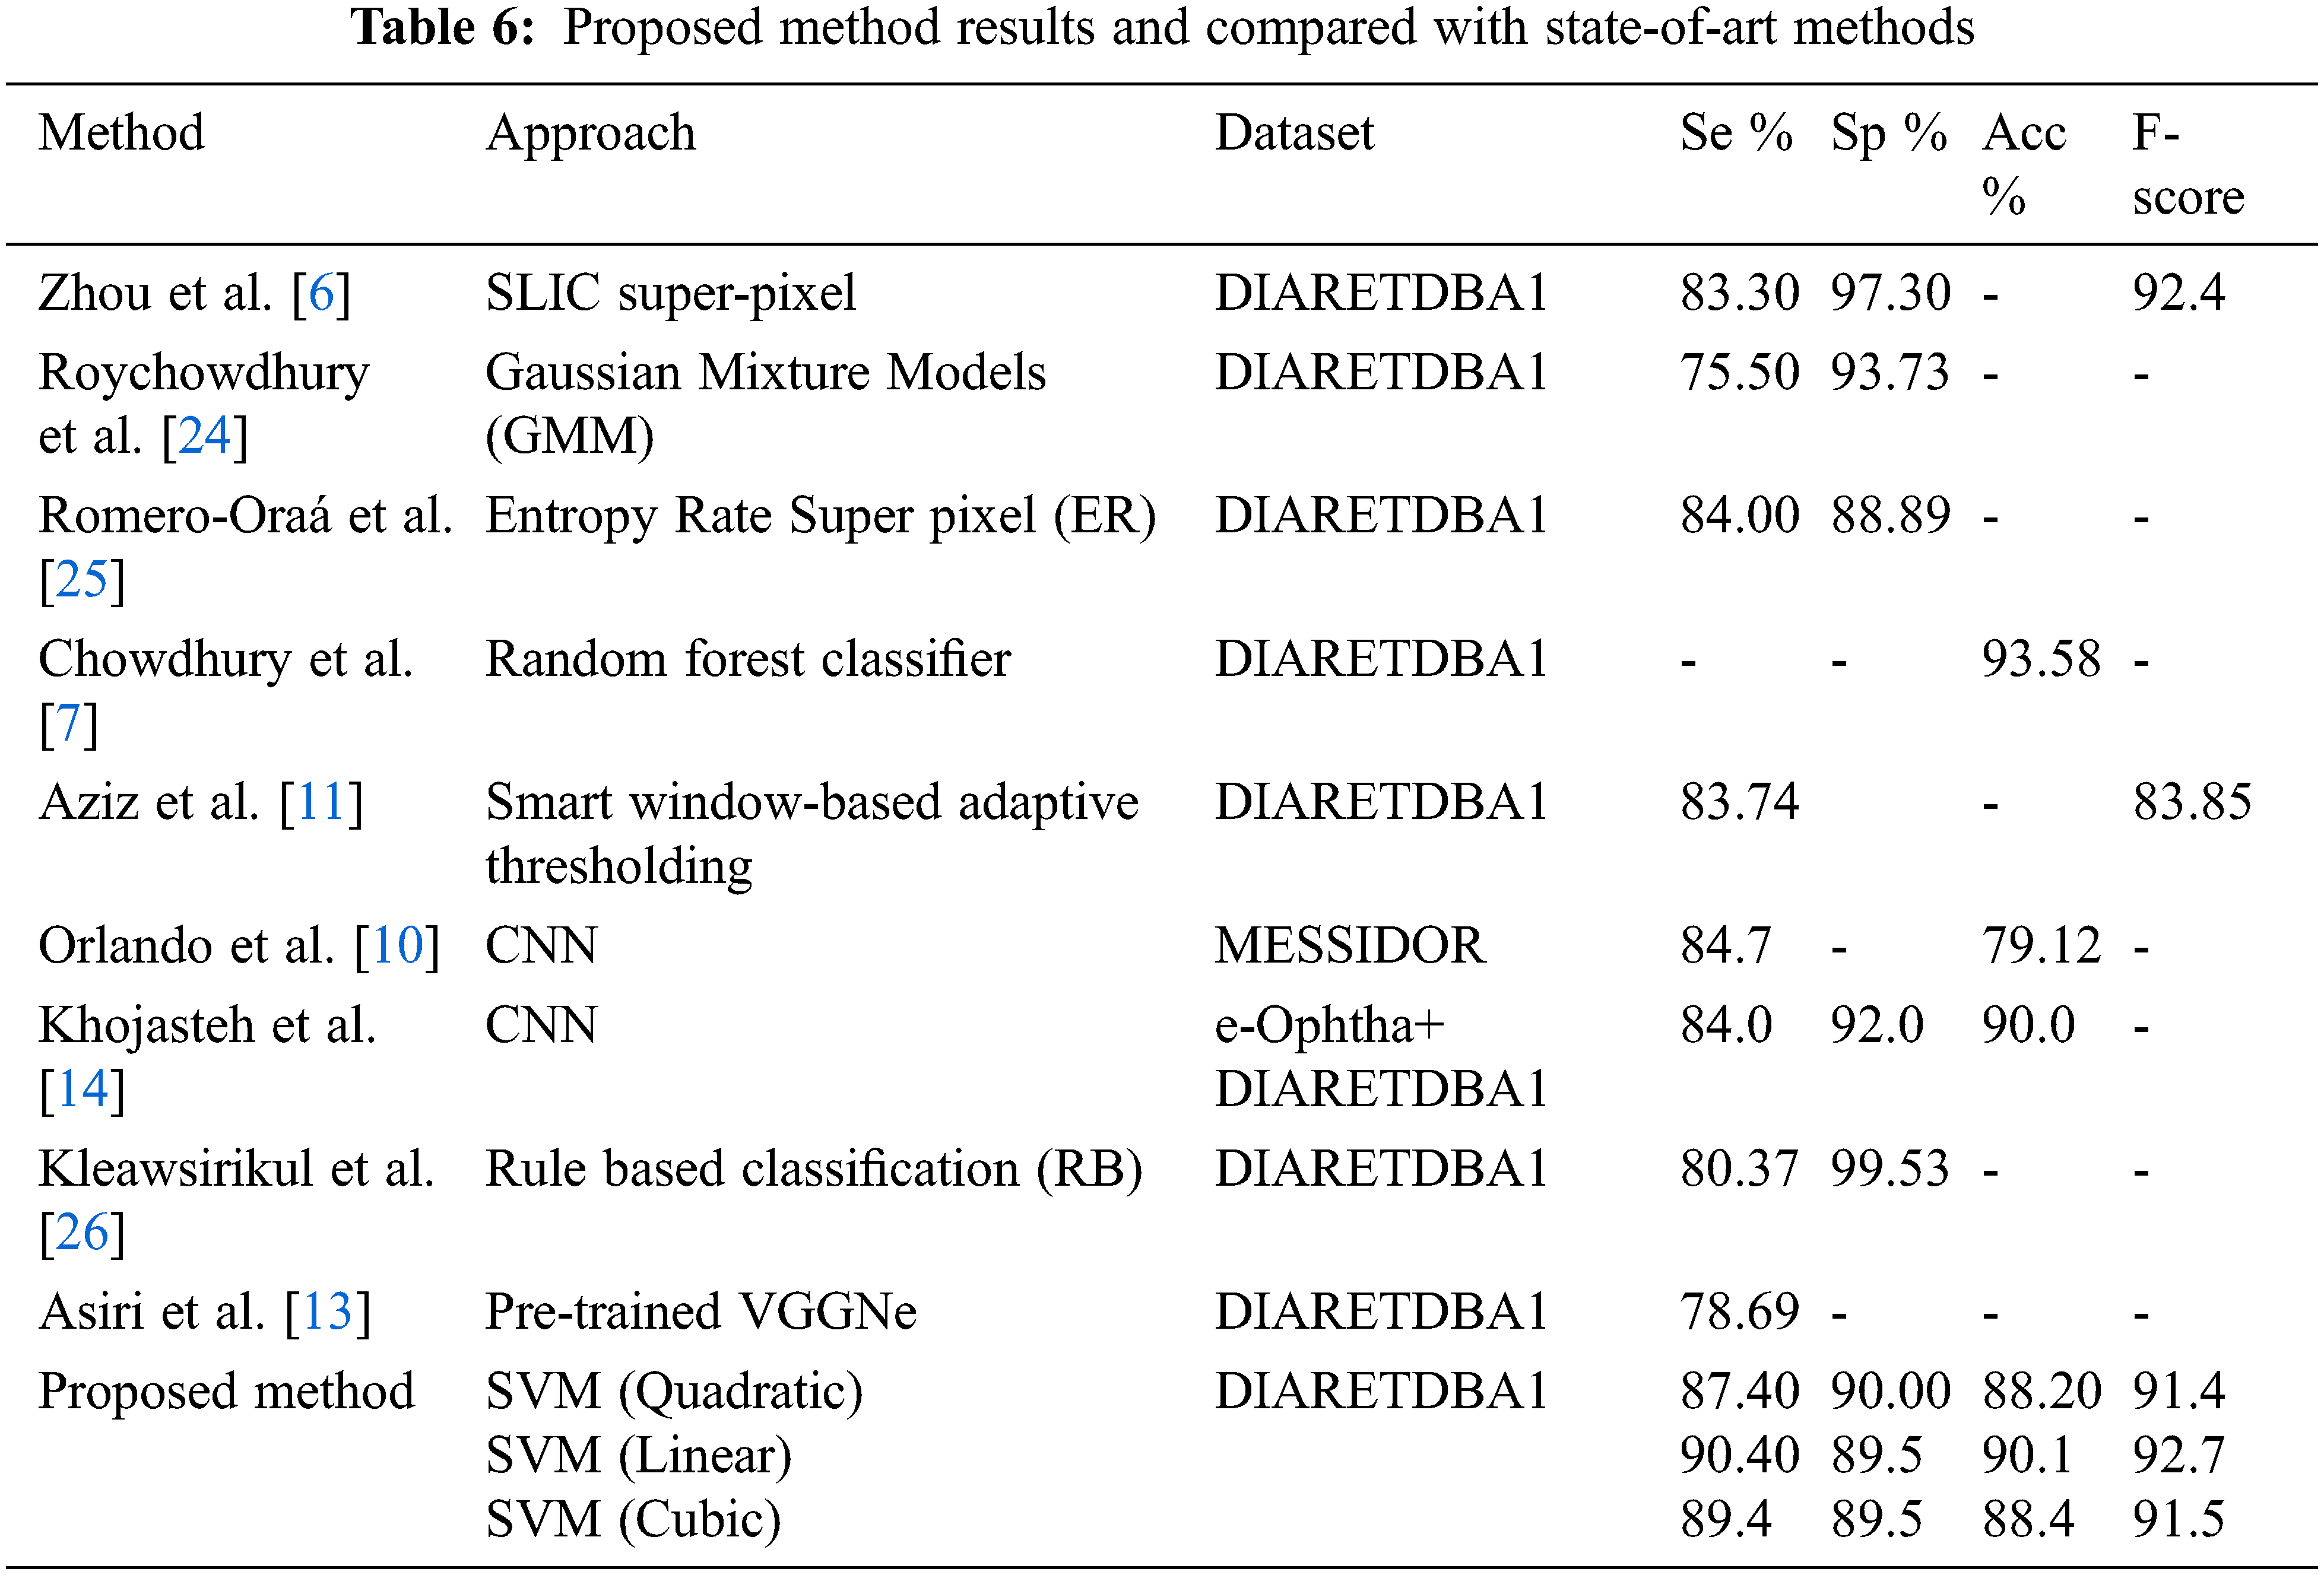
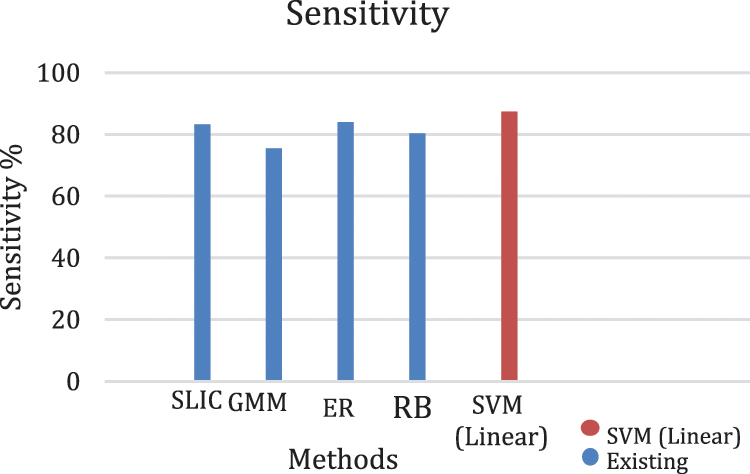
Figure 8: Graph of sensitivity of lesion classification
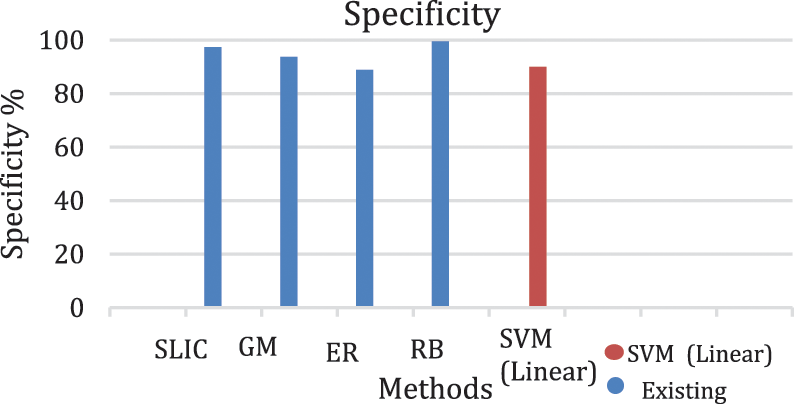
Figure 9: Graph of specificity of lesion classification
From Tabs. 3 to 5 we observe that Linear SVM classifier gives better results than Cubic SVM and Quadratic SVM with respect to sensitivity and accuracy and with respect to specificity Quadratic SVM gives better results as compared to other SVMs.
An efficient framework for the early diagnosis of DR diseases such as hemorrhages has been proposed in this paper .We have developed a new technique to detect and classify hemorrhages in retinal images. The proposed method consists of four steps; (i) normal objects in retinal images are detected and masked because these objects have the same features with hemorrhages that lead to misdiagnosis. (ii) The dark regions are extracted by using adaptive thresholding and top-hat morphological techniques. (iii) Statistical and pattern recognition features are extracted from each region (iv) SVM is used to classify the candidate dark regions as either hemorrhages or healthy.
We have achieved 90.4%, 89.5%, 90.1% and 92.7% for sensitivity, specificity, accuracy and F-score respectively. Further, the proposed method is compared with the state-of-art-methods.
In the future, we intend to collect a private dataset that contains more than a thousand images to apply deep learning classification techniques. Also we plan to detect and classify other types of DR diseases such as Micro-aneurysms.
Acknowledgement: The authors would like to express their gratitude to the ministry of education and the deanship of scientific research–Najran University–Kingdom of Saudi Arabia for their financial and technical support under code number NU/-/SERC/10/640.
Funding Statement: This work was supported by the ministry of education and the deanship of scientific research–Najran University–Kingdom of Saudi Arabia for their financial and technical support under code number NU/-/SERC/10/640.
Conflicts of Interest: The authors declare that they have no conflicts of interest to report regarding the present study.
1. T. G. Schmidt, R. E. Linderman, M. R. Strampe, T. Y. Chui, R. B. Rosen et al., “The utility of frame averaging for automated algorithms in analyzing retinal vascular biomarkers in AngioVue OCTA,” Translational Vision Science & Technology, vol. 8, no. 1, pp. 10–10, 2019. [Google Scholar]
2. R. T. Mamilla, V. K. R. Ede and P. R. Bhima, “Extraction of micro-aneurysms and hemorrhages from digital retinal images,” Journal of Medical and Biological Engineering, vol. 37, no. 3, pp. 395–408, 2017. [Google Scholar]
3. K. Adem, M. Hekim and S. Demir, “Detection of hemorrhage in retinal images using linear classifiers and iterative thresholding approaches based on firefly and particle swarm optimization algorithms,” Turkish Journal of Electrical Engineering & Computer Sciences, vol. 27, no. 1, pp. 499–515, 2019. [Google Scholar]
4. N. Sengar and M. K. Dutta, “Automated method for hierarchal detection and grading of diabetic retinopathy,” Computer Methods in Biomechanics and Biomedical Engineering: Imaging & Visualization, vol. 6, no. 6, pp. 649–659, 2018. [Google Scholar]
5. J. P. Bae, K. G. Kim, H. C. Kang, C. B. Jeong, K. H. Park et al., “A study on haemorrhage detection using hybrid method in fundus images,” Journal of Digital Imaging, vol. 24, no. 3, pp. 394–404, 2011. [Google Scholar]
6. W. Zhou, C. Wu, D. Chen, Z. Wang and Y. Yi et al., “Automated detection of red lesions using superpixel multichannel multifeature,” Computational and Mathematical Methods in Medicine, 2017. [Google Scholar]
7. A. R. Chowdhury, T. Chatterjee and S. Banerjee, “A random forest classifier-based approach in the detection of abnormalities in the retina,” Medical & Biological Engineering & Computing, vol. 57, no. 1, pp. 193–20, 2019. [Google Scholar]
8. Y. Hatanaka, T. Nakagawa, Y. Hayashi, T. Hara and H. Fujita, “Improvement of automated detection method of hemorrhages in fundus images,” in 2008 30th Annual Int. Conf. of the IEEE Engineering in Medicine and Biology Society, Vancouver, British Columbia, Canada, pp. 5429–5432, 2008. [Google Scholar]
9. L. Tang, M. Niemeijer, J. Reinhardt, M. Garvin and M. Abràmoff, “Splat feature classification with application to retinal haemorrhage detection in fundus images,” IEEE Transactions on Medical Imaging, vol. 32, no. 2, pp. 364–375, 2012. [Google Scholar]
10. J. I. Orlando, E. Prokofyeva, M. Del Fresno and M. B. Blaschko, “An ensemble deep learning based approach for red lesion detection in fundus images,” Computer Methods and Programs in Biomedicine, vol. 153, pp. 115–127, 2018. [Google Scholar]
11. T. Aziz, A. E. Ilesanmi and C. Charoenlarpnopparut, “Efficient and accurate hemorrhages detection in retinal fundus images using smart window features,” Applied Sciences, vol. 11, no. 14, pp. 6391, 2021. [Google Scholar]
12. S. Maqsood, R. Damaševičius and R. Maskeliūnas, “Hemorrhage detection based on 3D CNN deep learning framework and feature fusion for evaluating retinal abnormality in diabetic patients,” Sensors, vol. 21, no. 11, pp. 3865, 2021. [Google Scholar]
13. N. Asiri, M. Hussain, F. Al Adel and H. Aboalsamh, “A deep learning-based unified framework for red lesions detection on retinal fundus images,” arXiv preprint arXiv: 2109.05021, 2021. [Google Scholar]
14. P. Khojasteh, B. Aliahmad and D. K. Kumar, “Fundus images analysis using deep features for detection of exudates, hemorrhages and micro-aneurysms,” BMC Ophthalmology, vol. 18, no. 1, pp. 1–13, 2018. [Google Scholar]
15. Y. Huang, L. Lin, M. Li, J. Wu, P. Wang et al., “Automated hemorrhage detection from coarsely annotated fundus images in diabetic retinopathy,” in Proc. of the 2020 IEEE 17th Int. Symp. on Biomedical Imaging (ISBI), Iowa City, IA, USA, pp. 1369–1372, 2020. [Google Scholar]
16. T. M. Al Sariera, and L. Rangarajan, “Extraction of blood vessels in retina,” Journal of Information Technology Research (JITR), vol. 11, no. 4, pp. 122–13, 2018. [Google Scholar]
17. T. M. Al Sariera, L. Rangarajan and R. Amarnath, “Detection and classification of hard exudates in retinal image,” Journal of Intelligent & Fuzzy Systems, vol. 38, no. 2, pp. 1943–194, 2020. [Google Scholar]
18. D. Ioannou, W. Huda and A. F. Laine, “Circle recognition through a 2D hough transform and radius histogramming,” Image and Vision Computing, vol. 17, no. 1, pp. 15–26, 1999. [Google Scholar]
19. S. C. Lee and Y. Wang, “A general algorithm of recognizing small, vague and imager-alike objects in a non-uniformly illuminated medical diagnostic image,” in Conf. Record of Thirty-Second Asilomar Conf. on Signals, Systems and Computers, Pacific Grove, CA, USA, pp. 941–943, 1998. [Google Scholar]
20. R. V. J. P. H. Kälviäinen and H. Uusitalo, “DIARETDB1 diabetic retinopathy database and evaluation protocol,” in Medical Image Understanding and Analysis, vol. 2007, pp. 61, 2007. [Google Scholar]
21. T. Walter, J. C. Klein, P. Massin and A. Erginay, “A contribution of image processing to the diagnosis of diabetic retinopathy-detection of exudates in color fundus images of the human retina,” IEEE Transactions on Medical Imaging, vol. 21, no. 10, pp. 1236–1243, 2002. [Google Scholar]
22. C. A. Lupascu, D. Tegolo and L. Di Rosa, “Automated detection of optic disc location in retinal images,” in 21st IEEE Int. Symp. on Computer-Based Medical Systems, Jyväskylä, Finland, pp. 17–22, 2008. [Google Scholar]
23. S. Bharkad, “Automatic segmentation of optic disk in retinal images,” Biomedical Signal Processing and Control, vol. 31, pp. 483–498, 2017. [Google Scholar]
24. S. Roychowdhury, D. D. Koozekanani and K. K. Parhi, “Screening fundus images for diabetic retinopathy,” in Proc. of the 2012 Conf. Record of the Forty Sixth Asilomar Conf. on Signals, Systems and Computers (ASILOMAR), Pacific Grove, CA, USA, pp. 1641–1645, 2012. [Google Scholar]
25. R. Romero-Oraá, J. Jiménez-García, M. García, M. I. López-Gálvez, J. Oraá-Pérez et al., “Entropy rate superpixel classification for automatic red lesion detection in fundus images,” Entropy, vol. 21, no. 4, pp. 417, 2019. [Google Scholar]
26. N. Kleawsirikul, S. Gulati and B. Uyyanonvara, “Automated retinal hemorrhage detection using morphological top hat and rule-based classification,” in 3rd Int. Conf. on Intelligent Computational Systems, singapore, pp. 39–43, 2013. [Google Scholar]
 | This work is licensed under a Creative Commons Attribution 4.0 International License, which permits unrestricted use, distribution, and reproduction in any medium, provided the original work is properly cited. |