DOI:10.32604/csse.2023.025399
| Computer Systems Science & Engineering DOI:10.32604/csse.2023.025399 | |
| Article |
Novel Contiguous Cross Propagation Neural Network Built CAD for Lung Cancer
1Department of Electronics & Communication Engineering, Government College of Engineering, Tirunelveli, 627007, Tamilnadu, India
2Department of Electrical & Electronics Engineering, University College of Engineering, Ramanathapuram, 623513, Tamilnadu, India
*Corresponding Author: A. Alice Blessie. Email: blessieharris@gmail.com
Received: 22 November 2021; Accepted: 16 February 2022
Abstract: The present progress of visual-based detection of the diseased area of a malady plays an essential part in the medical field. In that case, the image processing is performed to improve the image data, wherein it inhibits unintended distortion of image features or it enhances further processing in various applications and fields. This helps to show better results especially for diagnosing diseases. Of late the early prediction of cancer is necessary to prevent disease-causing problems. This work is proposed to identify lung cancer using lung computed tomography (CT) scan images. It helps to identify cancer cells’ affected areas. In the present work, the original input image from Lung Image Database Consortium (LIDC) typically suffers from noise problems. To overcome this, the Gabor filter used for image processing is highly enhanced. In the next stage, the Spherical Iterative Refinement Clustering (SIRC) algorithm identifies cancer-suspected areas on the CT scan image. This approach can help radiologists and medical experts recognize cancer diseases and syndromes so that serious progress can be avoided in the early stages. These new methods help to remove unwanted portions of the CT image and better utilization the image. The subspace extraction of features approach is beneficial for evaluating lung cancer. This paper introduces a novel approach called Contiguous Cross Propagation Neural Network that tends to locate regions afflicted by lung cancer using CT scan pictures (CCPNN). By using the feature values from the fourth step of the procedure, the proposed CCPNN tends to categorize the lesion in the lung nodular site. The efficiency of the suggested CCPNN approach is evaluated using classification metrics such as recall (%), precision (%), F-measure (percent), and accuracy (%). Finally, the incorrect classification ratios are determined to compare the trained networks’ effectiveness, through these parameters of CCPNN, it obtains the outstanding performance of 98.06% and it has provided the lowest false ratio of 1.8%.
Keywords: Contiguous cross propagation neural network (CCPNN); Gabor filter techniques; spherical iterative refinement clustering (SIRC); lung cancer detection
Image processing is used in the core area of a respective field. It is used to identify the areas of cancer that affect the lung’s image. Through image processing techniques such as noise removal, feature extraction, affected areas are mainly initiated for identification to identify lung cancer. The affected area can be compared with historical data on Lung Cancer (LC). Many images are processed by digital image processing technology in the aggregation of different shapes into a single unit.
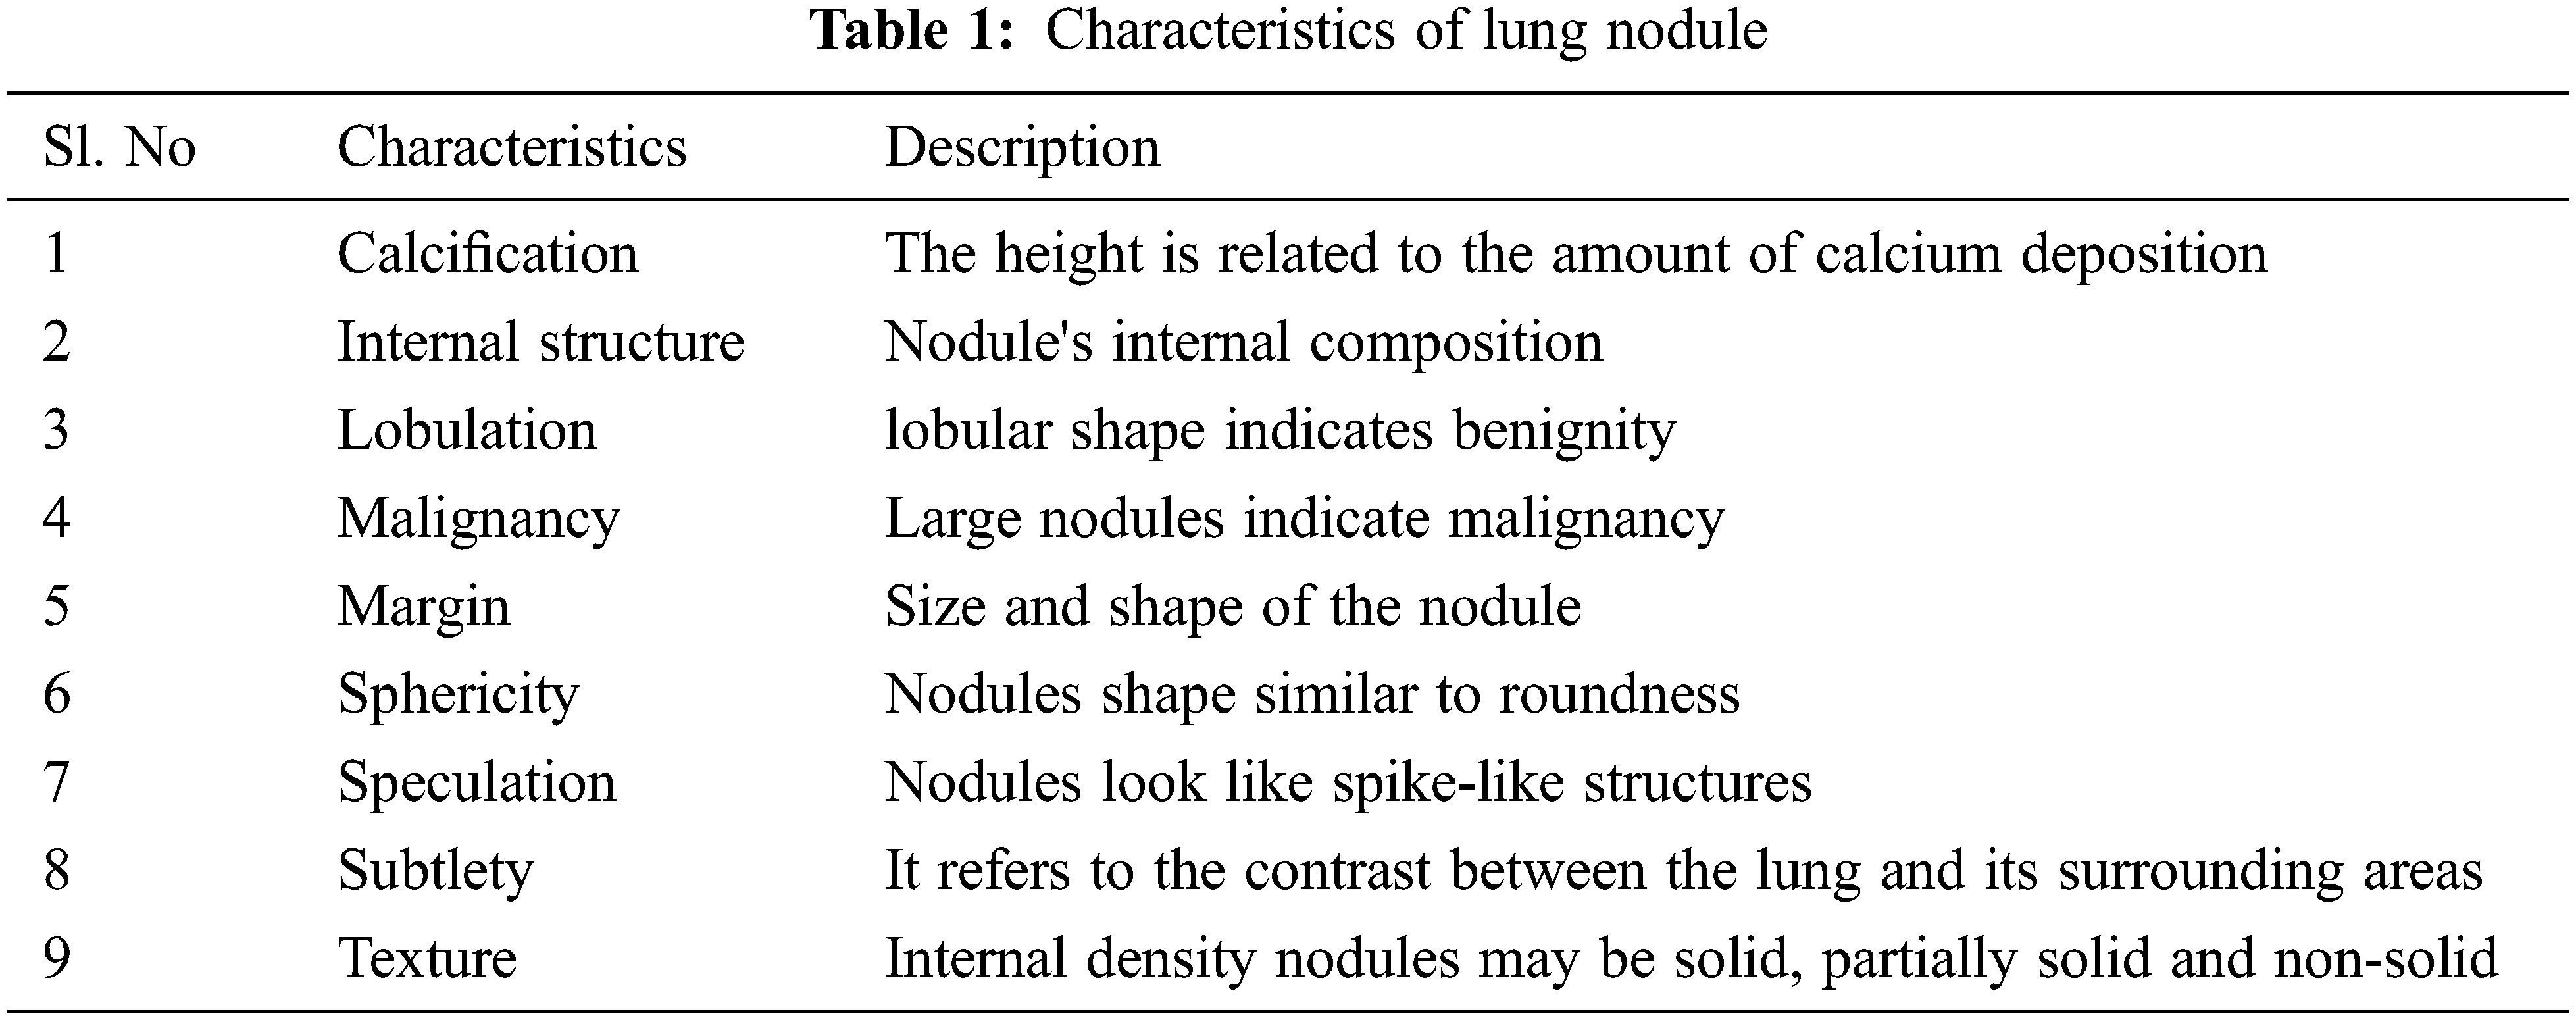
Fig. 1 represents the functional block diagram for LC detection using image processing. Previously, various methods were used based on manual learning methods to help radiologists develop a diagnosis pattern. This work utilizes a CCPNN method established through Computer-Aided Diagnosis (CAD) systems to evaluate and categorize nodules through CT image investigation to deliver radiologists’ support and introduce different synthesis investigation methods. Based on the characteristics listed in Tab. 1, the nodules can be recognized. The radiologists do not consider the nodules based on calcification and internal structure. Other characters such as lobulation, malignancy, and speculation are associated with the nodule's size and shape. Margin and sphericity are packed together only by their shape; whereas subtlety deals with contrast management between the nodule and its neighboring structure.
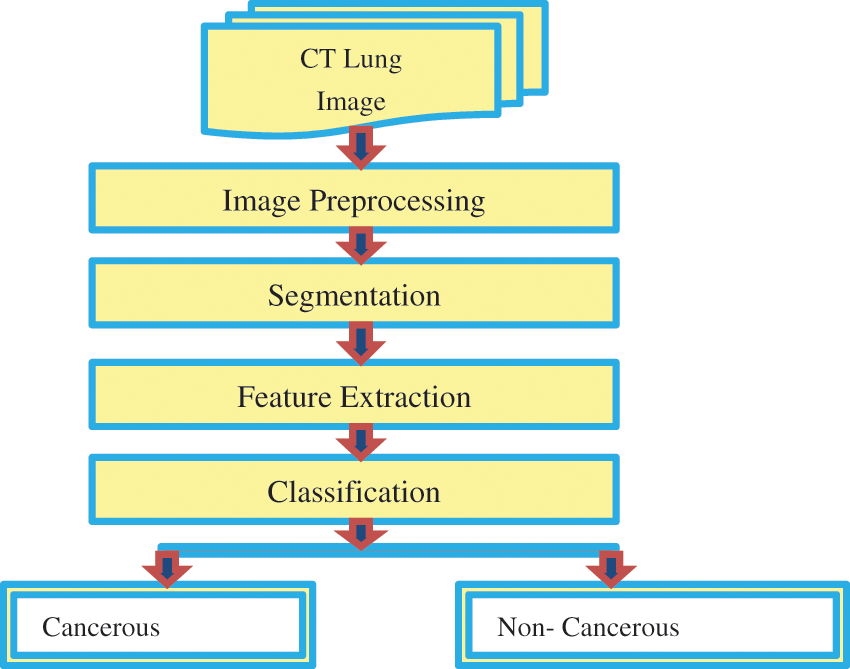
Figure 1: Functional block diagram for lung cancer detection
Based on the image processing techniques initially, the LIDC dataset is utilized for the Lung Cancer (LC) detection; and the processing of pre-processing, feature extraction, and classification is performed using the image of a biological excitation method. The Gabor filter is applied to reduce noise in the original input image. The Spherical Iterative Refinement Clustering (SIRC) algorithm segmentation process detects lung cancer in a CT image. The performance of feature selection reveals some information on the effects. Excitation is applied to a biological feature matching search method to find the desired and suspected image. Finally, the Contiguous Cross Propagation Neural Network (CCPNN) classification will be validated using the precision (%), recall (%), F-measure (%), and accuracy (%) ratio.
This chapter discusses a study conducted by a community of researchers with lung cancer. This section's detailed evaluation uses image processing technology on various researchers’ medical data, lung cancer analysis, image segmentation and classification algorithm, and its research work.
The acquisition of CT scan images in the lungs of pulmonary nodules does not fully specify cancer. The shape and size of the nodules, as well as the variation in their shape and size, have an underlying and complicated link to malignancy. As a result, comprehensive examination is required. in combining each suspicious nodule and each nodule's information [1]. An appropriate combination of an adaptive thresholding algorithm for the input image has been segmented in this method. A known image SVM classification algorithm has been used to classify lung tumors, and content-based image retrieval technology has been used as well. The comparative contract is established as lung, strength, texture and shape of the image and other features [2]. The image processing technology is mainly used to predict lung cancer, early detection and treatment of lung cancer. Thus various characteristics of patients are considered to be a predictive image, based on a neural network to extract predicted lung cancer [3]. Although the problem with nodule detection is the high interclass variation which is extremely unbalanced, our approach detects lung nodules and effectively predicts cancer. Also, almost perfect recall is used to design candidate solutions [4–6].
Automatic digital chest X-ray (CXR) images effectively and efficiently locate the lung area that is very important in computer-aided diagnosis. The adaptive pre-processing method proposed in this work uses the segmented image CXR lung region based on the Convolutional Neural Network (CNN-based) architecture [7]. This article proposes deep learning (DNN) based on LC detection. This alternative rapid screening method can detect LC in the chest by analyzing the patient's X-ray, who will look for a visual indicator. Radiographic imaging of patients [8–10] method comprises three main parts, i.e., clustering algorithm, extracting and using particle swarm optimization, 2D select and detecting an initial application to the feature region by dividing the multilevel thresholding best interests projecting extraction and lung parenchyma nodule candidate and further reduces false positives through an iterative analysis 3D capabilities [11–15].
Bronchoscope Guided Bronchoalveolar Lavage (BAL) is based on analysis of bronchial epithelial cells from a patient and extracted substances, minimally invasive diagnostic techniques X-ray computed tomographic image of the present low-dose screening suspected pulmonary masses [16]. In this system, a multi-resolution residual network-based DNN method is proposed for the involuntary segmentation of lung tumors [17–20]. The segmentation process will cause the lung tissue to be separated from the rest of the image. Only the examined lung tissue is considered a candidate area for lung detection of malignant nodules. The abnormal region may be used for feature vectors which are classified using a fuzzy neural classifier and the calculated area [21–25].
A CAD-based lung cancer detection has been proposed by Diego Riquelme and Moulay A. Akhloufi (2020). The detection of the lung nodules through a machine learning strategy has been established. The classification of the lesions through the CAD system help emphasize the cancerous nodules [26]. In addition, the false positive data has been deducted using the technique. But with more datasets, the efficiency of the classification can be enhanced.
An autoencoder-based classification of the cancerous lung nodules has been established by Bhavanishankar and Sudhamani (2019). A deep learning-based classification of the lesion for precise classification has been utilized in which the segmented lesion has been given as the output of the autoencoder to enable the classification [27]. The cancerous and noncancerous nodules are classified which helps classify the absolute malady. The backlog of the proposed module deals with the complexity in the output that may occur due to improper input from the segmentation of the lesion.
The computer-Aided Diagnosis (CAD) is the current computer analysis application of medical images and is widely used to detect and diagnose medical imaging abnormalities. The CAD system contains several steps to identify lung cancer. The steps are: (1) lung segmentation or preprocessing (2) nodule detection (3) nodule segmentation (4) feature extraction (5) classification [1]. As shown in Fig. 2, the CAD system detects LC using a set of algorithms. Before processing the image, a pre-processing step occurs. Pre-processing removes noise from a CT image and improves image quality with Gabor filters to separate the lung region from the CT image.
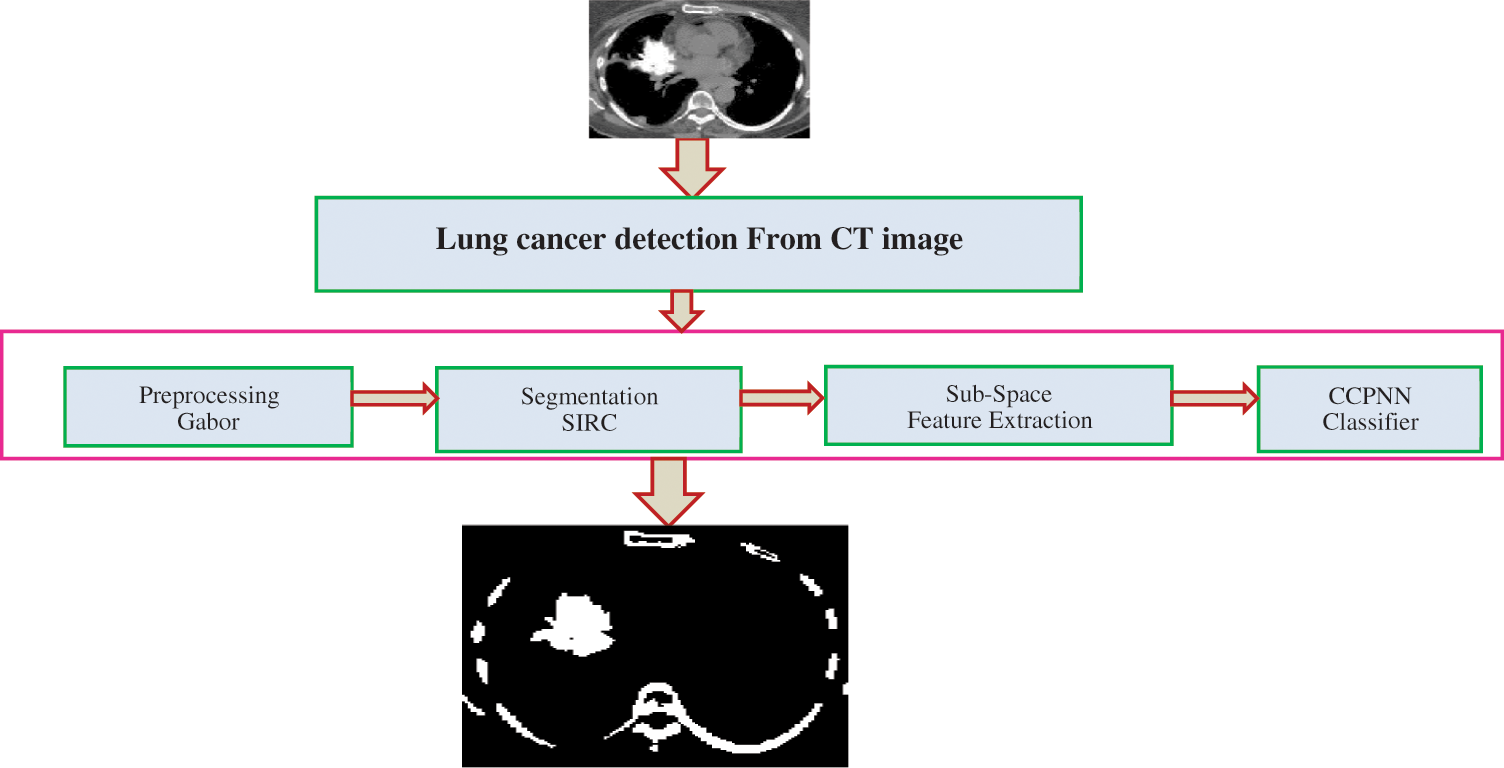
Figure 2: Proposed lung cancer detection
The next step process is the lung nodule detection based on the Spherical Iterative Refinement Clustering (SIRC) algorithm in the pre-processing image. Once the nodule is detected and segmented, the next process is to determine whether the nodule is benign or malignant. The sub-space feature extraction is utilized for extracting the selection of features from the segmented image. Finally, the Contiguous Cross Propagation Neural Network (CCPNN) will find the Cancerous and Non-Cancerous stages based on the parameters like Recall (%), Precision (%), F-measure (%) and Accuracy (%).
3.1 Gabor Filter Based Pre-Processing
It represents an excellent local Configuration and multistate decomposition of the image based on the Gabor function process. These logs are simultaneously (and optimally) positioned in the spatial and frequency domain. Gabor filter is a linear filter whose impulse response, by multiplying a harmonic function, is a Gaussian function defined. The main purpose is to focus on the two textures corresponding to different situations. Thus, the filter design algorithm proposed seeks to provide a Gabor filter to generate tons (M, N) step change. It is determined based on most of the Gabor filter parameters (P, Q, and S). Fig. 3 depicts (a) the original image, and (b) the enhanced image using Gabor filters.
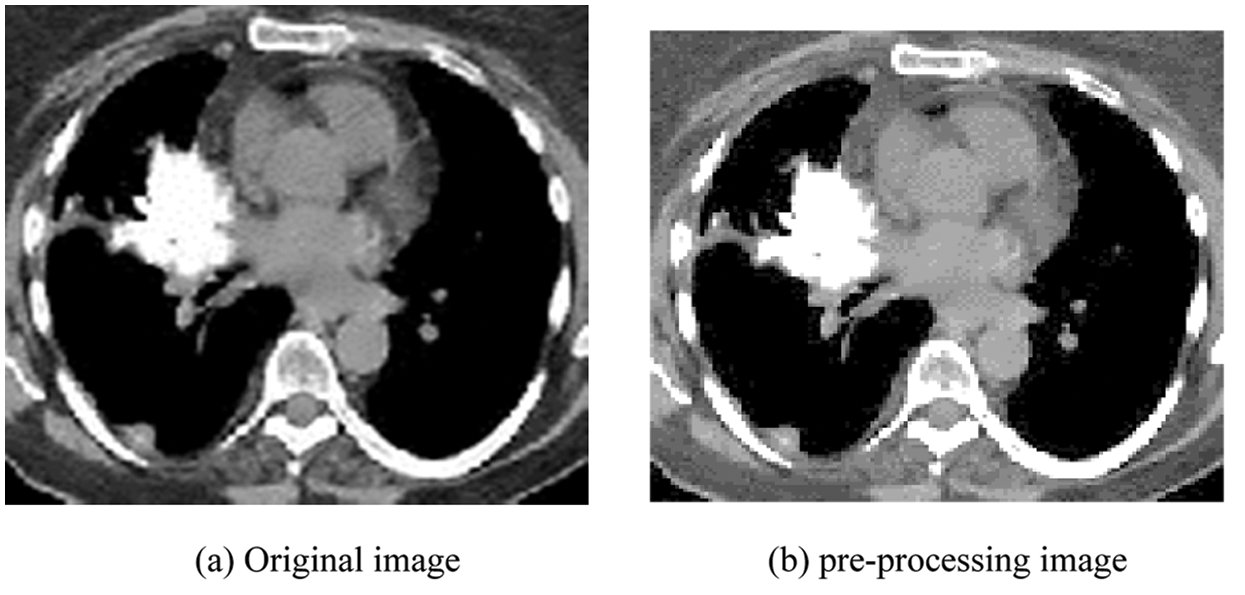
Figure 3: (a) Original image (b) pre-processing image
Gabor Filtering Algorithm:
Step 1: Choose values for P, Q, S
Step 2: Then transform the input image into a 2D matrix, say I (M, N)
Step 3: Compute the impulse response of the filter by the following formula h, (this is also a 2D matrix); values are as follows:
Step 4: Estimate the convolution (M, N) of I and M (M, N), for example, t (M, N), which is the matrix corresponding to the output image.
where Oh denotes the filter
Step 5: Print out the image. If this is a good thing, effectively distinguish between the two textures, stop. Otherwise, go to step 1, select the other P, Q, S & repeat the above steps
3.2 Spherical Iterative Refinement Clustering (SIRC) Algorithms
Clustering algorithms are widely used for data segmentation in the cluster, defined by the user. The proposed SIRC clustering is the most popular and widespread used algorithm, because of its simplicity and less calculation time. The segmented lung of the selected cluster number 3 contains three groups of regions: soft tissue, background and tumor Bronchioles The least probability cluster is extracted from the partition Cluster image. The other two regions have a larger probability because they cover a larger space except for the tumor. Then the segmentation vector is converted into 3D image data. The segmented image is shown in Fig. 4.
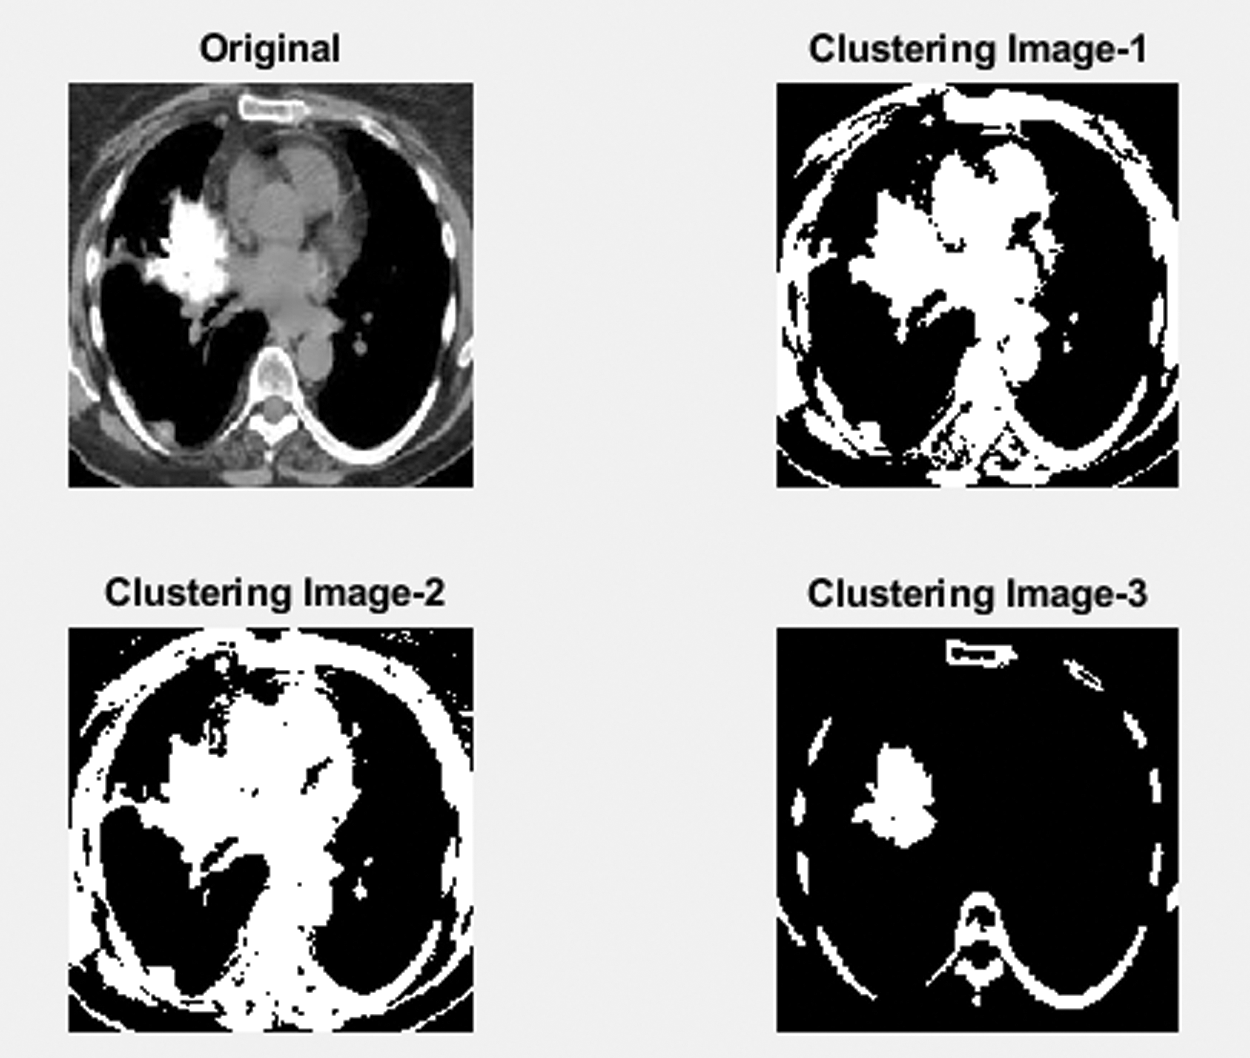
Figure 4: Clustering segmented image
Spherical Iterative Refinement Clustering (SIRC) Algorithms:
The Spherical Iterative Refinement Clustering (SIRC) algorithm can be adapted to use the cosine similarity measure to produce a spherical iterative refinement clustering algorithm, so named because the vector operations on the algorithm lie on the unit sphere. As it uses cosine similarity, the sphere utilizes the spherical and efficiency of document vectors.
Step 1: Start with a partitioning
Step 2: For each document vector
Step 3: Next compute the new partitioning
Step 4: The calculation corresponds to the new concept vector calculated in (4) partition;
Step 5: If
As pointed out in (5), it can be seen that the above algorithm is a gradient ascent scheme; that is, the objective function value is increased from one iteration to the next. However, like any gradient ascent embodiment, the Spherical Iterative Refinement Clustering (SIRC) algorithm is prone to local maxima.
3.3 Subspace Feature Extraction Method
The function of the Subspace Feature Extraction (SFE) Method system is used to detect angles of interest (points of interest) values in the segmentation images. The algorithm is matrixes with better corner points. The dots are used for corner detection tests at image patches. The SFE is structured for the segmented data and is used to interface this weighing data, a close approach.
Algorithm Steps:
Step 1: Initialize the input image, and T is an iterative threshold with a value of 'L' in this system.
Step 2: Find the pixel value of the data variance.
Step 3: The input image defines the optimal threshold value of the image, and the feature of the image is extracted.
Step 4: The image boundary value is measured by
where T is constant of the image shape.
Step 5: The metrics calculation based on the image pixel value is analyzed.
Step 6: Extract the image feature in the proposed system.
Step 7: End.
3.4 Contiguous Cross Propagation Neural Network (CCPNN) Classifier
A medical diagnostic input feature may be used with a set or subset of pattern recognition and classification of human disease, difficult to complete. The information processing system using the proposed example CCPNN is fed in a forward propagation neural network. The CCPNN is having a CCPNN algorithm, where the weights are adjusted such that the desired output and the error between the actual output 200 training inputs are used to reduce the training set. Continue the training cycle, so to achieve a mean square error. Texture feature extraction, where neurons are placed in the feature extraction classifier in the input layer, corresponds to the texture setting feed. The basic structure is shown below in Fig. 5 with the CCPNN algorithm. Only one neuron in the output layer is disposed of, whose output is 0 or 1 It represents a class benign and malignant, benign, and malignant performing so-called two-class classification.
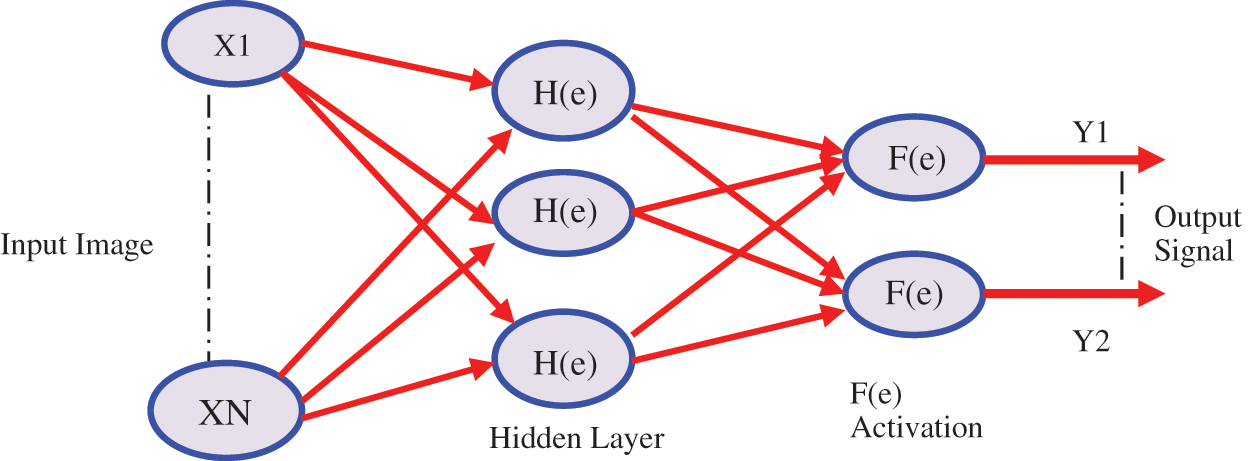
Figure 5: Contiguous cross propagation neural network (CCPNN)
3.4.1 Contiguous Cross Propagation Neural Network (CCPNN) Algorithm Steps
After the image feature extraction process is classified, the feature is extracted using the Contiguous Cross Propagation Neural Network (CCPNN) algorithm.
Step 1: Design input parameters and neural network structure, which is represented in Fig. 1.
Step 2: Initialize the weight value W random value.
Step 3: Input target matrix T and training data Matrix X.
Step 4: Calculate the output vector of each unit in the neural network. Compute the value of the output vector H in the hidden layer.
where,
Step 5: Evaluate the error value a.; evaluate the error value of the output layer and evaluate the hidden layer’s error value.
where,
Step 6: Calculate the corrected values of W and ϴ, and ɑ as the learning rate parameter also compute the medication value of W and ϴ in the output layer.
Step 7: compute the medication value of W and ϴ in the hidden layer.
Step 8: Restore the values of W and ϴ in the output layer.
i) Restore the values of W and ϴ in the hidden layer
Step 9: Repeat from 3 to 8 for each input layer.
Step 10: stop the process.
Precision: It is a class of effective positive samples packet number ratio to the total number of tests.
Recall: This is a valid grouping of some positive specimens, classified as positive in proportion to the test data amount.
F-measure: It is accurate, and recalls the harmonic mean which is given by the following formula.
Accuracy: This is the total number of accurately characterized tests divided by the total number of tests delegated to pass below the conditions given.
where TPR = True positive state, TNR = True negative state, FPR = Fasle positive state, and FNR = Fasle negative state
The proposed Contiguous Cross Propagation Neural Network (CCPNN) algorithm is analyzed in the MATLAB 2017b possibly the most common data manipulation and operating software in two-dimensional data and progress. This is according to the specific operations of image processing. This belongs to the method for displaying and analyzing each of the simulation results. Information inspector view confirmation signals are uploaded from multiple analogy data and data groups or analysis of ongoing simulations.
Fig. 6 shows a part of the Lung image LIDC dataset in the MATLAB GUI model. This figure represents three stages of finding the Lung images obtained from the LIDC dataset and the unwanted removal noise in the obtained image using the proposed Gabor filter. The second stage of the process identifies the mass region in the pre-processing image and based on region-based analysis, the suspicious regions will be identified. Finally, based on the feature’s values, the proposed CCPNN algorithm classification will classify cancerous and non-Cancerous states. The normal lung image processing is displayed in Tab. 2.
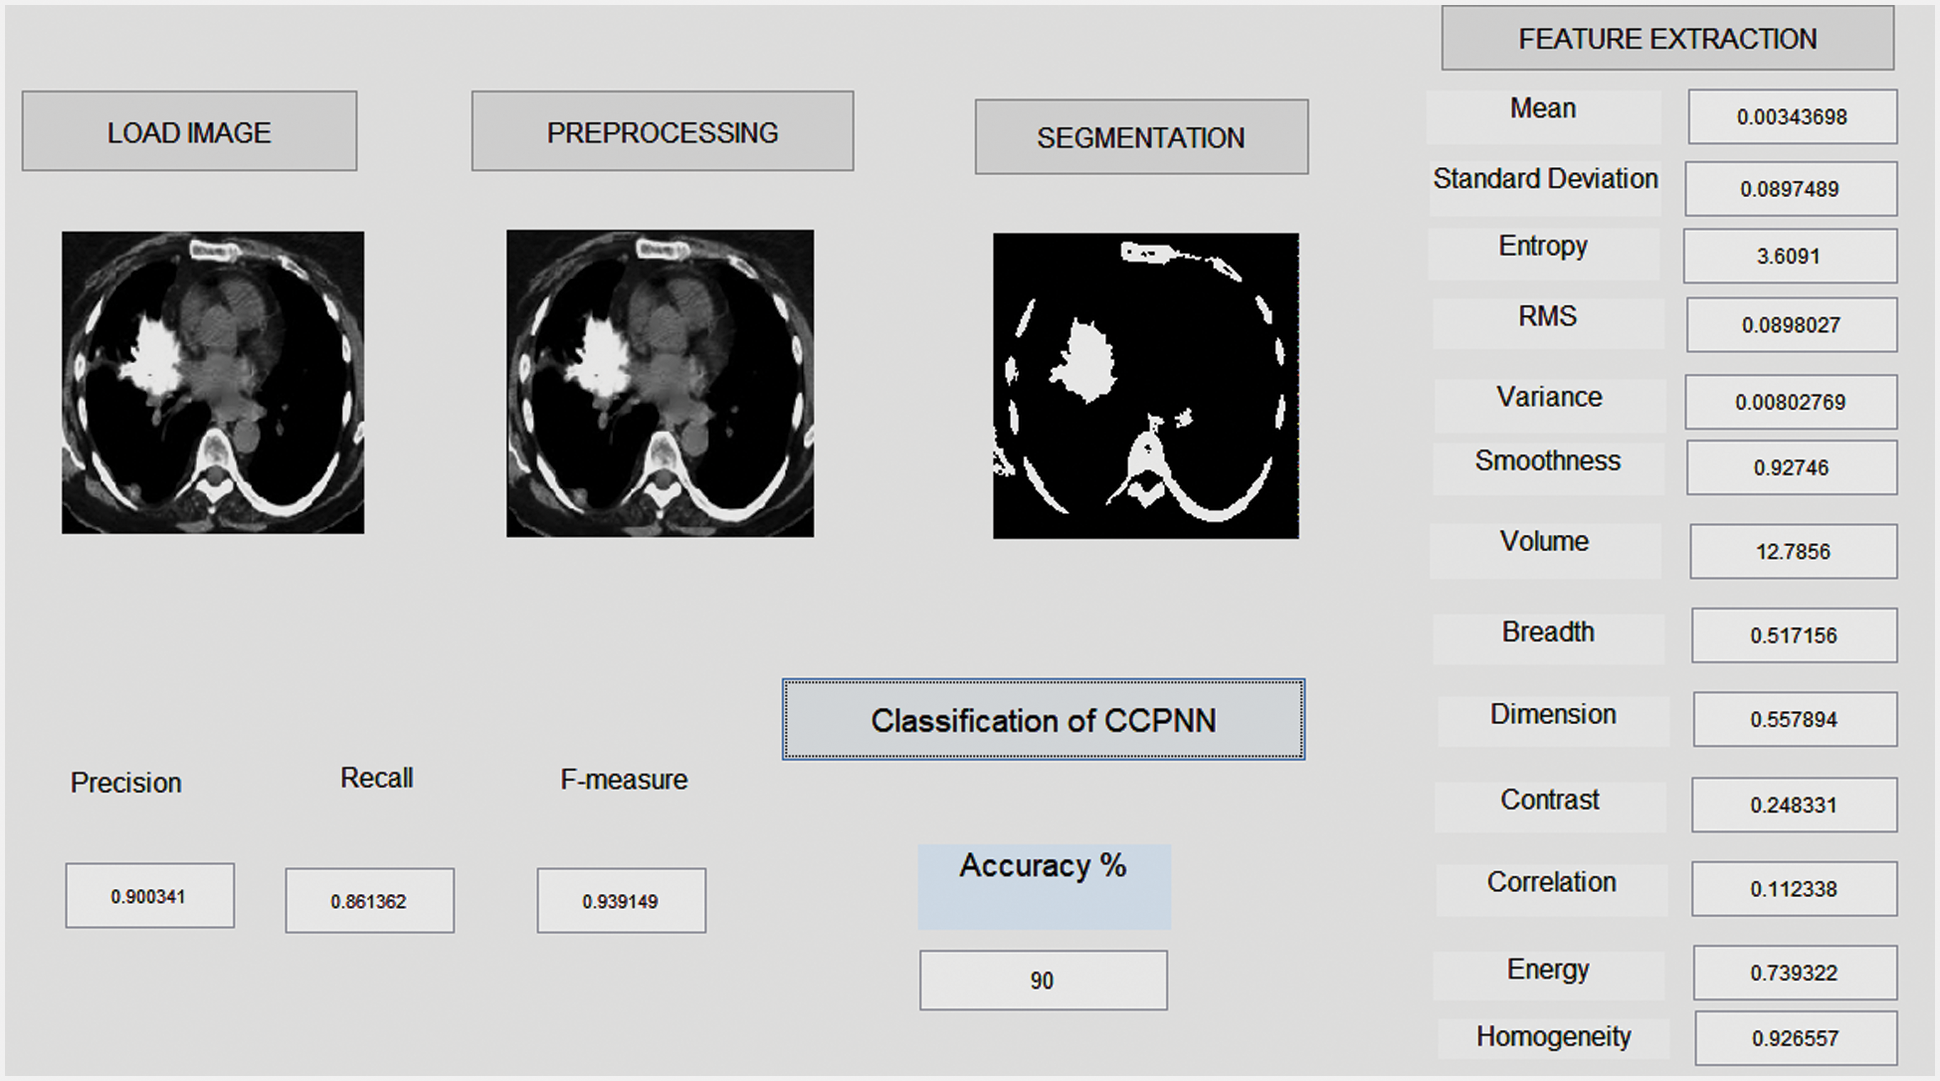
Figure 6: Lung cancer detection using image processing
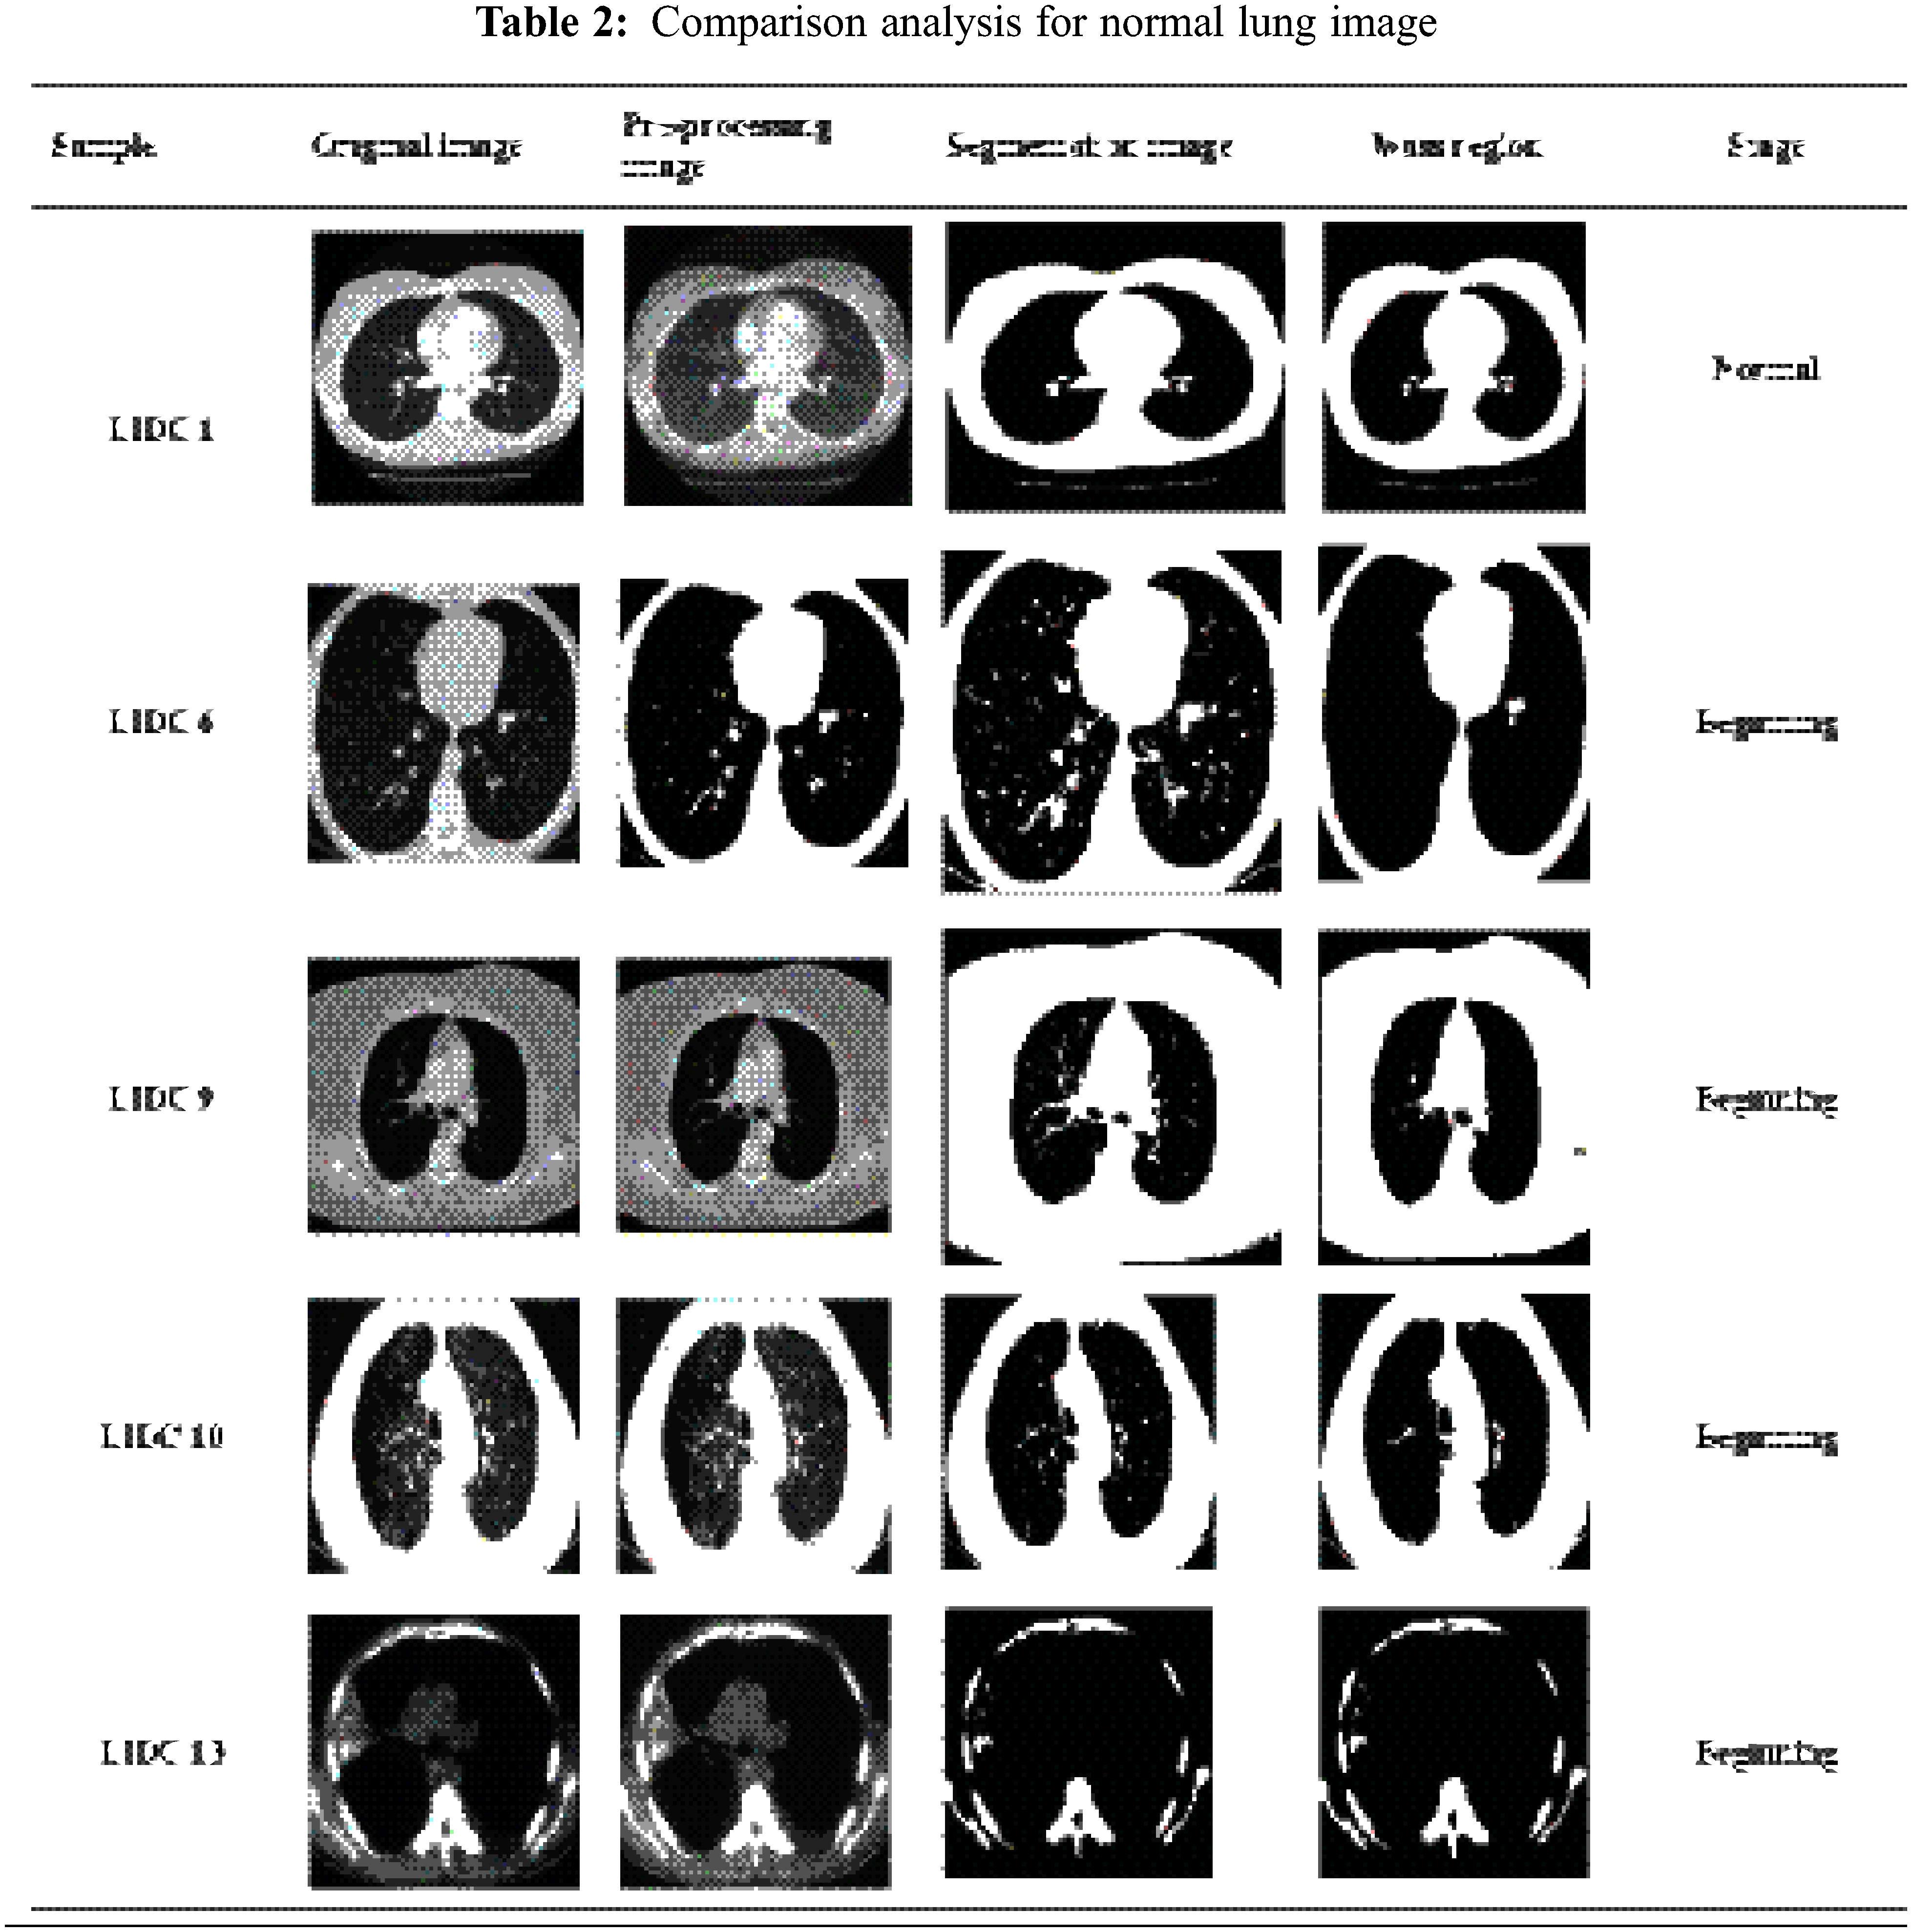
Fig. 7 shows a part of CT lung nodule image detection for the normal CT image. In the initial stage, using the Gabor filter, unwanted noise in the original image is removed. The next step finds the Lung nodules by separating the segmentation using the LICA detection technique. In the third process, Multi sub-space feature extraction features values are calculated by the proposed Contiguous Cross Propagation Neural Network (CCPNN) algorithm classification that will identify the LN level based on TPR and TNR values.
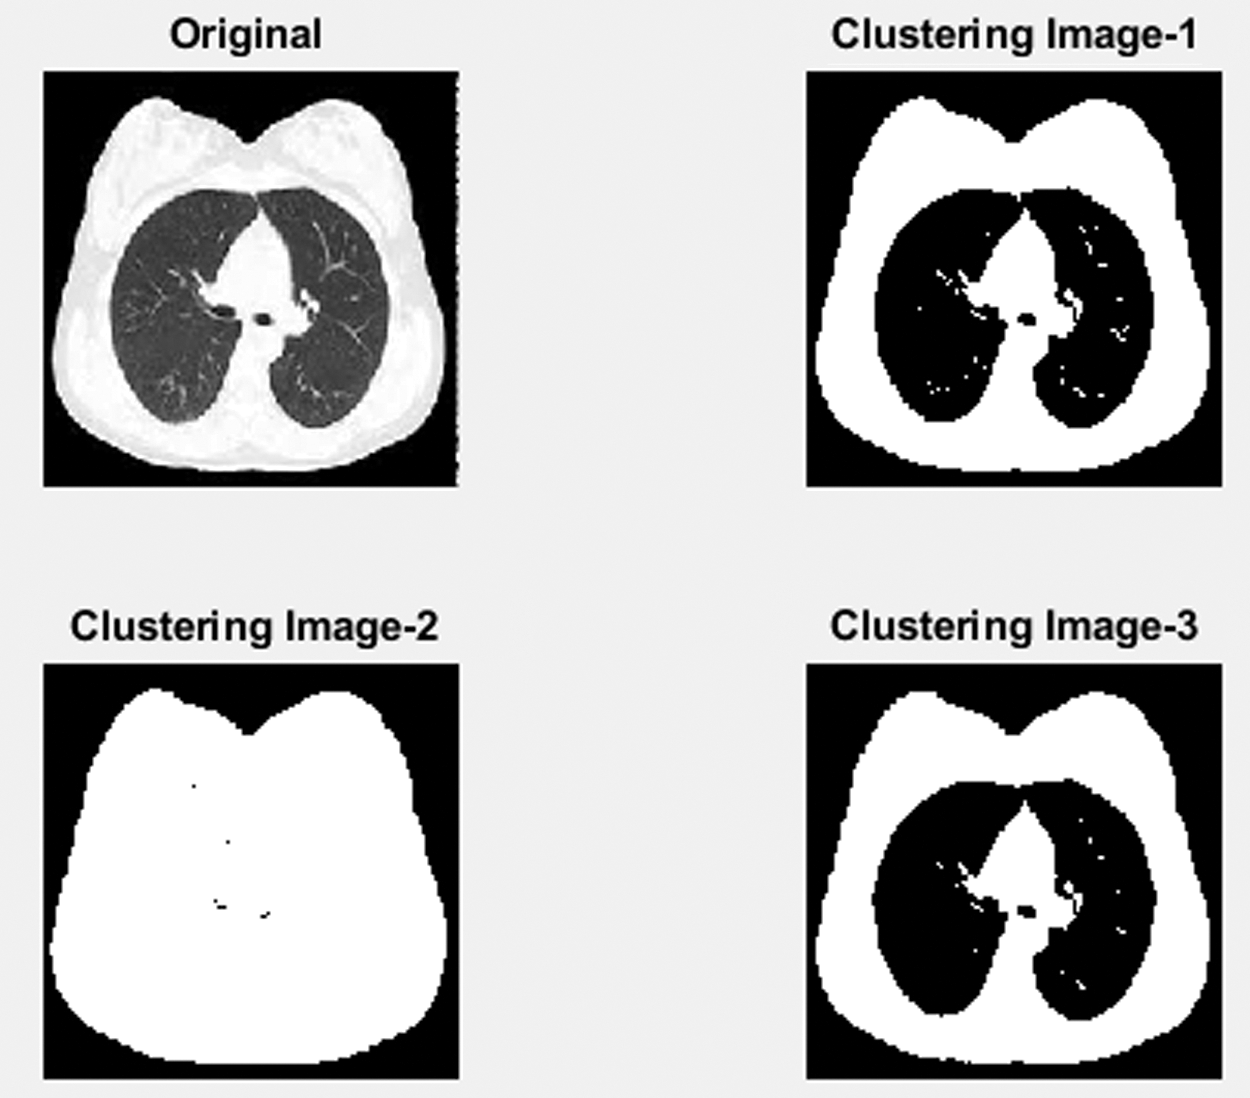
Figure 7: Clustering normal lung image processing
Tab. 3 shows the comparative analysis of CT image-based normal lung cancer analysis of five different types of images, which considers the results of the classification as normal Lung image mean, standard deviation, and variance, and some of the functions of the entropy verification as well.
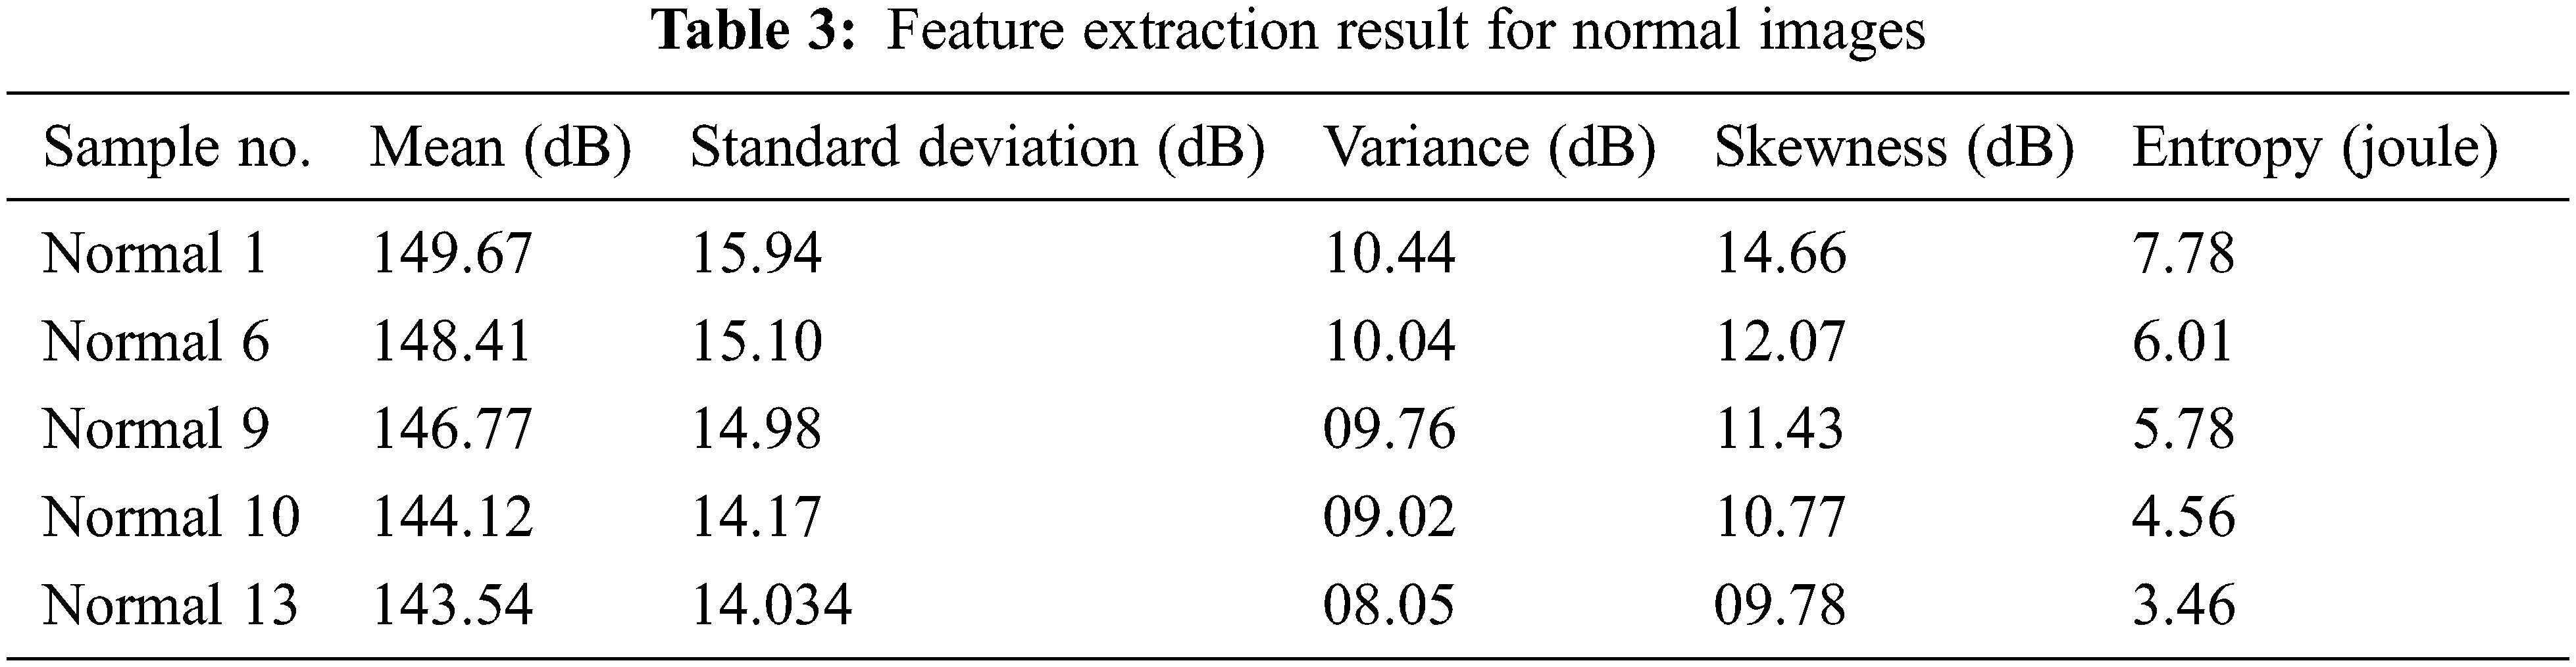
Fig. 8 shows the feature extraction results for normal lung image classification, considering the image average, standard deviation, variance, and entropy. The extracted values are defined in Tab. 3.
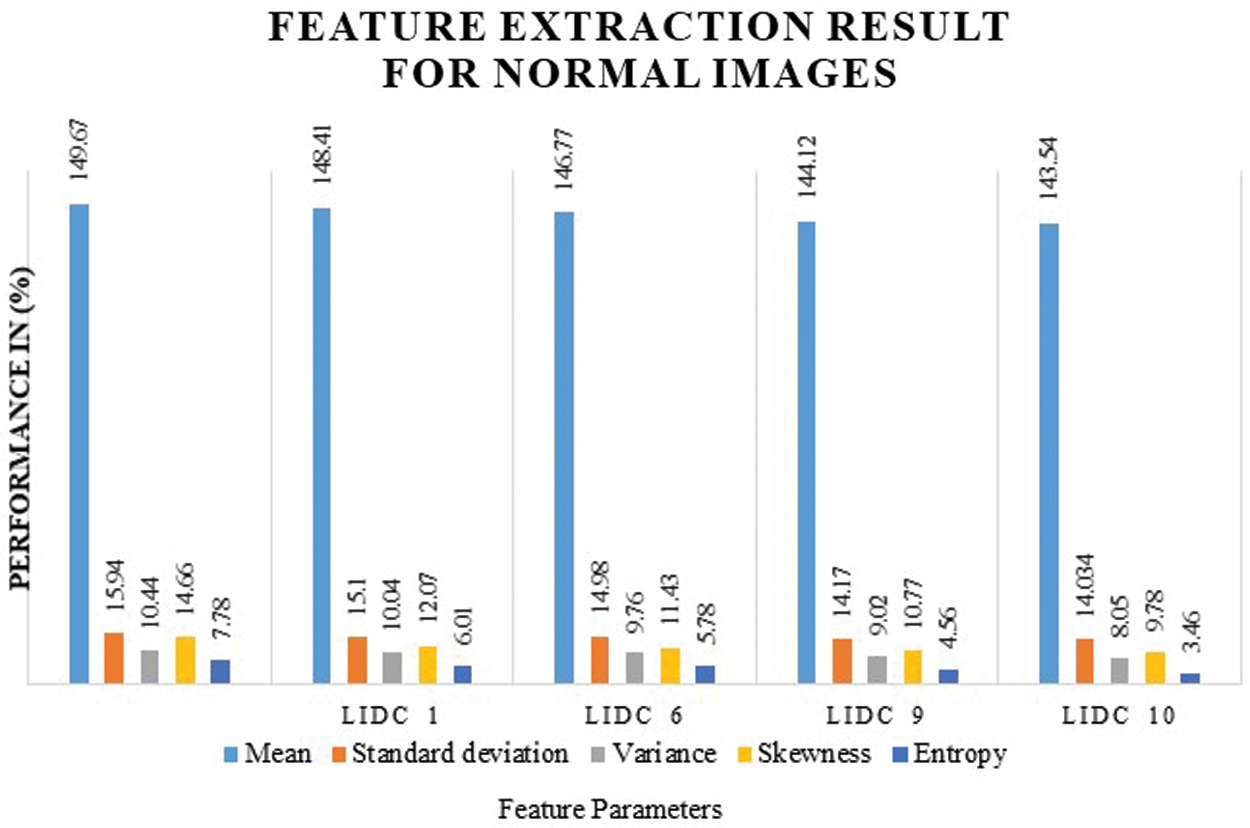
Figure 8: Feature extraction result for normal images
Fig. 9 shows a part of the Lung image to detect clustering-based malignant LC detection. This figure represents three stages of the process to find the Lung images which are obtained from the LIDC dataset and the unwanted noise removal in the obtained image using the proposed adaptive median filter. The second stage of the process identifies the mass region in the pre-processing image and based on region-based analysis, the suspicious regions will exactly be identified.
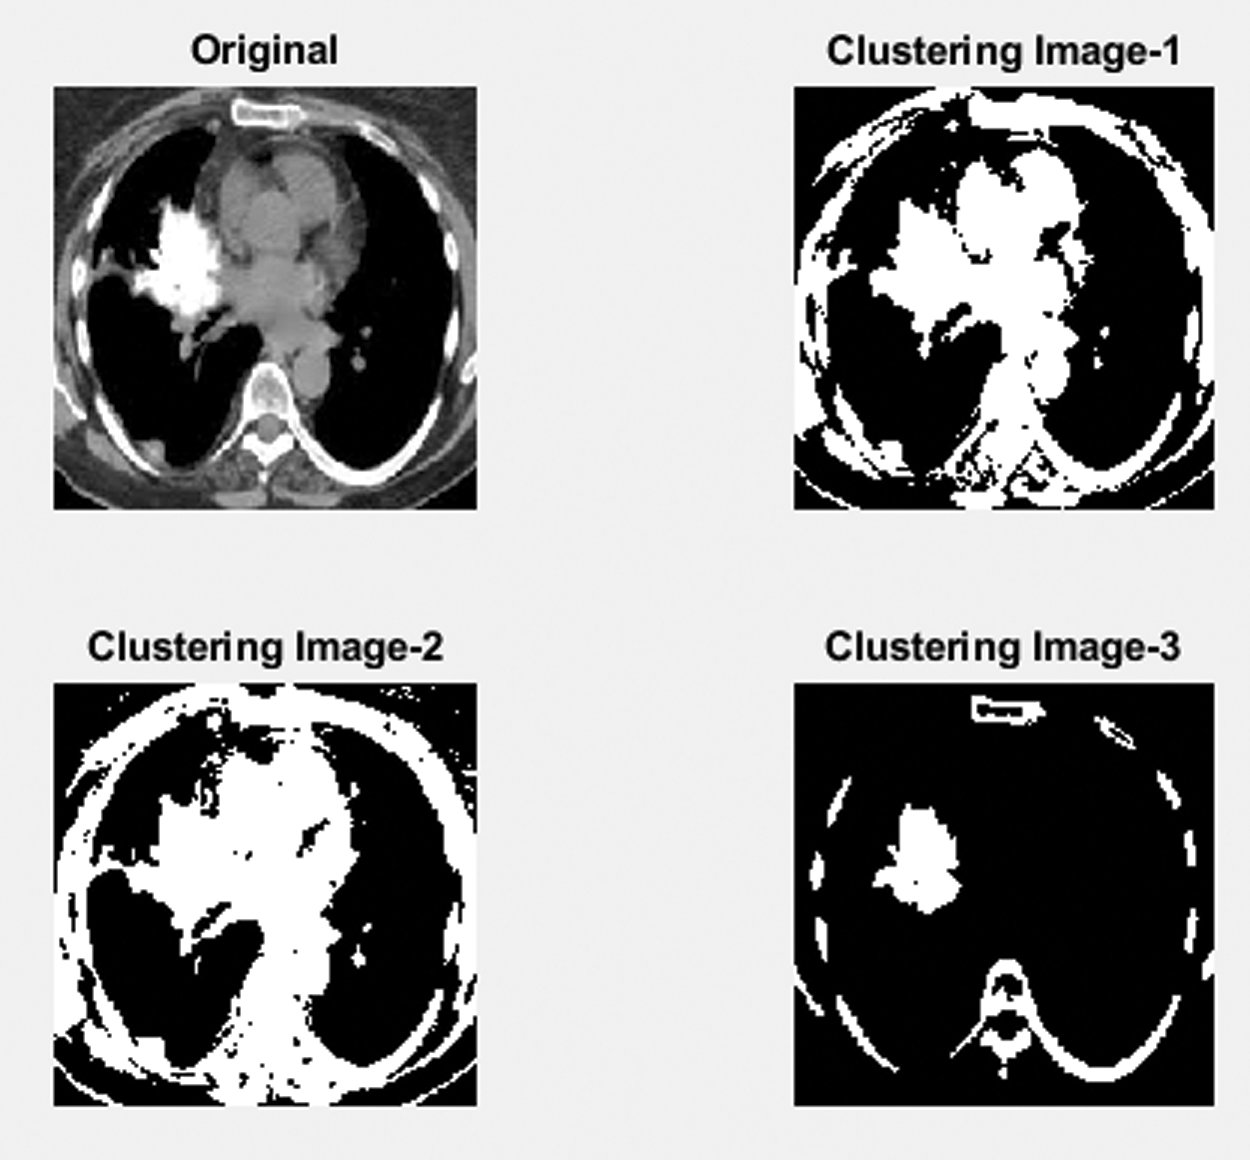
Figure 9: Lung cancer detection using image processing
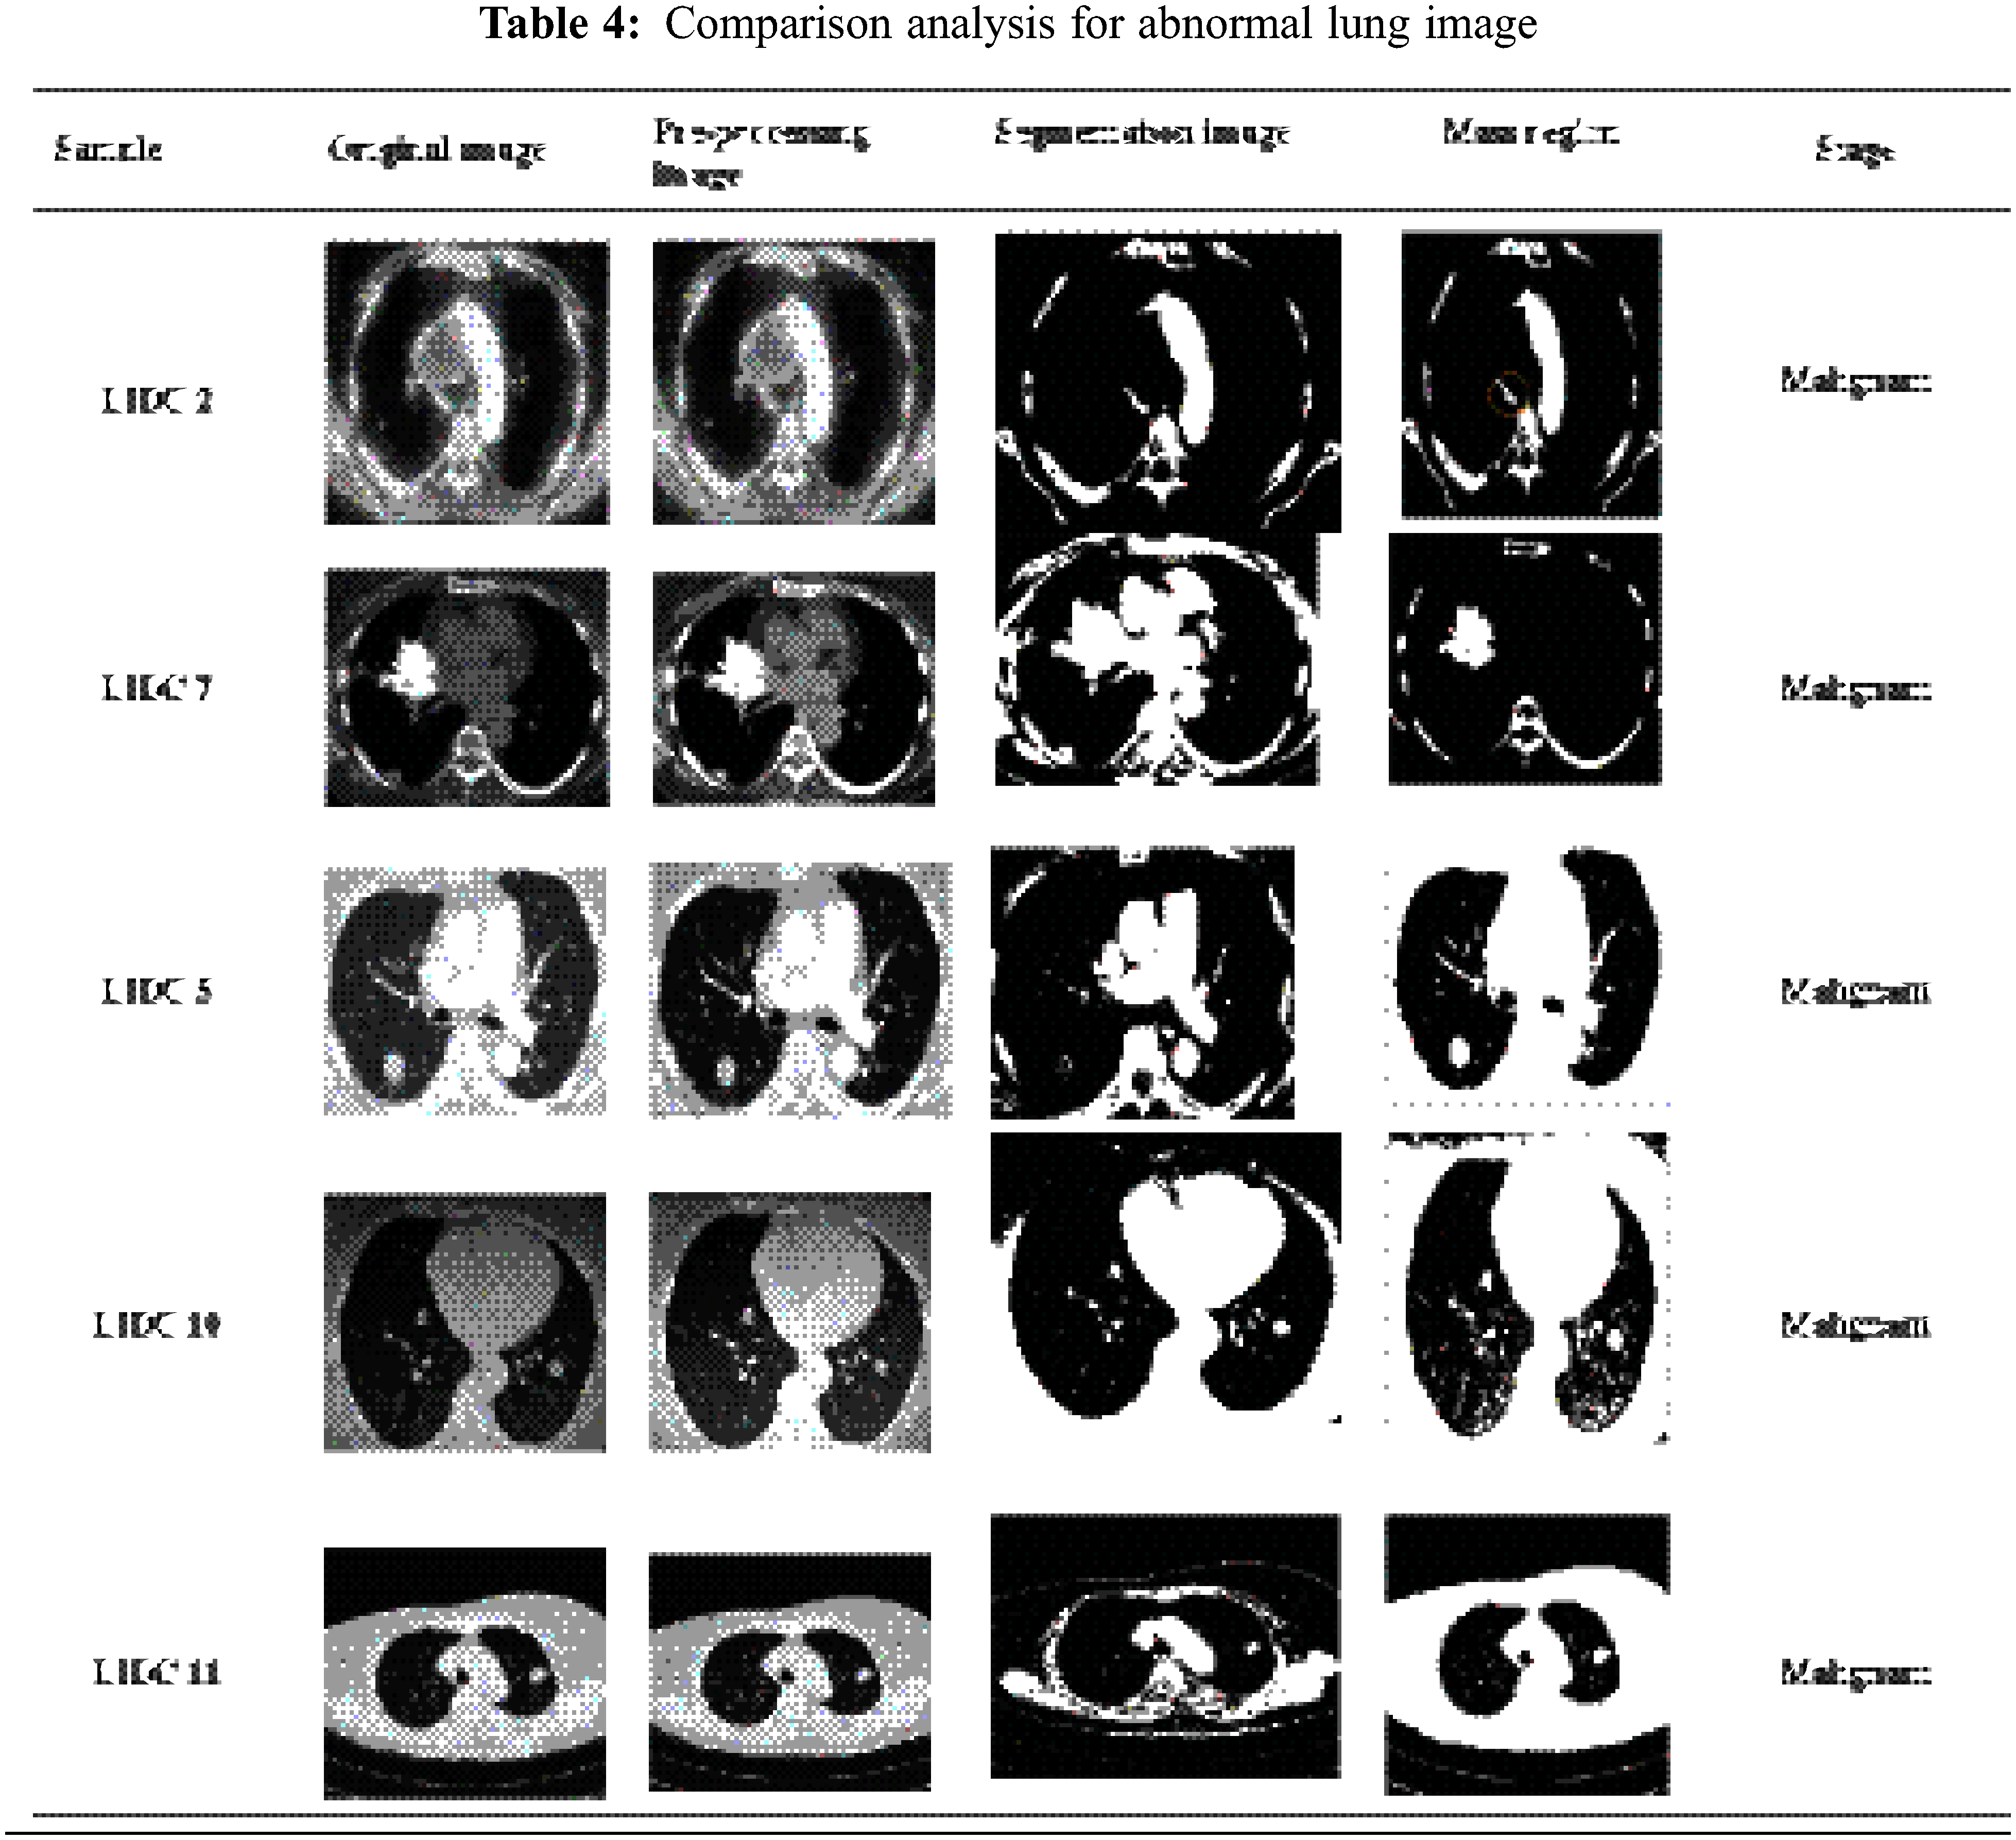
By categorizing the values based on the feature values, Contiguous Cross Propagation Neural Network (CCPNN) classification will ultimately tend to pinpoint cancer location accurately. As shown in Tab. 4, there are different LIDC datasets for lung cancer detection based on image analysis.
Tab. 5 indicates a comparison of the model’s feature parameters such as mean, standard deviation, contrast, dimension, and energy. Lung cancer characteristics are accurately retrieved using our suggested CCPNN approach, as demonstrated in Fig. 10 and Tab. 5.
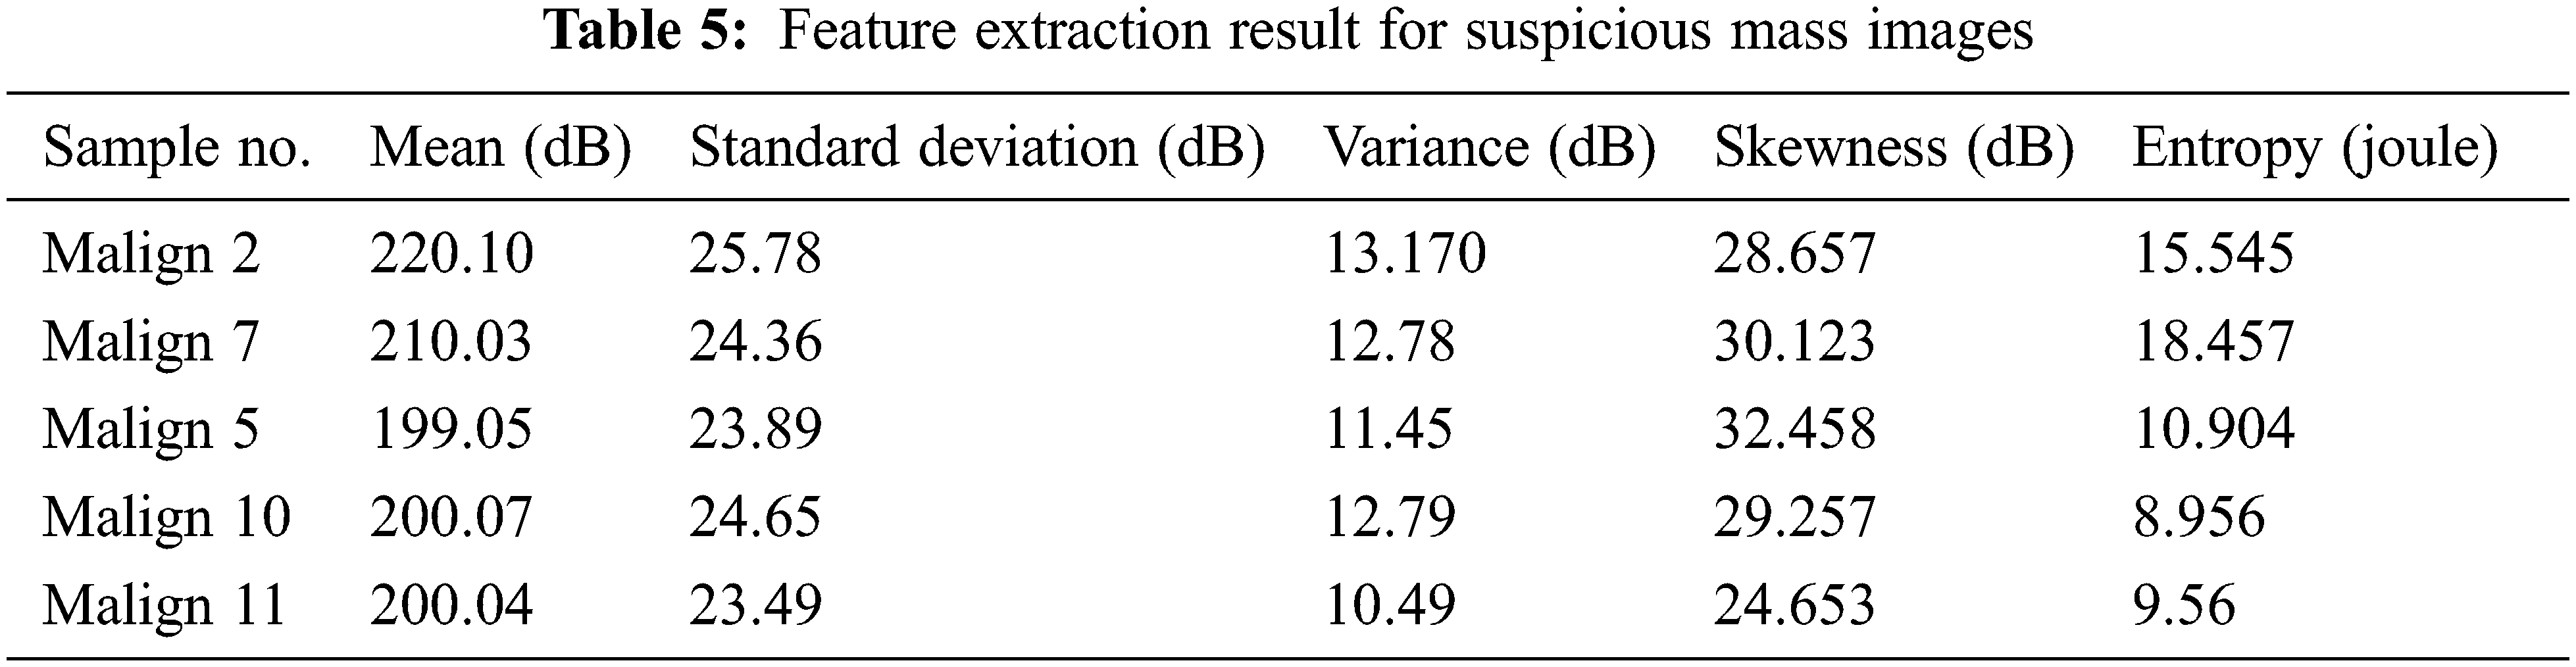
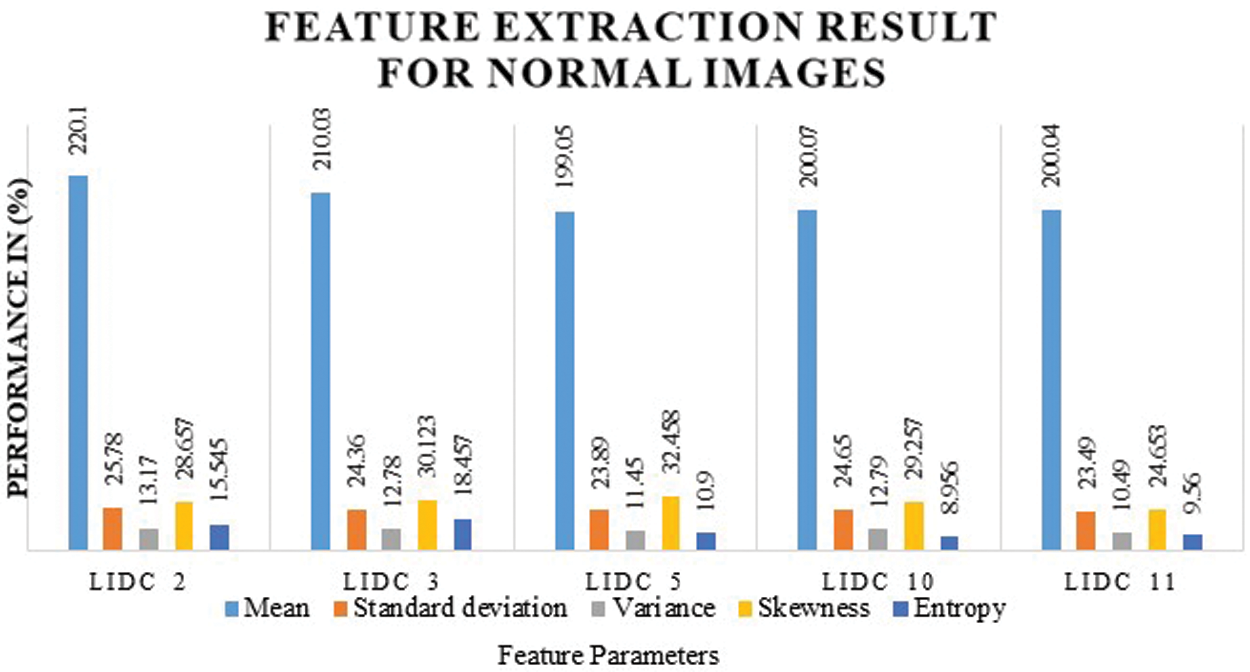
Figure 10: Feature extraction chart for suspicious mass images
Tab. 6 shows the various classification features by calculating Lung cancer using Contiguous Cross Propagation Neural Network (CCPNN) algorithm. The proposed CCPNN has high accuracy contrasted with the conventional techniques.
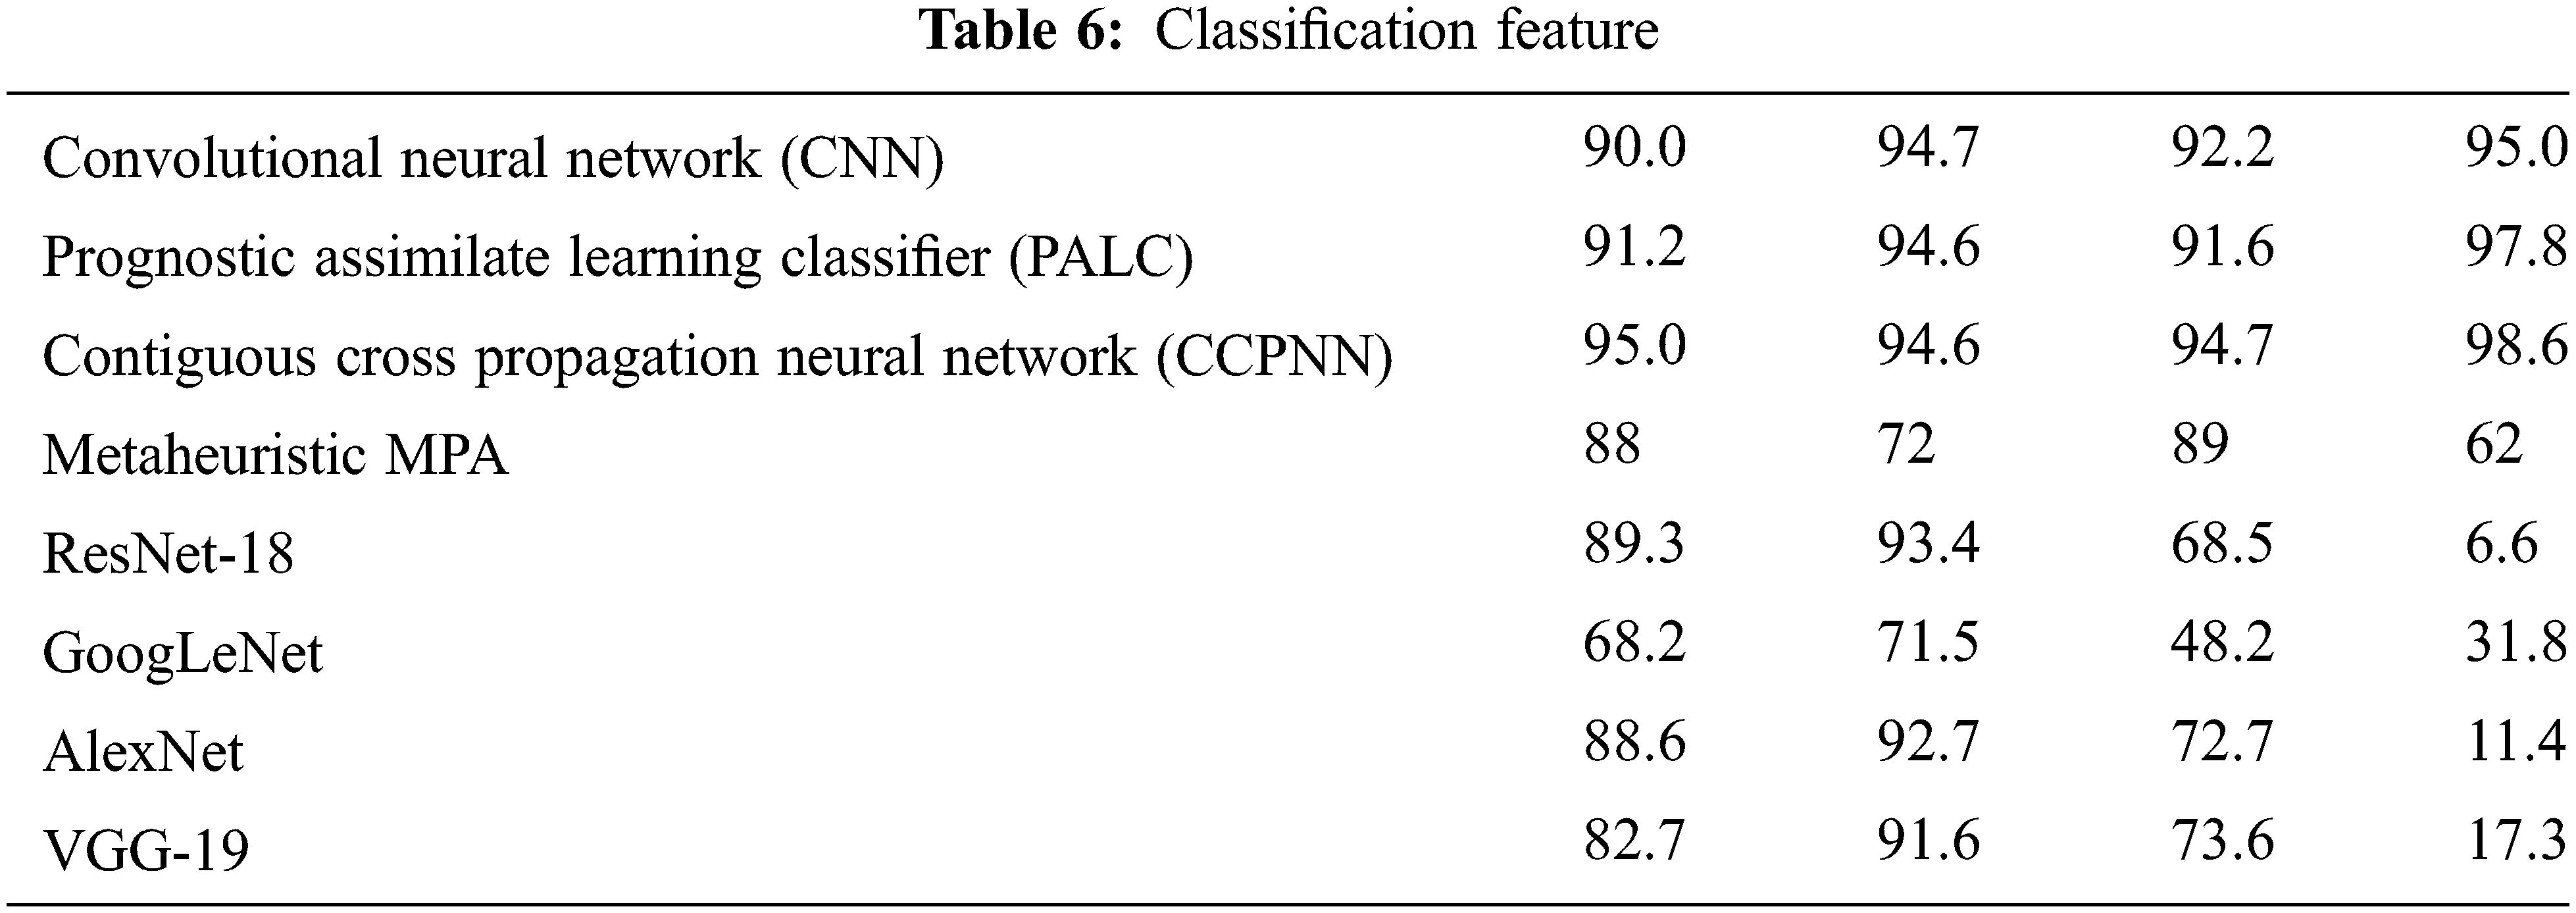
Fig. 11 shows the comparison chart for classification features. This analysis clearly explains that the proposed CCPNN classification produces better results compared to the existing techniques.
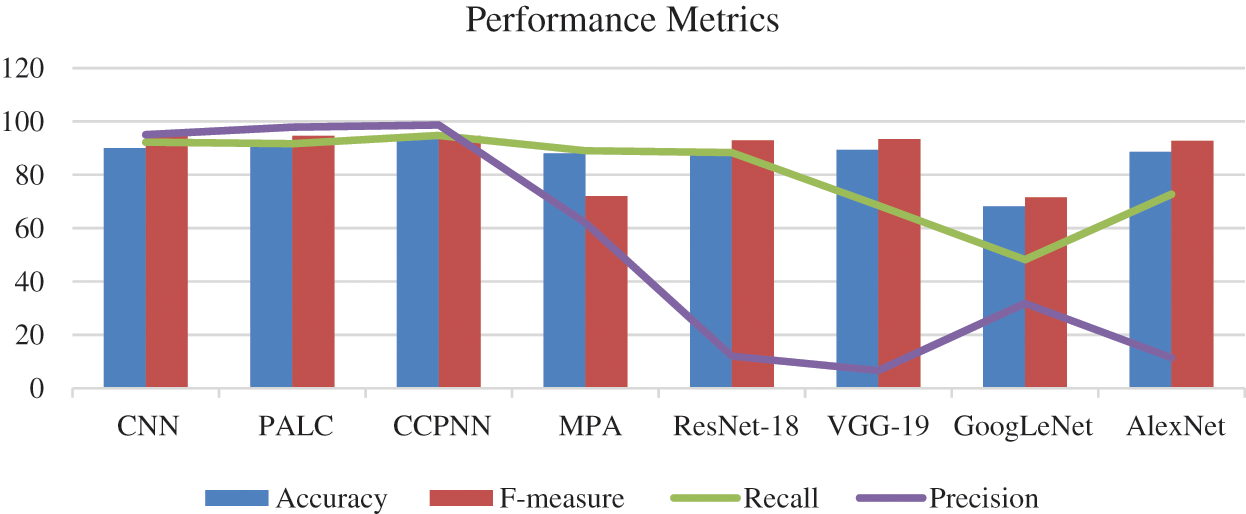
Figure 11: Comparison chart for classification features
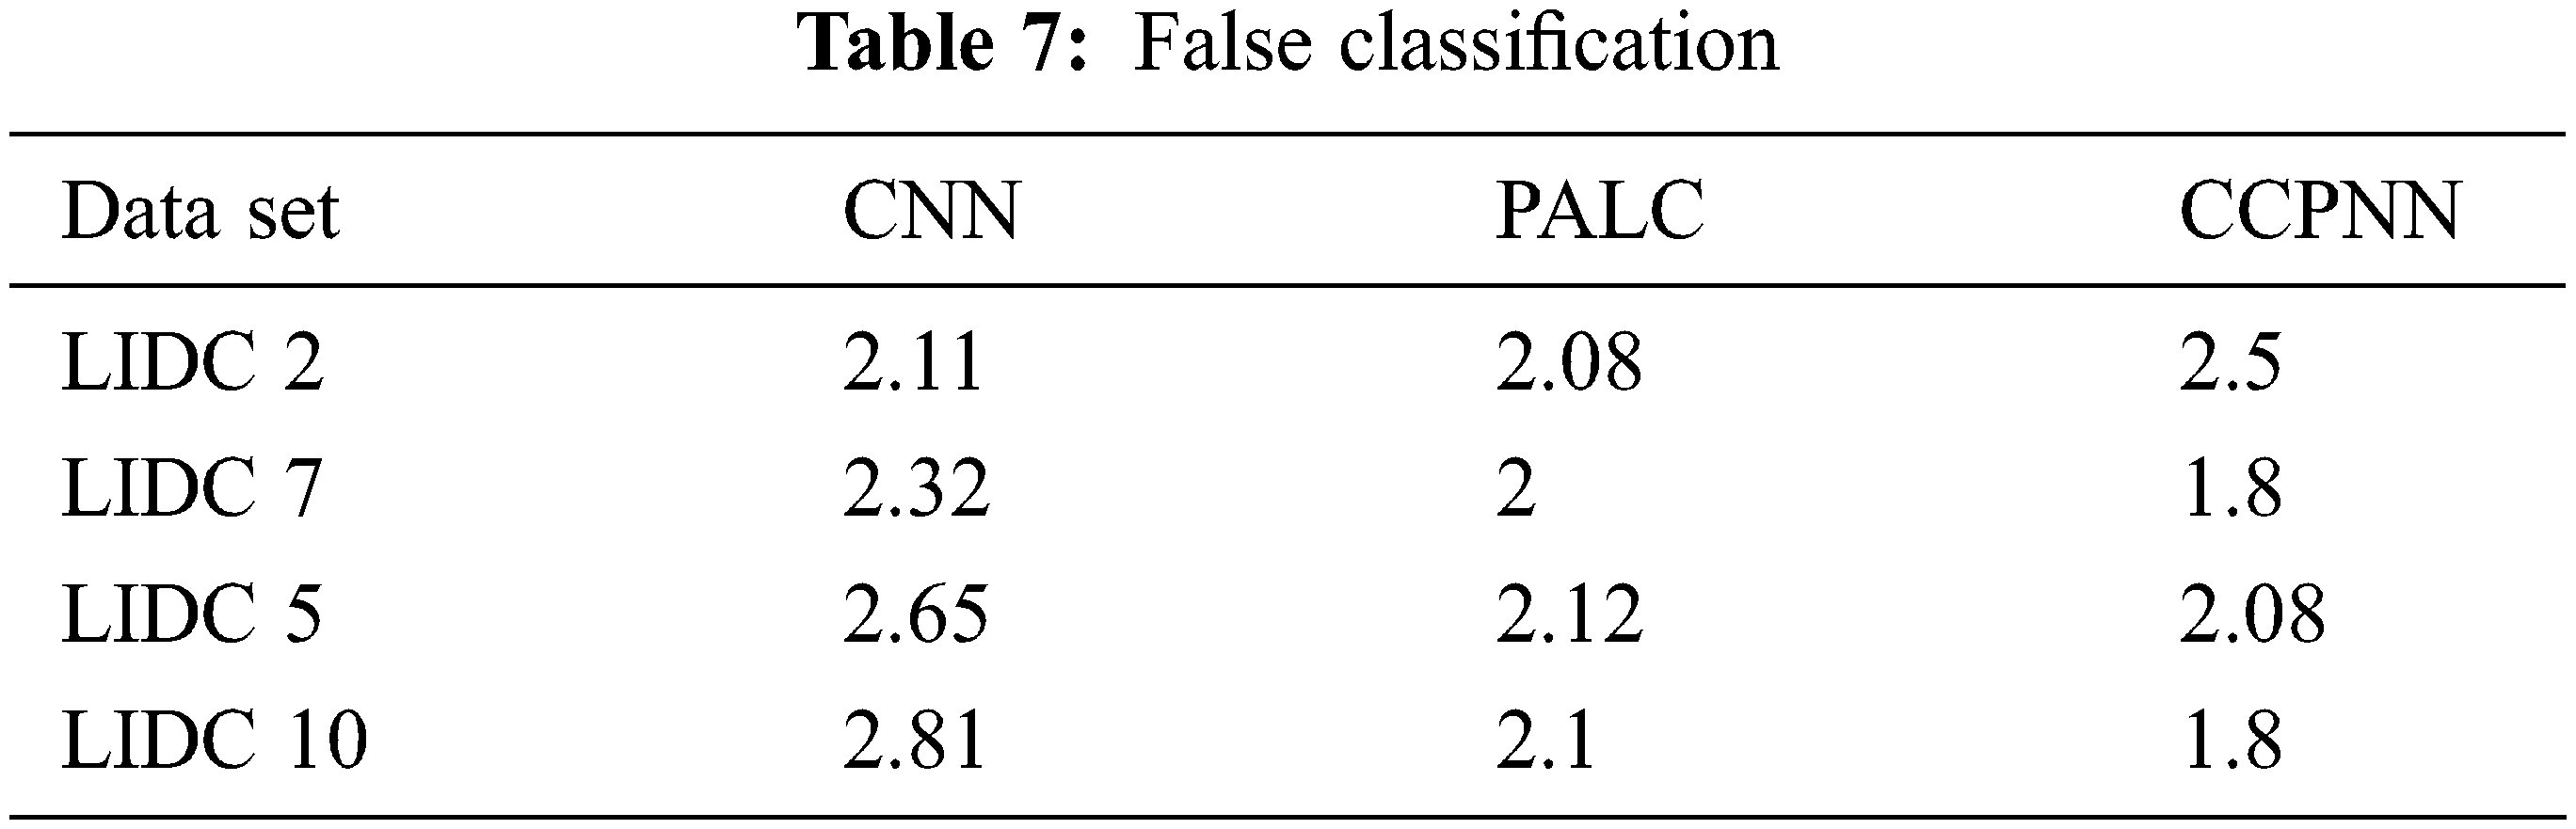
Fig. 12 shows the comparison result on the false classification rate produced by the proposed CCPNN strategy and the conventional techniques. The values are represented in Tab. 7.
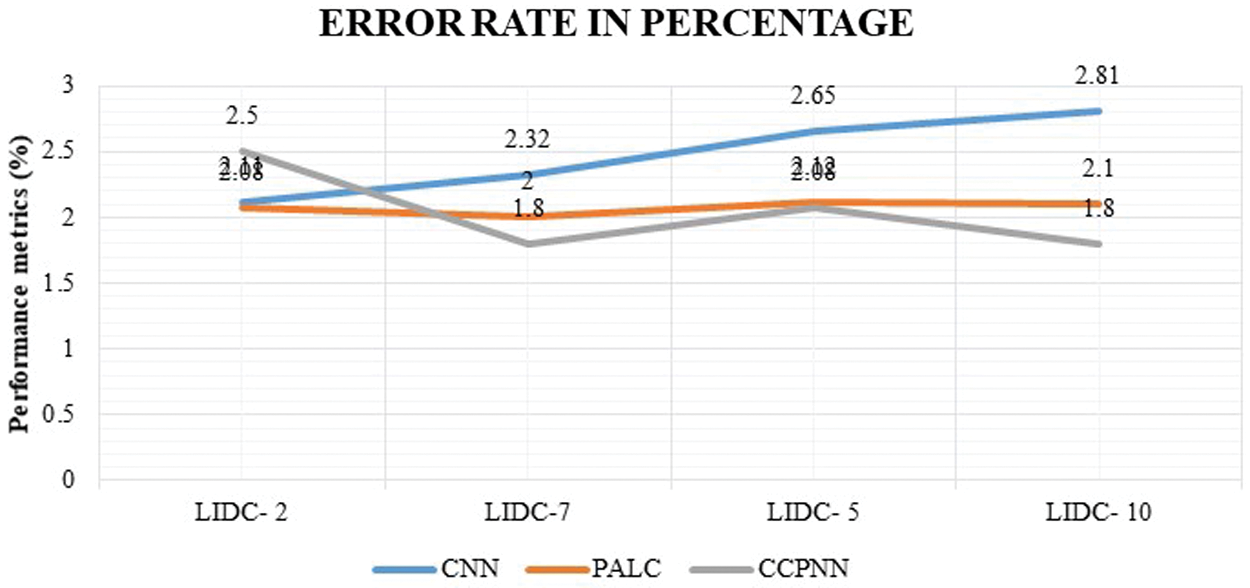
Figure 12: False classification ratio
Lung cancer is considered to be the most common and most dangerous disease and depending on the stage, the cancer cells are found in the lung’s image. Noise problems often plague the original input image from Lung Image Database Consortium (LIDC) in the present study. A highly enhanced Gabor filter is used for image processing to overcome this issue. After detecting cancer suspected areas in CT scan images, the Spherical Iterative Refinement Clustering (SIRC) algorithm was used. By using the proposed Contiguous Cross Propagation Neural Network (CCPNN) algorithm, the process of disease detection can be mitigated and the probability of a serious stage reduced. The role of reducing mortality rates is also essential and very important. The image is obtained is preprocessed to obtain a noise-reduced image in advance. The second stage of research involves the use of spherical iterative refinement clusters (SIRC) to detect lungs nodules. Once the segmented image is extracted, the features are used as input to the classifier. An image’s cancerous or non-cancerous class can be determined by the proposed Contiguous Cross Propagation Neural Network (CCPNN) algorithm based on its feature values. The CCPNN has registered an outstanding performance of 98.06% and it has provided the lowest false ratio of 1.8%. The proposed work can be enhanced by adding the future work by introducing an optimization of the neural network to enable more precision in the detection of the malady.
Acknowledgement: The Author with a deep sense of gratitude would thank the supervisor for his guidance and constant support rendered during this research.
Funding Statement: The authors received no specific funding for this study.
Conflicts of Interest: The authors declare that they have no conflicts of interest to report regarding the present study.
1. W. J. Sori, J. Feng, A. W. Godana, S. Liu and D. J. Gelmecha, “DFD-Net: Lung cancer detection from denoised CT scan image using deep learning,” Frontiers of Computer Science, vol. 15, no. 2, pp. 1–13, 2020. [Google Scholar]
2. B. Muthazhagan, T. Ravi and D. Rajinigirinath, “An enhanced computer-assisted lung cancer detection method uses content-based image retrieval and data mining techniques,” Journal of Ambient Intelligence and Humanized Computing, vol. 1, pp. 1–9, 2020. [Google Scholar]
3. G. Subramaniam and S. Mona, “Pi based lung cancer detection using deep learning technique,” International Journal of Engineering Research & Technology, vol. 8, no. 17, pp. 58–60, 2020. [Google Scholar]
4. G. Perez and P. Arbelaez, “Automated lung cancer diagnosis using three-dimensional convolutional neural networks,” Medical & Biological Engineering & Computing, vol. 58, no. 8, pp. 1803–1815, 2020. [Google Scholar]
5. R. Sujitha and V. Seenivasagam, “Classification of lung cancer stages with machine learning over big data healthcare framework,” Journal of Ambient Intelligence and Humanized Computing, vol. 12, no. 5, pp. 5639–5649, 2021. [Google Scholar]
6. H. Farhat, G. E. Sakr and R. Kilany, “Deep learning applications in pulmonary medical imaging: recent updates and insights on COVID-19,” Machine Vision and Applications, vol. 31, no. 53, pp. 1–42, 2020. [Google Scholar]
7. H. J. Chen, S. J. Ruan, S. W. Huang and Y. T. Peng, “Lung X-ray segmentation using deep convolutional neural networks on contrast-enhanced binarized images,” Mathematics, vol. 8, no. 4, pp. 545, 2020. [Google Scholar]
8. H. Panwar, P. K. Gupta, M. K. Siddiqui, R. M. Morales and V. Singh, “Application of deep learning for fast detection of COVID-19 in X-rays using nCOVnet,” Chaos, Solitons & Fractals, vol. 138, no. 3, pp. 109944, 2020. [Google Scholar]
9. A. T. Sahlol, D. Yousri, A. A. Ewees, A. A. M. Alqaness, R. Damasevicius et al., “COVID-19 image classification using deep features and fractional-order marine predator’s algorithm,” Scientific Reports, vol. 10, no. 1, pp. 1–15, 2020. [Google Scholar]
10. M. Jamshidi, A. Lalbakhsh, J. Talla, Z. Peroutka, F. Hadjilooei et al., “Artificial intelligence and COVID-19: Deep learning approaches for diagnosis and treatment,” IEEE Access, vol. 8, pp. 109581–109595, 2020. [Google Scholar]
11. S. P. Sahu, N. D. Londhe and S. Verma, “Pulmonary nodule detection in CT images using optimal multilevel thresholds and rule-based filtering,” IETE Journal of Research, vol. 1, no. 4, pp. 1–18, 2019. [Google Scholar]
12. S. Shanthi and N. Rajkumar, “Non-small-cell lung cancer prediction using radiomic features and machine learning methods,” International Journal of Computers and Applications, vol. 1, no. 1, pp. 1–9, 2019. [Google Scholar]
13. I. C. Mehta, A. K. Ray and Z. J. Khan, “Lung cancer detection using computer-aided diagnosis in chest radiograph: A survey and analysis,” IETE Technical Review, vol. 22, no. 5, pp. 385–393, 2005. [Google Scholar]
14. A. E. Baz, G. M. Beache, G. Gimelfarb, K. Suzuki, K. Okada et al., “Computer-aided diagnosis systems for lung cancer: Challenges and methodologies,” International Journal of Biomedical Imaging, vol. 2013, pp. 1–46, 2013. [Google Scholar]
15. M. B. Khumancha, A. Barai and C. B. R. Rao, “Lung cancer detection from computed tomography (CT) scans using convolutional neural network,” in Proc. 2019 10th Int. Conf. on Computing, Communication and Networking Technologies, Kanpur, India, pp. 1–7, 2019. [Google Scholar]
16. T. Pengo, A. B. Munoz and C. S. Ortiz, “A novel automated microscopy platform for multiresolution multispectral early detection of lung cancer cells in bronchoalveolar lavage samples,” IEEE Systems Journal, vol. 8, no. 3, pp. 985–994, 2014. [Google Scholar]
17. J. Jiang, Y. C. Hu, C. J. Liu, D. Halpenny, M. D. Hellmann et al., “Multiple resolution residually connected feature streams for automatic lung tumor segmentation from CT images,” IEEE Transactions on Medical Imaging, vol. 38, no. 1, pp. 134–144, 2019. [Google Scholar]
18. S. Khobragade, A. Tiwari, C. Y. Patil and V. Narke, “Automatic detection of major lung diseases using chest radiographs and classification by the feed-forward artificial neural network,” in Proc. Int. Conf. on Power Electronics, Intelligent Control and Energy Systems (ICPEICES), Delhi, IEEE, pp. 1–5, 2016. [Google Scholar]
19. S. S. Alahmari, D. Cherezov, D. B. Goldgof, L. O. Hall, R. J. Gillies et al., “Delta radiomics improves pulmonary nodule malignancy prediction in lung cancer screening,” IEEE Access, vol. 6, pp. 77796–77806, 2018. [Google Scholar]
20. P. Petousis, A. Winter, W. Speier, D. R. Aberle, W. Hsu et al., “Using sequential decision making to improve lung cancer screening performance,” IEEE Access, vol. 7, pp. 119403–119419, 2019. [Google Scholar]
21. A. Tariq, M. U. Akram and M. Y. Javed, “Lung nodule detection in CT images using a neuro-fuzzy classifier,” in Proc. Fourth Int. Workshop on Computational Intelligence in Medical Imaging (CIMI), Singapore, pp. 49–53, 2013. [Google Scholar]
22. A. Masood, P. Yang, B. Sheng, H. Li, P. Li et al., “Cloud-based automated clinical decision support system for detection and diagnosis of lung cancer in chest CT,” IEEE Journal of Translational Engineering in Health and Medicine, vol. 8, pp. 1–13, 2020. [Google Scholar]
23. A. Pradhan, B. Sarma and B. K. Dey, “Lung cancer detection using 3d convolutional neural networks,” in Proc. Int. Conf. on Computational Performance Evaluation (ComPE), Shillong, India, pp. 765–770, 2020. [Google Scholar]
24. H. Yu, Z. Zhou and Q. Wang, “Deep learning assisted predict of lung cancer on computed tomography images using the adaptive hierarchical heuristic mathematical model,” IEEE Access, vol. 8, pp. 86400–86410, 2020. [Google Scholar]
25. H. Jiang, H. Ma, W. Qian, M. Gao and Y. Li, “An automatic detection system of lung nodule based on multigroup patch-based deep learning network,” IEEE Journal of Biomedical and Health Informatics, vol. 22, no. 4, pp. 1227–1237, 2018. [Google Scholar]
26. D. Riquelme and M. A. Akhloufi, “Deep learning for lung cancer nodules detection and classification in CT scans,” AI, vol. 1, no. 1, pp. 28–67, 2020. [Google Scholar]
27. K. Bhavanishankar and M. V. Sudhamani, “Novel techniques for classification of lung nodules using deep learning approach,” The Open Biomedical Engineering Journal, vol. 13, no. 1, pp. 126, 2019. [Google Scholar]
 | This work is licensed under a Creative Commons Attribution 4.0 International License, which permits unrestricted use, distribution, and reproduction in any medium, provided the original work is properly cited. |