DOI:10.32604/csse.2023.024292
| Computer Systems Science & Engineering DOI:10.32604/csse.2023.024292 | |
| Article |
Logistic Regression Trust–A Trust Model for Internet-of-Things Using Regression Analysis
1Department of CSE, Saveetha Engineering College, Chennai, India
2Department of CSE, SRM Institute of Science and Technology, Chennai, India
3Department of ECE, Saveetha Engineering College, Chennai, India
*Corresponding Author: Feslin Anish Mon Solomon. Email: mfeslin@gmail.com
Received: 12 October 2021; Accepted: 07 January 2022
Abstract: Internet of Things (IoT) is a popular social network in which devices are virtually connected for communicating and sharing information. This is applied greatly in business enterprises and government sectors for delivering the services to their customers, clients and citizens. But, the interaction is successful only based on the trust that each device has on another. Thus trust is very much essential for a social network. As Internet of Things have access over sensitive information, it urges to many threats that lead data management to risk. This issue is addressed by trust management that help to take decision about trustworthiness of requestor and provider before communication and sharing. Several trust-based systems are existing for different domain using Dynamic weight method, Fuzzy classification, Bayes inference and very few Regression analysis for IoT. The proposed algorithm is based on Logistic Regression, which provide strong statistical background to trust prediction. To make our stand strong on regression support to trust, we have compared the performance with equivalent sound Bayes analysis using Beta distribution. The performance is studied in simulated IoT setup with Quality of Service (QoS) and Social parameters for the nodes. The proposed model performs better in terms of various metrics. An IoT connects heterogeneous devices such as tags and sensor devices for sharing of information and avail different application services. The most salient features of IoT system is to design it with scalability, extendibility, compatibility and resiliency against attack. The existing works finds a way to integrate direct and indirect trust to converge quickly and estimate the bias due to attacks in addition to the above features.
Keywords: LRTrust; logistic regression; trust management; internet of things
Internet of Things (IoT) is an emerging trend in network with attractive standards and infrastructure for sharing and communication in day to day life. IoT integrates heterogeneous physical objects into a network to share advanced applications between them. In future, this plays important role in social life. These data are mined for useful information for different applications. The future development of IoT is very promising as it is applicable in different areas such as health care smart home, surveillance, traffic control [1].
The IoT is prominent as it incorporates large count of heterogeneous objects in a standard network protocol with unique ID which is made available for end users at the edges. Its future extension is connecting the physical objects in cyberspace via Radio Frequency ID (RFID) and sensors [2,3]. The devices interact with physical world through Internet and sense the data from the operational environment [4]. So IoT is a paradigm with universal infrastructure for deploying data sensing devices and provide them resource usage. IoT is a three-layer structure as perception layer, network layer and application layer as shown in Fig. 1. The perception layer identifies physical environment and human social life; perceived data is processed and transformed by network layer and application layer offer intelligent services in prevalent manner. The layers are connected to one another across cyber, physical and social characteristics [5].
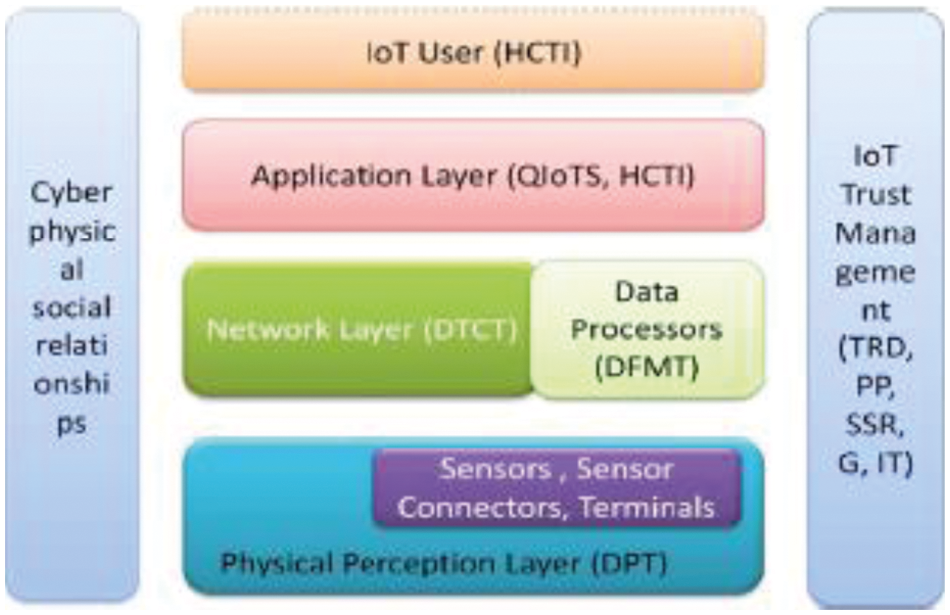
Figure 1: IoT–System model (Source: [6])
The IoT system is trustworthy, not just because of reliability between the layers but also regarding the privacy, security and trust properties of the layers and the whole system. Each layer’s trust is very important. For example, even if the communicating network or application layer is trustable and the data from perception layer is not trustworthy, it greatly influences the quality. Some of the reasons like limited bandwidth, resource scarcity, mobile nodes and lack of scalability are some of the reasons that make IoT system more prone to attacks [7].
An IoT system requires a powerful security control as every element of it is liable to either internal or external threats. Consequently, the important is its privacy, which means that it is very important to know by whom and when the information is disclosed [8]. On preserving privacy, the system is trustworthy. One of the preceding aim of Internet of Things is to provide very personalized services to individuals in ubiquitous digital system that control devices in our day today life. This involvement of IoT will give way too many social changes and create many business opportunities [9]. More than expansion of the network, IoT gains more importance in terms of security. Each entity in IoT interact among themselves and send a request for the service of a provider. While in this interaction, a malicious device attack and abuse the resources, it is very important to ensure the trustworthiness of each provider in this universal environment [10].
The proposed work is a study on trust management for IoT consisting of service provider (trustee) and service requestor (trustor). The Trust is defined as belief or expectation of requestor on provider in terms of service quality fixing factors like integrity, availability etc. Trust is important measure of confidence and expectation in social communication as there is lack of monitoring the environment directly [11].
Definition: Trust. It is a qualitative or quantitative property of a trustee, evaluated by a trustor as a measurable belief, in a subjective or objective manner, for a given task, in a specific context, for a specific time period [12].
Trust is used to detect malicious node attack and its selfish nature in presence of several cryptographic attempts. According to the application and context, trust is evaluated in objective or subjective basis. This idea is applied in business via ecommerce where seller or buyer have no knowledge about each other [13]. In trust management model, more number of node collaborate with each other and share the ideas and recommend based on past history. The integration of past history from all heterogeneous node in different community in IoT is highly challengeable. Untrusted nodes intentionally send fake reports hence the system is vulnerable to attacks [14]. Trust is context specific and dynamic. Trust can be composed from indirect members in network. It is subjective indulging social factors in decision [15].
Social IoT and entity relationship
IoT devices proliferate rapidly in supporting end-to-end services and application for which device authentication gains more importance. Apart from general characteristics such as resource limitation, memory constraint, mobility authentication and authorization are most important for security [16]. The Social Internet of Things (SIoT) connect people and devices in social network to navigate like human by devices. The objects were embodied as smart objects suitable for present communication mode. The IoT entities experience a pseudo-social behavior on interacting with social environment. Every object can establish social relationship with others forming SIoT network [17].
Objects can establish collocation relationship, co work relation and community relation like human with their neighbors. These relations are updated and human set the rules of the objects for using its services. The relation in SIoT may exist between object-object, human-human and human-object. It is important for IoT entity both human or device to know whether the others are trustable to provide service. The misbehaving may be human or owners of device again a human to false the other’s reputation [18].
Trust is a measure to service oriented architecture (SOA)-IoT as its entities can be malicious for selfish purpose. If the trustworthy nodes are not identified, these malicious users may dominate the whole network. IoT support many applications like healthcare [19,20], product management, smart home application etc. It collects and share entity information on context base as the trust differ according to context i.e., separate trust value for each context. This context based evaluation increase the prediction accuracy.
The contributions of this paper are as follows:
1. We consider both QoS and Social factor for direct assessment and recommendation
2. We implemented Logistic Regression for Trust prediction and compared the performance with Bayes Inference with Beta distribution
3. Performance analysis on comparing the two models based on success rate, failure rate and bypassing rate. Performance of the model towards attack.
The rest of the paper is organized as, in Section 2, the survey of trust models and their methods and factors for evaluating trust is discussed. In Section 3, the basic dimension for designing Trust model is given. The Section 4 explains the basic model of Logistic Regression and its adaption to IoT. The Section 5 discusses the simulation detail and performance evaluation on comparing with Bayes-Beta model. The success rate and the resiliency towards attack is discussed. Last Section 6 conclude the work with pros and cons of the existing and proposed model with future ideas.
As IoT involves heterogeneous type of devices with low or no storage or computational capacity, building an efficient trust management system is a challenge. Following are some of the existing research work admitted to bring out the pros and cons in constructing the trust model in various aspects. The author Kranz et al. [21] have worked to provide services on adding social and technical things both the human and technical entities of the IoT systems. The work of Atzori et al. [22] used social relationship and developed model called SIoT. It gives more importance to relationship rather than users.
Bao et al. [23] did QoS and Social factors and performed direct and indirect recommendation and also trust value is periodically updated. The system dynamically changes its member, behavior and interaction. But the system failed to attend scalability. Chen et al. [24] worked a model with two parameters, one is for weighting past history and direct assessment and another weights past history and recommendations. The system does not use any decay function and as it follows two way weighting method, it does not degrade trust. In the work of Roman et al. [25], it is cleared that the approaches used for traditional way is not suitable for IoT as many relationships exist and needs the system to be dynamic and scalable. Chen et al. [26] built a trust model using fuzzy approach. The system is designed with wireless sensors and take account QoS factors but does not considers social factors which have high impact on IoT trust.
Lize et al. [27] developed a distributed type of trust model in which both direct assessment and indirect recommendation is used. Social parameters such as honesty, cooperativeness, and community-interest are used. Two nodes rate each other on interaction. The performance is improved on adjusting the parameter according to the environment change. The work [28] used a credit or guarantor and reputation is used for social internet of things and measured the trustworthiness to identify the malicious node. Yu et al. [29] developed a model which used multi criteria system which includes network related parameters such as repetition rate, delay speed for packet forwarding. The model uses entropy theory and uses Dempster-Schafer theory for indirect assessment of node behavior. The performance was good in finding malicious node and need to attempt in lightweight trust management.
The paper of Hamdi et al. [30] designed an adaptive game based analytical model. The security mechanism can be activated and inactivated by using Markov game theory for uncertain variables. They simulated their model for epidemic virus spread wireless sensor networks. But failed to add the way to find any other node is comprised or not.
3 Design Dimensions of Trust Model
A good survey work of Cho et al. [31] clearly sketched the design steps for effective trust management system. The paper was supportive to consolidate the existing work in this area. The five design principles are trust composition, trust propagation, trust aggregation, trust update, and trust formation. These 5 principles are essential for a trust computation model. So far, the existing system followed various strategies under each principle. Due to space constraint, only relevant principles are explained in the following section.
Trust composition refers to what components to consider in trust computation. Trust components include quality of service (QoS) trust and Social trust
Trust propagation refers to how to propagate trust evidence to peers. In general, there are two trust propagation schemes–that is, distributed and centralized. The trust score is forwarded to next neighbor peers so that it may be used for trust evaluation.
Trust aggregation refers to aggregating trust evidence collected through either self- observations or feedbacks from peers. Partial trust score at each instant can be done as direct assessment by trustor directly by self-interactions or done as indirect assessment from neighbors of both trustor and trustee. All the partial scores are aggregated to reach the final trust score. Some of the aggregation methods are a) Weighted Sum b) Bayesian Inference with Belief Discounting c) Regression Analysis d) Belief theory e) Subjective logic f) Certain logic g) Fuzzy logic.
The trust score as time prolongs, it decays and not have that much impact on trust. Therefore, the trust value should be updated according to the new context. So trust is always calculated based on recent history records or experiences. Two schemes are followed namely event driven and time driven.
The overall trust is formed on aggregating already calculated direct and indirect value. The trust formation is of two type viz: a) Single trust b) Multi trust. In single trust, only one node whose interaction finalizes the trust level is considered. It may be direct trust. But multi trust is getting opinions from neighbors. So the devices in a relation repute the node for selection of Service Provider.
The quality of our work is in building a trust inference model using Regression analysis and to predict the service behavior given context information as input. It is compared with widely used Bayesian model, which have strong statistical foundation.
Trust Management
The designing of trust management challenges to handle heterogeneous devices, which are in huge count. The present system does not scale, as the entities are limited with capacity of storage and computation power. The another important challenge in the network is fully dynamic in nature that any number of node can enter or leave the network and this may fluctuate the degree of accuracy of the network [32]. The entities involved are mostly human handled devices. The social relationship is very important in IoT type of universal communicating network, so the relationship maintained between the owners are very important for the performance. The cyber-attack is unavoidable in such a big internet system, which clearly imposes the importance of building the trust system against the attack [33]. The protocol must be resilient against cyber-attacks in any hostile situation.
The protocol design of a node in our system has both QoS and Social properties. The propagation is in distributed manner as whenever a node wants a feedback it gets from the neighbor who might have experienced a provider earlier. Each node maintains a profile list consisting of service evidences that have experienced by them and may use as history for future decision. The report consists of parameter list and values, trust score of itself and about neighbors. This score is updated periodically and any trust is evaluated only with recent. The model has attempted to have a solution for the above said challenges and have studied the performance of the proposal on simulating a model environment. The hypothetical construction of the model is discussed in the following section.
The author of [34] have clearly surveyed and explained trust-computing models and classified based on data formation composition, updation, propagation and aggregation. Based on that notion, the proposed system falls on both QoS and Social property in distributed manner, time driven updation with multi trust aggregation using Regression analysis.
4.2 Overview of the System Approach
1. Trust score is evaluated based on QoS criteria (usage cost, reliability and energy consumption) and social criteria (friendship, social contact and Community of Interest). The direct assessment of a requester on a provider is called as partial trust score, which leads to total trust score.
2. There is no central authority to control the process. Every node can be a requester and provider. Each of the node maintains a evidences or past experience about other neighbors and when requested it is forwarded. The node also stores its own trust score.
3. The direct assessment and the originality of the recommender are weighted. In Bayesian model confidence level is checked whereas the intruders are detected as outliers.
4. Trust scores decay over time is done using decay function in Bayesian model. Similarly trust decay is time driven in regression analysis and the new trust level is reached for the new pattern at time t+1.
5. A trust aggregation function determines how partial trusts are aggregated to compute an overall trust score for a node. The aggregation function chosen depends on the collaboration context. Logistic regression method, which is a multinomial method, is adapted in the work for aggregation.
6. Trust updates (on partial trust scores) are time driven in given time.
The proposed system uses Logistic Regression model and study the performance against Bayesian with Beta distribution model.
4.3 Bayesian Theory for Modelling Trust (Basic Model)
A Bayesian model [32] uses Beta probability density function. It is a probabilistic model that relies on a Beta Function. Beta function Beta (α, β) is given as
where p is the probability of the event occurrences, the value is in the range [0, 1], and β > 0, α > 0. When Bayesian model is applied for trust management process, direct observation and indirect recommendation is used. Direct observation is done when two users interact and indirect recommendation is the feedback about a user by third party.
Let s be successful transaction and f be failed transactions, then in a Bayesian model α = s + 1 and β = f + 1. For every node, any other node can be neighbor node and have interacted before. The experiences are given as feedback to a decision when requested. Let Rxy is the recommendation of node y by node x. The number of successful transaction between x and y is given as αxy. The number of failed transaction is βxy. The recommendation evaluated by x on y is given as
The indirect assessment Rzy by node z on node y is added to node x, with two parameters αzy and βzy. The recommendation is denoted as Rzy. On aggregating this recommendation, the new recommendation is given as
The expected trust value on node y based on x’s assessment and z’s assessment is given as
Txy is calculated as expected value denoted as E by using probability distribution formula of Beta distribution. If the trust value is not satisfied, the node is distinguished as malicious node.
Bayes Inference analysis with Beta distribution for IoT trust
The detailed formulation of Bayesian model is not given in this paper as it is attempted by many researchers and can be referred from the Ref Wiki. The stepwise algorithm is as follows:
When node x computes the trust value of node y, the notation Dxy is used to represent the direct trust value node x has on node y. Take the interactions between node x and node y into account, the two parameters used to represent the observations are, respectively, the following: αxy, is the number of previous successful interactions with node y and βxy, is the number of failed interactions with node y. Dxy is obtained by computing the expected value of the probability distribution function of the beta distribution as follows:
1. Node x compute the direct trust value on node y using no. of previous successful interactions s = 1 and no. of previous failed interactions f = 0.
2. Update the direct value of y periodically. Node x monitor node y at interval of time t and record it.
3. On introducing decay factor λ, update the trust.
4. Checking the credibility of direct trust using confidence level estimation.
5. Compare confidence level with threshold.
6. If confidence ≥ threshold, the direct trust is credible and final trust = direct trust
7. Else, compute indirect trust from a recommender z.
8. Node x combine z’s recommendation on its own record.
9. Choose important recommendation that support more to trust using entropy weighted method.
10. Compute entropy.
11. Compute entropy weight.
12. Summing all indirect recommendations with its weight give overall recommendations.
13. Final trust assessment of node y by node x on integration of direct and indirect trust using Bayes – Beta model for aggregation.
4.4 Logistic Regression Analysis for Trust
Regression analysis is applicable for interpolating insufficient sampling. Logistic regression is a regression method meant for binary resultant problem. The resultant of the classification is always two i.e., 1 or 0. In linear regression the output is a numeric value from which logistic differ. In this model linear variables of the input ‘x’ are integrated with Beta coefficients to predict the output ‘y’. The predictions are transformed using logistic function. The Beta coefficients are trailed from training data. For this, Expectation-Maximum – likelihood (EM) is used.
Maximum-likelihood estimation is used by machine learning algorithm to study the distributions of the points. The coefficients that take the prediction result very close to 1 is best coefficients and the rest are predicted close to 0.
4.4.1 Logistic Regression for Trust Management
When the Logistic regression is applied for trust management, it studies the behavior pattern of the nodes in the given context. The statistical and theoretical base efficiently predicts the behavior of node in dynamically changing environment. We name our model as LogisticRTrust. The model withstands recommendation attacks like ballot-stuffing and bad-mouthing attacks. This is made possible on using outliers to filter the mischievous node instead of filtering with threshold value. In our performance study, when we compared the model to Bayesian inference with Beta distribution, it outperforms the latter.
4.4.2 Behaviour Pattern Assumptions
For the designing of the model, the following are the behavior assumptions taken. Every node in the IoT can be requestor and provider. Let the service requestor be SR and provider be SP. The heterogeneous SP are very dynamic in nature adapting itself to QoS and Social factors.
In a situation, when a SP is waiting for long time to leverage its service and have very less chance to be selected, it starts acting false to somehow make the SR to select it for profit. LogisticRTrust is multivariate and multinomial, and can accommodate different types of QoS and social factors [35].
Problem Definition
Let x, y and z are three nodes in IoT network. The node x in order to get the service of node y, it has to detect the trust level as score for the node y. The trust has to be evaluated on SP y by SR x having history of previous behaviour pattern. The node x have its direct observation
The set of observations
4.4.3 Logistic Regression Based Trust Method
LogisticRTrust use logistic regression [36] to study the relation between regress variables x and observations (binary) oy. LogisticRTrust is flexible to accommodate any number of environment-specific behavior pattern factor (px) that is appropriate for an application. LogisticRTrust uses a linear predictor [36], given as
where E is logistic sigmoid function,
Taking natural log on both sides we have
where the logit function, the probability that the service provided by SP y to SR x is satisfactory is equivalent to the probability that
And
i
Thus on this basis, the relation between
Here, the observation history {P,
4.4.4 Filtering Recommendation Attacks as Outliers
LogisticRTrust absorbs malicious recommenders who on purpose hide the actual observations. For example if the recommender z itself is malicious node then it will twist its recommendation as {
Generally, the statistical inference model based on normal distribution either uni or multivariate is known to be vulnerable to outliers. Also, the statistical model relies on t-distribution when the sample size is very small, variance is unknown and standard error is too small to decide the uncertainty. Graphically, the t-distribution results in heavier tails to be robust to outliers by increasing the probability of faraway samples from the mean. The LogisticRTrust model is advantageous to tolerate the outlier recommendations using t-distribution, so that it is resilient to recommendation attacks.
White noise is discrete signal in discrete time with zero mean and finite variance for the samples of uncorrelated random variables. A t- distribution is probability distribution with heavier tails and it tends to give values far from its mean on giving more chance to extreme values. The t-distribution is more vigorous against outliers and protects βy. The general t-value formula for n samples with expected μ is given as
We replace the latent error in logistic distribution in Eq. (7) with white noise t-distribution, which have means as 0 and the degree of freedom (υ) which refers to the maximum number of logically independent varying values in the data sample. For example, the number of distinct neighbors from whom the recommendation is taken.
Replacing
Therefore weight
The expected weight of
In the M-step of EM, compute a new
i) Given an initial set of observed values as set of starting parameters.
ii) Expectation (E – step): Using the observed data of the dataset, variables are updated on estimating expected value or missing data.
iii) Maximization (M – step): the data after the expectation (E) step is used in updation of hypothesis i.e., maximum likelihood.
iv) Repeat E and M step until convergence to expected output.
Finally, we compute
4.4.5 Algorithm in Steps (LogisticRTrust)
i. Input P (recorded behavior pattern at time T)
Input oy (service evidence recorded at j)
Input
Input PT+1(behavior pattern at T+1, at which trust is predicted)
ii. Initialize iteration index k = 0
Initialize regression coefficient vector
Expectation Maximization Algorithm to infer new coefficient
a) iii. Repeat Step 3 for t = 1 to T
b) Move
c) Compute conditional expectation weight
Where Fυ(x) is cumulative density for random variable x
d) Compute latent variable
Where fυ(x) is probability density function
iv. Compute maximum likelihood
v. Increment k = k+1
vi. Renew the estimate
vii. Repeat Step 3–6 until converges
viii. Output trust by
In the above LogisticRTrust algorithm, the initial behaviour pattern from which trust level is studied and degree of freedom decided is given as input. The degree of freedom is number of independent observations allowed in sample set to participate in estimation part. When degree of freedom decreases, t-distribution attains thicker tail, which show more uncertainty when sample size is small. When degree of freedom increases, the t-distribution tail is thinner but area near center increases so that more sample points are taken for estimation, which lead to accurate trust prediction performance even when the sample size is small. Therefore, the degree of freedom is taken as 4 to account reasonable number of samples required for prediction.
The pattern for which the trust of SP is to be predicted is given as input. The step1 is given input. Step 2 initialize k for number of iteration and initial column vector
4.4.6 Trustworthiness of Node Based on Prediction
Trust on each other IoT entities (nodes) is essential for nodes in uncertain and dynamic network such as IoT. The gathered assessment is propagated as recommendations to other requested nodes. With the help of recommendations, SR build trustworthiness, confidence and expectations on a SP accounting on several characters such as QoS factors and social factors. Every node will have the history of interaction and trust assessment of already serviced nodes. Trust predictions can be done to reason the future behavior tendency of a node a for particular instant. Trust is subjective and non-symmetric. Each entity of IoT takes decision on SP based on the evidences collected from direct observations and recommendations. Recent interaction history about the nodes is captured at different operational condition for latest information.
In the proposed work,
The following are the metrics used to evaluate the efficiency of the model.
Success Rate (Sxy):
The ratio of the number of trustful services received from SP y (i.e.,
Failure Rate: (Fx,y):
It is opposite to the Sxy .The failure rate can be considered as the false negative rate i.e., a bad SP is mistrusted as a good SP.
Bypassing Rate (Bx, y)
It is the rate of missing a satisfactory service.
where
A confusion matrix is a simple interpretation to measure the hazard of misclassification, which reflects in the performance of the model. In a trust model the selection of malicious node as service provider will have adverse effect on trustworthiness of total network. False negative and false positive factors are important measures that lead to misclassification of good and bad nodes. Minimizing False positive and False negative rate leads to ideal performance of the trust system [36]. In the proposed evaluation step, Failure rate: (Fx,y) is False negative rate used to measure the mistrust of a bad SP as good one and Bypassing rate (Bx,y) is False negative rate to measure a missing a satisfactory SP when he performs good. When the trust level of the service provider is satisfactory, the service requestor can decide to interact.
We conducted python simulations to evaluate LogisticRTrust model. The simulation setup is done with 100 nodes with 30% with IoT devices with limited storage and capacity assumptions in 10 m × 10 m with 6 different COI. With on a total of 20% of malicious node and the time slot for 1day with 2 h of intervals.
Let C be the set of all nodes in IoT context space with Users U and devices D = {D1,D2…Dn} with limited capacity called as IoT devices Both users and devices are called nodes.. Every node
Txy= Trust assessment of node x on y, P [] = QoS and Social parameters, Tx = Its own trust score at a time t, Time is updation time interval. From the node for a node as provider 204 interaction history is recorded. The parameter pattern of QoS and Social parameter of 100 records are randomly generated for the experiment. The degree of freedom is 4. The recommenders are categorized as honest type, neutral type and dishonest type.
Our IoT trust management protocol is distributed. The five deign steps of designing trust management Trust parameter formation, composition, propagation, updation and aggregation to final trust are implemented both in Bayesian trust model and Regression analysis model to study the performance. Trust is predicted in a situation where a service requestor SR x puts request to neighbors. a service provider SP y claims that it can provide. SR x wants to know the trustworthiness of SP y. Based on the prediction of trust score using LogisticRTrust algorithm SR x decides on SP y. We framed the decision is in such a way that if the trust level is less than Rsucc = 0.5, SP y is rejected else SP y is selected. Two experiments one below the success rate and another above the success rate is considered. i.e., 0.3 (30%) and 0.6 (60%).
5.4 Comparative Analysis on Trust Accuracy When Average Success Rate is 30% and 60%
The following figures compares the service prediction accuracy between LogisticRTrust and Beta reputation when there is 30% successful recommenders.
From Fig. 2, LogisticRTrust shows trust score above the threshold 0.5 fixed in this experiment setup whereas Bayes does not appear as it is below 0.5 which means tested node are not recommended. This is because Bayes-beta assumes the mean trust using number of positive and negative observations. Therefore, over estimation or under estimation occurs based on the mean value and performs poorly.
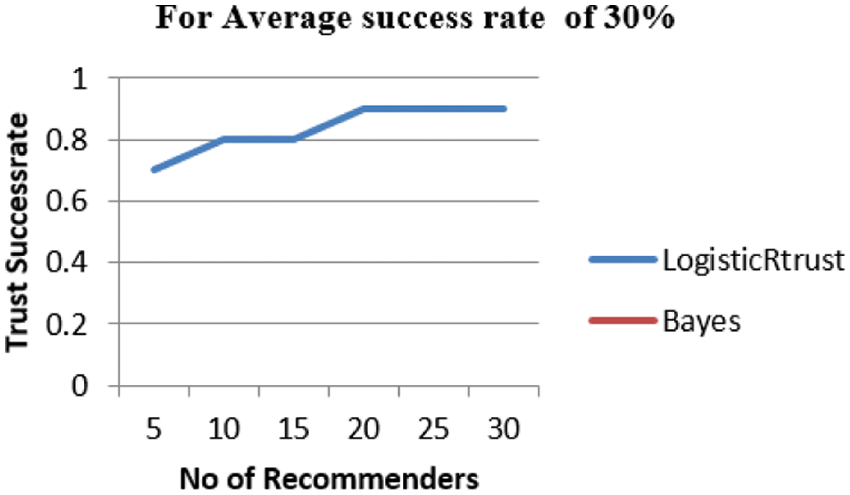
Figure 2: Success rate of trust for 30% of successful recommenders
From Fig. 3, LogisticRTrust shows very low Failure score below the 0.5 but there is no value for Bayes which means it falls around 0.3(30%) which is not considered.
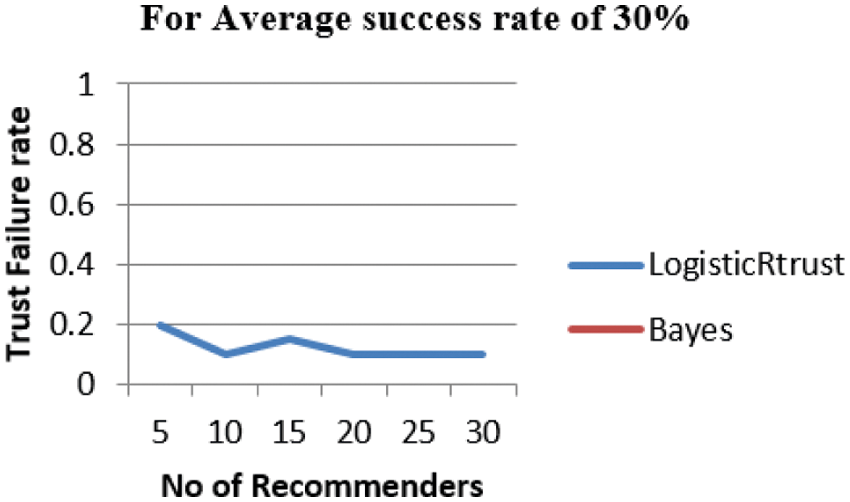
Figure 3: Failure rate of trust for 30% of successful recommender
From Fig. 4, while 30% of average success rate, the LogisticRTrust model show low bypassing rate (lower false positive rate) whereas Beta is closer to 0.3. Bayes-Beta reputation is not sensitive to the number of recommenders. This is because the trust value obtained by Bayes-Beta reputation is close to the SP’s average success rate (30%) and is always below 0.5 consideration level.
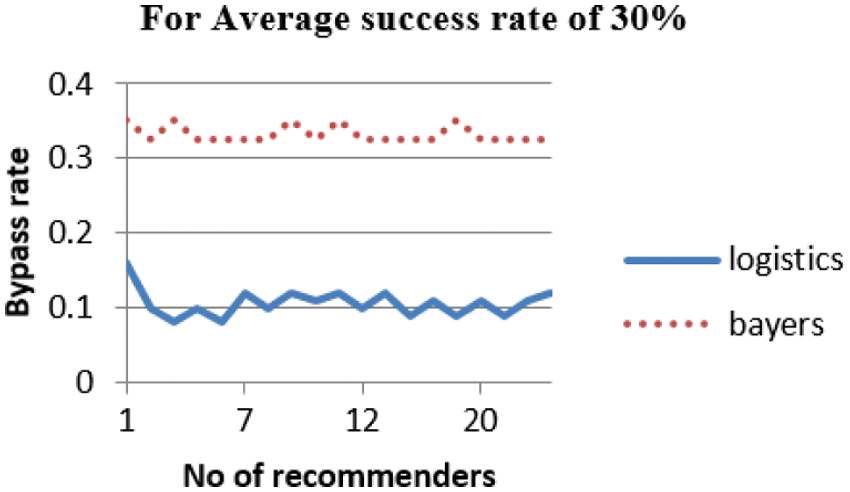
Figure 4: Bypass rate of trust for 30% of successful recommender
LogisticRTrust consistently predicts a high service success rate over and above Rsucc, while Beta reputation produces a success rate that ranges always below nearer to Rsucc. This reason is Beta reputation considers only the numbers of positive and negative observations. We also note that for Beta reputation, the values for the success rate and failure rate are not available when Rsucc = 30%. This is because when Rsucc = 30%, the trust value of SPy predicted by Beta reputation is also around 0.3. Since it is less than 0.5, a SR following the SP selection rule will never select SPy for service. When this situation avoids failed service from SPy, some of the good services of y is also missed. The same result of 30% is attained for Rsucc = 60% showing the behavior of the model is consistent effect for all cases. Due space constraint the successful rate, failure rate and bypassing rate of the 60% result is not included in the paper. Some of the sample result of values that reflect efficient classification obtained are (0, 0.1, 0.2), (0.1, 0.1, 0.2) for low hostility, (0.1, 0.3, 0.4) (0.5, 0.2, 0.1) for medium hostility and (1.0, 0.5, 0.2), (0.1, 0.6, 0.1) for high hostility.
Overall, LogisticRTrust produces a higher and more consistent service prediction accuracy than Beta reputation. This is because Beta reputation assumes a static hidden mean trust value considering only the numbers of positive and negative observations. It performs poorly due to overestimating or underestimating the trust by using the mean value.
5.5 Comparative Analysis on Resilience Against Attacks
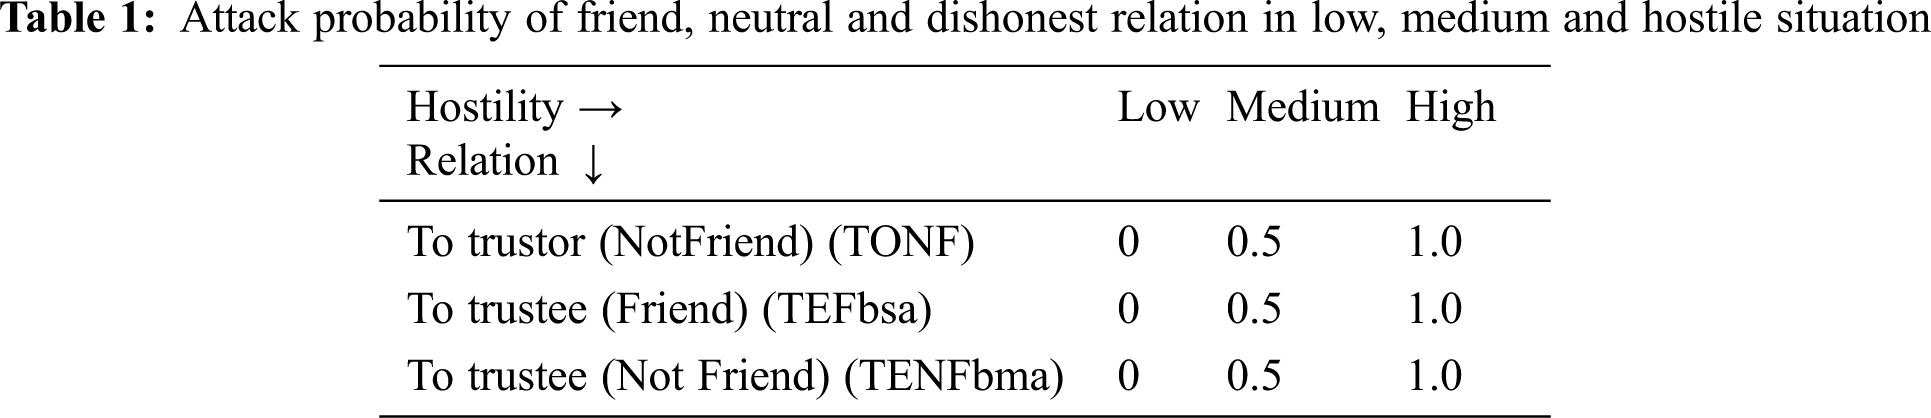
The second set of experiment focuses on the resilience against malicious recommendation attacks. Based on the relationship of the recommender to trustor and trustee, the hostile situation is considered as low hostile, medium hostile and high hostile situation. During the requisition for a feedback about a trustee, the recommender can be loyal or malicious. So for the study, its behavior is taken as honest friend, neutral and dishonest or selfish. The attack made by the recommender are trustor based or trustee based. The important bad mouthing attack and bad stuffing attack are dealt here.
a) Recommender-Trustor– Friend/Not Friend: in this case the recommender give good opinion as the trustor is a friend. However, when the trustor is not friend in order to divert the decision, it hides the truth about the trustee giving bad opinion.
b) Recommender-Trustee-Friend (BSA): In this case, the recommender being a good friend to the trustee, even if he is not trustable, gives more reputation about trustee friend. This is called ballot-stuffing attack leading to select untrusted provider.
c) Recommender-Trustee-Not Friend (BMA): In this case, when the requestor or trustor ask for feedback, as the trustee is not friend in order to ruin his selection, bad opinions are given to the trustor so even if he is a satisfied node to give the service, he may not be selected.
A sample of probability value for the recommender being friend, neutral and dishonest is taken for the study. The values for low, medium and high hostile situation is given below.
The trust value for the above values for three cases with friend relation is given in the following figures. The success rate is plotted against the recommenders and plot is done for both Bayes- beta and proposed LogisticRTrust model.
From Fig. 5, it infers that the behavior of both Logistic and Bayes perform as there is no attack and so the Logistic curves are nearer to maximum trust mark (i.e., 0.5)
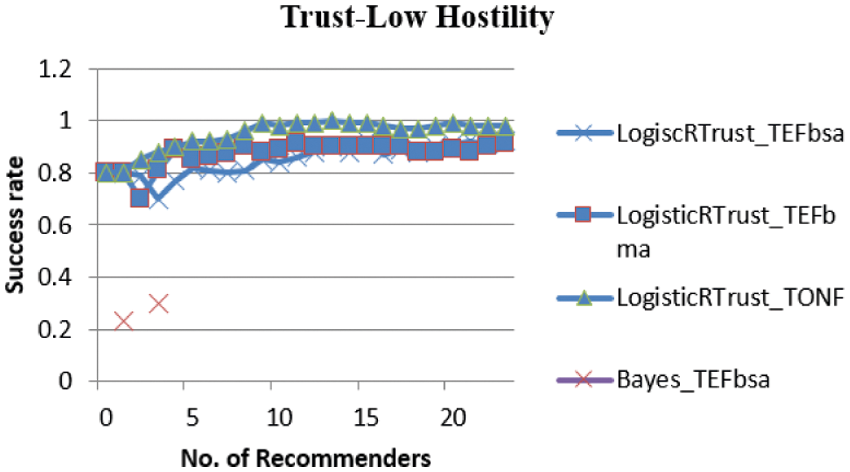
Figure 5: Success rate of LogisticRTrust and Bayes for low hostility
From Fig. 6, it implies that both Logistic and Bayes curves are visible. However, the values of Bayes –Beta model lies below the allowed Trust value. As it is below 0.5, the Service Requestor will not decide to select those nodes.
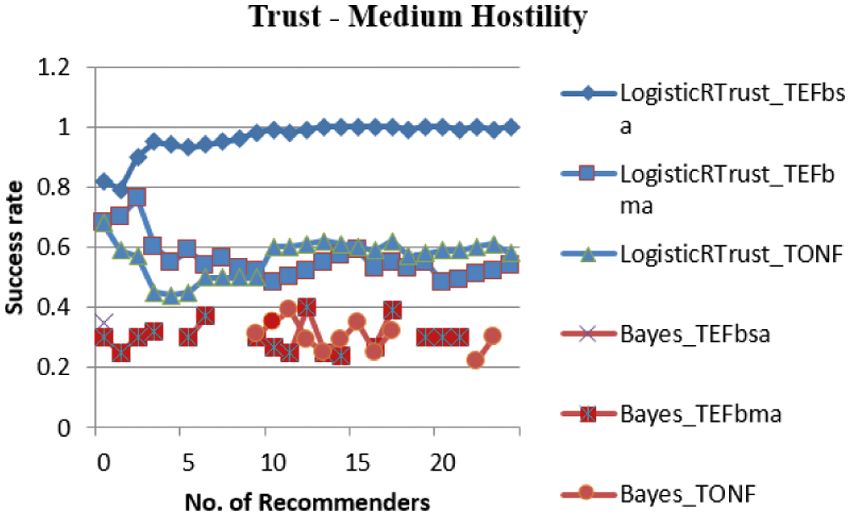
Figure 6: Success rate of LogisticRTrust and Bayes for medium hostility
From Fig. 7, in high hostility situation, Logistic performs better but still most of the points are very low which means only if the model clearly filters out the recommendations under bad mouth attack and TONF they are resilient to the attack. It is seen that it is deviated more from the actual behavior.
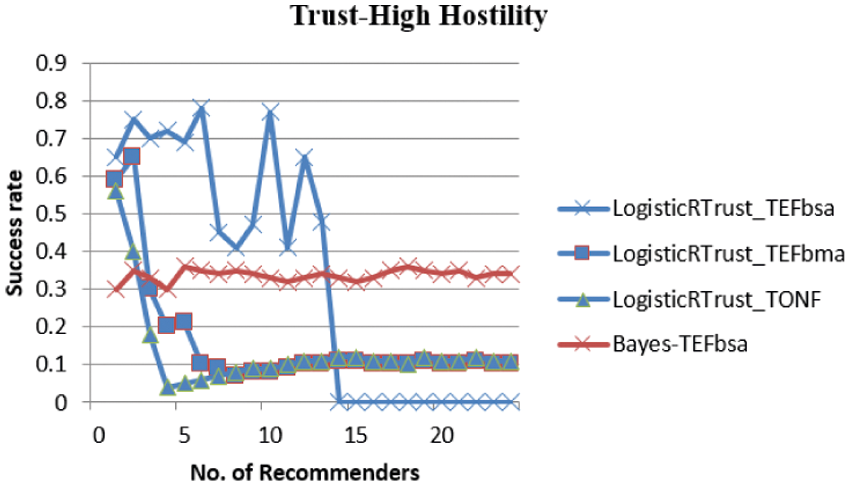
Figure 7: Success rate of LogisticRTrust and Bayes for high hostility
Tab. 1 shows some sample of values we observed for low, medium and high hostile condition respectively. From the graph, it is observed, that the proposed LogisticRTrust perform well than Bayes for the above hostility situation and mitigate against the malicious node. Thus, resiliency to bad mouthing and ballot stuffing attack the proposed model is effective.
Bayes with Beta model responds against the attack by dynamic weighting method where more weight is added to important recommender. Again, it depends on the trustor’s ability to judge the recommender. Whereas, LogisticRTrust rely on statistical detection of outliers so that actual trust evaluation is not polluted. In high hostility situation, the underperformance of Logistic model can overcome by taking recommendations from more number of true friends. The performance may perform little worse when the node of different community of interest is in recommendation list. These are some situations under which regression model need to be analysed more. Regarding Computational feasibility, when LogisticRTrust algorithm is run the EM algorithm for inferring new predictions only for periodical interval shows reasonable runtime and storage.
The proposed LogisticRTrust model based on regression analysis for trust management in IoT showed an enhanced performance in trust prediction and in mitigating against trust based attacks. We considered Bayes analysis as it has strong statistical support for trust management. Existence of very few works using Regression Analysis in Trust management motivated to study the performance of Logistic Regression method in judging the honesty of nodes in network. Regression method is preferred as it can admit multiple variants, which is very essential condition of IoT environment. Moreover, the algorithm periodically records the behavior pattern of the nodes in social network which changes dynamically and can enter and leave a network at any time.
From the study, LogisticRTrust outperforms Bayes-Beta with high service success rate, failure and bypass rate in both the cases of above and below average success rate. The performance is due to the behavioral pattern study of the nodes based on social relationships viz. friendship, cooperativeness and Community of Interest, which influence trust highly. The reason for less performance of Bayes when compared to LogisticRTrust is of considering only negative and positive feedback from recommenders, which lead them to judge a bad node with good behavior, or sometimes misses the service of a good provider as bad one.
The experimental evaluation also indicates that at two situations where the LogisticRTrust algorithm underperforms. It can perform well in high hostile situation only when it is able to filter recommendations of strangers and take more recommendations from close friends. The future work carries the analysis of Regression model for centralized system, when the data are very sparse in case where difficult to classify the outliers and to study the impact of various social relationship on total trust when regression analysis is used to predict the trust.
Funding Statement: The authors received no specific funding for this study.
Conflicts of Interest: The authors declare that they have no conflicts of interest to report regarding the present study.
1. S. Agrawal and M. L. Das, “Internet of things-A paradigm shift of future internet applications,” in Proc. of the Nirma University Int. Conf. on Engineering, India, pp. 1–7, 2011. [Google Scholar]
2. L. Atzori, A. Iera and G. Morabito, “The internet of things: A survey,” Computer Networks, vol. 54, no. 15, pp. 2787–2805, 2010. [Google Scholar]
3. A. Gluhak, S. Krco, M. Nati, D. Pfisterer, N. Mitton et al., “A survey on facilities for experimental internet of things research,” IEEE Communications Magazine, vol. 49, no. 11, pp. 58–67, 2011. [Google Scholar]
4. O. Bello and S. Zeadally, “Intelligent device-to-device communication in the internet of things,” IEEE Systems Journal, vol. 10, no. 3, pp. 1172–1182, 2016. [Google Scholar]
5. H. Ning, H. Liu and L. T. Yang. “Cyber entity security in the internet of things,” Computer, vol. 46, no. 4, pp. 46–53, 2014. [Google Scholar]
6. Z. Yan, P. Zhang and A. Vasilakos, “A survey on trust management for internet of things,” Journal of Network and Computer Applications, vol. 42, pp. 120–134, 2014. [Google Scholar]
7. G. Fortino, A. Guerrieri, C. Savaglio and W. Russo, “Integration of agent-based and cloud computing for the smart objects-oriented IoT,” in Proc. of the 2014 IEEE 18th Int. Conf. on Computer Supported Cooperative Work in Design, China, pp. 493–498, 2014. [Google Scholar]
8. Z. Yan and S. Holtmanns, “Trust modeling and management: From social trust to digital trust,” in Computer Security, Privacy and Politics: Current Issues, Challenges and Solutions, 1st ed, vol. 1, Hershey, PA: IGI Global, pp. 290–323, 2008. [Google Scholar]
9. J. Gubbi, R. Buyya, S. Marusic and M. Palaniswami, “Internet of things (IoTA vision, architectural elements, and future directions,” Future Generation Computer Systems, vol. 29, no. 7, pp. 1645–1660, 2013. [Google Scholar]
10. J. Guo, R. Chen and J. J. Tsai, “A survey of trust computation models for service management in internet of things systems,” Computer Communications, vol. 97, pp. 1–14, 2017. [Google Scholar]
11. S. Singh and S. Bawa, “Privacy, trust and policy based authorization framework for services in distributed environments,” International Journal of Computer Science, vol. 2, no. 2, pp. 85–92, 2007. [Google Scholar]
12. U. Jayasinghe, G. M. Lee, T. W. Um and Q. Shi, “Machine learning based trust computational model for IoT services,” IEEE Transactions on Sustainable Computing, vol. 4, no. 1, pp. 39–52, 2019. [Google Scholar]
13. D. H. McKnight and N. L. Chervany, “Conceptualizing trust: A typology and E-commerce customer relationships model,” in Proc. of the 34th Hawaii Int. Conf. on System Sciences, USA, pp. 10–19, 2001. [Google Scholar]
14. B. S. Yosra, A. Olivereau, D. Zeghlache and M. Laurent, “Trust management system design for the internet of things: A context-aware and multiservice approach,” Computers & Security, vol. 39, no. 2, pp. 351–365, 2013. [Google Scholar]
15. W. Sherchan, S. Nepal and C. Paris, “A survey of trust in social networks,” ACM Computing Surveys, vol. 45, no. 4, pp. 1–33, 2013. [Google Scholar]
16. P. Hao, X. Wang and W. Shen, “A collaborative PHY-aided technique for end-to-end IoT device authentication,” IEEE Access, vol. 6, pp. 42279–42293, 2018. [Google Scholar]
17. S. Javaid, H. Afzal, F. Arif, N. Iltaf, H. Abbas et al., “CATSWoTS: Context aware trustworthy social web of things system,” Sensors, vol. 19, no. 14, pp. 1–21, 2020. [Google Scholar]
18. I. U. Din, M. Guizani, B. Kim, S. Hassan and M. K. Khan, “Trust management techniques for the internet of things: A survey,” IEEE Access, vol. 7, pp. 29763–29787, 2019. [Google Scholar]
19. N. Bui and M. Zorzi, “Health care applications: A solution based on the internet of things,” in Proc. of the 4th Int. Symp. on Applied Sciences in Biomedical and Communication Technologies, Spain, pp. 1–5, 2011. [Google Scholar]
20. A. J. Jara, M. A. Zamora and A. F. G. Skarmeta, “An internet of things-based personal device for diabetes therapy management in ambient assisted living (AAL),” Personal and Ubiquitous Computing, vol. 15, no. 4, 2011, pp. 431–440. [Google Scholar]
21. M. Kranz, L. Roalter and F. Michahelles, “Things that twitter: Social networks and the internet of things,” in CIoT Workshop at the Eighth Int. Conf. on Pervasive Computing, Finland, 2010. [Google Scholar]
22. L. Atzori, A. Iera and G. Morabito, “SIoT: Giving a social structure to the internet of things,” IEEE Communication Letters, vol. 15, no. 11, pp. 1193–1195, Nov. 2011. [Google Scholar]
23. F. Bao and I. R. Chen, “Trust management for the internet of things and its application to service composition,” in Proc. of the IEEE Int. Symp. on a World of Wireless, Mobile and Multimedia, USA, pp. 1–6, 2012. [Google Scholar]
24. I. R. Chen, F. Bao and J. Guo, “Trust-based service management for social internet of things systems,” IEEE Transactions on Dependable and Secure Computing, vol. 13, no. 6, pp. 684–696, 2016. [Google Scholar]
25. R. Roman, P. Najera and J. Lopez, “Securing the internet of things,” Computer, vol. 44, no. 9, pp. 51–58, 2011. [Google Scholar]
26. D. Chen, G. Chang, D. Sun, J. Li, J. Jia and X. Wang, “TRM-IoT: A trust management model based on fuzzy reputation for internet of things,” Computer Science and Information Systems, vol. 8, no. 4, pp. 1207–1228, 2011. [Google Scholar]
27. G. Lize, W. Jingpei and S. Bin, “Trust management mechanism for internet of things,” Communications, China, vol. 11, no. 2, pp. 148–156, 2014. [Google Scholar]
28. H. Xiao, N. Sidhu and B. Christianson, “Guarantor and reputation based trust model for social internet of things,” in Proc. of the IEEE Int. Wireless Communications and Mobile Computing Conf. (IWCMC), Croatia, pp. 600–605, 2015. [Google Scholar]
29. Y. Yu, Z. Jia, W. Tao, B. Xue and C. Lee, “An efficient trust evaluation scheme for node behavior detection in the internet of things,” Wireless Personal Communications, vol. 93, no. 2, pp. 571–587, 2017. [Google Scholar]
30. M. Hamdi and H. Abie, “Game-based adaptive security in the internet of things for E-health,” in Proc. of the IEEE Int. Conf. on Communications (ICC), Australia, pp. 920–925, 2014. [Google Scholar]
31. J. H. Cho, A. Swami and I. R. Chen, “A survey on trust management for mobile adhoc networks,” IEEE Communications Surveys & Tutorials, vol. 13, no. 4, pp. 562–583, 2020. [Google Scholar]
32. P. Massa and P. Avesani, “Trust-aware recommender systems,” in ACM Recommender Systems Conf., Minnesota, USA, 2007. [Google Scholar]
33. I. Chen, J. Guo and F. Bao, “Trust management for SOA-based IoT and its application to service composition,” IEEE Transactions on Services Computing, vol. 9, no. 3, pp. 482–495, 2019. [Google Scholar]
34. J. Guo and I. Chen, “A classification of trust computation models for service-oriented internet of things systems,” in Proc. of IEEE Int. Conf. on Services Computing, USA, pp. 324–331, 2015. [Google Scholar]
35. C. Liu, “Robit Regression: A simple robust alternative to logistic and probit regression,” in Applied Bayesian Modeling and Causal Inference from an Incomplete-Data Perspective, In: A. Gelman and X. L. Meng (Eds.London: Wiley, 2004, chapter. 21. [Google Scholar]
36. F. Bao, I. R. Chen, M. J. Chang, J. H. Cho, “Trust-based intrusion detection in wireless sensor networks,” in IEEE Int. Conf. on Communications (ICC), Japan, pp. 1–6, 2011. [Google Scholar]
 | This work is licensed under a Creative Commons Attribution 4.0 International License, which permits unrestricted use, distribution, and reproduction in any medium, provided the original work is properly cited. |