DOI:10.32604/csse.2023.023307
| Computer Systems Science & Engineering DOI:10.32604/csse.2023.023307 | |
| Article |
Disaster Monitoring of Satellite Image Processing Using Progressive Image Classification
1Department of Mathematics, Faculty of Science, New Valley University, El-Kharga, 72511, Egypt
2Department of Computer Science, College of Computer and Information Sciences, Princess Nourah bint Abdulrahman University, P.O. Box 84428, Riyadh 11671, Saudi Arabia
*Corresponding Author: Romany F. Mansour. Email: romanyf@sci.nvu.edu.eg
Received: 02 September 2021; Accepted: 20 December 2021
Abstract: The analysis of remote sensing image areas is needed for climate detection and management, especially for monitoring flood disasters in critical environments and applications. Satellites are mostly used to detect disasters on Earth, and they have advantages in capturing Earth images. Using the control technique, Earth images can be used to obtain detailed terrain information. Since the acquisition of satellite and aerial imagery, this system has been able to detect floods, and with increasing convenience, flood detection has become more desirable in the last few years. In this paper, a Big Data Set-based Progressive Image Classification Algorithm (PICA) system is introduced to implement an image processing technique, detect disasters, and determine results with the help of the PICA, which allows disaster analysis to be extracted more effectively. The PICA is essential to overcoming strong shadows, for proper access to disaster characteristics to false positives by operators, and to false predictions that affect the impact of the disaster. The PICA creates tailoring and adjustments obtained from satellite images before training and post-disaster aerial image data patches. Two types of proposed PICA systems detect disasters faster and more accurately (95.6%).
Keywords: Clustering; segmentation; progressive image classification algorithm; satellite image; disaster detection
Disaster conservation has become one of the most active areas in remote sensing research, as preserving human life is our top priority after a disaster—to allow for swift response operations following catastrophic disasters, such as landslides and flood adjustments. Previous studies rely on sensors that only focus on detected changes. They manually categorize and adjust comparisons based on image processing techniques and disaster-induced change detection methods. The efficiency of the extraction mechanism can be improved through detection accuracy and mounting machine learning (ML). In the machine learning literature, a significant number was detected. Bag Overlays Recommended Appearance-Words were placed to identify mass destruction using artificial neural network cyclone track prediction. In this year’s evaluation, the feed-forward multi-layer neural network is applied for measuring the efficacy of the neural network classification. Then, the three-dimensional view features are used to detect corruption. On the other hand, the learning method performed identified serious geological hazards. One of the most famous deep learning approaches, PICA, is being tested for better results during disasters, including avalanches, earthquakes, and landslides. Mainly focused on sensors, they are simple for this disaster detection system. Consequently, they ran into some important issues. For example, the range of confirming that a disaster has occurred is insufficient for verbal communication, limited by the number of sensors, and depends on whether the correct, accurate data is sent. Also, satellite images of disasters involving operators cannot handle large-scale detection quickly. Therefore, this information can lead to misunderstandings and negligence of disasters. Based on this example, based on previous research. Therefore, the advantage of such a system is the depth of its capacity to detect disasters established by each assisted automatic disaster learning monitor. Such an operation occurs in a wide range of satellite images. The proposed Progressive Image Classification Algorithm (PICA) is employed for enhancing the system performance.
A new framework is proposed for integrating a multi-temporal regional climate zone classification of Open Street Map (OSM) data with satellite images. The stack is equipped with the most common data fusion method but doesn’t take the heterogeneity of multi-modal optical image data and OSM into account [1]. It presents frame images that match the shooting modes of China’s new Gaofen-4 nominal projection model. At the end of the experiment, numerous models were designed to compare a detailed analysis of the difference between the three shows with the nominal grid [2]. The detection algorithm systemized image-based analysis, filtering fire pixels, and time analyses are not clear to confirm the actual test—the fire detection comparison between predicted and measured values based on the system [3]. Remote sensors onboard aircraft and satellites absorb light reflected from the surface of the Earth. Various image processing techniques are needed to transmit the data to the image [4].
The above includes a brief introduction to service-based flood monitoring, its technology, and the development of significant hazard information products [5]. The main reason for this is that many products are related to the predominant spatial data infrastructure—a complicated theoretical explanation of body dynamics. Academic tasks are more complex than modeling a cycle laser field, especially on a dynamic time-scale spatial database [6]. Monitoring changes in urban growth is an essential issue in urban planning and disaster management [7]. Earth images are enormous and complicated because they have been selected as a neural network dedicated to image enhancement, a specific location with no place to detect and improve it [8] automatically.
At present, due to the accumulation of toxic substances in waste cities and the more dangerous air pollution present in mines of some cities, including the City of Cerro de Pasco [9], Synthetic Aperture Radar (SAR) satellite imagery was used to attempt to monitor the occurrence of natural disasters. Microwave ovens in the lower part of Polar metric L-band Synthetic Aperture Radar (PALSAR-2) emits backscattered waves received on the surface of the earth as observation data [10]. A new solution is presented in three-axis on the stable center of gravity subpixel star to the satellite with a geostationary earth observation focus sensor. A small two-dimensional array is used to capture star points, which is better than a linear array of detectors [11]. Polar metric L-band Synthetic Aperture Radar is used to examine the possibility of wide area land cover classification [12].
Instead of a continuous need for regular monitoring of damage, drought, and other natural disasters, satellite images can be used to modify the overall monitoring of dam reservoirs and water resources of river basins [13]. It has extensive coverage of a series of pan-chromatic sensor spectral satellites, from geosynchronous to sun-synchronized optical radar, so that the system has a higher spatial and temporal resolution, as well as high spectral capabilities [14]. The main objective of this research was to define the appropriate spectral characteristics of rice flood development related to remote sensing image data, domain scale mapping, and detection methods [15]. Residential areas are essential places for human habitation and living. Utilizing remote detection innovation to distinguish local locations is of special incentive for land asset arranging and use, and for fiasco anticipation and alleviation in different regions [16].
Therefore, we analyzed image data from remote sensing satellite for recognizing the changes in forest cover. Since the original data has jobs and severe pollution defects, we decided to design a mechanism to restore the image due to the lack of spatial and temporal surface reflection information [17]. The aim is to reduce the over-segmentation algorithm with minimal loss of data and to transform the image size by splitting the image pixels into supergroups, which provides an easy way to take advantage of the interdependence of adjacent pixels [18]. Land Observing Technology Satellite-2 (LOTS-2) specializes in agricultural and natural resource monitoring. The resources monitored by LOTS-2 include forests and sea/land ice. As technology develops, the Earth observation satellite was introduced for environmental monitoring to prevent and mitigate disasters [19]. Earth observation satellite constellations with near real-time surveillance systems are expected to be used for the management of disaster. Though, since these satellites are over a few minutes late, they mayn’t have enough time to send all of their observations to a Low Earth Orbit (LEO) satellite’s ground station [20]. Many recent approaches have presented feature extraction processes based on deep learning, which are used in this paper [21–34]. Two thin covers detect the coarse resolution of images acquired at different times with land changes, and the excellent spatial and temporal resolution of the image resolution change identifies new super-resolution methods [35].
The Progressive Image Classification Algorithm (PICA) system implements machine learning methods to detect or identify disaster areas to optimize the performance of their outcomes. This methodology is better suited for one of the applications given in the following. It is part of one of the significant technological branches of performance learning, and technology that detects areas of change or, in this scenario, disasters. Fig. 1 shows the block diagram of the presented system.
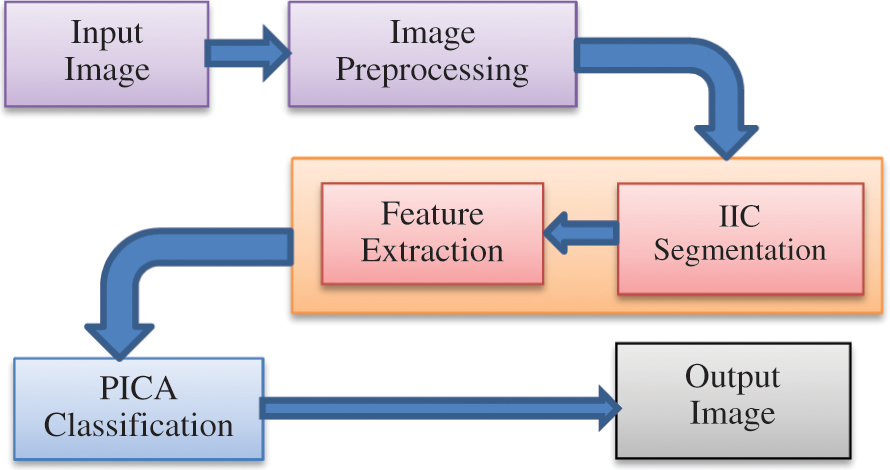
Figure 1: The proposed system block diagram
The suggested classification algorithm system consists of two stages: the testing and the training phases. This section presents studies that produce unique high precision results. The purpose of our research is to learn about the changes from previous disasters. In other words, the difference in the learning image feature change detection was obtained from the pre-disaster image (3 RGB channels) and the post-disaster image (3 RGB channels). In most previous studies, the query image is a feature-absorption only from disasters to meet the nature of disasters treated as change detection. Therefore, previous studies can be obtained from the early stages of error results. This focuses on reducing error from the initial (learning) phase, detecting changes in the image before and after the disaster, and detecting the means of change caused by a disaster. Most importantly, our method is faster and more accurate than previous studies in disaster detection speed.
3.1 Image Preprocessing Median Filter
To obtain some helpful information on how some images work in digital form, they are transformed via image processing. To detect any changes in a geographical area, we need to take minimum 2 digital images at the identical sensor and at various time periods. The algorithm gives a step-wise analysis for using satellite image change recognition. Typically, Input image is considered at distinct time intervals—called noise filters—and the image distortion and then redundant data are removed. The filtering procedure is termed the image convolutional mask. With filter, the types of images depend on the sound of the impact. Ambiguous sounds could be eliminated by an image filter. Image blurs are eliminated from the details before extensive object extraction. The overview of enhancement technique could improve images. The following algorithm shows the intermediate filtering-based image preprocessing technology.
Step 1: Initialization of the input images by using the satellite; that input image analysis the pixel values.
Step 2: Evaluate all the color channels with pixel intensity as well as gray level; the intensity values are symbolized with the letter k.
Step 3: Analyze the input earth image value in comparison with the post images, as well as subtract the values.
Step 4: Apply the co-relative frequency of the input image.
Step 5: Use the filtering methodology for comparing the performance of the disaster image areas with the ground truth values.
Step 6: Stop.
Image segmentation methods are commonly applied to obtain data related to digital images or to discover limits with objects. The division is a significant advance in picture examination—any circumstance or setting-free division. A non-transformed context that transforms a grayscale or color image into a binary image has similar gray levels. It divides the pixels into context groups together while setting the binary mapped regions near the spatial position. The threshold uses two disjoint areas with input data values and other thresholds greater than those of the most straightforward non-contextual segmentation technique. The image can be segmented by pixel, region, or a combination of two or more texture-based techniques until the blending process is complete. Segmentation uses an intermittent image clustering segmentation algorithm through the following steps:
Step 1: Get the preprocessed image, analyze the value, and cluster the image.
Step 2: Initialize the bias field to the mean-variance of the input image and estimate the image weight to initial probability.
Step 3: Estimate the expected value of the hidden intensity value for the current value.
Step 4: Turn the original p indicators into a linear combination using a new Intermittent Image Clustering Segmentation (IICS) with comprehensive index mathematical processing.
Step 5: Set the model parameters by taking the maximum likelihood estimate according to the current valuation of the complete data.
Step 6: The best test results can be achieved through IICS without the pattern background image method, but the algorithm detects limitations on the types of targets.
Step 7: Stop.
It is an important piece of technique in remote sensing. The PICA technique is depending on object-based image analyses, and supervised learning classifier are 3 major kinds. Either this method could be utilized for classification, or an approach could be utilized in this methodology. They can perform the technique with a combination of discriminative image classification algorithms (DICAs). The Geographic Information System (GIS) detects changes by measuring the nature of a particular area and how it has changed over time between more than one periods. It frequently includes the comparison of satellite and aerial images captured in areas at different time periods. Change detection can be modified using pixel-based methods based on object changes by using mixed change detection methods. An image change may be a change that occurs because of a shape that is different from the disappearing object or movement. Distinguishing proof of quantitative and subjective change identification has become significant in all territories. As of late, this identification illustrates changes in remote detection images, which have become a significant research issue due to the pace of change in conditions, nature, and urban territories. The Discriminant Image Classification Algorithm can be applied through the following steps:
Step 1: Initialize or re-estimate the model parameter.
Step 2: Preprocessing and enhancing quality of the image.
Step 3: Two parameter vectors: dimensional parameter of the info picture and S-dimension parameter of multinomial conveyance.
Step 4: Randomly initializing three variables before they are updated; i.e., the scene index of sub-images S; the binary matrix B; which indicates the class selection of each sub-image, and the matrix of the class labels of over-segments Z.
Step 5: Sampling the class selection indicator binary vectors.
where
Step 6: Sample class labels for all the over-segments, instead of sample the class labels of the over-segment.
Step 7: The quantity of class K isn’t fixed in this algorithm. The real number of classes is endless, while only a limited number is used to show the picture.
Step 8: Check the union as well as driving the characterization outcomes. Afterward the Gibbs examining strategy is finished, the calculation decides if intermingling has been accomplished.
Step 9: Looping until the criterion definition stops.
Step 10: End.
The presented Progressive Image Classification Algorithm (PICA) is an analysis in MATLAB 2017b, which has the more commonly used operating manipulation and in the two-dimension information and progresses according to the specific process for specific operations of the Progressive Image Classification Algorithm (PICA) and conditions for implementation. The dataset used is the National Centers for Environment Information (NCEI) (Big Data), which belongs to the method for displaying and analyzing each of the simulation results. The upload information inspector views confirmation signals from multiple analog data and data groups or analyses of ongoing simulations.
Fig. 2 shows the proposed Progressive Image Classification Algorithm (PICA) GUI image. This system describes the likelihood of designing an automatic approach for extracting the output images. The PICA approach models complete the detection of satellite images.
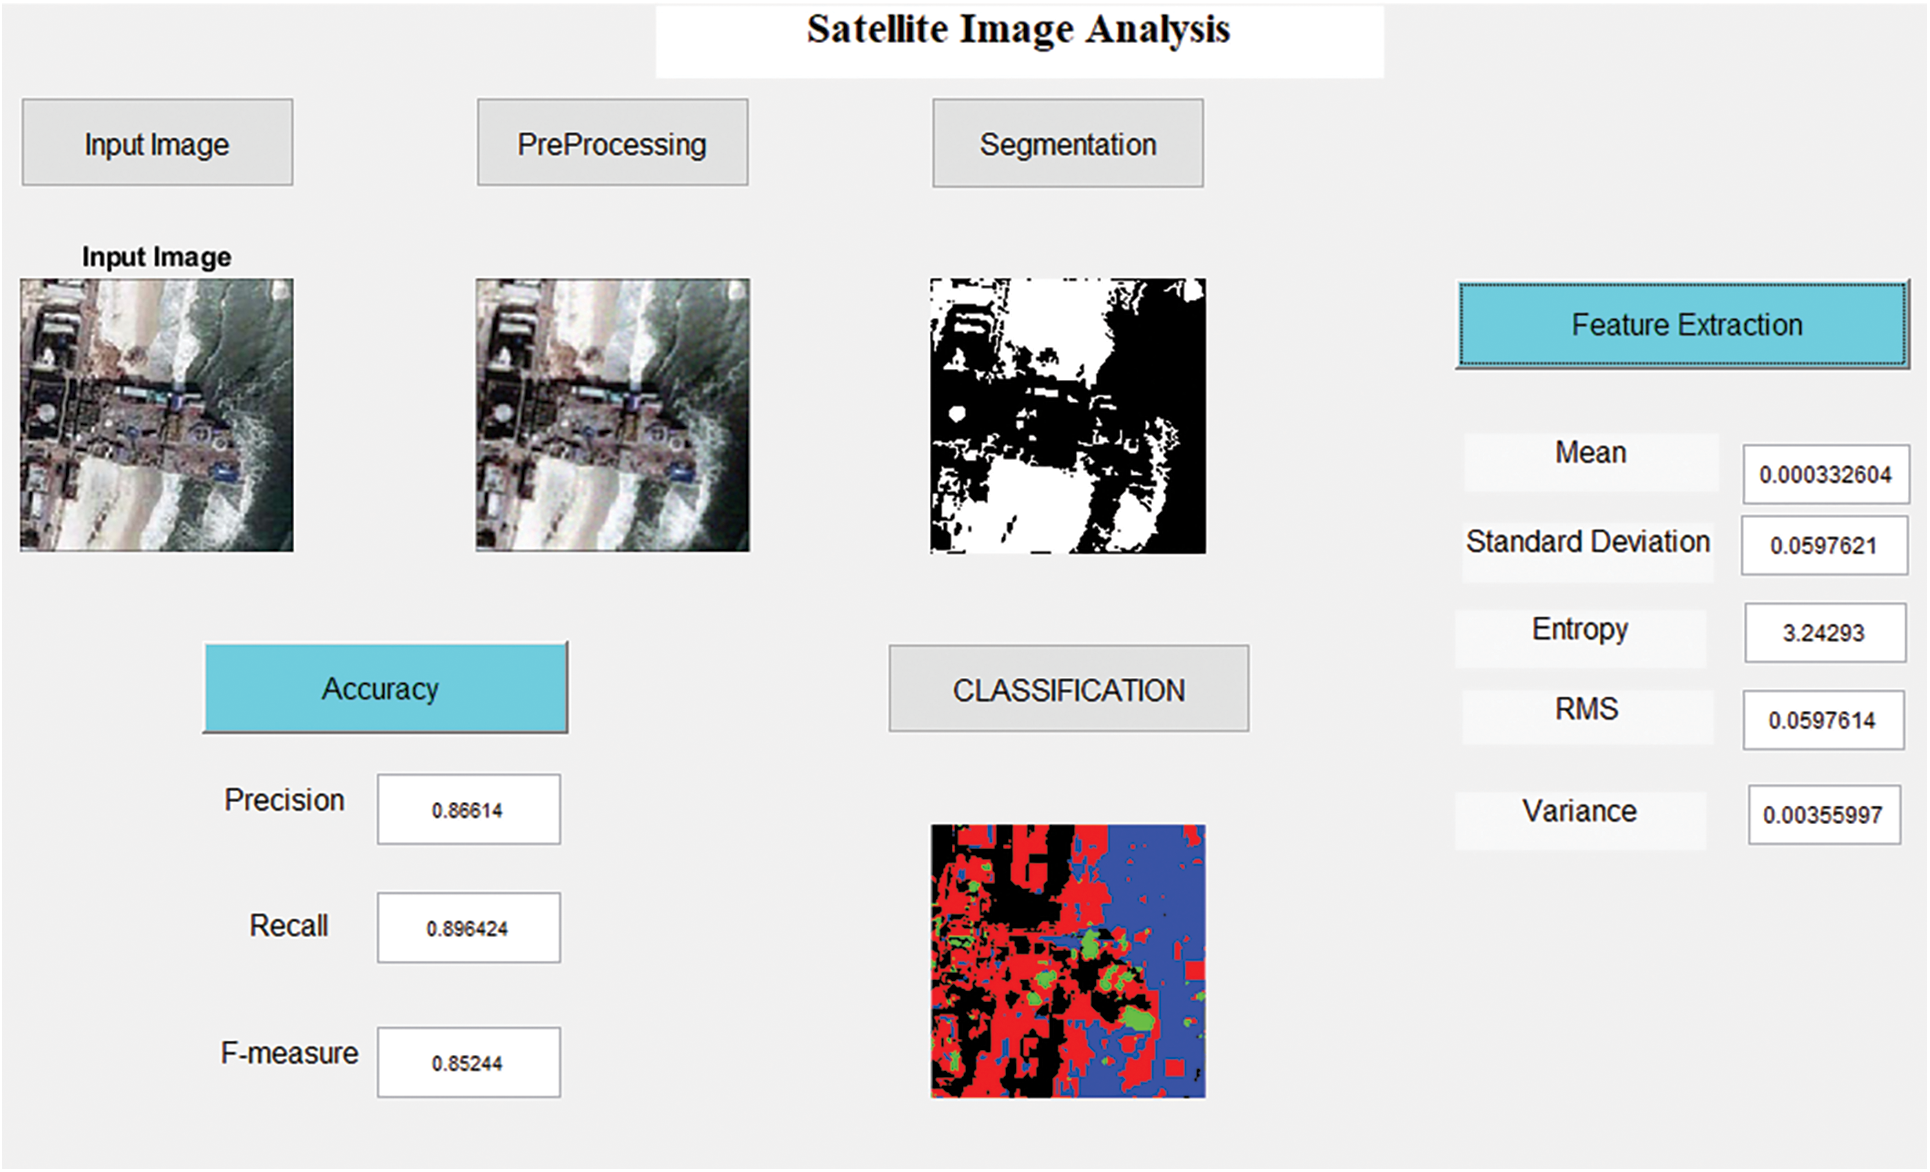
Figure 2: Proposed Progressive Image Classification Algorithm Satellite Image
Tab. 1 reveals that the Tracking Sensitivity, Tracking Specificity, Tracking Accuracy, Precision, and Recall of the proposed PICA methodology is greater when compared to the other traditional approaches.
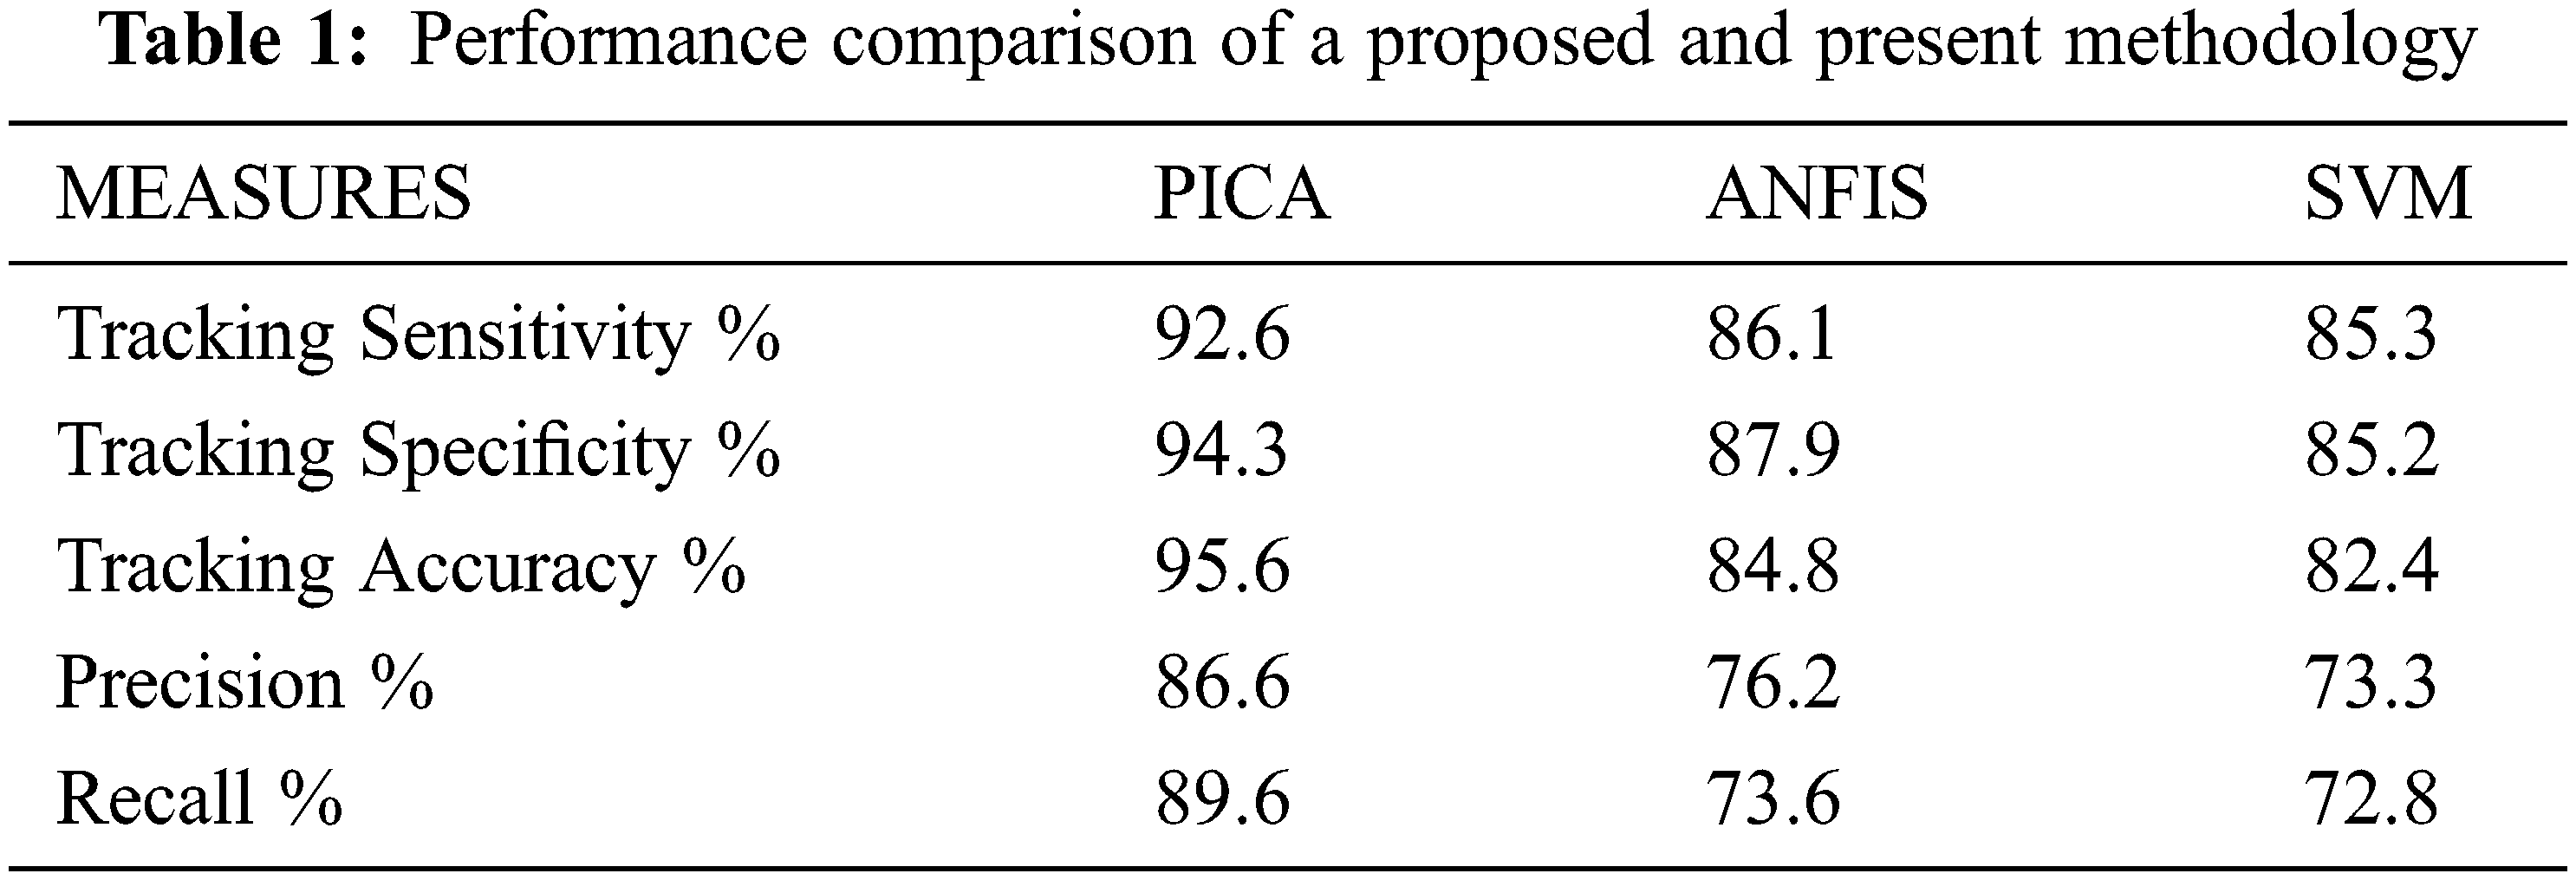
Fig. 3 shows the most prominent exhibit of the Progressive Image Classification Algorithm (PICA). It estimates depiction accuracy, affectability, and specifications accomplished using traditional methodologies. The PICA approach limits the variations in primary region.
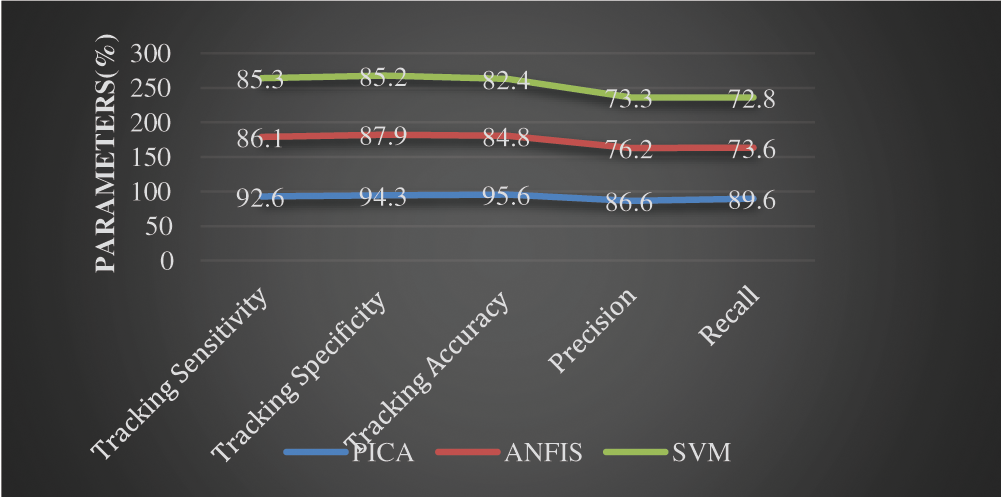
Figure 3: Graphical representations of various evaluation metrics
Fig. 4 demonstrates a comparison of the false measurements generated by various methodologies. Clearly, it illustrates that the presented Progressive Image Classification Algorithm (PICA) method generated a very small ratio when compared to the other techniques.
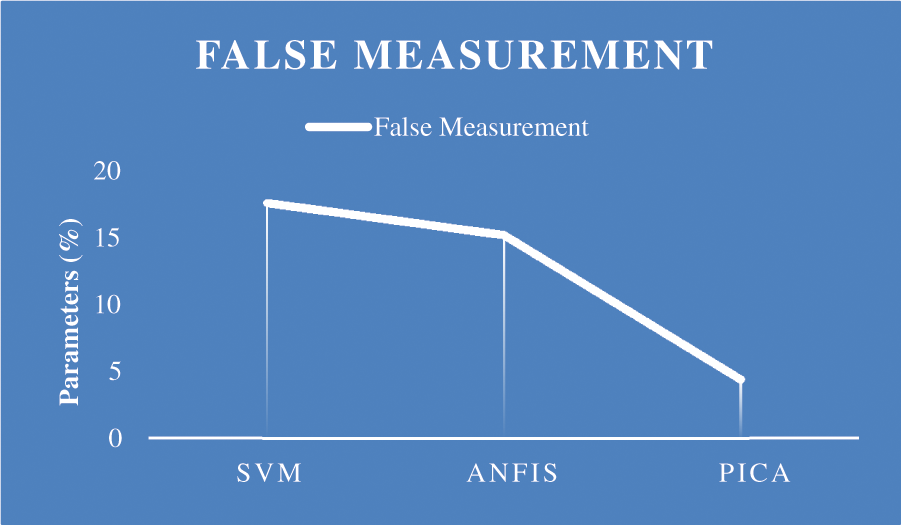
Figure 4: False measurement
The proposed Progressive Image Classification Algorithm (PICA) methodology improves precision, recall, and f-measure parameters. There is no loss of color data when combining the Progressive Image Classification Algorithm (PICA) for determining the disaster region. RGB channels are combined after the disaster in six channels in advance. Hence, the traditional method, including only two channels, with a simple subtraction method of different channels, including pre-disaster by channel, uses grayscale and grayscale disaster (disaster area or G in extraction by channels R or B). Therefore, the new method of extraction from the affected region gives effective outcomes without any loss of original data. The presented technique has been executed as a possible disaster relief center in each disaster detection mechanism globally. Further, our technique is improved by generating a rescue route for the operator to identify natural disaster in the affected areas, search for casualties that assist victim of said disasters with remarkable outcomes, contributing to the improvements, as well as helping to narrow our performance here. In our study, the presented methodology shows a 95.6% of accuracy when compared to the traditional methodology.
Acknowledgement: Princess Nourah bint Abdulrahman University Researchers Supporting Project number (PNURSP2022R161), Princess Nourah bint Abdulrahman University, Riyadh, Saudi Arabia.
Funding Statement: This project was funded by Princess Nourah bint Abdulrahman University, Riyadh, Saudi Arabia, under grant No. (PNURSP2022R161).
Conflicts of Interest: The authors declare that they have no conflicts of interest to report regarding the present study.
1. Z. Guichen and G. Pedram, “Fusion of heterogeneous earth observation data for the classification of local climate zones,” in IEEE Trans on Geoscience and Remote Sensing, vol. 57, no. 10, pp. 7623–7642, 2019. [Google Scholar]
2. T. Xiaochong and W. Jing, “Normalized projection models for geostationary remote sensing satellite: A comprehensive comparative analysis,” in IEEE Trans on Geoscience and Remote Sensing, vol. 57, no. 10, pp. 7623–7642, 2019. [Google Scholar]
3. L. Zhengyang and C. Fang, “A contextual and multi-temporal active-fire detection algorithm based on FengYun-2G S-VISSR data,” in IEEE Trans on Geoscience and Remote Sensing, vol. 57, no. 11, pp. 8840–8852, 2019. [Google Scholar]
4. N. Anusha and B. Bharathi, “An overview on change detection and a case study using multi-temporal satellite imagery,” in Int. Conf. on Computational Intelligence in Data Science,Chennai, India, pp. 1–6, 2019. [Google Scholar]
5. J. Franz and A. Olaniyi, “Applications of a SAR-based flood monitoring service during disaster response and recovery,” in Int. Geoscience and Remote Sensing Sym., Yokohama, Japan, 2019. [Google Scholar]
6. B. Boris and K. Matthias, “Single-cycle non-sequential double ionization,” in IEEE Journal of Selected Topics in Quantum Electronics, vol. 21, no. 5, pp. 1–9, 2019. [Google Scholar]
7. Ç. Tuna, F. Merciol and S. Lefèvre, “Monitoring urban growth with spatial filtering of satellite image time series,” in Joint Urban Remote Sensing Event, Vannes, France, pp. 1–4, 2019. [Google Scholar]
8. V. Lalitha, S. Rangaswamy, C. Gouthami, T. Jai, P. Kumar et al., “Satellite image enhancement using neural networks,” in 2018 3rd Int. Conf. on Inventive Computation Technologies (ICICT), Coimbatore, India, pp. 211–215, 2018. [Google Scholar]
9. E. Lozano, E. Berrospi and A. Roman, “Detection of minerals through the processing of satellite images,” in Int. Conf on Electronics, Electrical Engineering, and Computing, Lima, Peru, pp. 1–4, 2018. [Google Scholar]
10. R. Umemura, T. Samura and K. Tadamura, “An efficient orthorectification of a satellite SAR image used for monitoring disaster,” in Int. Workshop on Advanced Image Technology, Chiang Mai, Thailand, pp. 1–4, 2018. [Google Scholar]
11. H. Zhang, Y. Su, B. Cai and Z. Jiang, “Star image simulation and subpixel centroiding for an earth observing sensor,” in Int. Geoscience and Remote Sensing Sym., Valencia, Spain, 2018. [Google Scholar]
12. M. Ohki and M. Shimada, “Large-area land use and land cover classification with quad, compact, and dual polarization SAR data by PALSAR-2,” in IEEE Trans on Geoscience and Remote Sensing, vol. 58, no. 9, pp. 5550–5557, 2018. [Google Scholar]
13. D. Lee, J. Kim, M. Lee, S. Lee and J. Kim, “Application of landsat-8 and sentinel-1 images for drought monitoring over the korean peninsula,” in Int. Geoscience and Remote Sensing Sym., Valencia, Spain, pp. 7286–7288, 2018. [Google Scholar]
14. X. Li, J. Lu, X. Song, Y. Sun, L. Li et al., “Application of the GF satellite data in flood disaster monitoring,” in Int. Geoscience and Remote Sensing Sym., Valencia, Spain, pp. 7293–7296, 2018. [Google Scholar]
15. J. Sun, L. Yuan, Y. Dong, W. Guo, J. Wang et al., “Regional-scale monitoring of rice flood disaster based on multi-temporal remote sensing images,” in Int. Conf. on Agro-geo-informatics, Hangzhou, China, pp. 1–4, 2018. [Google Scholar]
16. W. Wu and W. Liu, “Remote sensing recognition of residential areas based on GF-4 satellite image,” in Int. Workshop on Earth Observation and Remote Sensing Applications, Xi’an, China, pp. 1–4, 2018. [Google Scholar]
17. S. Khan, X. He, F. Porikli and M. Bennamoun, “Forest change detection in incomplete satellite images with deep neural networks,” in IEEE Trans on Geoscience and Remote Sensing, vol. 55, no. 9, pp. 5407–5423, 2017. [Google Scholar]
18. X. Zhai, X. Niu, H. Tang and T. Mao, “Distance dependent chinese restaurant process for VHR satellite image over segmentation,” in Joint Urban Remote Sensing Event, Dubai, United Arab Emirates, pp. 1–4, 2017. [Google Scholar]
19. T. Motohka, Y. Kankaku and S. Suzuki, “Advanced land observing satellite-2 (ALOS 2) and its follow-on L-band SAR mission,” in Radar Conf., Seattle, WA, USA, pp. 0953–0956, 2017. [Google Scholar]
20. S. Tani, M. Hayama, H. Nishiyama, N. Kato, K. Motoyoshi et al., “Multi-carrier relaying for successive data transfer in earth observation satellite constellations,” in Global Communications Conf., Singapore, pp. 15–35, 2017. [Google Scholar]
21. R. Mansour, S. Al-Otaibi, A. Al-Rasheed, H. Aljuaid, I. Pustokhina et al., “An optimal big data analytics with concept drift detection on high-dimensional streaming data,” Computers, Materials & Continua, vol. 68, no. 3, pp. 2843–2858, 2021. [Google Scholar]
22. R. Mansour and M. Girgis, “Steganography-based transmission of medical images over unsecure network for telemedicine applications,” Computers, Materials & Continua, vol. 68, no. 3, pp. 4069–4085, 2021. [Google Scholar]
23. R. Mansour and E. Abdelrahim, “An evolutionary computing enriched RS attack resilient medical image steganography model for telemedicine applications,” Multidimensional Systems and Signal Processing, vol. 30, no. 4, pp. 791–814, 2019. [Google Scholar]
24. R. Mansour, “Deep-learning-based automatic computer-aided diagnosis system for diabetic retinopathy,” Biomedical Engineering Letters, vol. 8, no. 1, pp. 41–57, 2018. [Google Scholar]
25. L. Li, L. Sun, Y. Xue, S. Li, X. Huang et al., “Fuzzy multilevel image thresholding based on improved coyote optimization algorithm,” IEEE Access, vol. 9, pp. 33595–33607, 2021. [Google Scholar]
26. M. Li, Z. Fang, W. Cao, Y. Ma, S. Wu et al., “Residential electricity classification method based on cloud computing platform and random forest,” Computer Systems Science and Engineering, vol. 38, no. 1, pp. 39–46, 2021. [Google Scholar]
27. A. Nojood and R. Mansour, “Big data analytics with oppositional moth flame optimization based vehicular routing protocol for future smart cities,” Expert Systems, pp. e12718, 2021. [Google Scholar]
28. R. Mansour, J. Escorcia-Gutierrez, M. Gamarra, J. Villanueva and N. Leal, “Intelligent video anomaly detection and classification using faster RCNN with deep reinforcement learning model,” Image and Vision Computing, vol. 112, no. 3, pp. 104229, 2021. [Google Scholar]
29. R. Mansour and A. Shabir, “Reversible data hiding for electronic patient information security for telemedicine applications,” Arabian Journal for Science and Engineering, vol. 46, no. 9, pp. 9129–9144, 2021. [Google Scholar]
30. C. S. S. Anupama, L. Natrayan, E. Laxmi, J. Escorcia-Gutierrez, M. Gamarra et al., “Deep learning with back tracking search optimization based skin lesion diagnosis model,” Computers, Materials & Continua, vol. 70, no. 1, pp. 1297–1313, 2022. [Google Scholar]
31. M. Muthumayil, S. Manikandan, S. Srinivasan, J. Escorcia-Gutierrez, M. Gamarra et al., “Diagnosis of leukemia disease based on enhanced virtual neural network,” Computers, Materials & Continua, vol. 69, no. 2, pp. 2031–2044, 2021. [Google Scholar]
32. R. Mansour, J. Escorcia-Gutierrez, M. Gamarra, V. García, D. Gupta et al., “Artificial intelligence with big data analytics-based brain intracranial hemorrhage e-diagnosis using CT images,” Neural Computing & Applications, vol. 11, no. 1, pp. 1–13, 2021. [Google Scholar]
33. R. Mansour, J. Escorcia-Gutierrez, M. Gamarra, D. Gupta, O. Castillo et al., “Unsupervised deep learning based variational autoencoder model for COVID-19 diagnosis and classification,” Pattern Recognition Letters, vol. 151, no. 6, pp. 267–274, 2021. [Google Scholar]
34. R. Mansour, A. El Amraoui, I. Nouaouri, V. G. Díaz, D. Gupta et al., “Artificial intelligence and internet of things enabled disease diagnosis model for smart healthcare systems,” IEEE Access, vol. 9, pp. 45137–45146, 2021. [Google Scholar]
35. X. Li and F. Ling, “A super-resolution land-cover change detection method using remotely sensed images with different spatial resolutions,” in IEEE Trans on Geoscience and Remote Sensing, vol. 54, no. 7, pp. 3822–3841, 2016. [Google Scholar]
 | This work is licensed under a Creative Commons Attribution 4.0 International License, which permits unrestricted use, distribution, and reproduction in any medium, provided the original work is properly cited. |