DOI:10.32604/csse.2022.021443
| Computer Systems Science & Engineering DOI:10.32604/csse.2022.021443 | |
| Article |
Analyzing the Implications of COVID-19 Pandemic through an Intelligent-Computing Technique
1Department of Information Technology, Babasaheb Bhimrao Ambedkar University, Lucknow, 226025, India
2Department of Information Technology, College of Computers and Information Technology, Taif University, Taif, 21944, Saudi Arabia
3Department of Computer Science, University College of Al Jamoum, Umm Al Qura University, Makkah, 21421, Saudi Arabia
4Department of Computer Applications, Shri Ramswaroop Memorial University, Barabanki, 225003, India
*Corresponding Author: Rajeev Kumar. Email: rs0414@gmail.com
Received: 02 July 2021; Accepted: 03 August 2021
Abstract: The outbreak of Severe Acute Respiratory Syndrome Coronavirus 2 (SARS-CoV-2 virus or COVID-19) disease was declared pandemic by the World Health Organization (WHO) on March 11, 2020. COVID-19 has already affected more than 211 nations. In such a bleak scenario, it becomes imperative to analyze and identify those regions in Saudi Arabia that are at high risk. A preemptive study done in the context of predicting the possible COVID-19 hotspots would facilitate in the implementation of prompt and targeted countermeasures against SARS-CoV-2, thus saving many lives. Working towards this intent, the present study adopts a decision making based methodology of simulation named Analytical Hierarchy Process (AHP), a multi criteria decision making approach, for assessing the risk of COVID-19 in different regions of Saudi Arabia. AHP gives the ability to measure the risks numerically. Moreover, numerical assessments are always effective and easy to understand. Hence, this research endeavour employs Fuzzy based computational method of decision making for its empirical analysis. Findings in the proposed paper suggest that Riyadh and Makkah are the most susceptible regions, implying that if sustained and focused preventive measures are not introduced at the right juncture, the two cities could be the worst afflicted with the infection. The results obtained through Fuzzy based computational method of decision making are highly corroborative and would be very useful for categorizing and assessing the current COVID-19 situation in the Kingdom of Saudi Arabia. More specifically, identifying the cities that are likely to be COVID-19 hotspots would help the country’s health and medical fraternity to reinforce intensive containment strategies to counter the ills of the pandemic in such regions.
Keywords: COVID-19; Saudi Arabian regions; risk assessment; dynamics of infection; fuzzy AHP
As the virus grips the countries, transcending the borders and geographical regions, the world is looking for any possible escape routes. With no medication that can serve as certified treatment and no vaccine to render people immune to the virus, the COVID-19 pandemic has wreaked havoc on both the health and economic well-being of millions in the world [1,2]. Having spread the virus, researchers now face COVID-19 pandemic-related problems. In its efforts to contain the magnitude of the Coronavirus pandemic, Saudi Arabia has already initiated highly effective precautionary measures [3]. In this row, our empirical study will be a significant contribution to the various preventive strategies introduced by the medical fraternity and the government.
The experts opine that the most effective strategy to break the chain of the spread of Coronavirus is to identify the susceptible regions, the possible hotspots, and introduce preemptive measures to control the contagion. In this league, we have identified the vulnerable regions in Saudi Arabia that are likely to be severely affected by the pandemic. Our research is premised on the data collated from literature surveys, media websites, and medical reports [4,5]. The analysis of the available resources in this context points to several causes that could be major risk factors for the spread of COVID-19 in Saudi Arabia. For example, one of the main risk factors, as medical experts have noted, is that people in KSA are not as safe as they could be. Those with a weak immune system are at a higher risk of infection; hence, urgent medical intervention is required to ensure stronger immunity and better wellbeing of the people. Besides, to further our empirical base, we also perused numerous studies that focused specifically on integrating digital technology with health issues in the Kingdom of Saudi Arabia. The key literature in this context includes:
Arpin et al. [5] presented a modeling and estimation paper discussing the cardiovascular surgery burden in Saudi Arabia. The paper talks about the future growth as well as categorizes the burden of surgeries in Saudi Arabian healthcare organizations. Yet another study in this league by Rachah et al. [6] presented a computational model for assessing the risk of mass gatherings during an epidemic. The paper presented the situation of mass gatherings at the Olympic Games, FIFA world cup, Hajj, etc. The study selected Hajj as a case study and used Data-Driven computational model to assess the risk of any type of epidemic in mass gatherings. Moreover, the paper effectively discusses the interaction of self-awareness into infection spreading and portrays a link between them. The study illustrates the importance of self-awareness and also proposes effective countermeasures by imposing self-restrictions on ourselves. Furthermore, another similar study by Rorres et al. [7] and Chimmula et al. [8] also portrays the self-awareness in infection spread and proposes a model to adopt self-awareness to prevent the spread of infection.
Various KSA regions have different environments, populations, ratios of density, and ratios between men, women, and children [9,10]. Besides, resources in the KSA regions are also different, including hospitals, doctors’ local clinics. Given this backdrop, the main purpose of our analysis is to identify, categorize and thereafter prioritize the regions of KSA which are at high risk and could be the most vulnerable targets of Coronavirus [11–13]. Such a research initiative would also be an effective alternative to the paranoia and confusion amongst people regarding the spread of the pandemic [14–17]. With the help of the Multi-Criteria Decision Making (MCDM) methodology, the authors have chosen and tested the high-risk COVID-19 states [18,19]. MCDM is Operation Research’s utmost significant branch through which people take nuanced decisions on any issue. It is a deep learning based artificial intelligence inherited methodology which is used to choose options in an automated neuroscience scenario. Several researchers are already employing many of the MCDM Models [20,21]. All these MCDM Models are based on decision-making problem behavior [22,23]. People select the best alternatives in the MCDM method. Such MCDM methods have recently been used in the economic, environmental, and social contexts as well.
Thus, as explicated above, MCDM is highly effective and useful in the context of assessment in between more than one option [24,25]. Categorizing Saudi Arabian regions based on their risk factors for COVID-19 is also a task where machine learning is in demand for taking right decision. To make it easier and effective for researchers and experts, the authors chose MCDM technique because the process involves multi-decision attributes. Various regions and different factors that affect the risk ratio of COVID-19 become a context of multi-dimensional decision-making. Therefore, the authors also adopt the AHP MCDM approach to conduct the assessment in this paper. The approach affords both simplicity and accuracy. Complex computational methodologies create confusion and ambiguity in the readers’ minds. Since COVID-19 is a sensitive topic, it is imperative to choose a simple but effective AHP approach for attaining convincing results. It is shown that mostly fuzzy set theories are adopted and utilized to assess ambiguous data inputs and its outcome efficiency is also very high. Fuzzy-based decision-making approaches are dependent and associate attributes. Ambiguity is always present in this type of decision-making. Imprecision is another obstacle that arises in the pathway of fuzzy-based decision-making that is caused due by unquantifiable data, missing data, inaccessible data, and limited irrationality.
The proposed article attempts to classify and prioritize the risk of COVID-19 based on geographical and infrastructural attributes of different Saudi Arabian regions. The proposed study adopts a fuzzy-AHP approach to estimate the level of risk in Saudi Arabian regions. This type of methodology helped us to perform a numerical assessment of the risks. A numerical assessment brings forth precision in the analysis. Precise figures will translate into more convincing data which can be used by future researchers and experts in managing the COVID-19 situation. Moreover, to deliver more clarity in the adopted methodology, the AHP has a systematic assessment pathway that gives an experimental result and validation of those outcomes very efficiently. More significantly, in the context of the benefits of the proposed approach and evaluation, the results discussed in this paper would add to the repository of data that the government and health practitioners refer to for formulating preventive mechanisms against COVID-19 disease. Furthermore, the study’s contributions also include the following:
The proposed study provides a specific and unique risk-based categorization and a priority list of different Saudi Arabian regions that will be exceptionally helpful for the healthcare industry in KSA. The biggest advantage of this proposed study is that the evaluated results of a study can be adopted by healthcare experts and the Saudi government to identify high-risk zones and regions. The detection of high-risk regions or zones will help the experts and the Saudi government in applying prompt and targeted preventive measures in most high-risk regions of KSA, thus averting casualties or COVID-19 cases.
The application of evaluated results in this proposed study is highly systematic. The risk ratios of different cities, as specified in the findings of the study, are specific and precise in their readings. Hence the policymakers working on COVID-19 preventive mechanisms can base their decisions on data that is numerical, accurate, and corroborative. Saudi Arabia is a country with a stable economy empowered with fully digitalized and developed healthcare infrastructure. However, the present-day COVID-19 health emergency calls for timely and effective containment strategies to prevent any further loss of lives as well as stem economic loss to the country. The proposed study attempts to evaluate the level of risk in different regions of KSA.
KSA is a vast country with a thriving economy in the Middle East. However, the COVID-19 outbreak has affected the country most dramatically and the condition is likely to be even worse. COVID-19 cases are on the rise and are increasing day-by-day in various regions of Saudi Arabia (Tab. 1) [26].
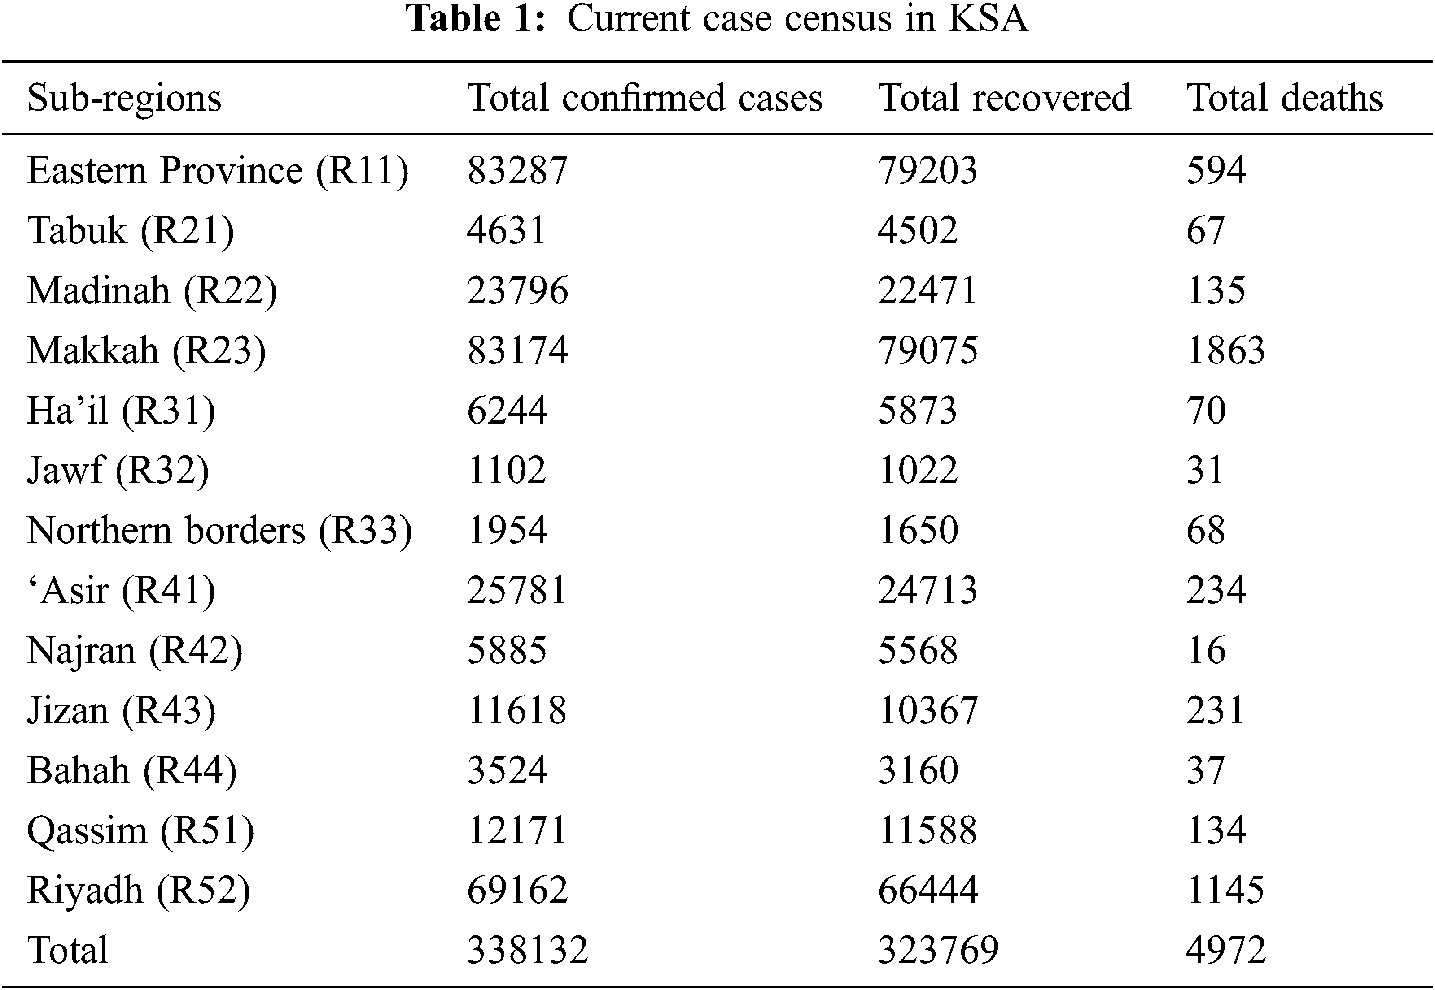
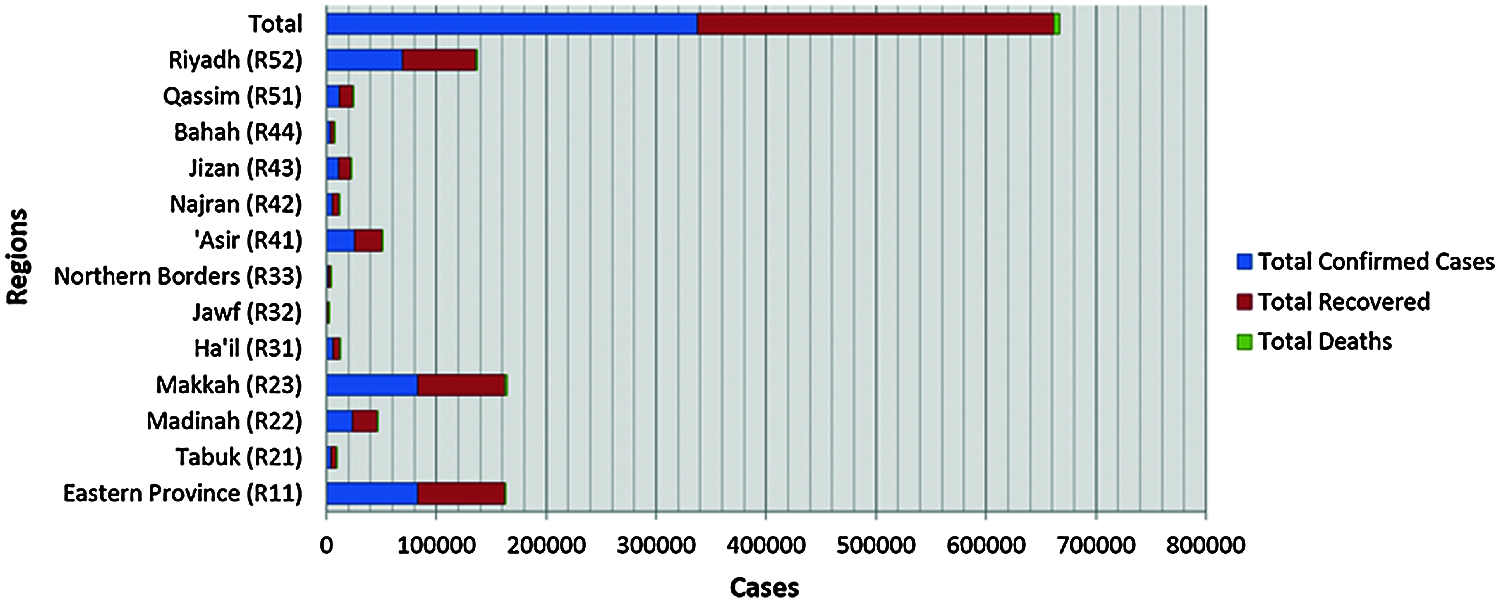
Figure 1: Graphical representation of current census
Above Tab. 1 and Fig. 1 portrays the situation of confirmed, recovered, and death cases in Saudi Arabian regions. A look at the total death ratio of KSA shows that the percentage ratio is highly low in comparison of confirmed cases, but additionally, it is also true that the infection ratio is growing without any limit in various regions (based on the census). It is shown in this COVID-19 period that the death ratio is always much lower in comparison to the infected ratio and cases. But this type of situation has some of its adverse effects on the country’s infrastructure. More number of infected cases and ongoing treatment cases directly affect the healthcare infrastructure of the country. Moreover, the vectors of an infection tell that the infection ratio is continuously growing. This is a major concern for the KSA because currently, the country is working towards achieving Vision 2030. All the key resources of the country including the healthcare infrastructure are currently in the transformation stage. The transformation stage has rendered the KSA’s health systems vulnerable, and it would be difficult for the state machinery to cater to the heavy COVID-19 caseload. Hence, unless the country works on quick identification of the most affected or most likely to be affected regions of the KSA due to Coronavirus, more people will suffer. Therefore, a mechanism that is accurate and systematic in its findings is required to assess the high-risk spots in KSA and facilitate the highest safety and security countermeasures [23–26] in them for effective prevention.
Saudi Arabia is distributed into five main regions and 13 sub-regions [9]. Each region is divided into governorates and the region capitals, which have the status of the municipality and are headed by the mayors. The population of the country is estimated to be 33,091,113 and the density ratio is 15.322 per square km [10]. The life expectancy of males and females is 75.7 and 74.2 years, respectively. Further, 83.8% of the total population is urban. More than 50% of the total population lies between the age group of 25–54 years [11–13]. A range of deserts and contains the 250,001 square meter Rub ‘al Khali (“Empty Quarter”) in the southeastern portion of the country, the world’s biggest contiguous sand desert.
Normal summer temperatures are about 45°C (113°F) but can reach as high as 54°C (129°F). In the winter the temperature seldom drops below 0°C (32°F) [12,13]. In the spring and autumn, the climate is temperate, temperatures hover about 29°C (84°F). The annual rainfall is extremely poor [14,15]. Further, Fig. 2 represents the regions of KSA, and details of each region have been discussed as follows:
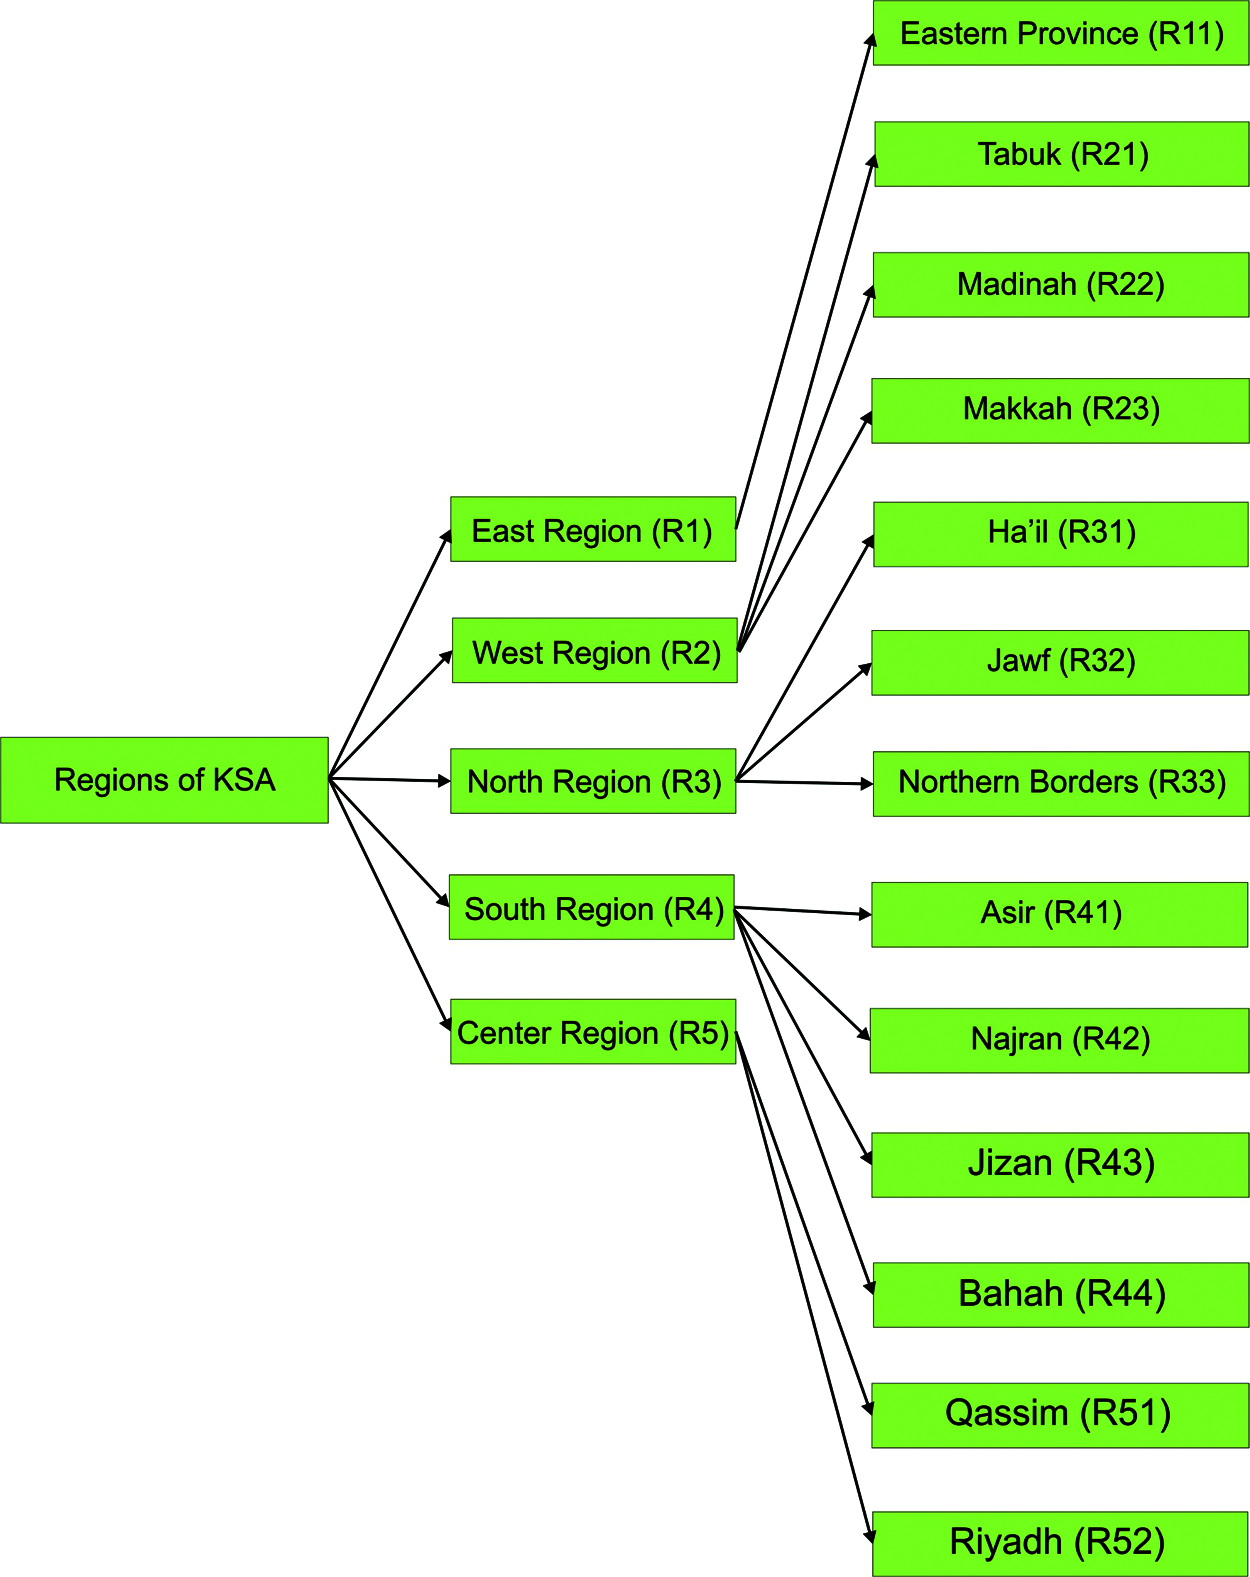
Figure 2: Tree structure of Saudi Arabia regions
East Region (R1): The Eastern region has only one state namely, the Eastern Province (R11). It is the largest state of KSA in terms of area (259,662 square meters). After Riyadh and Makkah, it is the third most populous region with a population of 4,900,325. The population count is 3,140,362 Saudi citizens, and 1,759,963 foreign nationals [16,17]. The region contributes 15.05 percent of Saudi Arabia’s total population. The density ratio of the state is 19/square meters. This state has twenty main hospitals with 2400 beds (approximately) that can help treat the COVID-19 patients. Further, due to high business activity, this state is at high risk due to the COVID-19 pandemic.
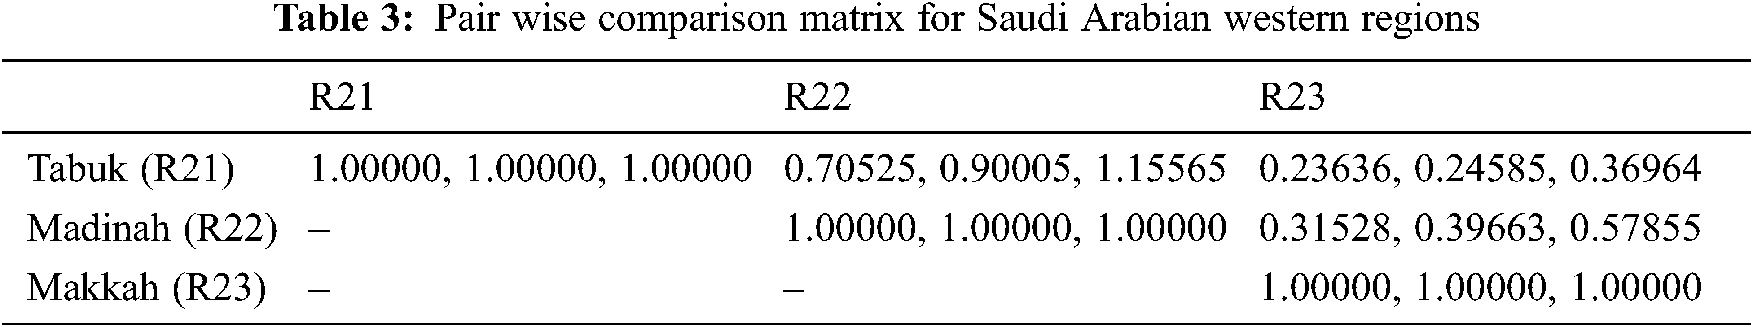
West Region (R2): The Western region has three states: Tabuk (R21), Madinah (R22) and Makkah (R23). Details of each state have been discussed as follows:
Tabuk (R21) has a 56,399 square meter area and the population of the state is 910,030. The region accounts for 5.56% of the whole population of Saudi Arabia. The density ratio of the state is 16/square meters. This state has one main hospital with 300 beds (approximately) to deal with the emergencies of the pandemic. Further, due to very low business activity, this state is at low risk due to the COVID-19 pandemic.
Madinah (R22) has a 58,680 square meter area and the population of the state is 2,132,679. The region accounts for 9.84% of the whole population of Saudi Arabia. The density ratio of the state is 36/square meters. This state has seven main hospitals with 3500 beds (approximately). Madinah is the revered pilgrimage visited by many from all corners of the world and is also a business hub. Thus, this state is also at high risk due to the COVID-19 pandemic.
Makkah (R23) has a 59,131 square meter area and the population of the state is 8,557,766. The region accounts for 30.26% of the whole population of Saudi Arabia. The density ratio of the state is 140/square meters. This state has forty main hospitals with 7000 beds (approximately) that can help treat the afflicted. Further, due to highly frequent pilgrim footfall and business activity, this state is a very high risk due to the COVID-19 pandemic.
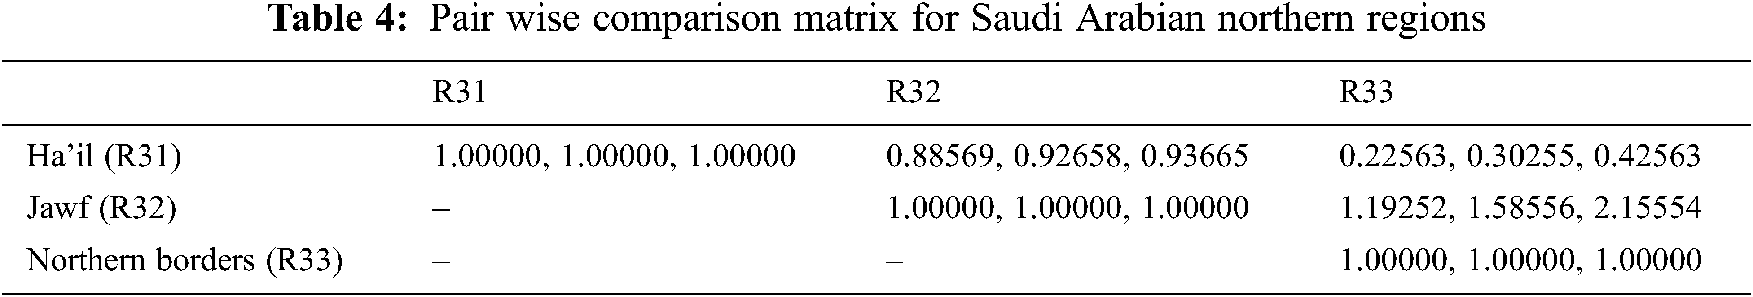
North Region (R3): The Northern region has three regions: Ha’il (R31), Jawf (R32), and Northern Borders (R33). Information of respective regions has e been deliberated as follows:
Ha’il (R31) has a 40,111 square meter area and the population of the state is 597,144. The state accounts for 3.56% of the whole population of Saudi Arabia. The density ratio of the state is 15/square meters. This state has 5 main hospitals with 1000 beds (approximately). The state has relatively less business activity, hence can be classified in a low-risk zone that is unlikely to be affected by the pandemic.
Jawf (R32) has a 38,692 square meter area and the populationof the state is 508,475. The region accounts for 2.24% of the whole population of Saudi Arabia. The density ratio of the state is 11.4/square meter. This state has two main hospitals with 350 beds (approximately) that can help handle the pandemic. Further, due to low business activity, this state comes in the low-risk category.
Northern Borders (R33) has a 43,165 square meter area and the population of the state is 375,310. The region accounts for 5.06% of the whole population of Saudi Arabia. The density ratio of the state is 8.7/square meter. This state has 10 main hospitals with 900 beds (approximately). This state is also at low risk due to the COVID-19 pandemic.
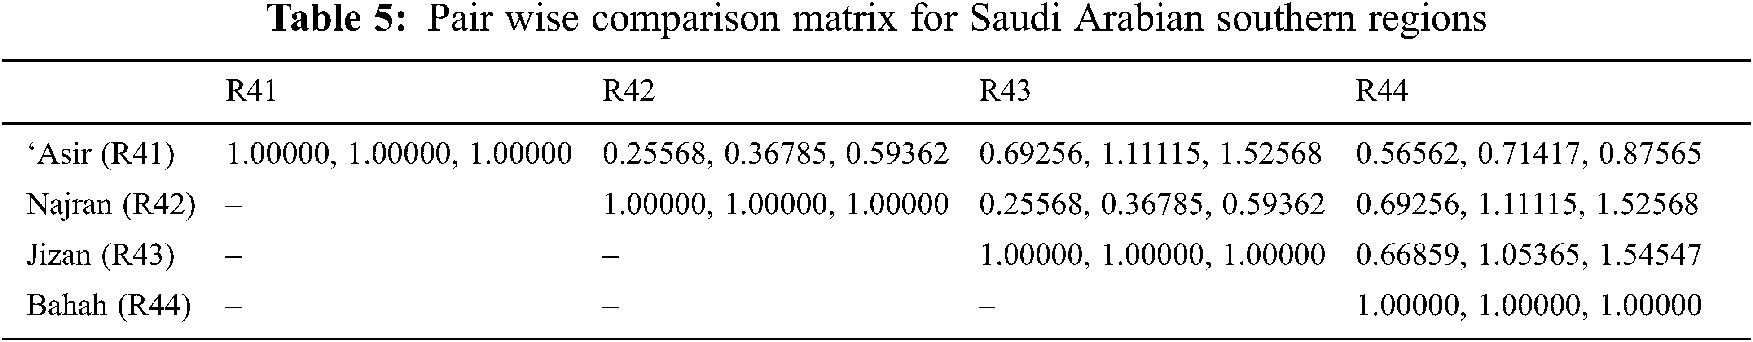
South Region (R4): The Southern region has four states: ‘Asir (R41), Najran (R42), Jizan (R43), and Bahah (R44). Information of respective region have been deliberated as follows:
‘Asir (R41) has a 29,611square meter area and the population of the state is 2,211,875. The region accounts for 15.06% of the whole population of Saudi Arabia. The density ratio of the state is 65/square meters. This state has ten main hospitals with 1250 beds (approximately). Due to the mountains, rainfall, cold temperature [18,19], and high business activity, this state falls under the high-risk zone and is most likely to be affected by the pandemic.
Najran (R42) has a 57,727 square meter area and population of state is 505,652. The region accounts for 3.06% of the whole population of Saudi Arabia. The density ratio of the state is 8.8/square meter. This state has three main hospitals with 500 beds (approximately). Due to low business activity, this state falls under the low risk category.
Jizan (R43) has 4,506 square meter area and population of state is 1,567,547. The region accounts for 7.84% of the whole population of Saudi Arabia. The density ratio of the state is 350/square meter. This state has eight main hospitals with 3000 beds (approximately). Further, due to high business activity, this state is at high risk of contacting the COVID-19 pandemic.
Bahah (R44) has 3,831 square meter area and population of state is 476,172. The state accounts for 4.06% of the whole population of Saudi Arabia. The density ratio of the state is 120/square meter. This state has two main hospitals with 400 beds (approximately) that can be helpful for handling the pandemic. High business activity in the state makes it a vulnerable target of COVID-19 pandemic.
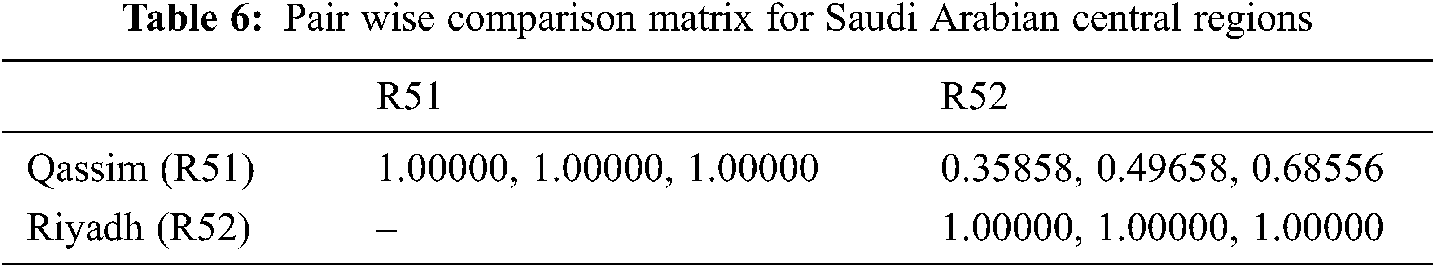
Center Region (R5): The Central region has two states: Qassim (R51) and Riyadh (R52).
Details of each state have been discussed as follows:
Qassim (R51) has 22,412 square meter area and population of state is 1,215,858. The region accounts for 11.06% of the whole population of Saudi Arabia. The density ratio of the state is 54/square meter. This state has ten main hospitals with 1200 beds (approximately). Further, due to high pilgrims and business activity, this state is at high risk due to COVID-19 pandemic.
Riyadh (R52) is the capital and second largest state of the country. It has 156,080 square meter area and population of the state is 8,216,284. The state accounts for 28.06% of the whole population of Saudi Arabia. The density ratio of the state is 53/square meters. This state has thirty-eight main hospitals with 6000 beds (approximately). Further, due to very high pilgrims and business activity, this state at very high risk due to the COVID-19 pandemic.
The authors applied the adopted MCDM methodology to the regions mentioned above to obtain the risk ratio of these regions. The findings of the study can be used by experts to prevent the spread of Coronavirus in KSA.
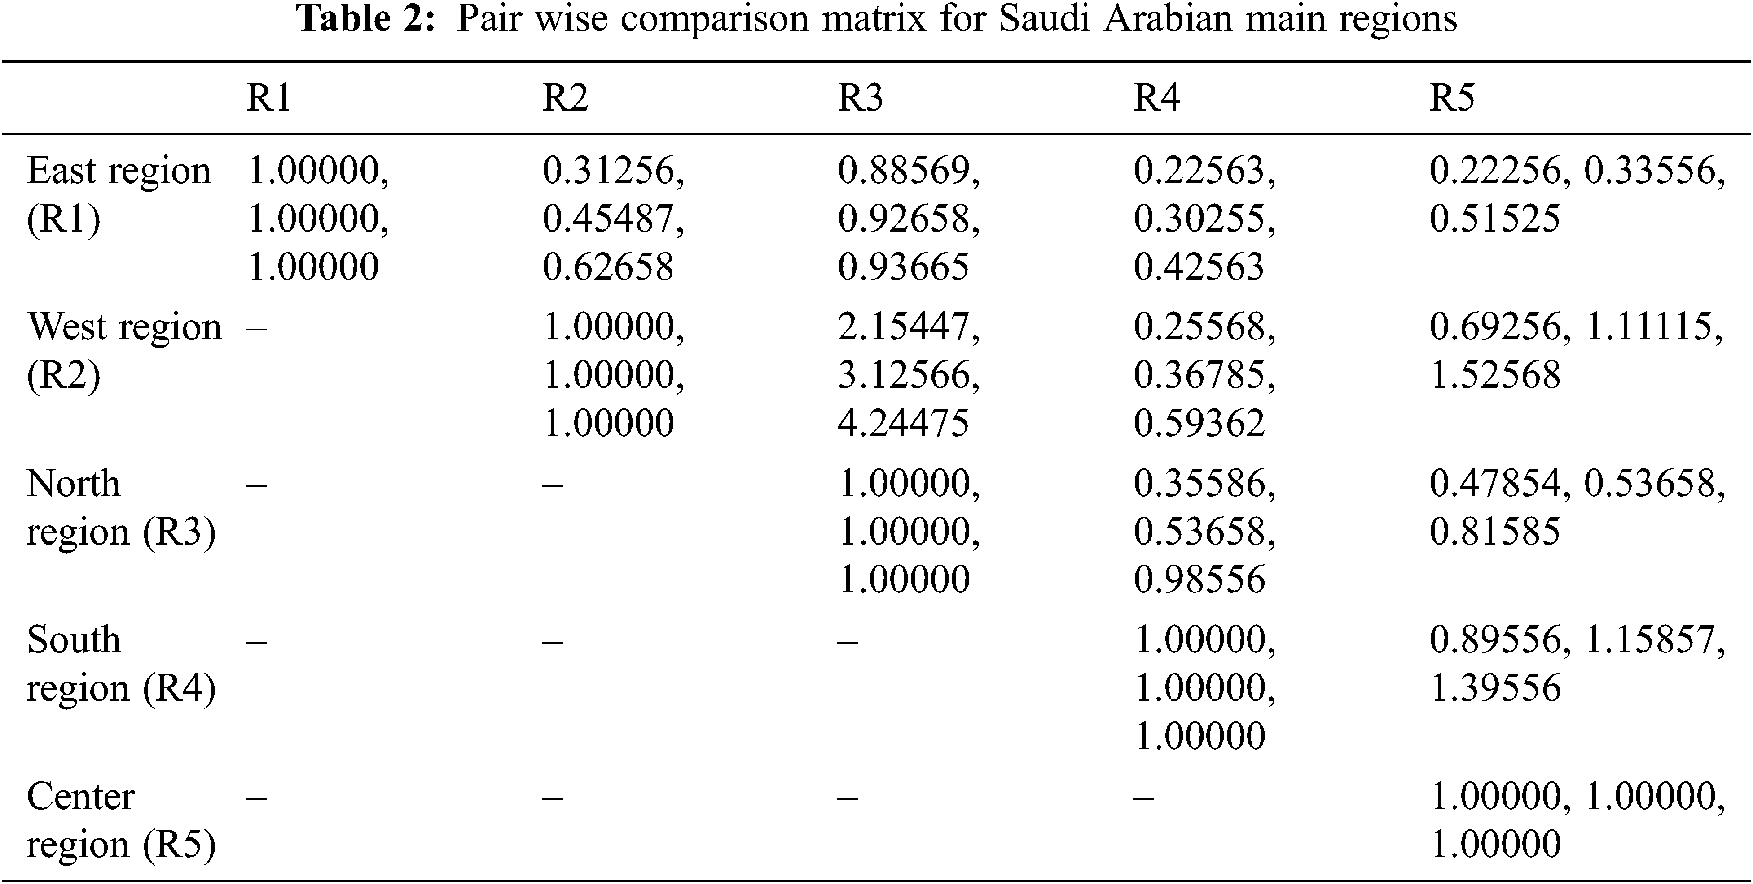
The adopted methodology fuzzy AHP is an MCDM approach that works on the hierarchical model like Fig. 2 [26,27]. These hierarchal models are associated with various layers based on the levels in the work and assessment criteria. In the context of their layered architecture, the first and most prior layer of hierarchy tells about the main attribute of the research domain. Then, the next layers show the factor and sub-factors of the topic that is relatable and inherited from each other, respectively. After identifying the appropriate hierarchy for assessment, the next step of the examiners is to find the triangular fuzzy value that helps in building the Triangular Fuzzy Number (TFN) used for creating a pair-wise comparison matrix. Triangular Fuzzy membership value for pair-wise comparison was employed by Yu et al. [27].
Baz et al. [22] used the Fuzzy AHP algorithm for evaluating the effectiveness of the healthcare system. In this paper, we adopted TFN because they make calculation of membership functions easy and align with fuzzy data. The TFN lies between 0 and 1. The linguistic values are divided as equally important, weakly important etc., and precise values are shown as numeric 1, 2, … 9., its membership function values are calculated. The mathematical Eqs. (1)–(4) are used for converting the numerical data into TFN [28,29]. Φij is calculated depending upon the geometric mean of the specialists’ observation for a particular similarity. TFN [Φij] is calculated as:
The geometric mean is calculated by multiplying and adding two fuzzy numbers and in Eqs. (2) and (4) d stands for summarized data that is taken as observation for calculating TFN values. Eqs. (5)–(7) are used to calculate geometric mean. Consider two TFNs, P1 and P2, P1 = (A1, B1, C1) and P2 = (A2, B2, C2). We calculated the geometric means by these mathematical statements:
In the above equations, Jijk displays the comparative importance of the rating provided by the expert k between two criteria. Where, I and j represent a pair of parameters that experts’ evaluate. In addition, defuzzification is performed after the building of the comparison matrix to generate a quantifiable value based on the measured TFN values. This is done by using the Eqs. (8)–(10) called the alpha cut method [30,31].
where, 0 ≤ α ≤ 1 and 0 ≤ β ≤ 1
Such that,
where α and β are used for experts’ choices in those equations. Those two values range from 0 to 1. Precise sets
C1 C2 … Cn
The next step is to evaluate the pair-wise comparison matrix’s eigenvalue and eigenvector. Assume that μ denotes the eigenvector while λ denotes the eigenvalue of fuzzy pair-wise comparison matrix ηij (Eq. (12)).
Eq. (12) is based on linear vector transformation, in which I represent the unit matrix. By applying Eqs. (1)–(12), the weights of specific criteria may be acquired against all the other possible criteria.
Analytic Hierarchy Process (AHP) is used to evaluate a common choice in a set of judgments, but most of the experts have found that fuzzy-based AHP is more accurate in giving their weights precise decisions [22–25]. This is an important method commonly used by decision-makers to complete a priority analysis. This method is helpful in deep learning and is effectively utilized in neural network-related issues. The current use of this method in the proposed article is highly appropriate and effective as it simulates the possible effective decision options for the experts in KSA and through these options, they can propose their future countermeasures against the pandemic. To deal with the hesitations and vagueness of the experts’ decision, the contributors of this article adopted an improved form of AHP, which is called the fuzzy AHP. More specifically, in the context of the COVID-19 pandemic, there is no confirm treatment and every expert is doing his/her best to treat the afflicted.
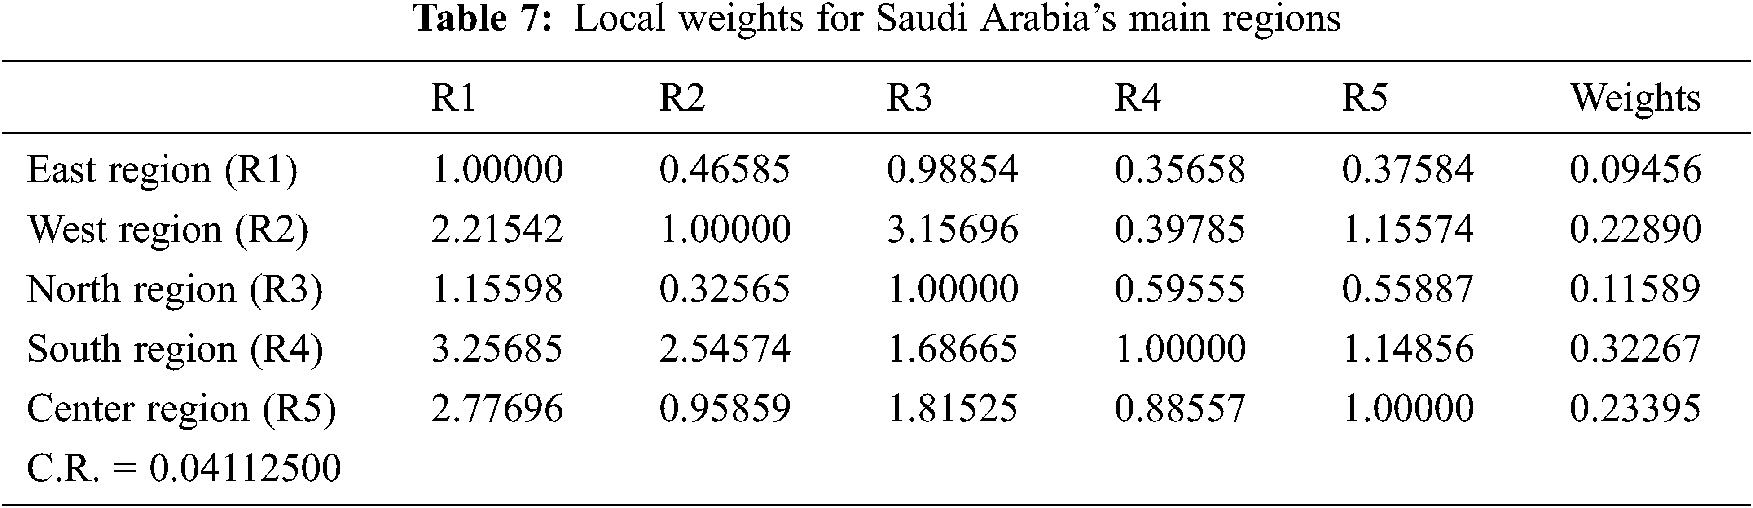
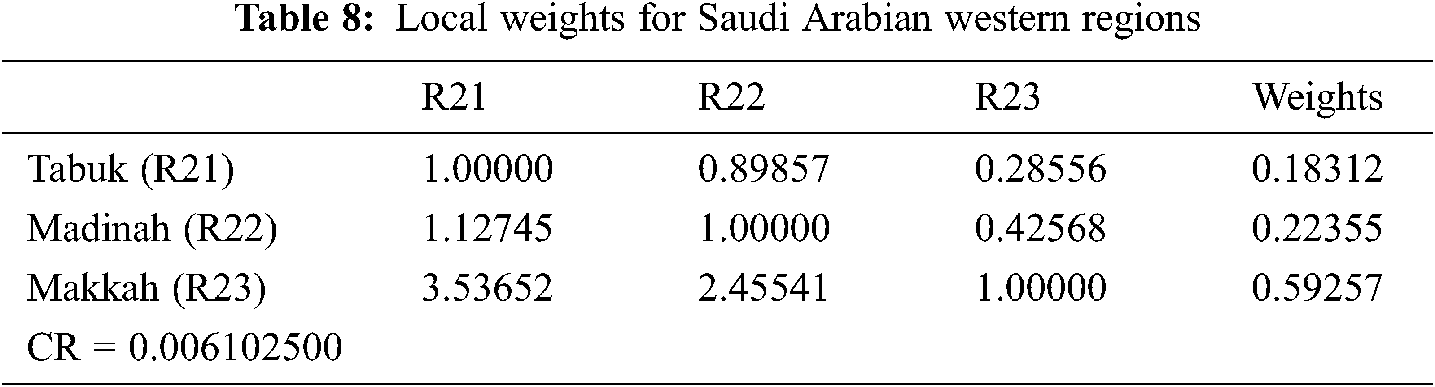
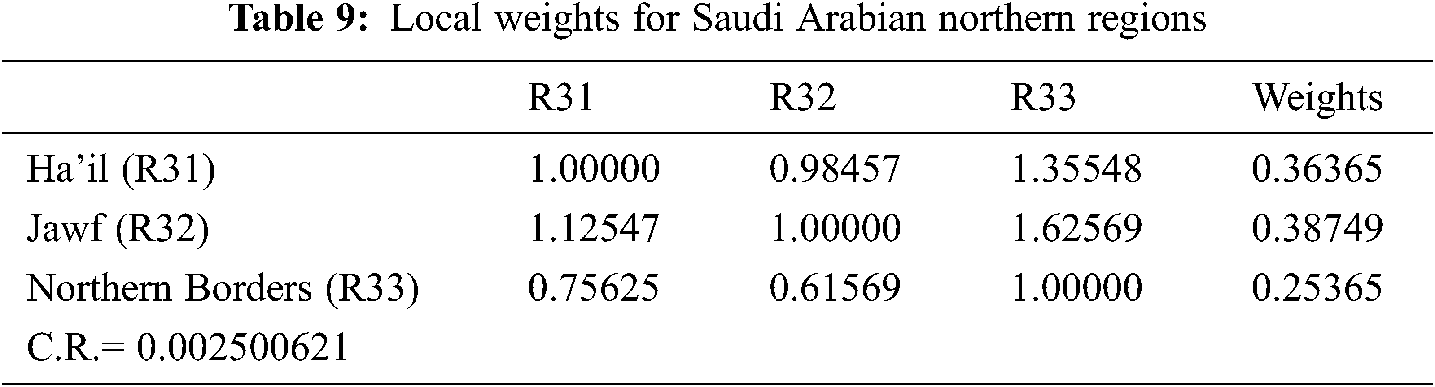
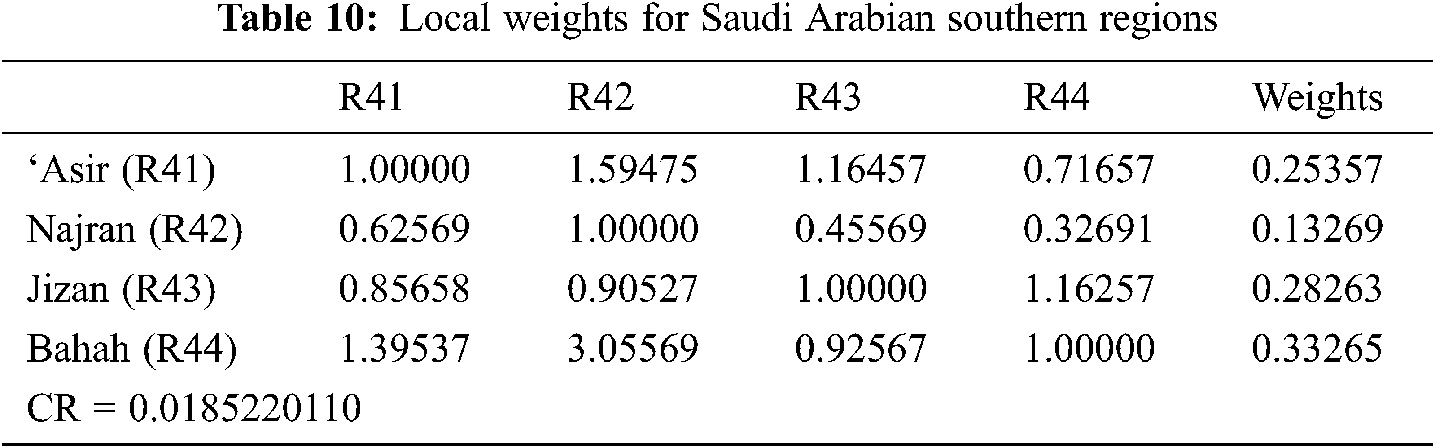
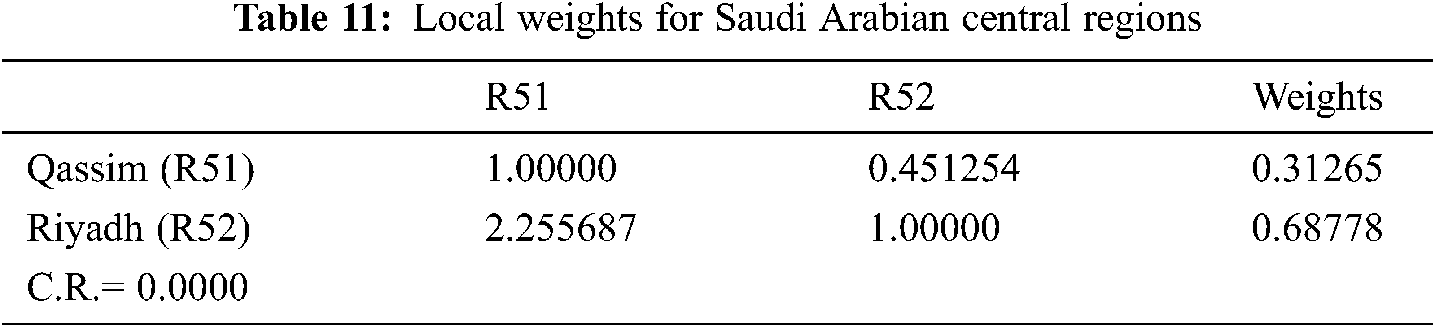
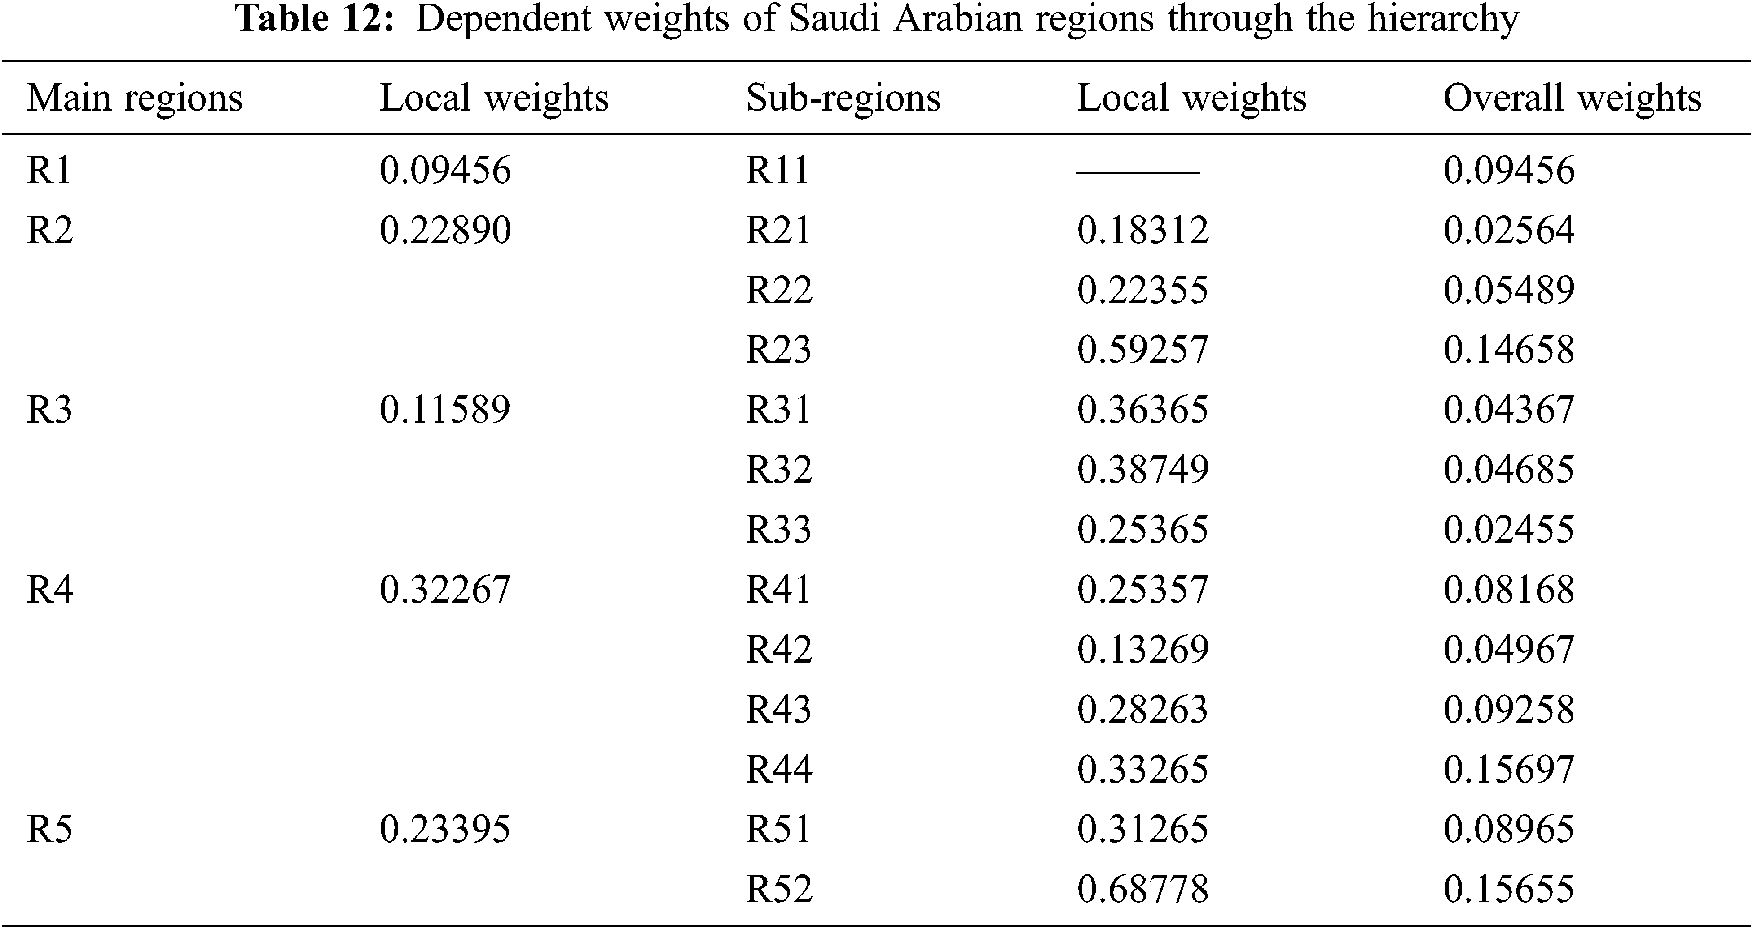
In such a critical scenario, the decision-making process plays a key role during a patient’s treatment. This method is also the best choice for locking the infection dynamics. In this row, we have done the risk assessment and the severity levels of each state of the Saudi Arabia. Moreover, this contribution is aimed at evaluating the risk of COVID-19 pandemic in Saudi Arabian regions, with the aid of experts’ inputs. For assessing the risk, authors have taken the opinions of 25 experts from the various areas of research institutes and hospitals. Furthermore, with the help of Eqs. (1)–(3), authors converted the linguistic data into numeric data and Fuzzy numbers in triangular form. Fig. 2 shows the regions and sub-regions at Levels 1 and 2, respectively. Thereafter, the aggregated fuzzy pair-wise comparison matrixes that are constructed have been shown in Tabs. 2–6. After constructing the fuzzy pair-wise comparison matrices, Eqs. (4)–(6) are used for defuzzification. Further, Eq. (7) is used to evaluate the single pair-wise comparison matrix (Crisp set). In the next step, we evaluated the consistency ratio of each matrix [26,27]. Eq. (8) is used to calculate the eigenvalue and eigenvector. With the help of Eqs. (9)–(12), the authors assessed the defuzzified values and local weights of each group that are shown in Tabs. 7–11. Finally, Tab. 12 shows the dependent weights of each region through the hierarchy.
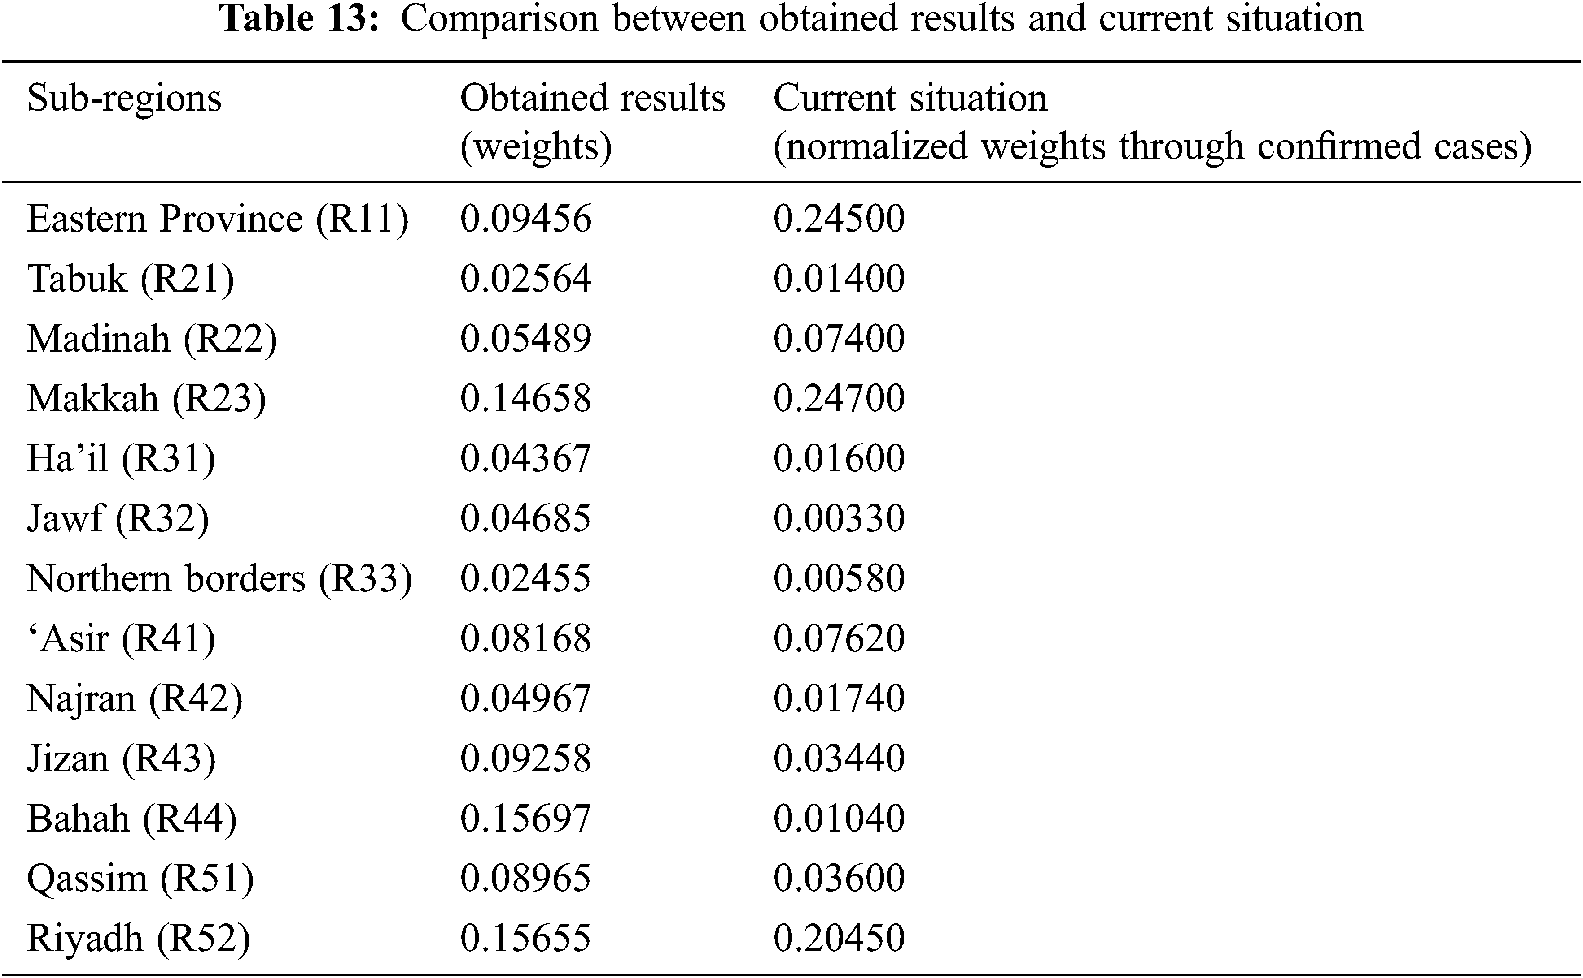
To analyze the evaluated results by describing the above Tab. 13, it can be seen that Riyadh and Makkah are the high-risk regions in KSA with 16.10 and 13.58 percent ratio of risk, respectively. Similarly, Tubuk and Northern Border are less and low risk regions with 4.19 and 3.00 percentage of risk ratio. The analytical view on this type of results tells that Riyadh and Makkah are both at highest risk due to their large population and infrastructure complexities according to authors’ evaluation. Thus, this type of analysis portrays an immense need for efficacious preventive measures in the specified high-risk ratio regions. Additionally, risk ratio for every region in between Riyadh and Northern Border regions has been determined. This result can be adopted by the experts to assess the outcome for these cities and create appropriate policies to contain COVID-19.
Comparison analysis is a process that indicates and tests the affectivity as well as importance of adopted approach by comparing the present methodology vis-à-vis other similar methodologies. Such an evaluation establishes the efficiency of the methodology used in this paper to assess the risk factors in various regions of Saudi Arabia. To conduct the comparison analysis for the present study, authors performed the same evaluation with different classical AHP methodology (Tab. 13) [18–22].
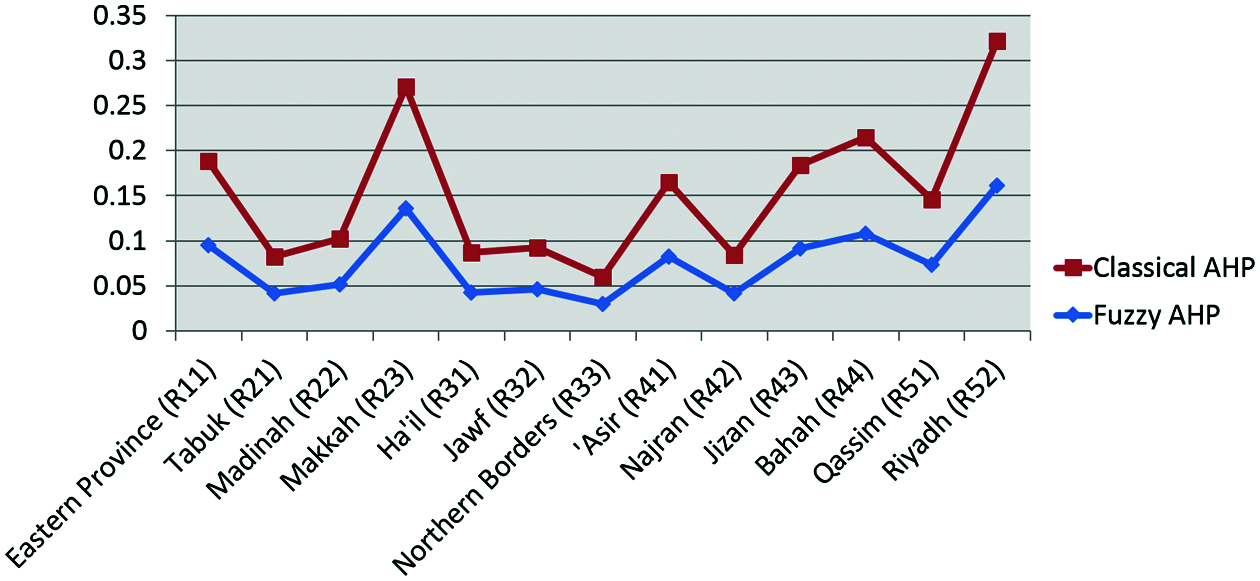
Figure 3: Graph of comparison analysis
The difference between classical and fuzzy AHP methodology is very small, but very significant. Addition of fuzzy set theory gives an effective ability to fuzzy AHP methods, whereas the classical AHP methods are not so effective. The evaluated outcomes in Tab. 13 and Fig. 3 of comparison analysis clearly portray that results extracted from both approaches are not so varied. Therefore, it is clearly evident by the outcome that the adopted methodology is highly effective and its results do not provide highly varied results when compared with similar techniques. Further to portray a more categorized and clear picture of extracted outcomes authors compare the evaluated results percentage ratio with the current case percentage ratio that gives an effective overview about the results discussed in this study. Following Tab. 13 shows the comparison ratio.
As Saudi Arabia intensifies its efforts to curb the fatal contagion, several risk assessment factors and theories have been dwelt upon and postulated in different research endeavors. It is still a complex and challenging task in KSA to identify and spot high-risk zones. The current scenario of cases in Saudi Arabia and its analysis call for a risk-based region categorization and corona prevention policy development for specific regions based on their geographical and environmental infrastructure. Every research has its limitations and restrictions. Limitations portray the future possibilities of paper and give ideal potential future research topics to researchers. The limitations of the proposed study are described in the following points:
• Many hybrid MCDM approaches are available and they can produce more efficient results than the fuzzy AHP methodology adopted by us.
• The data and area used for applying methodology are limited and small. Authors strongly believe that the same adopted methodology can produce more efficient outcomes with a large-scale dataset.
• As in the context of the methodology of the paper, α and β are two variables in equations that can affect results. This is another limitation of this study.
The numerical assessment gives a complementary advantage to this proposed study because the evaluated quantitative results are simulated versions of the actual situation, approximately. Such an empirical framework would prove to be a reliable milestone to categorize and prevent the spread of COVID-19 in KSA. Moreover, our research investigation attempted to develop a new model for the evaluation of the states at high risk due to the COVID-19 pandemic. The advantage of this new model is that it can objectively and cognitively analyze the spread of Coronavirus in different regions of Saudi Arabia. After collection of data for all the regions, we applied the Fuzzy AHP methodology for finding states that are likely to be under the highest risk category due to COVID-19. Results indicate that Riyadh and Makkah are the most vulnerable targets. The conclusive research evidence drawn from our study seeks to be an effective contribution in the mission of battling against COVID-19 undertaken by the Kingdom of Saudi Arabia. Yet another dimension that can be explored for future research in this context could be the implementation of this computational methodology by employing the SEIR model. Moreover, the present study also focuses on healthcare infrastructures and healthcare population ratios in KSA to get appropriate and relatable effective results. After associating and assessing this type of region-based categorization, the following most concrete and significant outlines are extracted by presented study:
Riyadh and Makkah are the most susceptible regions and must be categorised in the highest possible risk zone in KSA. The presented study gives a comprehensive and systematic step-wise path to assess the level of risk in different regions of KSA that can be further adopted by researchers to facilitate their own ideology of assessment.
Acknowledgement: This research was supported by Taif University Researchers Supporting Project number (TURSP-2020/211), Taif University, Taif, Saudi Arabia.
Funding Statement: This Project was funded by the Taif University Researchers Supporting Projects at Taif University, Kingdom of Saudi Arabia, under Grant Number: TURSP-2020/211.
Conflicts of Interest: The authors declare that they have no conflicts of interest to report regarding the present study.
1. Science Daily, “COVID-19 coronavirus epidemic has a natural origin,” 2020. [Online]. Available: https://www.sciencedaily.com/releases/2020/03/200317175442.htm. [Google Scholar]
2. World Health Organization, “COVID-19 public health emergency of international concern (PHEIC) global research and innovation forum,” 2020. [Online]. Available: https://www.who.int/publications/m/item/covid-19-public-health-emergency-of-international-concern-(pheic)-global-research-and-innovation-forum. [Google Scholar]
3. WorldOMeters, “Coronavirus cases,” 2020. [Online]. Available: https://www.worldometers.info/coronavirus/. [Google Scholar]
4. European Centre for Disease Prevention and Control: An Agency of the European Union, “Download the daily number of new reported cases of COVID-19 by country worldwide,” 2020. [Online]. Available: https://www.ecdc.europa.eu/en/publications-data/download-todays-data-geographic-distribution-covid-19-cases-worldwide. [Google Scholar]
5. I. G. Arpin, M. Habib, F. Al-Ayoubi, G. Sutherland, A. Dobrescu et al., “Modelling the burden of cardiovascular disease in Saudi Arabia and the impact of reducing modifiable risk factors,” Journal of the Saudi Heart Association, vol. 30, no. 4, pp. 365–267, 2018. [Google Scholar]
6. A. Rachah and D. F. M. Torres, “Mathematical modelling, simulation, and optimal control of the 2014 Ebola outbreak in west Africa,” Discrete Dynamics in Nature and Society, vol. 7, no. 2, pp. 1–9, 2015. [Google Scholar]
7. C. Rorres, M. Romano, J. A. Miller, J. M. Mossey, T. H. Grubesic et al., “Contact tracing for the control of infectious disease epidemics: Chronic wasting disease in deer farms,” Epidemics, vol. 23, no. 5, pp. 71–75, 2018. [Google Scholar]
8. V. K. R. Chimmula and L. Zhang, “Time series forecasting of COVID-19 transmission in Canada using LSTM networks,” Chaos Solitons, and Fractals, vol. 135, no. 8, pp. 109864, 2019. [Google Scholar]
9. Saudi Embassy, “Provincial system,” 2021. [Online]. Available: https://www.saudiembassy.net/provincial-system. [Google Scholar]
10. Saudi Embassy, “About Saudi Arabia,” 2021. [Online]. Available: http://www.statoids.com/usa.html. [Google Scholar]
11. Saudi Embassy, “The total population,” 2021. [Online]. Available: https://www.stats.gov.sa/en/indicators/1. [Google Scholar]
12. Saudi Embassy, “The world fact book-Saudi Arabia,” 2021. [Online]. Available: https://www.cia.gov/library/publications/the-world-factbook/geos/sa.html. [Google Scholar]
13. Science Daily, “COVID-19 Coronavirus epidemic has a natural origin,” 2021. [Online]. Available: https://www.sciencedaily.com/releases/2020/03/200317175442.htm. [Google Scholar]
14. WorldoMeters, “Coronavirus cases,” 2021. [Online]. Available: https://www.worldometers.info/coronavirus/. [Google Scholar]
15. Saudi Embassy, “Largest cities in Saudi Arabia,” 2021. [Online]. Available: https://population.mongabay.com/population/saudi-arabia/. [Google Scholar]
16. Gulf News, “COVID-19: Saudi Arabia expects 200,000 cases if measures not followed,” 2020. [Online]. Available: https://gulfnews.com/world/gulf/saudi/covid-19-saudi-arabia-expects-200000-cases-if-measures-not-followed-1.1586263454490. [Google Scholar]
17. Corona Tracker, “Corona tracker-Saudi Arabia overview,” 2020. [Online]. Available: https://www.coronatracker.com/country/saudi-arabia/. [Google Scholar]
18. A. Baz, H. Hakami and E. Sharef, “A framework of computational model for predicting the spread of COVID-19 pandemic in Saudi Arabia,” International Journal of Intelligent Engineering and Systems, vol. 13, no. 4, pp. 526–540, 2020. [Google Scholar]
19. S. Ahmed and A. Alhumam, “Analyzing the implications of COVID-19 pandemic: Saudi Arabian perspective,” Intelligent Automation & Soft Computing, vol. 27, no. 3, pp. 835–851, 2021. [Google Scholar]
20. M. Baz, H. Alhakami, A. Agrawal, A. Baz and R. A. Khan, “Impact of COVID-19 pandemic: A cybersecurity perspective,” Intelligent Automation & Soft Computing, vol. 27, no. 3, pp. 641–652, 2021. [Google Scholar]
21. W. Alhakami, A. Binmahfoudh, A. Baz, H. Alhakami, M. Tarique et al., “Atrocious impinging of COVID-19 pandemic on software development industries,” Computer Systems Science and Engineering, vol. 36, no. 2, pp. 323–338, 2021. [Google Scholar]
22. A. Baz and H. Alhakami, “Fuzzy based decision making approach for evaluating the severity of COVID-19 pandemic in cities of kingdom of Saudi Arabia,” Computers, Materials & Continua, vol. 66, no. 2, pp. 1155–1174, 2021. [Google Scholar]
23. W. Alosaimi, R. Kumar, A. Alharbi, H. Alyami, A. Agrawal et al., “Computational technique for effectiveness of treatments used in curing SARS-CoV-2,” Intelligent Automation & Soft Computing, vol. 28, no. 3, pp. 617–628, 2021. [Google Scholar]
24. A. Attaallah, M. Ahmad, A. H. Seh, A. Agrawal, R. Kumar et al., “Estimating the impact of COVID-19 pandemic on the research community in the Kingdom of Saudi Arabia,” Computer Modeling in Engineering & Sciences, vol. 126, no. 1, pp. 419–436, 2021. [Google Scholar]
25. F. J. Alsolami, A. Saad, A. I. Khan, Y. B. Abushark, A. Almalawi et al., “Impact assessment of COVID-19 pandemic through machine learning models,” Computers, Materials & Continua, vol. 68, no. 3, pp. 2895–2912, 2021. [Google Scholar]
26. King Abdullah Petroleum Studies and Research Center, “Saudi Arabia coronavirus disease (COVID-19) situation, Riyadh, Saudi Arabia: Ministry of Health,” 2021. [Online]. Available: https://datasource.kapsarc.org/explore/dataset/saudi-arabia-coronavirus-disease-covid-19-situation. [Google Scholar]
27. C. S. Yu, “A GP-AHP method for solving group decision-making fuzzy AHP problems,” Computers & Operations Research, vol. 29, no. 14, pp. 1969–2001, 2020. [Google Scholar]
28. T. L. Satty, “The analytic hierarchy process,” Analytic Hierarchy Process Journal, vol. 5, no. 6, pp. 187–194, 1980. [Google Scholar]
29. S. J. Chen and C. L. Hwang, Fuzzy Multiple Attribute Decision Making Methods. Berlin, Heidelberg: Springer, 1992. [Online]. Available at: https://www.springer.com/gp/book/9783540549987. [Google Scholar]
30. C. L. Hwang and K. Yoon, “Methods for multiple attribute decision making,” Lecture Notes in Economics and Mathematical Systems, Berlin, Heidelberg, vol. 186, 58–191, 1981. [Google Scholar]
31. C. W. Chang, C. R. Wu and H. L. Lin, “Integrating fuzzy theory and hierarchy concepts to evaluate software quality,” Software Quality Journal, vol. 16, no. 2, pp. 263–276, 2008. [Google Scholar]
 | This work is licensed under a Creative Commons Attribution 4.0 International License, which permits unrestricted use, distribution, and reproduction in any medium, provided the original work is properly cited. |