DOI:10.32604/csse.2022.021239
| Computer Systems Science & Engineering DOI:10.32604/csse.2022.021239 | |
| Article |
System Dynamics Forecasting on Taiwan Power Supply Chain
1Department of Industrial Management, National Taiwan University of Science and Technology, Taipei, 10607, Taiwan
2Industrial Engineering and Management Department, International University, Ho Chi Minh City, 70000, Vietnam
3Department of Public Finance, Feng Chia University, Taichung, Taiwan
*Corresponding Author: Zhiqiu Yu. Email: D10201m01@ntust.edu.tw
Received: 28 June 2021; Accepted: 12 August 2021
Abstract: This research aims to study the sustainability of Taiwan power supply chain based on system dynamics forecasting. The paper tries to investigate electricity shortage effects not only on the industrial side, but also from the standpoint of society. In our model, different forecasting methods such as linear regression, time series analysis, and gray forecasting are also considered to predict the parameters. Further tests such as the structure, dimension, historical fit, and sensitivity of the model are also conducted in this paper. Through analysis forecasting result, we believe that the demand for electricity in Taiwan will continue to increase to a certain level for a period of time in the future. This phenomenon is closely related to Taiwan’s economic development, especially industrial development. We also point out that electricity prices in Taiwan do not match with high industrial demand, and that prices are still slightly low. Finally, the future growth trend of Taiwan’s electricity demand has not changed, and ensuring adequate supply to meet electricity demand to prevent potential power shortages will pose some difficulty.
Keywords: System dynamics; taiwan power supply chain; electricity demand
In modern life, electricity has become one of the most indispensable energy sources for humanity. It can be said that the prosperity of the entire world economy and improvements to people’s quality of life depend on the stable supply of electricity. Without electricity, societal development would soon stagnate. Therefore, the supply chains of power are particularly important. Power demand forecasting is a vital part of power system planning and provides the foundation of the economic operation of the power supply chains. Electricity demand forecasts can be divided into four types regarding to time namely: long-term, medium-term, short-term, and ultra-short-term. From the industrial view, they can be categorized as civil load, commercial load, rural load, industrial load, and other loads. If relying on characteristics, they can be classified as highest demand load, lowest demand load, and average demand load.
There are various forecasting methods for electricity demand, such as: Markovié et al. [1] which uses expert forecasting, Senel et al. [2] uses regression analysis, Mcqueen et al. [3] relies on trend extrapolation, Harvey and Koopman [4] relies on time sequence method, and so on. Other approaches, such as: the gray model method [5], neural network method [6,7], big data forecasting method [8] etc., are also applied to forecast the development of the electricity market. Forecasting methods of other interdisciplinary subjects are also maturing. He et al. [9] applied system dynamics in forecasting the urban long term electricity demand of Tianjin. They investigated influencing factors, and establishes the quantitati relationship based on econometrics. He also proposed a long-term electricity demand forecasting model that is suitable for the new economic normal in industry sectors. Long-range Energy Alternatives Planning System (LEAP) model was applied by Huang in modelling Taiwan’s energy sector [10]. The model considered greenhouse gas emissions, with several energy policies and energy sector evolution. Their research provides an interpretation of the implications of model results for future energy and climate policies in Taiwan. System dynamics was also adopted by Laimon to analyze the behaviour of the Austrilian energy sector in [11]. The results showed that Australian energy sector is unsustainable and growth is not being controlled due to excessive fossil fuel extraction, high emissions and high energy dependency. Relying so much on unrenewable energy such as coal and gas is a large risk. Nivethitha et al. [12] suggested a novel Haar wavelet based mutation operator was introduced to apply in ISCOA-LSTM method. Their work used data obtained from an academic building to make the short, mid, and long-term forecasting. Nia et al. [13] discovered 73 distinctive approaches of energy demand forecasting. Each prediction method has its own characteristics, and its prediction results have different reference value.
Through literature review, we found that system dynamics has been applied to power system policy evaluation [14], power generation capacity expansion [15], demand-side management [16], financial tools [17] and so on, with many researchers modeling the power sector by constructing sustainable development models. The summary of these works can be found in Ahmad et al.’s paper [18]. Saraji et al. [19] reviewed the ability of system dynamics to forecast various fields of study such as marketing, supply chain, environment by reviewing 28 research papers.
In the actual power demand forecasting process, power demand is often restricted and affected by various complex factors such as economy, population, market, etc., especially long-term power demand, which has dynamic and complex characteristics. System dynamics, as a method of studying high-order, nonlinear, and multi-variable feedback, is a highly promising approach to the study of power demand forecasting. Compared with other modeling methods, system dynamics has many advantages. It allows researchers to model complex energy systems from the perspective of causality, rather than relying solely on statistically significant relationships. The importance of causality in modeling is discussed in the work of Pearl et al. [20]. System dynamics also provides the modeler the ability to obtain several feedback relationships and study nonlinear relationships When comparing with other blackbox forecasting methods, such as artificial neural network, system dynamic can provide a better insight of interactions among factors on system performance. This advantage plays a crucial role for policy makers when decisions must be explanable instead of only obtaining the results. Another disadvantage of blackbox forecasting methods is that they require many data which are not often avaible in case of forecasting for a whole area.
As an island, the Taiwan region cannot have direct power connections with other regions, so there are geographic limitations in power demand and supply. Especially in recent years, due to policy changes and various complex factors, Taiwan has repeatedly experienced large-scale power outages and rationing incidents, which have caused great trouble to people’s lives and industrial production. Therefore, this study will construct an intuitive power demand system dynamics model by analyzing the influence factors of the power demand load to provide a reference for the management of the power system in a complex environment.
In summary, the main contributions of this study include: identifying key factors and trends affecting the development of Taiwan’s long-term power demand, explaining the complex interactive relationship between the development of electricity demand in Taiwan and its influencing factors, enlightening the phenomenon of Taiwan’s power development, and simulating related policy changes.
This article is divided into five parts. The first section is the introduction. The construction of the dynamic model of Taiwan’s power demand system is described in section two. The third section discusses and explains the model test, while the fourth section is the scenario analysis. Finally, the conclusion is drawn in the fifth section.
Power development in Taiwan has gone through the stages of water power, water and fire, fire and water, energy diversification, demand-side management, opening of private power generation, as well as energy-saving and carbon-reduction periods.
Fig. 1 shows the actual electricity demand in Taiwan from 1994 to 2018. Electricity consumption increased from the original 115.2 billion kWh to 233.28 billion kWh. Except for the reduction in electricity demand due to the global financial crisis after 2008, the overall trend is linear increase.

Figure 1: Explores effective control methods for Taiwan’s electricity demand
Generally, our definition of power demand is the power consumption for production and life. But in real life, power generation units also need electricity in the production process. At the same time, the line loss during power transmission is also considerable. For this reason, we believe that the total power demand is the sum of power consumption, power plant power consumption, and line loss power.
There are many factors affecting power demand, such as residents’ income factors, economic factors, economic structure, energy substitution, electricity prices, energy efficiency, population, temperature, line loss rate, power consumption, per capita power consumption, self-consumption of power companies, etc. In Taiwan, electricity consumption has the greatest impact, which can be subdivided into two parts: electricity consumption and electricity consumption for electric lights. Among them, electricity consumption is more affected by the economy and industry, while electricity consumption for electric lights is affected by population, electricity price and temperature. For the overall demand for electricity, industrial electricity generally accounts for the majority. Tab. 1 shows the data total consumption and industrial consumption in Taiwan from 1994 to 2018. It can be seen that, industrial consumption has increased year by year and not reached the peak. For example, in 2010 the industry consumed 125 billion kWh, occupied 57.35% of total energy consumption.
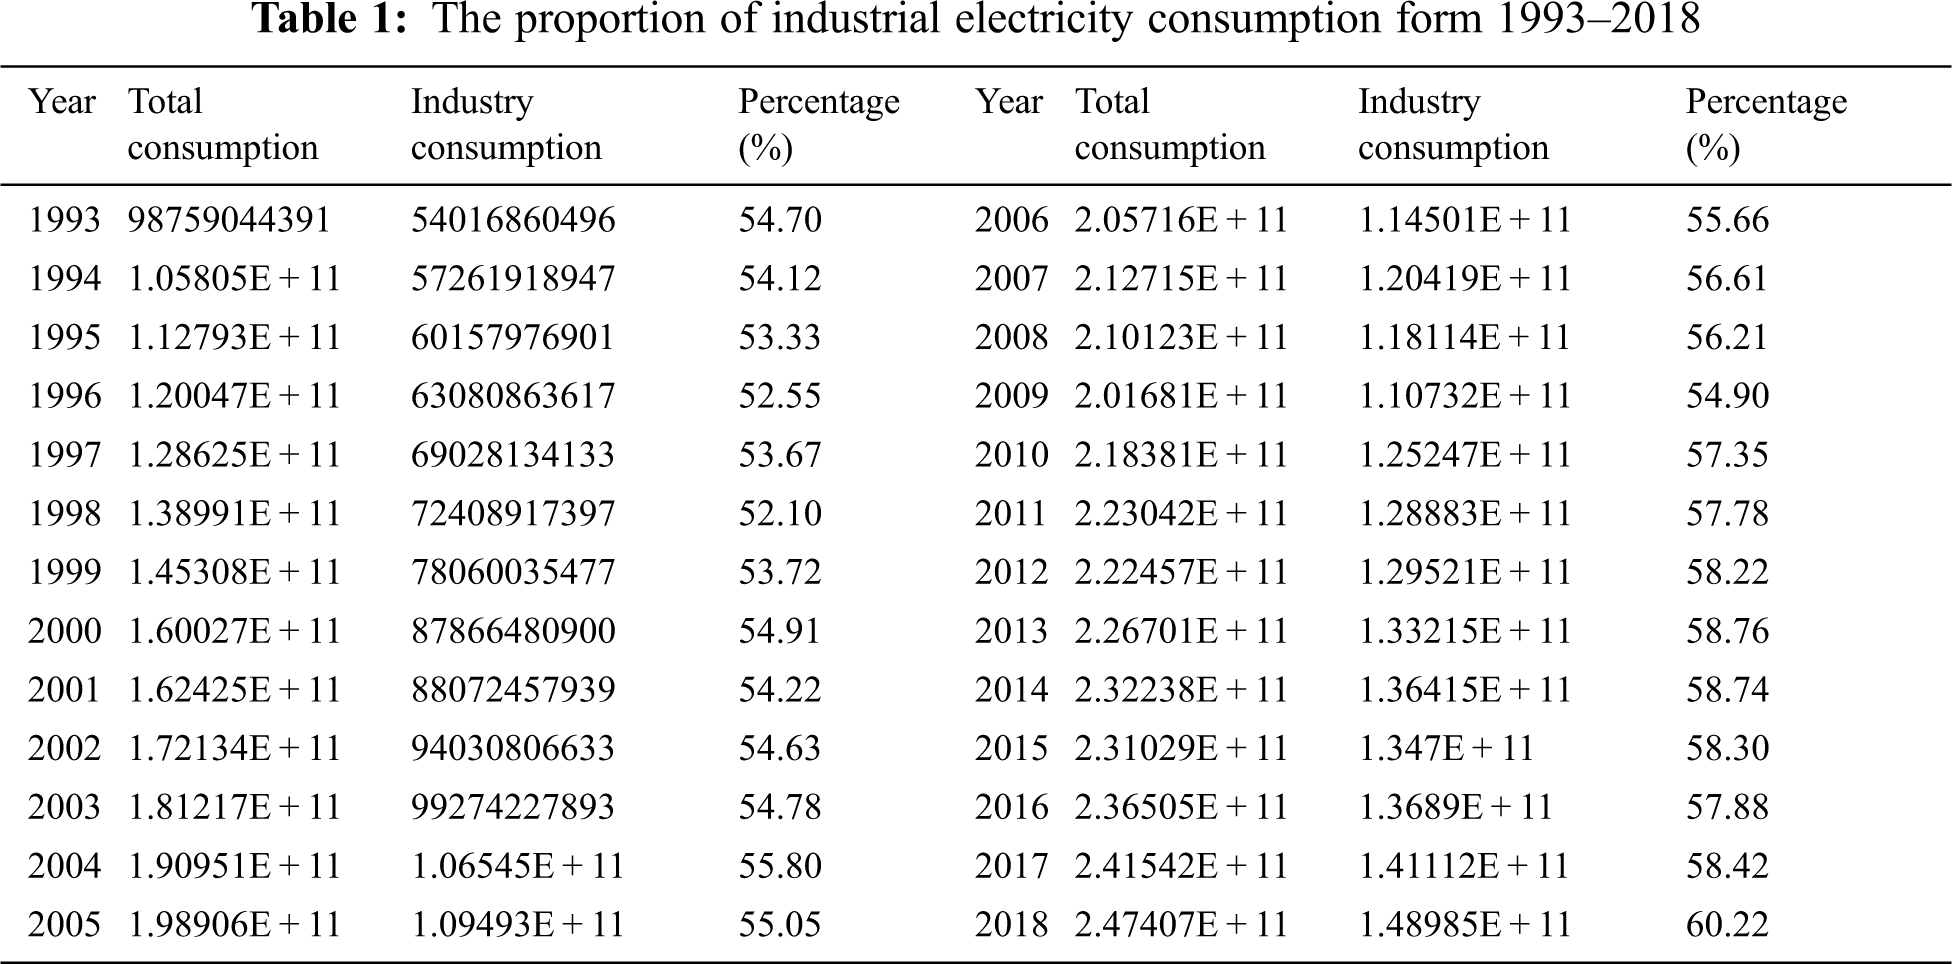
The industrial sector accounts for more than half of total electricity consumption. In particular, Taiwan’s semiconductor industry has a prominent demand for electricity.
In order to simplify the model as a whole [21], the list of selected model is summarized in Tab. 2. These variables are selected due to their high impacts on both total and industry consumptions. Furthermore, to simulate and slove values of differential equations as well as their integral during the planning horizon the Euler’s method is adopted.

In order to better study the long-term forecast of power demand, it is assumed that the impact of weather on long-term power demand is zero. Furthermore, due to Taiwan’s geographical restrictions, the influence of power supply area is also excluded from the model.
The power demand system of Taiwan includes economic, social, and power demand modules. The economic module is mainly comprised of industrial output value and GDP. In the social module, population size has the greatest impact on power demand. As a result of this, impacts of population growth and population deaths on the total population are analyzed thoroughly. In the power demand module, power consumption, self-use power demand, line loss, power price, and industrial power consumption are investigated. It is emphasized that the power line loss and the self-use power of the energy sector are also included in the power demand, rather than just calculating the power consumption.
Based on the existing literature and the actual situation in Taiwan, this paper uses system dynamics to construct a causal loop diagram of Taiwan’s electricity demand in Fig. 2. Among them, Taiwan’s total power demand is composed of power line loss, self-use power demand, and power consumption. Power consumption is affected by economic factors, industrial factors, power efficiency factors, and electricity price factors.

Figure 2: Model feedback structure of Taiwan’s electricity demand
Based on the causality diagram in Fig. 2, a system flow diagram of Taiwan’s electricity demand created in the Vensim program is shown in Fig. 3. In this model, the population, GDP, energy sector’s own electricity, line loss electricity, industrial electricity consumption, and total industrial output are set as state variables. The number of births, deaths, GDP increase, industrial added value, industrial electricity increase, line loss electricity increase, energy sector electricity self-use increase, etc. are set as rate variables. The rest are set as auxiliary variables, constants, and exogenous variables.

Figure 3: Flow diagram
2.4 Parameter Identification and Equations
System dynamics mainly emphasizes the structure of the system. For some parameters in the model that lack historical data, reasonable assumptions can be made. However, because the parameter selection of system dynamics is often misunderstood, the initial values, parameters, and coefficients of the variables in the equations should be selected in econometric methods as much as possible. This study attempts to use historical data officially released by Taiwan’s Accounting Office and the Energy Bureau of the Ministry of Economic Affairs for fitting, regression analysis, and prediction. Among them, for data whose linear trend is not obvious, the table function method based on [22].
In this paper, the simulation time is determined to be from 1994 to 2035, the step size is 0.5, and Euler’s algorithm is selected. The Vensim software is selected to construct the system. Vensim is an industrial strength simulation software for improving the performance of real systems. In Vensim, INTEG function returns the numerical integral of the rate while WITHLOOKUP function returns value of output yi corresponding with input xi. Data for WITHLOOKUP is a list of pairs which is under the form (xi, yi).
The relationship between the main variables of the model is as follows:
(01) FINAL TIME = 2035
Units: Year
The final time for the simulation.
(02) GDP = INTEG (GDP increase, 7.02207e + 12)
Units: TWD
(03) GDP increase rate = WITH LOOKUP (Time, ([(1994, 0.01) – (2035, 0.09)], (1994, 0.0696834),…,(2035, 0.0180666)))
Units: 1/Year
GDP growth rate is a table function, which is obtained by linear regression analysis of Taiwan’s GDP over the years. The R-squared value of the regression equation is 0.987, which is highly significant.
(04) GDP increase = GDP*GDP increase rate
Units: TWD/Year
(05) INITIAL TIME = 1994
Units: Year
The initial time for the simulation.
(06) SAVEPER = TIME STEP
Units: Year [0, ?]
The frequency with which output is stored.
(07) TIME STEP = 0.5
Units: Year [0, ?]
The time step for the simulation.
(08) Population number = INTEG (Birth number – Mortality number, 2.10866e + 07)
Units: person
(09) GDP per capita = GDP/Population number
Units: TWD/person
(10) Birth rate = WITH LOOKUP (Time, ([(1994, 0.001) – (2035, 0.02)], (1994, 0.015),…,(2035, 0.00224)))
Units: fraction/Year
Due to the large fluctuations in historical data, birthrate predicted through time series analysis that the square of R was 0.870919. The forecast data is highly significant.
(11) Birth number = Population number*Birth rate
Units: person/Year
(12) Industrialization factor = Industrialization level/Standard amount of industrialization level
Units: Dmnl
(13) Industrialization level = Industry output/GDP
Units: Dmnl
(14) Standard amount of industrialization level = 0.298901
Units: Dmnl
(15) Industrial added value = Industry output × Industrial added value increase rate
Units: TWD/Year
(16) Industrial added value increase rate = WITH LOOKUP (Time, ([(1994, 0) – (2035, 0.1)], (1994, 0.0900663),…,(2035, 0.0191928)))
Units: 1/Year
(17) Industry output = INTEG (Industrial added value, 2.09891e + 12)
Units: TWD
(18) Industrial electricity consumption increase rate = WITH LOOKUP (Time, ([(1994, 0.01) – (2035, 0.08)], (1994, 0.0658558),…,(2035, 0.0177984)))
Units: 1/Year
(19) Industrial electricity consumption increase quantity = Industrial electricity consumption increase rate × Industrial electricity consumption quantity
Units: kWh/Year
(20) Industrial electricity consumption quantity = INTEG (Industrial electricity consumption increase quantity, 6.11147e + 10)
Units: kWh
(21) Standard GDP per capita = 333011
Units: TWD/person
(22) Standard unit output value energy consumption = 34.3438
Units: TWD/kWh
(23) Standard electricity price = 81.78
Units: Dmnl
(24) Mortality rate = WITH LOOKUP (Time, ([(1994, 0.004) – (2035, 0.009)], (1994, 0.00534),…,(2035, 0.00864)))
Units: 1/Year
(25) Mortality number = Population number*Mortality rate
Units: TWD/Year
(26) Electricity price = WITH LOOKUP (Time, ([(1994, 70) – (2035, 130)], (1994, 81.7797),…,(2018, 102.119)))
Units: Dmnl
(27) Electricity price level = Electricity price/Standard electricity price
Units: Dmnl
(28) Electricity consumption factor = Electricity usage efficiency/Standard unit output value energy consumption
Units: Dmnl
(29) Electricity usage efficiency = Industry output/Industrial electricity consumption quantity
Units: TWD/kWh
(30) Standard amount of electricity consumption = 1.05805e + 11
Units: kWh
(31) Electricity consumption = Standard amount of electricity consumption × Economic factors1.074 × Electricity consumption factor−0.776 × electricity price level−0.058 × Industrialization factor0.59
Units: kWh
The historical data in 1994 is used for standardized calculation, and then the logarithm is taken, and then the parameter value is calculated through multiple linear regression analysis.
(32) Line loss rate = WITH LOOKUP (Time, ([(1994, −0.3) – (2035, 0.3)], (1994, 0.127104),…,(2035, 0.000102468)))
Units: 1/Year
Because the power line loss data lacks an obvious linear relationship, the data is processed by buffering operators to dig out some usable information in the data, then the gray prediction theory is used to make loop predictions to obtain the predicted values, and finally combined into the actual changes in the data Trends are described by table function and based on works of [22]. This method is called system dynamics and grey model approach loop prediction theory.
(33) Electricity demand = Electricity consumption + Line loss + Self use by the energy sector
Units: kWh
(34) Line loss increase quantity = Line loss rate × Line loss quantity
Units: kWh/Year
(35) Line loss = INTEG (Line loss increase quantity, 5.84015e + 09)
Units: kWh
(36) Economic factors = GDP per capita/Standard GDP per capita
Units: Dmnl
(37) Increasing rate of electricity self use in the energy sector = Self consumption growth rate × Self use by the energy sector
Units: kWh/Year
(38) Self use by the energy sector = INTEG (Increasing rate of electricity self use in the energy sector, 1.23948e + 10)
Units: kWh
(39) Self_consumption growth rate = WITH LOOKUP (Time, ([(1994, −0.09) − (2035, 0.2)], (1994, 0.177018),…,(2035, 0.000542493)))
Units: 1/Year
3 Model Validation and Testing
In order to ensure the robustness of the model, validation is required. Sterman once said in his book “All models are wrong” [23]. Life is complicated so that no model can truly reflect all the details, and it is impossible to have one that is exactly the same as the real world. All models are just simplifications of the real world. Under this premise, the most basic question of model checking is not only whether the model is correct, but also whether the model is effective and can help solve the real problem.
System dynamics model testing generally includes two aspects: model structure testing and model behavior testing. Model structure testing also includes direct model testing and structural behavior testing [24]. Direct structure inspection mainly includes model structure, parameter, boundary, and dimension evaluation. This section mainly examines dimension and structure.
In order to ensure that the model conforms to the meaning of physical logic, the consistency of formula units in the model is checked through Vensim. Furthermore, the Vensim test also ensures that the system dynamics model of Taiwan’s power demand meets the requirements of the structural test.
In order to ensure robustness of model results, it is also necessary to compare the running results of the model with historical data. Through the comparison, when the error is within an acceptable range, the model can be considered reliable.
Fig. 4 represents the comparison between the forecast values and historical data. As can be seen that, the forecast model fits relative well with the historical data especially in the field relating to electricity demand and consumption. In the industry output, there is a consideration gap from around 2007–2013 which can be explained as a result of global financial crisis starting from 2007. Taiwan also suffered this crisis since its export market were mainly Europe and America.

Figure 4: The forecast value vs. historical values
Futhermore, sensitivity testing is also conducted. Sensitivity testing refers to how the model’s operating results will change if avariable varies within a certain range. In this test, the industrial growth rate is assumed to follow uniform distribution in the interval of 0.01 to 0.08. The model was run two hundred times to see the distribution of the running results. The specific operation is realized through Vensim’s own sensitivity function.
As can be seen from Fig. 5, due to the different parameters, the operating results are different. However, the shape of the entire graph is basically the same, and 50% of the simulation results fall in the middle light position. The operating structure of the entire model shows numerical sensitivity but does not appear to be sensitive to behavioral patterns or policies. Therefore, we believe that the model’s responds well to the sensitivity test.

Figure 5: The forecast value versus historical values
The model uses 0.5 as the step size to simulate the results from 1994 to 2035. According to the simulation of Fig. 6, the main factors affecting Taiwan’s electricity demand are the development of GDP, Taiwan’s industries which rely heavily on electricity and economic development. Overall power demand trends upward. As long as the economy continues to develop, the power demand trend will remain largely unchanged. The simulation also pointed out that the population of Taiwan has entered an inflection point after 2020, and has begun to slowly decrease. Taiwan’s overall electricity consumption is closely related to the total industrial output value, industrial electricity consumption, and the overall GDP. Although the population is declining, Taiwan’s industry will continue to develop further. It is estimated that by 2035, Taiwan’s electricity consumption will reach 396.28 billion kWh. On the whole, Taiwan’s electricity demand will continue to grow in the next 15 years or so. Combined with reality, Taiwan’s high-tech industries, especially the semiconductor industry, have an increasing demand for electricity, which is in line with the trend in the model. Among the influencing factors, the impact of electricity prices is not obvious. Although the electricity price index has been increasing over the years, overall, the growth trend is decreasing. In terms of electricity price alone, between 1994 and 2014, although the comprehensive price of electricity increased, besides the highest price in 2014 of 3.0705 TWD per kWh, the price began to drop to 2.6 TWD. Therefore, the overall price of electricity in Taiwan is low and cannot reveal much about the supply and demand situation in the market.

Figure 6: Changes in electricity demand due to population changes
The use of electricity is closely related to people’s production and life. To adjust the demand for electricity, we can increase the price of electricity and increase the efficiency of electricity use. In order to analyze the changes in Taiwan’s electricity demand under different scenarios, some of the parameters in the model are varied, and compared with the baseline scenario to simulate possible future situations.
The first is to adjust the price of electricity, and restore the price of electricity after 2018–2035 to the price of 2014. As shown in Fig. 7, We simulate gradually increasing the price of electricity to a position higher than the highest price in history. By adjusting prices, it can be seen that electricity consumption will decrease to a certain extent. In other words, the appropriate adjustment of prices can restrain the growth trend of electricity demand to a certain extent when fully reflecting the supply and demand of the market. Although it is very small, the impact will be huge. However, the general public is very sensitive to prices, and it is often difficult to implement policies to increase electricity prices in Taiwan.

Figure 7: Increase electricity price
The second is to reduce the growth rate of industrial electricity consumption. Industrial electricity has always occupied an important proportion of electricity demand. Ideally, less electricity consumption and higher GDP are the best scenarios. Therefore, the growth rate of industrial power consumption after 2018 is set to be declined. Fig. 8 shows that if industrial electricity consumption can achieve a faster and lower growth rate, the entire electricity demand will decrease. However, since the more high-tech industries in Taiwan currently demand more electricity, a single restriction on high-tech industries is obviously not in line with the development trend. Therefore, industrial energy conservation under the new situation needs to be put on the agenda as soon as possible. Although Taiwan has explored many methods for industrial energy conservation, and the trend can be seen from the simulation, if it can accelerate the energy conservation process and reduce the growth rate of industrial power consumption, it can effectively curb the growth of electricity demand.

Figure 8: Reducing energy consumption rate
Finally, as the rate of increase in the demand for self-use electricity from power plants is becoming more stable, we will increase the adjustment and increase the overall demand for electricity. However, since part of the free electricity of power plants is pumped water, this part of the demand can be converted into electricity supply in the future. This part requires separate discussion to some extent, so will not be covered here.
In general, Taiwan’s electricity demand is still gradually increasing, but the growth rate has gradually slowed down. But this does not mean that Taiwan’s electricity demand will soon reach an inflection point. Through simulation, our preliminary analysis of the suppression of Taiwan’s electricity demand is mainly achieved through the regulation of electricity prices. At the same time, for industrial electricity, if the growth rate can be curbed, it can also effectively control the growth of Taiwan’s electricity demand. However, in actual operation, we want to achieve a solution to the power shortage crisis by suppressing the demand for electricity. We believe that it is very difficult and there are too few means. This article mainly constructs a system dynamics model from another angle, in order to judge the trend of Taiwan’s electricity demand in a more macroscopic view, and then provides another perspective for the discussion of Taiwan’s electricity. Of course, this article has not yet touched on the issue of discussing Taiwan’s power supply. In future research, the scope must be further widened to also include discussion of Taiwan’s power supply, by comparing the relationship between demand and supply, seeking power supply solutions that meet demand, and then discussing comprehensive solutions for Taiwan’s power system.
Funding Statement: The authors received no specific funding for this study.
Conflicts of Interest: The authors declare that they have no conflicts of interest to report regarding the present study.
1. M. L. Markovié and W. F. Fraissler, “Short term load forecast by plausibility checking of announced demand: An experts system approach,” European Transactions on Electrical Power, vol. 3, no. 5, pp. 353–358, 2007. [Google Scholar]
2. M. Senel, B. Senel, L. Bilir and V. Zeytin, “The relation between electricity demand and the economic and demographic state - a multiple regression analysis,” Journal of Energy Finance & Development, vol. 38, no. 1, pp. 257–274, 2013. [Google Scholar]
3. D. Mcqueen, D. R. Hyland and S. Watson, “Monte carlo simulation of residential electricity demand for forecasting maximum demand on distribution networks,” IEEE Transactions on Power Systems, vol. 19, no. 3, pp. 1685–1689, 2004. [Google Scholar]
4. D. Yi, S. Ning, C. J. Chang and S. C. Kou, “Forecasting unemployment using internet search data via prism,” Journal of the American Statistical Association, vol. 0, no. 0, pp. 1–12, 2021. [Google Scholar]
5. X. Wang, “Grey prediction with rolling mechanism for electricity demand forecasting of shanghai,” in 2007 IEEE Int. Conf. on Grey Systems and Intelligent Services, Nanjing, China, pp. 689–692, 2007. [Google Scholar]
6. A. Dewabharata and S. Y. Chou, “Application of fuzzy neural network on the electricity consumption forecasting,” in 4th Int. Conf. on Industrial Engineering & Applications, Nagoya, Japan, pp. 345–349, 2017. [Google Scholar]
7. V. C. Tai, Y. C. Tan, N. F. A. Rahman, H. X. Che, C. M. Chia et al., “Long-term electricity demand forecasting for Malaysia using artificial neural networks in the presence of input and model uncertainties,” Energy Engineering, vol. 118, no. 3, pp. 715–725, 2021. [Google Scholar]
8. Z. Wei, X. Li, X. Li, Q. Hu, H. Zhang et al., “Medium- and long-term electric power demand forecasting based on the big data of smart city,” Journal of Physics Conference Series, vol. 887, no. 1, pp. 1–25, 2017. [Google Scholar]
9. Y. He, J. Jiao, Q. Chen, S. Ge, Y. Chang et al., “Urban long term electricity demand forecast method based on system dynamics of the new economic normal: The case of tianjin,” Energy, vol. 133, no. 1, pp. 9–22, 2017. [Google Scholar]
10. Y. Huang, Y. J. Bor and C. Y. Peng, “The long-term forecast of Taiwan’s energy supply and demand: LEAP model application,” Energy Policy, vol. 39, no. 11, pp. 6790–6803, 2011. [Google Scholar]
11. M. Laimon, T. Mai, S. Goh and T. Yusaf, “Energy sector development: System dynamic analysis,” Applied Sciences, vol. 10, no. 1, pp. 1–19, 2020. [Google Scholar]
12. S. Nivethitha, M. R. G. Raman and R. Krithi, “A hybrid model for building energy consumption forecasting using long short term memory networks,” Applied Energy, vol. 261, no. 11, pp. 114–131, 2020. [Google Scholar]
13. A. R. Nia, A. Awasthi and N. Bhuiyan, “Industry 4.0 and demand forecasting of the energy supply chain: A literature review,” Computers & Industrial Engineering, vol. 154, no. 5, pp. 107–128, 2021. [Google Scholar]
14. S. Ahmad and B. Razman, “Using system dynamics to evaluate renewable electricity development in Malaysia,” Kybernetes, vol. 43, no. 1, pp. 24–39, 2014. [Google Scholar]
15. H. Qudrat-Ullah, “Understanding the dynamics of electricity generation capacity in Canada: A system dynamics approach,” Energy, vol. 59, no. 15, pp. 285–294, 2013. [Google Scholar]
16. G. Strbac, “Demand side management: Benefits and challenges,” Energy Policy, vol. 36, no. 12, pp. 4419–4426, 2008. [Google Scholar]
17. A. Ford, K. Vogstad and H. Flynn, “Simulating price patterns for tradable green certificates to promote electricity generation from wind,” Energy Policy, vol. 35, no. 1, pp. 91–111, 2007. [Google Scholar]
18. S. Ahmad, R. M. Tahar, F. M. Sukki, A. B. Munir and R. A. Rahim, “Application of system dynamics approach in electricity sector modelling: A review,” Renewable and Sustainable Energy Reviews, vol. 56, no. 1, pp. 29–37, 2016. [Google Scholar]
19. M. K. Saraji and A. M. Sharifabadi, “Application of system dynamics in forecasting: A systematic review,” international journal of management,” Accounting and Economics, vol.4, no.12, pp. 1192–1205, 2017. [Google Scholar]
20. J. Pearl and D. Mackenzie, “The ladder of causation,” In the Book of Why: the New Science of Cause and Effect, 1st ed, Newyork, USA, Basic Books, vol. 1, pp. 1–33, 2018. [Google Scholar]
21. Y. Fang and X. He, “Power shortage in Taiwan-base on the analysis of their power supply and demand,” Taiwan Research Journal, vol. 163, no. 3, pp. 40–51, 2019. [Google Scholar]
22. S. Jia and G. Yan, “Effects of the policy of air pollution charging fee based on system dynamics and grey model approach,” Systems Engineering-Theory & Practice, vol. 39, no. 9, pp. 2436–2450, 2019. [Google Scholar]
23. J. D. Sterman, “Structure and Behavior of Dynamic Systems,” In Business Dynamics, System Thinking and Modeling for a Complex World, 1st ed, NewYork, America, McGraw-Hill, pp. 50–100, 2000. [Google Scholar]
24. Y. Barlas, “Formal aspects of model validity and validation in system dynamics,” System Dynamics Review, vol. 12, no. 3, pp. 183–210, 1996. [Google Scholar]
 | This work is licensed under a Creative Commons Attribution 4.0 International License, which permits unrestricted use, distribution, and reproduction in any medium, provided the original work is properly cited. |