DOI:10.32604/csse.2022.020013

| Computer Systems Science & Engineering DOI:10.32604/csse.2022.020013 |  |
| Article |
Student Behavior Modeling for an E-Learning System Offering Personalized Learning Experiences
1Department of Computer Science and Engineering, Kings College of Engineering, Pudukkottai, 613303, India
2Department of Computer Science and Engineering, Thiagarajar College of Engineering, Madurai, 625015, India
*Corresponding Author: K. Abhirami. Email: abhirami.cse@kingsindia.net
Received: 06 May 2021; Accepted: 09 June 2021
Abstract: With the advent of computing and communication technologies, it has become possible for a learner to expand his or her knowledge irrespective of the place and time. Web-based learning promotes active and independent learning. Large scale e-learning platforms revolutionized the concept of studying and it also paved the way for innovative and effective teaching-learning process. This digital learning improves the quality of teaching and also promotes educational equity. However, the challenges in e-learning platforms include dissimilarities in learner’s ability and needs, lack of student motivation towards learning activities and provision for adaptive learning environment. The quality of learning can be enhanced by analyzing the online learner’s behavioral characteristics and their application of intelligent instructional strategy. It is not possible to identify the difficulties faced during the process through evaluation after the completion of e-learning course. It is thus essential for an e-learning system to include component offering adaptive control of learning and maintain user’s interest level. In this research work, a framework is proposed to analyze the behavior of online learners and motivate the students towards the learning process accordingly so as to increase the rate of learner’s objective attainment. Catering to the demands of e-learner, an intelligent model is presented in this study for e-learning system that apply supervised machine learning algorithm. An adaptive e-learning system suits every category of learner, improves the learner’s performance and paves way for offering personalized learning experiences.
Keywords: Learner behavior modeling; e-learning; intelligent learning system; machine learning algorithm
Knowledge and skill acquisition with the help of electronic technologies is the popular advancement in learning system. ICT-enabled learning has an important role to play in educational system and has started replacing the traditional classroom practices. Flexible e-learning systems that are accessible anywhere, anytime have overcome various barriers found in classroom teaching-learning process and reached wider target audience. Geographically-widespread learners, with restrictions to classroom participation, access flexible e-learning systems that offer variety of courses through online mode.
Web-based e-learning systems are attractive for students in terms of course enrollment though the course completion and personalized learning experience need attention for its success. In traditional education approaches, the performance level of the students is appraised and they are motivated through various physical interactions. However, in e-learning platforms, such interactions are not only less, but it is also difficult to determine student participation. The usage of online learning systems has been widely recognized and used, leading to educational practice transformation. In spite of this, major blockages to online learning systems are low course completion ratio and adaptable learner-centric system [1].
E-learning providers aim at developing a technology-enabled learning solution that incorporates quality teaching-learning-assessment practices and retain the interest level of the students. In an e-learning system, e-media serves as the interface between a learner and the instructor. Since the traditional classroom practices are replaced, e-learning system should have provision to understand the user’s thought process and ensure their active participation. ELearning platform should capture the behavioral parameters of different learners and categorize students based on their behavior. The success of such system depends on course coverage approaches by preserving the attention of the learner throughout the process, assessment pattern etc. The instructor should facilitate learning, encourage the learner, stimulate the ability level of learner which results in increased competency level at the end of learning process. The behavioral pattern of the students and assessments during e-learning process help in identifying their potentials and their interest levels.
Online learning platforms can be created with advanced tools that suit the needs of the learners. The e-learning methods are mostly synchronous or asynchronous in nature depending on the learner’s need and learning objective. The main factors that influence the successful progression and completion of online courses are maintaining student engagement through various activities, provision for interactions at all stages of learning, learner’s feedback and support system as per the need and suitable assessment methodologies.
In this research work, a framework is proposed to analyze the behavior of online learners according to which the student is motivated during the learning process and the rate of learner’s objective attainment is increased. Catering to the demands of e-learners, an intelligent model is presented herewith for e-learning system through the application of supervised machine learning algorithm. The paper is structured as given herewith. Background and motivation are briefed in Section 2. In Section 3, the proposed e-learning user behavior modeling framework is presented. Section 4 discusses the discovery of pattern on online learner behavior. In Section 5, a summary of findings is presented. Finally, both conclusion and future work are presented.
In the event of technological advancements and its ease to access information online, e-learning systems are widely adapted by learners of all age groups across the globe. E-learners possess the advantage of flexible learning opportunities and gain access to online learning platforms that enhance their skills, competence and knowledge. One of the challenging issues faced by LMS (Learning Management System) providers is to uphold the interest levels of the learners at all stages of learning [2]. The ultimate objective of e-learning systems is not fulfilled unless the students and learners feel ease in accessing the system, perceive its effectiveness and usefulness. User satisfaction level and the level of intention to use the system are the critical factors that determine the success of e-learning systems [3].
The improvement in students’ competencies, skills, and knowledge are seen as the main benefits reaped from e-learning at organizational level. Both user satisfaction and behavioral intention to use thereof are the determining factors of e-learning success. The instant antecedent of usage behavior is known as the behavioral intention which determines the readiness of users to carry on certain behavior. The actual usage can be precisely indicated by measuring the behavioral intention.
Instructor-led learning and self-paced learning are two general e-learning approaches. In instructor-led learning, the activities are scheduled and led by the instructor. Instructor-led learning, also known as synchronous online learning, makes the learners participate in a learning activity together at a scheduled time. Real-time synchronous online learning involves online chats, discussions and video conferencing whereas the platform for interaction allows both instructor and learner to interact instantly with each other. Communication form includes explanations, illustration, interaction, feedback etc. [4].
In self-paced learning, also known as asynchronous learning, learners are free to learn on their own pace without any real-time communication. The learner can set their own personal learning path. With the absence of specific schedule for events, this method is considered to be highly flexible. Asynchronous e-learning is often preferred by learners who could not engage in fixed time slots for learning. They prefer to set their own timeframes for learning and they are not required to be available on specific time slots for learning purpose. Learner communication falls under asynchronous category which includes emails, discussion forum, whiteboards etc.
The e-learners gain a lot of benefits from e-learning process in terms of flexibility to utilize learning materials at convenient time, accessibility towards exercises during convenient slots and the freedom to check the correctness of answers. However, e-learning systems face multiple challenges. Fixed learning content and exercises, designed by the instructors in reality, does not suit the learners who possess different knowledge level and learning ability. As a result, the objectives of such e-learning systems is not met. If same set of practice questions are posed upon, the learners lack interests, do not progress further in the course and get demotivated to continue the course. Based on the learner’s potential pace of course content, the complexity level of exercises can be designed for e-learning system to be adaptive and successful.
The instructors can offer learner-centric e-learning solution by understanding the learners. Course content, course delivery and support are to be provided during the learning stages in an adaptive manner [5]. Adaptive e-learning solutions suit individual learners in a way such that the course content is offered followed by learning sequence and the structure of exercises. Adaptive e-learning can help the learners gain a better learning outcome than traditional e-learning as the former supports learning similar to classroom setting without any support in the due course of the process [6].
The learning process can be enhanced in a better way by supporting a learner’s unique requirements and inclusion of personalization feature into e-learning system with adaptive navigation [7]. The creation of interactive learning content, appropriate sequence of instructional practices and meeting the demands of a learner are essential to keep her/him on pace with the flow of the course. Management and evaluation of the learning activity, based on learner’s behavior, are thus essential components of LMS. Adaptive e-learning makes it possible to adapt and provide instructional material and evaluate the learner as per their needs and abilities. Adaptive e-learning paves way for offering highly individualized and student-centered learning opportunities by considering a number of parameters such as student performance and his/her abilities.
To accomplish the goals of adaptive learning, e-learning system designers have to analyze the learning behavior of individuals. It is thus essential to identify and analyze the learning characteristics of individual users by mining user log data. In e-learning environments, learner’s access time, duration of access, learning content navigation pattern, interactions and assessments are clear factors in understanding a learner’s behavior and his or her potentials. Preferred time to perform tasks, participation in discussions and group activities on discussion forums, or social networking applications are vital factors in determining an individual learner’s behavioral pattern. To realize adaptive learning, it is thus essential to identify an individual’s learning style, learning objective and plan and their needs and abilities.
Learning style is the manner in which an individual learns best. For effective teaching, individual learning style, their preferences and characteristics need to be considered. Attitude and behavior determine an individual’s learning style [8]. According to Honey & Mumford’s theory of learning style, the individuals are classified based on the level of activities at every stage. Reflexive and theoretical tend to achieve their best in online environment. Activists and pragmatists do well in face-to-face interactions. The e-learning system should be designed by including aspects recommended by Honey et al. [9].
The course instructional delivery design, for an e-learning platform, should comprise of activities that meet the requirements of all category learners. Learners, with an opportunity to actively engage during the process, tend to perform better. It provides extended opportunity to explore and expand knowledge and skill. For ‘active learner’ category, discussion forum, practice exercises related to course and reviews are preferred. Reflexive learners prefer to watch and think. Based on the perceived experiences, reflexive learners tend to progress. E-learning platforms must include demonstrations and videos to support reflexive learners. Pragmatist learners prefer to experiment with theories, ideas, and techniques. They prefer to take time from conceptualization to making it a reality. Experimental activities like simulation exercises support pragmatist learners. Theorists inherently seek to understand the theory behind the action. They enjoy following the model and reading up on facts to better engage in the learning process. Tab. 1, given below, enumerates the learners’ classification and their preferences.

According to Felder-Silverman learning style model, people consume and process the information through different ways based on their individual preferences. Felder et al. [10] developed a model to depict different learning styles and preferences. According to the model, four areas of personality contribute in the learning process. They are active or reflective, sensing or intuitive, visual or verbal and sequential or global [5]. Tab. 2 summarizes the classification of learners, their preferences and activities on four dimensions.

With strong support from the model, the learner’s category-wise preferences in information processing, perception, presentation and understanding are illustrated with suitable activities in Tab. 2. Course content delivery plan must augment both visual and auditory preferences of the learners. The focus on course introductory content and views attract the auditory preferences. Graphical course delivery is a preferred choice among learners with visual preferences. Course indexing is here to sustain both sequential and global learning styles and forms an essential component of e-learning platforms. This provides navigational facility to both sequential learners and non-sequential learners. Comprehensive course outline, with appropriate navigational GUI-based feature, is thus a functional component for successful learning platform. The progress of a learner can be identified through suitable assignments and exercises. A review on the submissions and feedback encourages the learners to sustain.
Student engagement in learning process can be explicitly identified through participation in discussion forums. It is proven that an active participant of discussion forum does not drop the course in midway. Thus, the degree of engagement is a vital parameter which helps in knowing the learner’s participation in the course [11]. When a suitable predictive model is embedded within the LMS, it identifies the progression of course among learners. Instructor can identify the less-engaged learners and adjust the instructional strategy accordingly. Advisory mail, feedback on learner’s engagement, course progression indication to learners and feedback on learner’s performance prompts the user to become active in learning process [5].
LMS prompts user interaction right from the early stage of course registration. It identifies a learner’s behavior from every action of the user. Behavior modeling paves way for analyzing the online learning process of students. Students’ behavior makes a difference in learning effect [12]. A concrete objective for course registration and inner motive drive the course progression of the learner. In line with this, the course material has a large impact in learning process. The inclusion of appropriate multimedia content attracts the user. To identify a learner’s behavior in online learning platforms, activity logs are key resources through which one can gain much insights. Behavior pattern helps in the identification of learning style [13].
Being an independent learner, online learners are in isolation and lack emotional communication, peer learner support and experience barriers in maintaining learning enthusiasm. Based on the user’s behavior modeling, ILMS has to support the learners at all stages of learning and drive the learner community towards course completion. Personalization, in e-learning process, depends on learner behavior modeling whereas the flexibility in the analysis of learning process is a vital feature possessed by e-learning systems [14].
Perceived usefulness & ease of use significantly contribute in the adaptation of e-learning systems. External factors related to system access and system level features such as course design, course content and support provided to the learners during the learning period tend to reflect significantly in the prediction of user’s attitude and their adaptation to e-learning system. Fig. 1 depicts the factors that influence the e-learning system. An easily accessible and highly useful e-learning system makes the users inclined towards course completion and its usage [2,15,16].

Figure 1: Factors influencing e-learning system
2.6 Machine Learning Algorithms
A machine is said to be learning based on its past experiences, with respect to some class of tasks, if its performance in a given task improves with experience. For example, assume that a machine has to predict whether an e-learner of a MOOC platform will complete the enrolled course or not. The machine accomplishes the task based on its previous knowledge/past experiences i.e., based on past learner behavior data during the course, response to activities, interaction and final results. The basic premise of machine learning is the development of algorithms that can receive input data, use statistical analysis and predict an output while in parallel, update those outputs as and when the new data becomes available.
Machine learning algorithms are classified as supervised, unsupervised, semi-supervised and reinforcement. Supervised learning occurs when a model gets trained on a labelled dataset. Labelled dataset has both input and output parameters.
Supervised learning occurs when an input variable (x) and an output variable (Y) are known and an algorithm learns the mapping function from input to output. It is called ‘supervised learning’ because of the process involved i.e., an algorithm learns from the training dataset alike a teacher supervises the learning process. Classification and regression are two types of supervised learning. Classification is a supervised learning task in which the output has defined labels (discrete value). For example, result has defined labels i.e., 0 or 1; 1 means the learner will pass the course and 0 means the learner will not pass the exams. Here, the goal is to predict discrete values that belong to a particular class and evaluate it on the basis of accuracy. It can be either binary or multi class classification. In binary classification, the model predicts either 0 or 1 i.e., ‘yes’ or ‘no’. But in case of multi-class classification, the model predicts more than one class. Regression is a supervised learning task, where the output has a continuous value. For example, wind speed at a given region is a continuous value. Linear regression, Nearest Neighbor, Naïve Bayes, Decision Trees, Support Vector Machine and Random Forest are supervised learning algorithms.
In unsupervised learning, the input data (X) is known whereas no corresponding output variables are identified. This phenomenon is called ‘unsupervised learning’, because unlike ‘supervised learning’ there are no correct answers and there is no teacher as well. In short, there is no complete and clean-labelled dataset in unsupervised learning. Unsupervised learning is self-organized learning. The main aim of this learning approach is to explore the underlying patterns and predicts the output. Here, the machine is provided with data and is engineered to look for hidden features and cluster the data in a way that makes sense. Clustering and association are two types of unsupervised learning. Clustering problem can be loosely defined as the discovery of inherent groupings in the data such as grouping the customers based on their purchasing behavior. An association rule learning problem is the scenario in which one wants to discover rules that describe large portions of the data, for instance, those people who buy X also tend to buy Y.
A reinforcement learning algorithm, or agent, learns by interacting with its environment. The agent receives the rewards for correct performance and penalties for performing incorrectly. The agent learns from a human without intervention by maximizing its reward and minimizing its penalty. It is a type of dynamic programming that trains the algorithms using a system of reward and punishment.
2.7 Building Classification Model Using Supervised Machine Learning Algorithms
A classification model attempts to draw some conclusion from the input values taken for training. It predicts the class labels or categories for new data. Classification with two possible outcomes is known as ‘binary classification’. Classification with more than two classes is multi-class classification in which every sample is assigned to one and only one target label. When a classification model is built, it trains to classify the data x and training label y. Followed by training, given an unlabeled observation x, the mode predicts the label, y. The performance of the model is evaluated using various metrics viz., confusion matrix, accuracy, true positive rate, false positive rate, F1 score and precision.
Logistic regression, designed for classification, is useful for understanding the influence of several independent variables on a single outcome variable. The probabilities that describe the possible outcomes of a single trial are modelled using a logistic function. However, this model works only if the predicted variable is binary and all the predictors are assumed to be independent of each other. Further, it assumes the data is free of missing values. Naïve Bayes classification algorithm is based on Bayes’ theorem that assumes the independence between every pair of features. This algorithm requires a small number of training data to estimate the parameters. It performs classification quickly in comparison with highly sophisticated methods.
K-Nearest Neighbour (KNN) classification algorithm performs classification from a simple majority vote of k nearest neighbours of each end point. This algorithm is easy to implement, robust to handle noisy training data and is effective if training is provided in large numbers. Decision Tree produces a sequence of rules that can be used in the classification of data, given that the data of attributes are put together with its classes. It is simple to understand, visualize and can handle both numerical and categorical data.
Random Forest classifier is a meta-estimator that fits a number of decision trees on various sub-samples of datasets. It uses an average to improve the predictive accuracy of the model and controls over-fitting issues. The reduction in over-fitting is found to be highly accurate in random forest classifier than decision trees in most of the cases. Support Vector Machine is a representation of training data as points in space, separated into categories, by a clear gap that is wide as much as possible. New examples are then mapped into same space and are predicted under a category based on which side of the gap, they fall.
In current study system design, a three-layered e-Learning system framework is proposed. (i) Learner layer (ii) Intelligent Learning Management System (ILMS) layer and (iii) Expert layer. An online learner interacts with the system using Learning Management System (LMS) interface. Fig. 2 depicts the proposed 3-layered system framework.
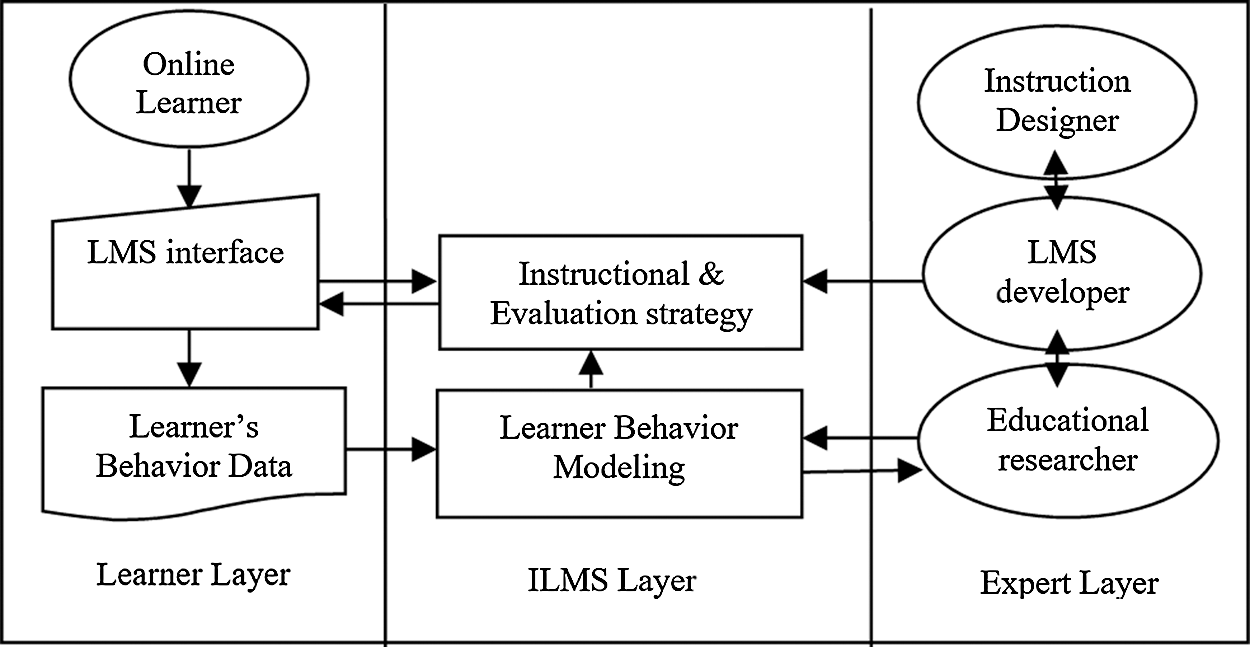
Figure 2: Three layered e-learning system framework
A learner’s behavior data is captured for analysis in this layer. Behavior data is utilized by ILMS layer and is categorized based on similarity. Instructional and evaluation strategy is set based on user’s characteristics. ILMS layer is guided by the expert layer in which educational researcher is included and he or she guides the design of e-learning system.
LMS developer does the design for the platform with inputs derived from instruction designer and educational researcher [14].
3.1 Learner Behaviour Tracking
Course learning path design should include a component that measures a learner’s cognitive behavior and monitors their progress with appropriate feedback that offers effective learning [17]. A Learner’s path design should capture behavioral characteristics that are latent and cannot be directly measured. When a learner’s experiential data is analyzed through the application of machine learning algorithms, it helps in categorizing the learners. Thus, behavior analysis helps in designing the adaptive educational path thereby retaining the learners into the system [18].
At every stage of e-learning, interaction occurs in different levels between the users. Every action provides inputs to understand the user. Course enrollment captures the basic data about a learner such as age, gender, qualification, work nature etc. Pre-requisite tests and pre-assessment tests help to understand a user’s knowledge level before undergoing the course. At the end of chapters/session, the evaluation exercises tests the progress of learners. Post-assessment test, at the end of the course, helps in identifying the overall development of the learner.
The vital parameters in course log file includes access duration, visits, date and clickstream patterns which altogether help in understanding the learner. A user’s timely submission of assignments and attempting assessments on schedule indicate their progress and commitment level. Learner coverage schedule is another important parameter in user identification. Based on these parameters, user profiling is done. The learner layer thus captures the data to perform behavior modeling.
Intelligent Learning Management System (ILMS) layer provides approaches to instruction and evaluation based on user behavior analysis. The learning activities are designed to facilitate the understanding and modeling of user behavior. Its activities include topic-oriented tasks with deadline which motivates the learner to actively participate throughout the course path.
Both synchronous and asynchronous communication approaches also augment user behavior identification process. Real-time chatting, video conferencing, application sharing, whiteboard communication and polling provide opportunity to identify a user’s interactive behavior. In LMS, asynchronous communication provision too complements the modeling process. The questionnaire can be designed in the identification of learning style of the user [19].
The choice of delivery strategy that matches the learner’s ability is an essential part of e-learning environment. In adaptive learning, the learning material access and activities match the learner’s potential and preferences. Learner’s knowledge level and learning style determine the instructional strategy and evaluation strategy in adaptive LMS. ILMS functionality is designed as a rule-based recommendation system with the application of machine learning algorithm. Simple instructional methodology prompts the learner to listen and observe. Application-based instructional method has provisions for demos, case study-based examples, role plays etc. The provision for collaborative learning supports interactive learning process.
3.2 Design of Adaptive Learning Path
In e-learning environment, it is important to select the delivery strategy that meets the learner’s ability. In adaptive learning, the potential and preferences of the learner are taken into account to ensure the learning material access and activities. When it comes to adaptive LMS, both knowledge level as well as learning style of the learner decide the instructional strategy and evaluation strategy. A learner with strong inclination towards visual content tend to spend more time on picture-based content rather than text. Once, a learner’s style is identified, adaptive learning content provision can be made easily [11].
ILMS functionality is designed as a rule-based recommendation system with the application of machine learning algorithm [10]. Simple instructional methodology prompts the learner to listen and observe. Application-based instructional method enables the provisions for demos, case study-based examples, role plays etc. The provision for collaborative learning supports interactive learning process.
4 System Modeling, Evaluation and Analysis
The identification of learning style and the classification of learners based on their learning style tend to facilitate LMS design. Learning behavior modeling is an essential component to retain the interest level of e-learning users. This augments the wide reach and impact of flexible learning system. Based on the initial interactions and introductory exercises, a learner’s style has to be identified.
Building a classification model to understand a learner’s behavior starts with importing e-learner dataset. A system was designed using python language. Pandas package was used to import data in .csv format. Exploratory data analysis was conducted to explore the data. The researcher identified the shape of data, missing values and data type. The tasks that got completed on data, before building the classification model, come under exploratory data model. Fig. 3 depicts the summary of attributes in e-learning platform dataset. Data preprocessing is a data mining technique that involves the transformation of raw data into an understandable format. Real-world data is often incomplete: lack attribute values and certain attributes of interest or else contains only aggregate data, noisy: contains errors or outliers and inconsistent: contains discrepancies in codes or names. Data preprocessing is a proven method to resolve such issues. Fig. 4 depicts the distribution pattern of input attributes. Fig. 5 depicts the distribution of learner vs. final results.
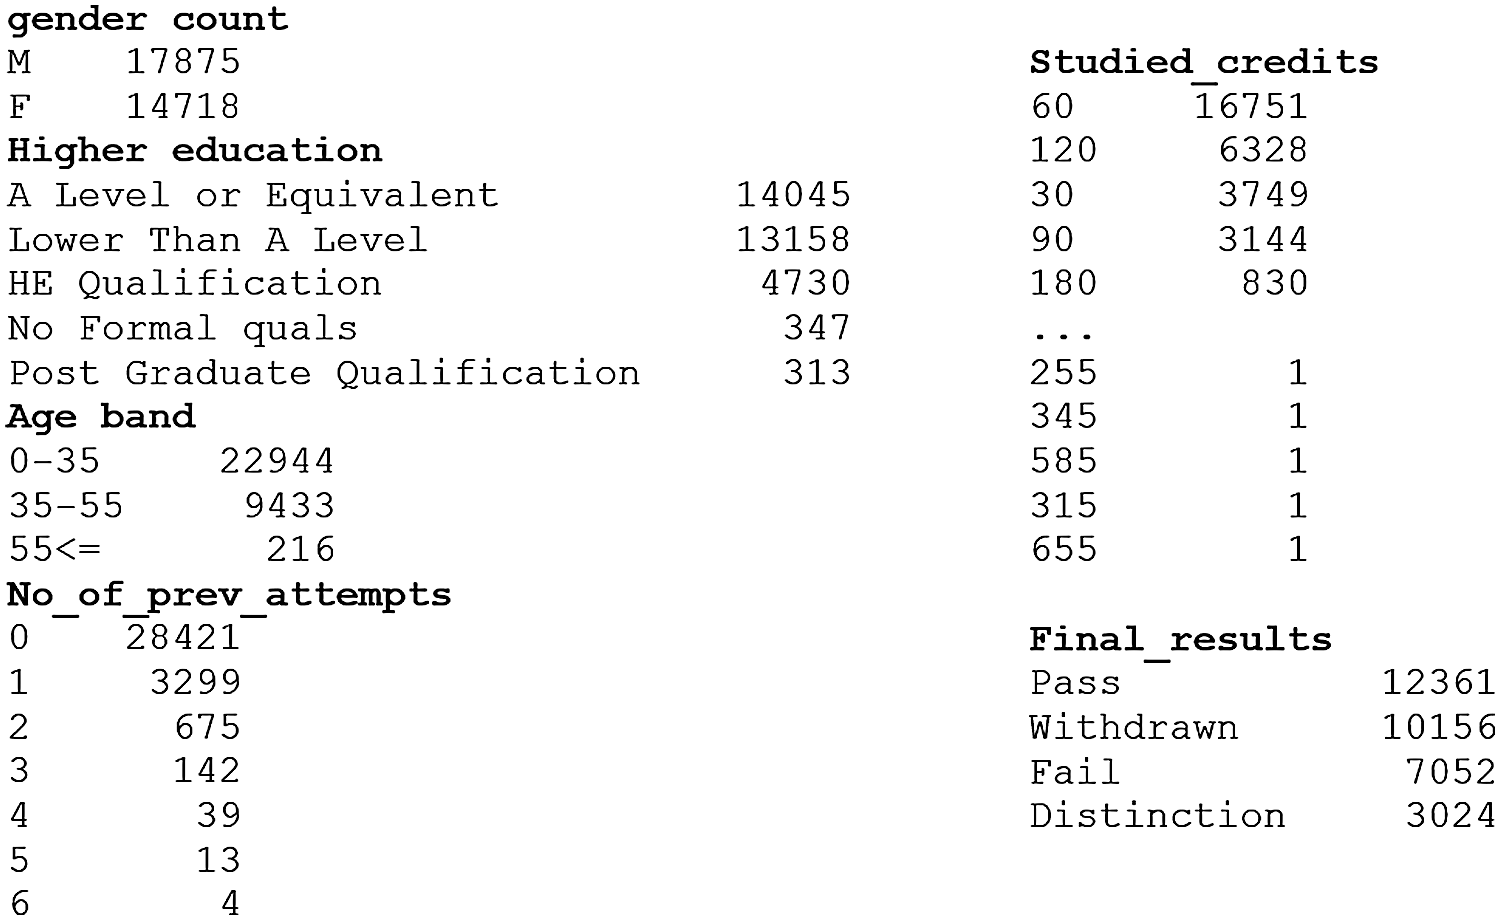
Figure 3: Summary of attributes in e-learning platform dataset
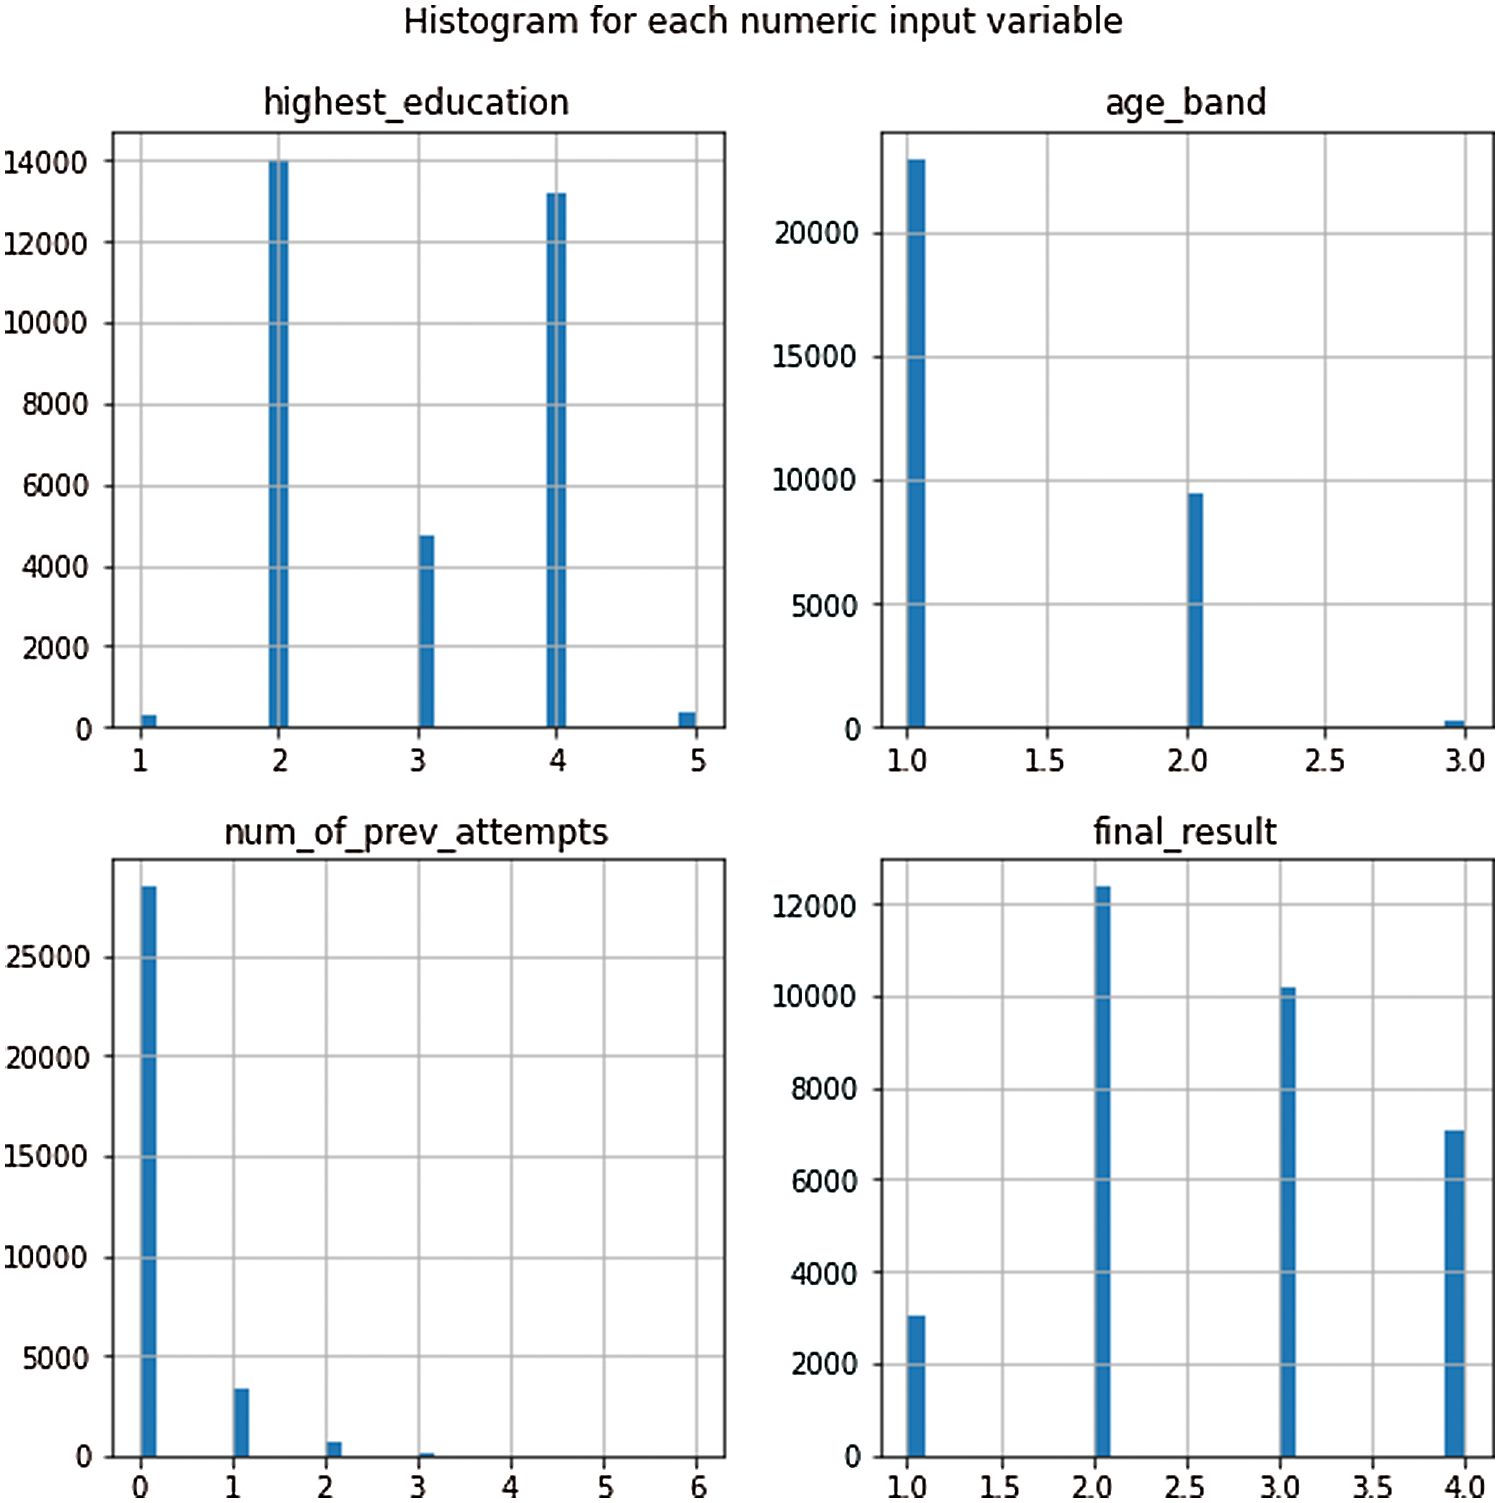
Figure 4: Histogram showing input attribute distribution
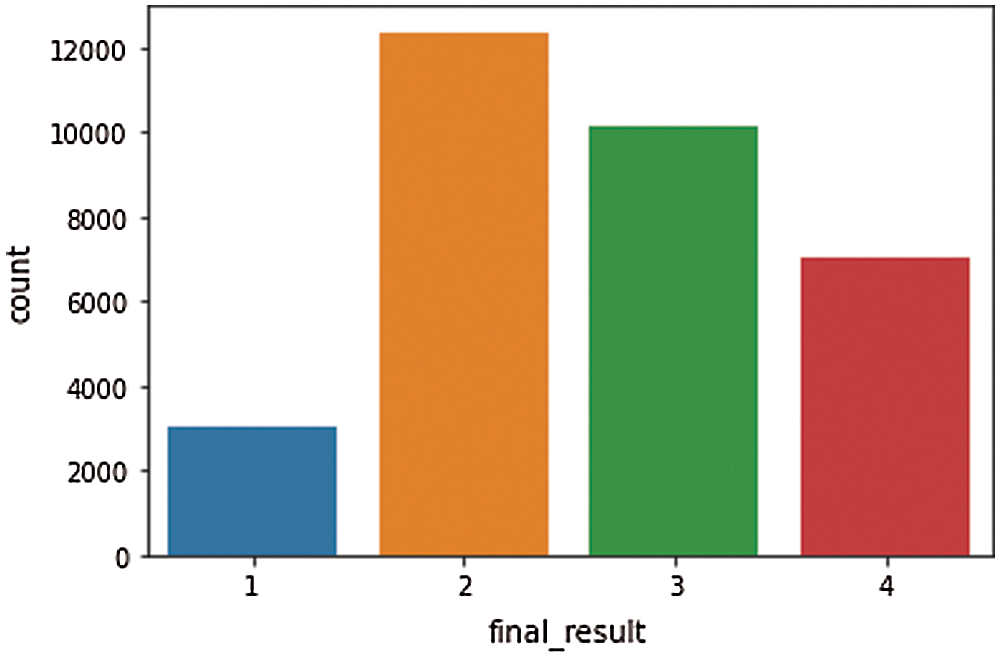
Figure 5: Learner vs. final results distribution pattern
There are two ways by which one can handle missing values in the current dataset. The first method is commonly used to handle null values. Here, it is suggested to delete a particular row if it has a null value for a particular feature and a particular column if it has more than 75% of missing values. This method is advised only when there are enough samples in the data set. One has to make sure that after the data is deleted, there is no addition of bias.
In second method, all NaN values are replaced with either mean, median or the most frequent value. This is an approximation which can add variance to the data set. But the loss of data can be negated by this method and it yields better results compared to removal of rows and columns. Replacing with above three approximations is one another statistical approach to handle the missing values. This method is also called as leaking the data while training.
Categorical data denotes the variables that contain label values rather than numeric values. The number of possible values is often limited to a fixed set. The categorical features are typically stored as text values that represent different traits of the observation. For example, gender is described as Male (M) or Female (F) whereas product type is described as electronics, apparels, food etc. This type of features is called nominal feature in which the categories are only labeled without any order of precedence. Features which have some order associated with them are called ordinal features. For example, economic status is a feature with three categories such as low, medium and high, which have an associated order. There are also continuous features which are numerical and have an infinite number of values between any two values. A continuous variable can be numeric or date/time. The simplest approach is ‘Find and Replace’. Another approach to encode the categorical values is to use a technique called ‘label encoding’. Label encoding is simple conversion of each value in a column to a number. A common alternative approach is called ‘one hot encoding’. Despite the availability of different names, the basic strategy is to convert each category value into a new column and assign it with 1 or 0 (True/False) to the column. This has the benefit of not weighing a value improperly, but does have the downside of adding more columns to the data set. Label encoding is adopted in the model designed for current study.
4.2 Handling Outliers in Dataset
In dataset, outlier denotes a data point and is distant from all other observations. It is a data point that lies outside the overall distribution of dataset. Extreme value is just minimum or maximum value which need not to be much different from the data. Further, a point which is far away from other points is called outlier. Boxplot is used to identify the outliers. The available methods to treat outlier are Interquartile Range (IQR) Method and Z-Score method. The incorporation of IQR method outlier is as follows. The data point falls 1.5 times outside of the Interquartile range, above the 3rd quartile (Q3) and below the 1st quartile (Q1). In such scenario, the conditions are applied to remove outlier. Outliers are any points which are below Lower_Whisker or above Upper_Whisker. The data point falls outside the 3-standard deviations. Z_score method is used if z score falls outside 2 standard deviations. If z-score is higher than 3, we can classify that point as an outlier. The current study calculated the z-score for each data point in the dataset. Fig. 6 depicts the results for learner studied credit as boxplot, Fig. 7 depicts the results for genderwise gained credits and Fig. 8 depicts educational experience vs. results. Any point outside 3 standard deviations would be an outlier.
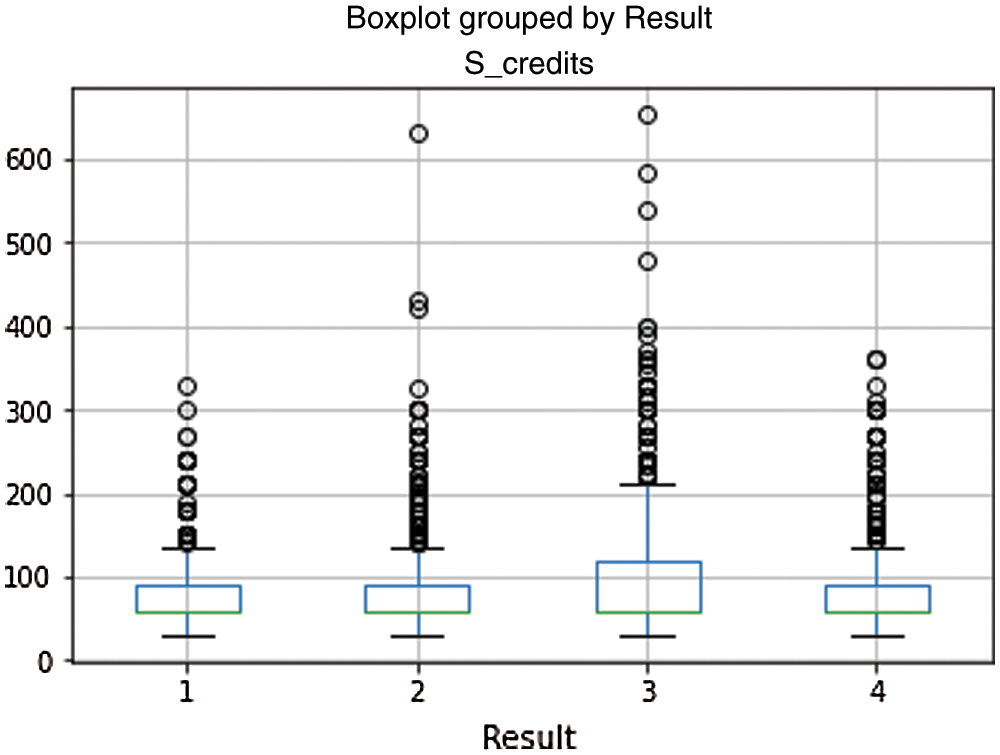
Figure 6: Learner studied credit vs. results
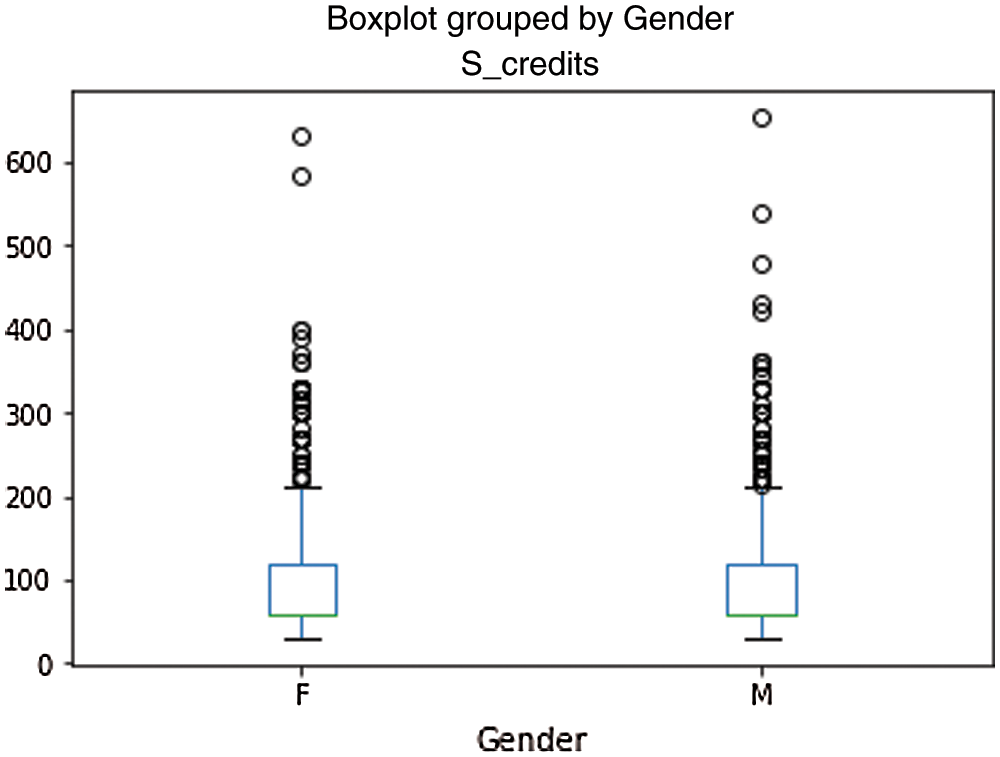
Figure 7: Gender vs. studied credits
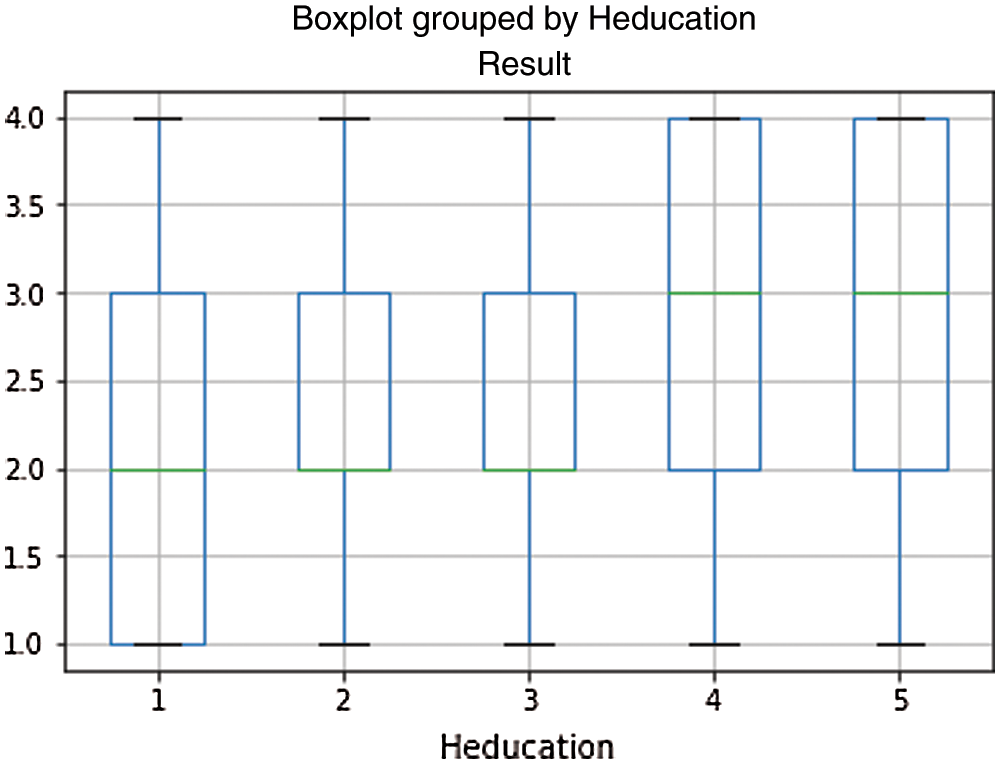
Figure 8: Educational experience vs. results
In the given dataset used for building the model, outlier is found in learner studied credit vs. results and gender vs. studied credits. Using box-plot, outlier is identified as extreme outlier i.e., falls out of 3rd quartile. Outlier identification and removal are done as approaches to preprocess the data.
4.2.1 Evaluation of Classification Model
Evaluation metrics are designed to validate the performance of a machine learning model and is an integral component of any model. It aims at estimating the generalization accuracy of a model on future (unseen/out-of-sample) data.
Confusion matrix is a matrix representation of prediction results of any binary testing that is often used to describe the performance of classification model (or “classifier”) on test data set for which the true values are known. Each prediction can be one of the four outcomes as depicted in Fig. 9, based on how it matches to the actual value:
§ ▪ True Positive (TP): Predicted True and True in reality.
§ ▪ True Negative (TN): Predicted False and False in reality.
§ ▪ False Positive (FP): Predicted True and False in reality.
§ ▪ False Negative (FN): Predicted False and True in reality.
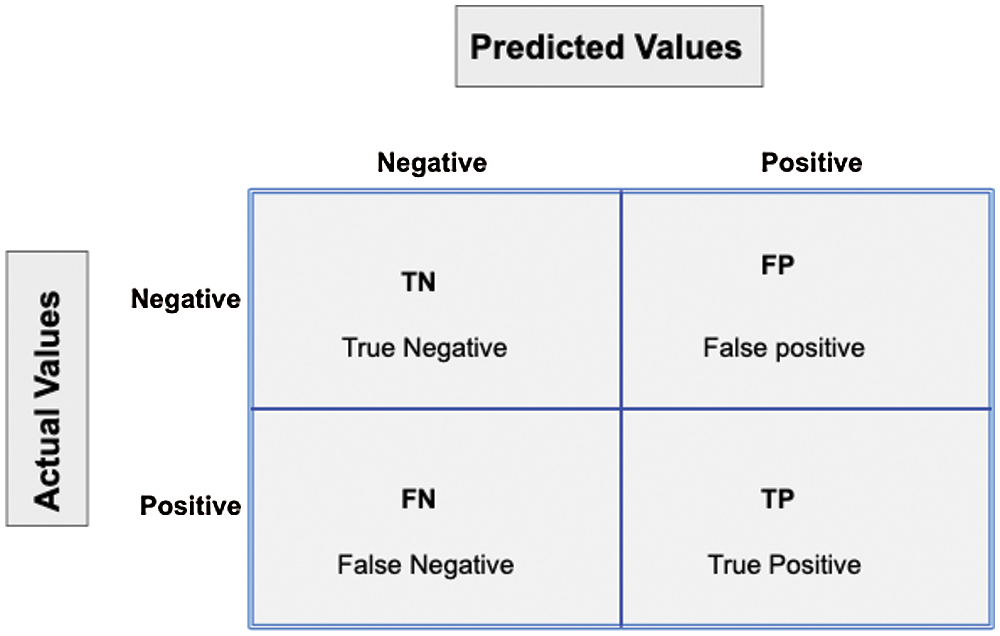
Figure 9: Confusion matrix
Accuracy is a common evaluation metric for classification problems. It is the number of correct predictions made against all predictions made.
In the presence of class imbalance, accuracy can become an unreliable metric to measure the performance. For instance, in case of a 99/1 split between two classes, A and B, the rare event i.e., B becomes the positive class. So, a model can be built with 99% accuracy by just saying that everything belonged to class A. It is clear that model building is not a challenging task if it doesn’t do anything to identify class B; thus, there is a need exists for different metrics that discourages this behavior. For this purpose, precision and recall are used instead of accuracy.
Recall provides the True Positive Rate (TPR), a ratio of true positives to everything positive. In case of 99/1 split between classes A and B, the model that classifies everything as A would have a recall of 0% for positive class, B (precision would be undefined—0/0). Precision and recall provide a better way of evaluating model performance in the face of a class imbalance. This measure correctly identifies whereas a model has little value for use case.
Just like accuracy, both precision and recall are easy to compute and understand, but it requires threshold.
F1 score is the harmonic mean of precision and recall. F1 score reaches its best value at (perfect precision and recall) and worst at 0. The harmonic mean of a list of numbers strongly skews toward the least elements present in the list. So, in comparison with arithmetic mean, it tends to mitigate the impact of large outliers and aggravate the impact of small ones.
F1 score heavily punishes the extreme values. Ideally, an F1 score is an effective evaluation metric in the following classification scenarios:
When FP and FN are equally costly i.e., they miss true positives or find false positives—both the cases impact the model almost the same way, as in cancer detection classification. For example,
Adding more data doesn’t effectively change the outcome effectively.
TN is high (like with flood predictions, cancer predictions, etc.)
Fig. 10 shows the results for confusion matrix under various classification algorithms based on virtual learning environment activity.
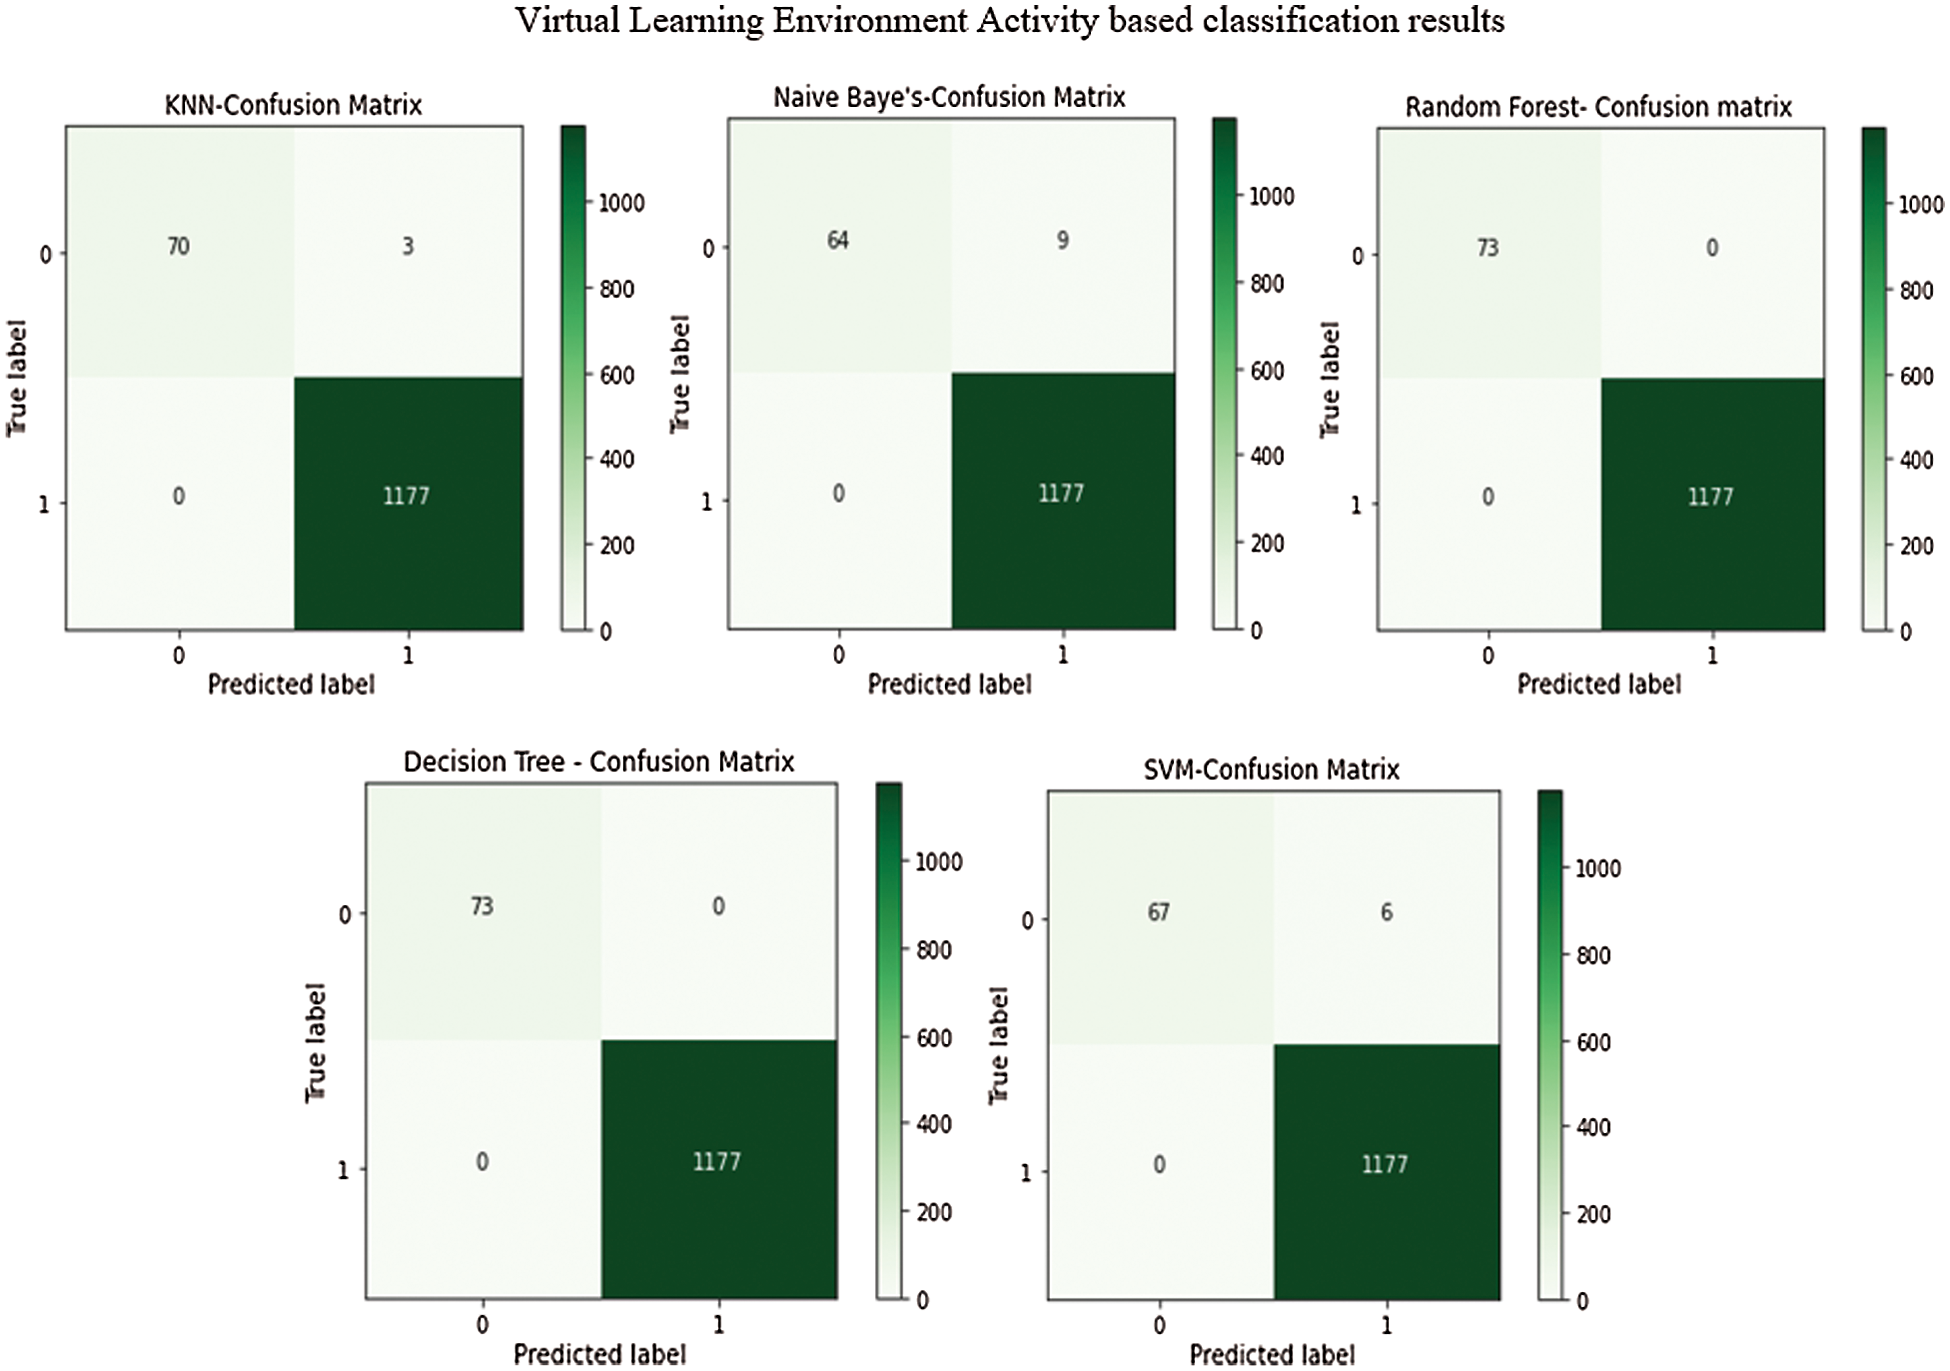
Figure 10: Confusion matrix for classification algorithms
The performance evaluation of various classification algorithms is presented in Tab. 3. The table values showcase that decision tree and random forest models accomplished the maximum performance with the accuracy of 1. At the same time, Naïve Bayes, logistic regression, SVM, and KNN models depicted slightly reduced accuracy values such as 0.9928, 0.9952, 0.9952, and 0.9976 respectively.

The implementation results help in tracking a user’s behavior and analysis results is a clear implication of a learner’s behavior modeling. Adaptive ILMS accommodates a learner’s expectations during the entire life cycle of learning. Flexible and adaptable instructional approach shall be recommended based on the results from learner behavior analysis.
Behavior modeling helps the instruction designers to monitor course progression made by the learners and helps in identifying the level of user. Accordingly, pedagogical strategies can be adopted by the instructor. Hence, both teaching and learning processes can be made flexible by e-learning system. Supervised machine learning algorithms are used in user classification as per their behavior whereas the classification and prediction results are found to be good when using decision tree and random forest algorithms. Learner groups are categorized by the instructor viz high-active, medium-active and low-active. Thereby the instructional and evaluation strategies can be adapted.
Behavior modeling is an important factor that determines instructional and evaluation strategies in e-learning system. ILMS design facilitates adaptable teaching-learning platform to both instructor and the learner. The system tracks different patterns such as learner material access pattern, assignment submission pattern and assessment results-based adaptability options. Other parameters like user navigation pattern-based modeling can also be performed to strengthen the system. The future work can include blended learning approaches in instructional strategies, recommendations for low-engaged learners with ensemble learning algorithm-based modeling and inclusion of evaluation components. Further, the researcher has planned to include more learning behaviors to improve the accuracy of predictions with regards to understanding of learning style dimensions.
Funding Statement: The authors received no specific funding for this study.
Conflicts of Interest: The authors declare that they have no conflicts of interest to report regarding the present study.
1. W. Peng, “Research on online learning behavior analysis model in big data environment,” EURASIA Journal of Mathematics Science and Technology Education, vol. 13, no. 8, pp. 5675–5684, 2017. [Google Scholar]
2. W. M. Al-Rahmi, N. Alias, M. Shahizan Othman, A. Ibrahim Alzahrani, O. Alfarraj et al., “Use of e-learning by university students in Malaysian higher educational institutions: A case in universiti teknologi Malaysia,” IEEE Access, vol. 6, no. 7, pp. 14268–14276, 2018. [Google Scholar]
3. W. Mugahed, A. Rahmi, N. Yahaya, A. Aldraiweesh, M. Alamri et al., “Integrating technology acceptance model with innovation diffusion theory: An empirical investigation on students’ intention to use e-learning systems,” IEEE Access, vol. 7, pp. 26797–26810, 2019. [Google Scholar]
4. C. Baehr, “Incorporating user appropriation, media richness, and collaborative knowledge sharing into blended e-learning training tutorial,” IEEE Transactions on Professional Communication, vol. 55, no. 2, pp. 175–184, 2012. [Google Scholar]
5. H. Zhang, T. Huang, S. Liu, H. Yin, J. Li et al., “A learning style classification approach based on deep belief network for largescale online education,” Journal of Cloud Computing: Advances, Systems and Applications, vol. 9, pp. 1–17, 2020. [Google Scholar]
6. K. Atchariyachanvanich, S. Nalintippayawong and T. Julavanich, “Reverse sql question generation algorithm in the dblearn adaptive e-learning system,” IEEE Access, vol. 7, pp. 54993–55005, 2019. [Google Scholar]
7. C. Santos, G. Boticario and D. Perez-Marin “Extending web-based educational systems with personalized support through user centred designed recommendations along the e-learning life cycle,” Science of Computer Programming, vol. 88, pp. 92–109, 2014. [Google Scholar]
8. A. F. Baharudin, N. A. Sahabudin and A. Kamaludin, “Behavioral tracking in e-learning by using learning styles approach,” Indonesian Journal of Electrical Engineering and Computer Science, vol. 8, no. 1, pp. 17–26, 2017. [Google Scholar]
9. P. Honey and A. Mumford, “The manual of learning styles. maidenhead,” Management Education and Development, vol. 14, no. 2, pp. 147–150, 1983. [Google Scholar]
10. R. Felder and B. Soloman, “Learning styles and strategies,” 2018, [Online]. Available: http://www4.ncsu.edu/unity/lockers/users/f/felder/public/ILSdir/styles.htm. [Google Scholar]
11. M. L. Nistal, M. C. Rodríguez and M. Castro, “Use of e-learning functionalities and standards: The spanish case,” IEEE Transactions on Education, vol. 54, no. 4, pp. 540–549, 2011. [Google Scholar]
12. K. Liang, Y. Zhang, Y. He, Y. Zhou, W. Tan et al., “Online behavior analysis-based student profile for intelligent e-learning,” Journal of Electrical and Computer Engineering, vol. 2017, pp. 1–7, 2017. [Google Scholar]
13. R. R. Estacio and R. C. Raga Jr., “Analyzing students online learning behavior in blended courses using moodle,” Asian Association of Open Universities Journal, vol. 12, no. 1, pp. 52–68, 2017. [Google Scholar]
14. M. W. Lee, S. Y. Chen, K. Chrysostomou and X. Liu, “Mining students’ behavior in web-based learning programs,” Expert Systems with Applications, vol. 36, no. 2, pp. 3459–3464, 2009. [Google Scholar]
15. H. Aldowah, H. Al-Samarraie and S. Ghazal, “How course, contextual, and technological challenges are associated with instructors’ individual challenges to successfully implement e-learning: A developing country perspective,” IEEE Access, vol. 7, pp. 48792–48806, 2019. [Google Scholar]
16. F. Kanwal and M. Rehman, “Factors affecting e-learning adoption in developing countries–empirical evidence from Pakistan’s higher education sector,” IEEE Access, vol. 5, pp. 10968–10978, 2017. [Google Scholar]
17. M. Hussain, W. Zhu, W. Zhang and S. M. R. Abidi, “Student engagement predictions in an e-learning system and their impact on student course assessment scores,” Computational Intelligence and Neuroscience, vol. 2018, pp. 1–21, 2018. [Google Scholar]
18. O. N. Gustun and N. V. Budaragin, “The lifecycle of e-learning course in the adaptive educational environment,” AIP Conf. Proc., Moscow, Russia, vol. 1797, no. 1, pp. 020004, 2017. [Google Scholar]
19. A. Moubayed, M. Injadat, A. B. Nassif, H. Lutfiyya and A. Shami, “E-Learning: Challenges and research opportunities using machine learning & data analytics,” IEEE Access, vol. 6, pp. 39117–39138, 2018. [Google Scholar]
 | This work is licensed under a Creative Commons Attribution 4.0 International License, which permits unrestricted use, distribution, and reproduction in any medium, provided the original work is properly cited. |