DOI:10.32604/csse.2022.019757
| Computer Systems Science & Engineering DOI:10.32604/csse.2022.019757 | |
| Article |
Learning Patterns from COVID-19 Instances
Department of Information Technology, College of Computer, Qassim University, Buraydah, Saudi Arabia
*Corresponding Author: Rehan Ullah Khan. Email: re.khan@qu.edu.sa
Received: 24 April 2021; Accepted: 28 May 2021
Abstract: Coronavirus disease, which resulted from the SARS-CoV-2 virus, has spread worldwide since early 2020 and has been declared a pandemic by the World Health Organization (WHO). Coronavirus disease is also termed COVID-19. It affects the human respiratory system and thus can be traced and tracked from the Chest X-Ray images. Therefore, Chest X-Ray alone may play a vital role in identifying COVID-19 cases. In this paper, we propose a Machine Learning (ML) approach that utilizes the X-Ray images to classify the healthy and affected patients based on the patterns found in these images. The article also explores traditional, and Deep Learning (DL) approaches for COVID-19 patterns from Chest X-Ray images to predict, analyze, and further understand this virus. The experimental evaluation of the proposed approach achieves 97.5% detection performance using the DL model for COVID-19 versus normal cases. In contrast, for COVID-19 versus Pneumonia Virus scenario, we achieve 94.5% accurate detections. Our extensive evaluation in the experimental section guides and helps in the selection of an appropriate model for similar tasks. Thus, the approach can be used for medical usages and is particularly pertinent in detecting COVID-19 positive patients using X-Ray images alone.
Keywords: Coronavirus; COVID-19; machine learning; deep learning; convolutional neural network
The whole world has gone into different levels of lockdown since March 2020 because of the pandemic caused by the coronavirus (namely COVID-19). From a medical perspective, COVID-19 causes breathing issues and may lead to death in 2% of the cases [1]. According to the latest reports, over one hundred million people across two hundred countries are infected with the virus. Up until the 25th of March 2021, over two million deaths caused by this disease were reported. Economically speaking, it caused a crisis in many parts of the world due to travel restrictions and social distancing measures.
Limiting the spreading of this disease has been the priority for the whole world since the beginning of the pandemic. The early detection of the infected patients is helping in the treatment and hence in controlling the spread of the disease. However, this control is negatively affected by the long waiting time between the detection and the diagnostic test results. Moreover, the current COVID-19 diagnostic test is costly, especially for patients who have low health care benefits. Applying Artificial Intelligence (AI) techniques in medical images has shown promising results in diagnosing different diseases [2]. ML can be applied to recognize the patterns through analyzing massive data, which is becoming increasingly available. In this context, COVID-19 dataset availability for researchers is boosting the confidence of the predictive models.
This article proposes an ML approach using X-Ray images to classify the healthy and affected patients based on the patterns found in these images. The article also explores traditional and DL approaches for COVID-19 patterns from chest X-Ray images to predict, analyze, and further understand this virus. The experimental evaluation of the proposed system achieves 97.5% detection performance for normal cases versus the COVID-19 cases. For the Pneumonia virus versus COVID-19 scenario, we achieve 94.5% accurate detections. With this evaluation, we believe that such an experimental setup will facilitate for radiologists the creation of clinical observation-based decisions using ML approaches alone. We also noted that the separating boundary between Pneumonia Bacteria and Pneumonia Virus is complex compared to the COVID-19 versus normal cases and the COVID-19 versus Pneumonia Virus cases. For the Pneumonia Bacteria vs. versus Pneumonia Virus, we get a maximum separating boundary with an accuracy of 75%, which is comparatively lower than for the COVID-19 vs. normal cases and the COVID-19 vs. versus Pneumonia Virus cases. Through visual analysis, we observed that even with the naked eye, it is clear that the disease of Pneumonia Bacteria and Pneumonia Virus has almost similar visual patterns, which means that further inputs are needed to improve the accuracy of the model. Thus, the approaches and evaluation discussed in this article can be used for medical usages to detect COVID-19 positive cases using X-ray images for a fast prediction. Our extensive experimental evaluation helps in the selection of an appropriate model for similar tasks.
The novelty and originality of this article are summarized as follows:
• The proposed approach has a complete structure without manual detection and classification.
• The performance of the COVID-19 detection across normal, Pneumonia Virus, and Pneumonia Bacteria classification is significantly better.
• It compared and evaluated the classical ML approaches and CNN models
• A high-performance diagnosis system is proposed for an automatic detection of COVID-19 patients and for follow-up.
The rest of the paper is organized as follows: Section 2 presents the literature review, Section 3 shows the proposed approach with details on the used algorithms. Section 4 offers the details of the experiments and dataset. Section 5 depicts the results of the experiments. Finally, Section 6 concludes the contribution and the main findings of the paper and provides some future directions.
The most popular technique employed for the detection, recognition, and image-based autonomous diagnosing of COVID-19 is that of the Convolutional Neural Network (CNN). Moreover, a Neural Network (NN) for the biological process of health differentiation is considered when the automatic monitoring of COVID-19 is a priority. The method known as transfer learning has been adopted in several techniques. Through transfer learning, detecting various anomalies in small medical image data sets is a feasible goal, usually achieved with remarkable results [3]. Zhang et al. [4] proposed a DL-based model that can detect COVID-19 with high sensitivity, thereby providing fast and reliable scanning. Computed Tomography (CT) images of COVID-19 and multi-target victims (MODE) were classified using CNN in [5]. Chen et al. [6] put forward residual attention U-Net approach for multiple types of automatic segmentation techniques to lay the foundation for the quantitative diagnosis of lung infections using CT images. Adhikari et al. [7] proposed an Automatic Diagnosis Medical Analysis (ADMA) network, which attempts to find the infected area to help doctors identify the affected parts. Both X-ray and CT images are used in the study. DenseNet recommends removing and marking the affected area of the lungs.
According to Alqudah et al. [8], two methods were proposed to diagnose a chest X-ray of COVID-19 victims. Firstly, AOCTNet, MobileNet, and ShuffleNet CNN are used. Secondly, categorizing them is done using softmax classifier, KNN, Support Vector Machine (SVM), and Random Forest (RF) algorithms [8]. Khan et al. [9] categorized chest X-ray images using Xception design to perceive COVID-19 infection from normal, bacterial, and viral infections. Ghoshal and Tucker [10] utilized Bayesian CNN weighted model projection based on chest X-ray images for the detection of COVID-19. Hemdan et al. [11] used VGG-19 and DenseNet models to diagnose COVID-19 from X-ray images. Ucar and Korkmaz [12] worked on X-ray images to map COVID-19 and used the SqueezeNet model with a Bayesian improvement.
Within the study by Apostopoulos et al. [13], the authors automatically detected X-ray images exploiting CNNs with transfer learning. Sahinbas and Catak [14] used X-rays to diagnose COVID-19 and studied VGG-16, VGG-19, ResNet, DenseNet, and InceptionV3 model. Medhi et al. [15] used X-ray images for feature extraction and segmentation, then classified using CNN. The authors in [16] used five feature extraction methods to classify X-ray images to diagnose COVID-19. They used the Gray-Scale Matrix (GLCM), Native Direction Map (LDP), Gray-scale Run Length Matrix (GLRLM), Gray-scale Size Area Matrix (GLSZM), and Discrete Wave Transmission (DWT). The patterns are then classified by SVM. A cross-validation approach is used by Punn and Agarwal [17] to process the X-ray images using ResNet, InceptionV3, and Inception ResNet models for COVID-19 diagnosis. Afshar et al. developed a Deep Neural Network (DNN). It is primarily based on diagnostic solutions and provides an optimal modeling framework that supports capsule networks, which results in a good detection performance even with a small set of input features.
This research uses the advantages of image analysis approaches to propose an automatic model with clinical capabilities for the early detection of COVID-19 cases. The research aims to evaluate the effectiveness and accuracy of automated diagnosis of COVID-19 based on the X-ray images alone through classical ML models and the deep learning paradigm. The X-ray images analyzed comprise four categories: Normal cases, COVID-19 cases, Virus Pneumonia, and Bacterial cases, as shown in Fig. 1.
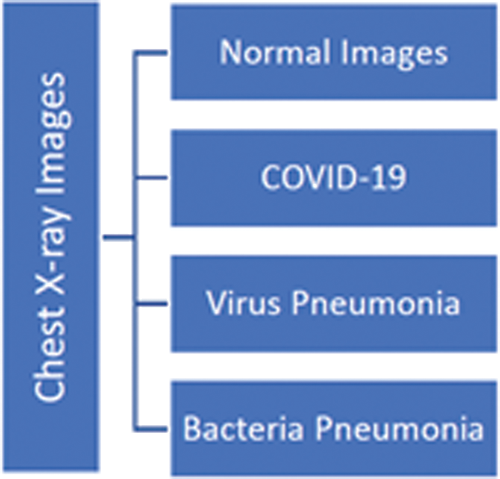
Figure 1: Distribution of the chest x-ray images
Classical ML models are employed to compare the detection capabilities. Through the use of DL models, the research aims to evaluate the effectiveness and accuracy of CNN with the classical ML approaches.
Fig. 2 shows the proposed framework, where the dataset consists of three main classes. These classes are COVID-19, Normal, and Pneumonia classes of X-ray chest images. Pneumonia has two further types. These classes are explained in the experimental evaluation section. The Scaling steps contain noise removal and pre-processing. Various machine learning algorithms are applied to train the model and compare the results. The evaluation is based on 10-folds cross-validation. We select the Random Forest, J48, AdaBoost, K-NN, Support Vector Machine, Logistic Regression, Naïve Bayes, and Bayesian Network from the classical machine learning set. From the DL paradigm, we use the CNN approach.
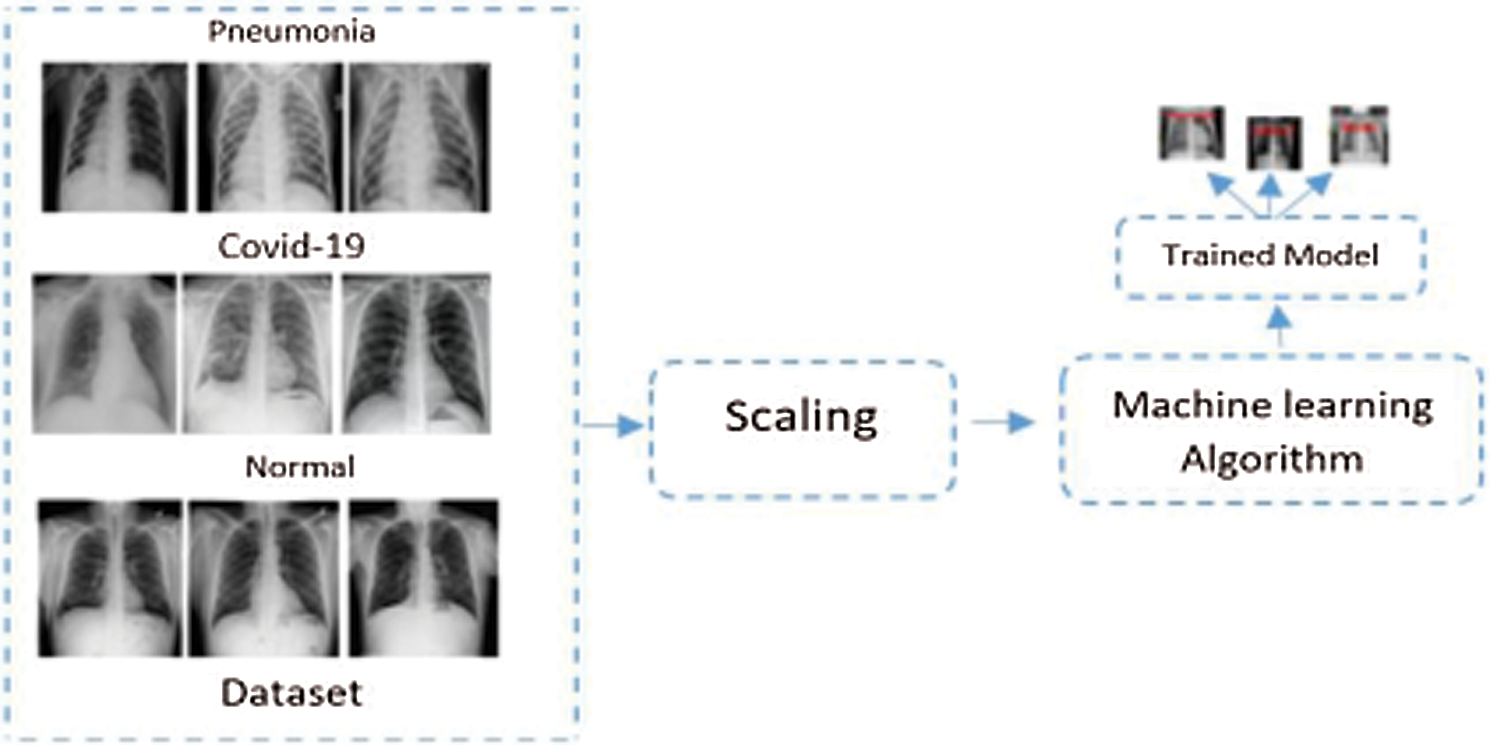
Figure 2: Proposed framework of COVID-19 detection and classification. In our setup, the DL and classical ML need to extract features before building the model. However, the deep learning paradigm extracts features by itself. Classical machine learning, however, needs features to be extracted before applying the classifiers. Therefore, in Fig. 2, we show a generic flow that applies to both the classical and the deep learning approaches
DL is a subset of ML algorithms in which the layers learn independently by finding patterns and structures in data to make future decisions. The data can be images, text, or sound. DL algorithms represent the self-learning process, and thus it depends on the ANN, which is created by taking inspiration from the structure of the human brain [18]. ANN is the replication of the human brain where valuable data is extracted automatically to decide without having explicit programing of all the aspects. In the human brain, around 100 billion neurons are present, and they are all connected through thousands of neighbors. In computers, we reconstruct these neurons artificially and call them ANN. Some of these neurons are for getting input value and some are for having output value, while others are hidden neurons for processing. All these neurons are organized in layers, and these layers are referred to as the input layer, output layer, and usually one or more hidden layers. In DL, data is passed from the different Neural Networks (NN) layers and data representation gets simpler by each layer of NN.
3.2 Convolution Neural Network (CNN)
CNN is one of the most popular deep NN classes and it consists of many layers: an input layer, output layer, and one or more hidden layers. CNN is mainly applied to analyze images and data having correlated patterns. It can optimally detect and classify images and videos and is used in many applications in medical images, recommendation systems, and object detection and recognition [19].
RF is one of the most popular algorithms of ML that belongs to supervised learning. It is used for both classification and regression problems. It is based on ensemble learning, which combines multiple classifiers to improve the performance of the model and thus solves a complex problem. RF combines various decision trees from the subset features of the given dataset. Instead of relying on a single tree, RF makes a prediction of the final output class based on the majority voting of the trees [20].
J48 is one of the ML algorithms that are based on the decision trees and it achieves the best performance when applied to categorical and continuous data [21]. J48 generates decision trees based on a specific set of rules. These trees can be used for classification and are often referred to as statistical classifiers. The J48 trims trees based on predefined rules and standardized data. J48 allows classification using either decision trees or rules generated from them. The accuracy can be increased by using the process of pruning as explained in [22]. J48 is an extended version of ID3 and is an open-source implementation of the C4.5 decision tree algorithm. This algorithm uses a predictive ML model that computes the final value of a new sample based on various features of the available data samples. The internal nodes of a decision tree represent the different attributes; the branches between the nodes represent the possible values that these attributes can have in the observed samples. The terminal nodes represent the detail about the final value of the dependent variable.
Adaboost or Adaptive Boosting is a boosting technique that is used to increase the accuracy of the models [23]. It works by adding weak models sequentially using weighted training data. It basically assigns more weight to the incorrectly classified sample points, and they are essentially classified correctly in the next iteration. Adaboost is mainly used in enhancing the performance of decision trees but can be generally utilized with weak classifiers. This algorithm can be used to improve the overall performance with a combination of other ML algorithms. It is also used to boost the performance of decision trees on classification problems [24].
3.6 K-Nearest Neighbors (K-NN)
The K-Nearest Neighbor (K-NN) model is based on the similarity of features. It can be used to solve classification and regression problems. K-NN performs calculations on runtime and makes predictions based on the similarity between the training instance and the input sample. The model depends on the value of k, i.e., the distance or neighborhood in which the samples are classified. In many research studies [25,26], it is noted that the K-NN algorithm achieves outstanding results by using various datasets in the experiments. The best choice of k depends on the data, but typically larger values of k provide stable outcomes, yet it may not provide an optimal separating boundary between different classes. The correct value of k can be selected by using a cross-validation technique. The best way to solve the nearest neighbor problem with K-NN is by choosing the k value using the elbow approach. In pattern recognition, K-NN has a significant role and is used to solve many supervised learning problems.
3.7 Support Vector Machine (SVM)
SVM is a supervised model for classification as well as regression problems [27,28]. Given training data, the SVM algorithm constructs a model that assigns new items to the corresponding class. SVM finds a hyper-line that separates the data into different classes. In this way, the line is called linearly separable. The line should be optimal when it’s placed as far as possible from the data points. This data should not impact the objectivity of the classification scheme. The optimal line is guaranteed to have more discrimination against noises. In this way, SVM seeks the straight line (or the hyperplane) with the optimal value to the training samples.
Logistic Regression is an algorithm that is used for both the classification and the regression tasks [29]. The algorithm generates an output based on the set of input variables. The underlying assumption it follows is that the input features are independent of one another. Secondly, a sizeable quantity of data is required for the model to converge. The algorithm works on the principle of regression analysis, where it works as a predictive model, predicting an output variable based on one or more independent variables.
Naïve Bayes is a supervised ML algorithm that utilizes the Bayesian rule to assume that the attributes are conditionally independent. While this assumption of independence is often violated in practice, Naïve Bayes nonetheless usually delivers good classification accuracy. Coupled with its computational efficiency and other desirable features, Naïve Bayes is widely used in text classification problems. Other uses of Naive Bayes classifiers include spam filtering, contextual text analysis, machine vision, and medical diagnosis [30].
The Bayesian Networks or Belief Networks are a type of graphical ML model used to represent a set of random variables and their conditional probabilities [31]. The random variables are represented by the nodes, while the edges represent the dependence or the relationship between the variables. Bayesian Networks correspond to a Directed Acyclic Graph (DAG). Bayesian Networks work under the underlying assumption of feature independence and node independence from all the nodes among their predecessors except for the parental nodes [32].
In this section, we present the dataset and the experimental evaluation of the proposed COVID-19 detection framework. Various ML algorithms are evaluated, and the results are compared. The evaluation is based on 10-folds cross-validation. From the classical ML set, we select the Random Forest, J48, AdaBoost, K-NN, Support Vector Machine, Logistic Regression, Naïve Bayes, and the Bayesian Network. From the DL paradigm, we use the CNN model. In the following section, the dataset is elaborated.
A total of 1000 X-ray images are collected from GitHub and shared by Cohen et al. [33]. There are four classes of images. Among the available images, 250 COVID-19 and 250 normal images are selected. The dataset also includes 250 Pneumonia Viruses and 250 Pneumonia Bacteria for a total of 1000 images. The dataset is balanced due to the fact that each class has 250 images. Fig. 3 shows a sample of the normal and healthy chest X-ray images, while Fig. 4 shows the images of the COVID-19 affected patients.
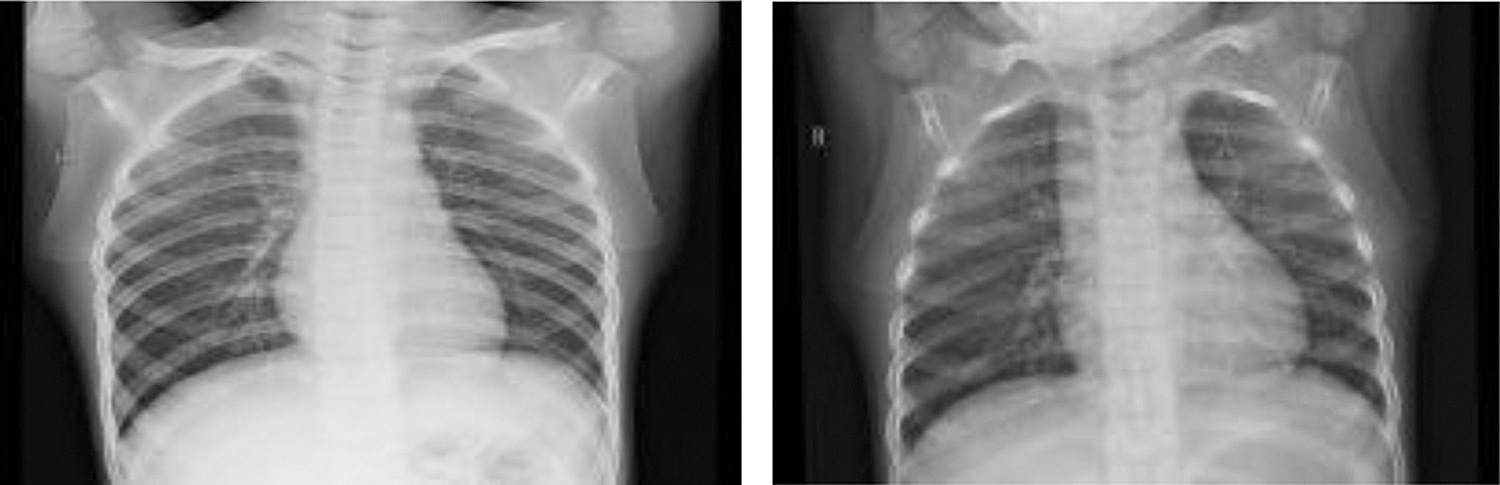
Figure 3: Chest images of normal and healthy people
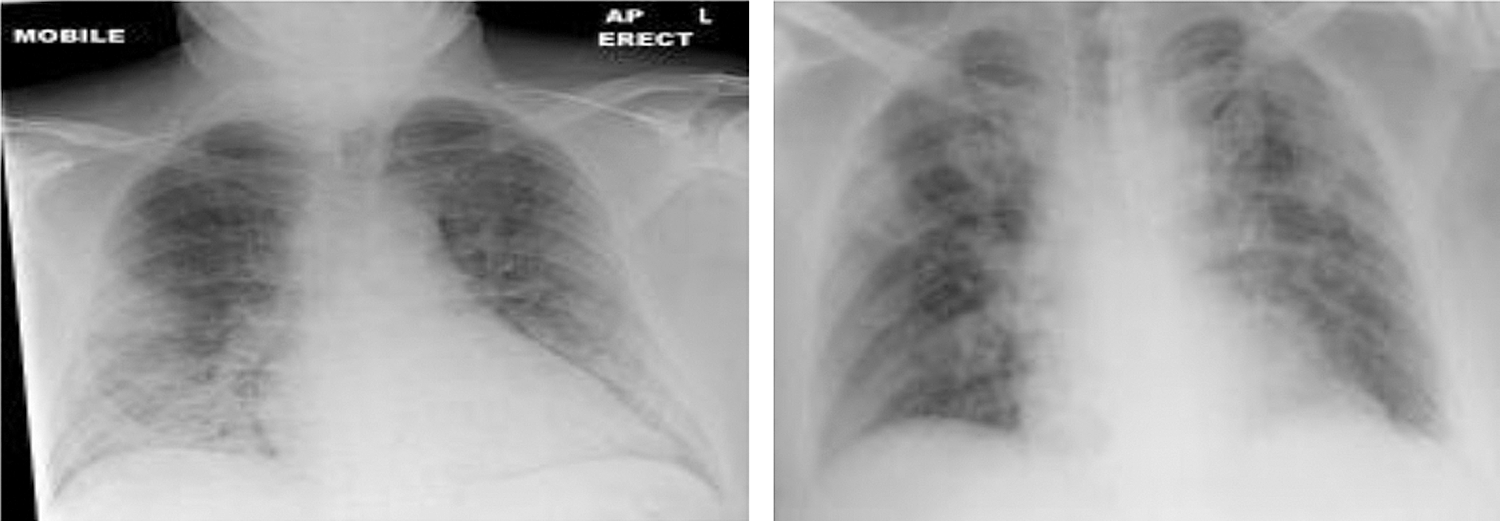
Figure 4: Chest X-ray of COVID-19 affected people
5 Results and Performance Evaluation
The evaluation uses the 10-folds cross-validation setup. We evaluate the Random Forest, J48, AdaBoost, K-NN, Support Vector Machine, Logistic Regression, Naïve Bayes, and Bayesian Network from the classical machine learning set. From the DL paradigm, we use the CNN model.
F-measure is used as the evaluation parameter. For all the classical approaches (Random Forest, J48, AdaBoost, K-NN, Support Vector Machine, Logistic Regression, Naïve Bayes, and Bayesian Network) and for DL, a 10-folds cross-validation approach is used. In 10-folds cross-validation, the data is divided into ten subsets, out of which nine subsets are consecrated for training, and one set is used for testing. A model is built on the nine subsets and then tested on a single test set. The process is repeated ten times to consider all the possible combinations of training and testing instances. The performance of the ten folds is then averaged for the final F-measure.
For the classical approaches (Random Forest, J48, AdaBoost, K-NN, Support Vector Machine, Logistic Regression, Naïve Bayes, and Bayesian Network), we extract features using the Auto Color Correlogram approach. The Auto Color Correlogram features take color and intensity into account and consider the pixel spatial relationship in an image. We select Auto Color Correlogram features because they have shown good performance in the initial evaluation compared to other features.
In the following section, we present the results of the evaluation on three scenarios: The COVID-19 versus Normal cases, the COVID-19 versus Pneumonia cases, and the Pneumonia Virus versus Pneumonia Bacteria.
5.1 Covid-19 Versus Normal Cases
The first set of experiments involves the evaluation of 250 COVID-19 infected cases and 250 normal cases. Accordingly, Fig. 5 shows the accuracy of the experimental evaluation of the 500 images. 90% of the 500 images are used for training in one step, and 10% are used for testing. For each classifier, the performance is noted, and the process is repeated ten times. The average of the ten executions for each classifier is shown in Fig. 5 and Tab. 1.
Fig. 5 presents an interesting evaluation of the DL classifier and the other eight classical classifiers. The bar chart in Fig. 5 displays the variations in the performances of the classifiers. Overall, the performance ranges between 94% accurate models for the SVM classifier and 97.5% as the best performance for the DL classifier. As shown in Fig. 5, the DL classifier has dominated the performance of the other classifiers. This domination is expected due to the advanced algorithm behavior in DL classifiers over the classical classifiers of ML. Among the classical classifiers, the Random Forest classifier achieves the best performance with an accuracy of 97%, followed by the J48, Adaboost J48, Logistic Regression, with accuracies of 96.8%, 96.5%, and 96.2%, respectively. However, the other classifiers have moderate performance results.
From Fig. 5, it is clear that the classifiers have very close accuracy rates, which prompts us to consider other factors that might help us decide which is the best choice between these classifiers, especially in the DL classifier, where more processing resources are utilized compared to classical ML classifiers. The slight increase in the performance of the DL classifier makes the Random Forest classifier a perfect choice, given that it uses considerably fewer processing resources compared to the deep learning classifier.
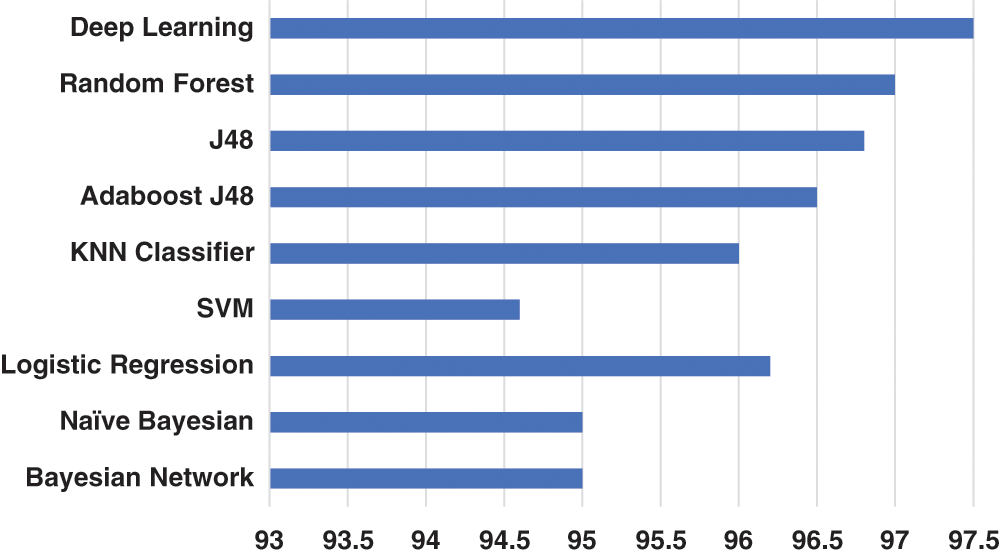
Figure 5: Cross validated accuracy of COVID-19 versus Normal instances

5.2 Covid-19 Versus Pneumonia Virus
Fig. 6 shows the cross-validated accuracy of COVID-19 versus Pneumonia Virus. This set of experiments has followed a similar scenario involving the evaluation of COVID-19 infected cases versus the Pneumonia infected cases. Two hundred fifty images of COVID-19 infected cases and 250 images of the Pneumonia infected instances are used in this experimental evaluation. 90% of the 500 images are used for training in one step, and 10% are used for testing. Similar to the first set of the experiments, the average performance of ten repeated classification processes is taken for all the classifiers. Fig. 6 shows an interesting overall flow of the performance in terms of accuracy. The DL classifier also has the best performance over the eight classical classifiers, with a slight accuracy improvement of 94.5%. The best performance among the classical classifiers is recorded for the Random Forest classifier with an accuracy of 94%. The Adaboost J48 classifier is second with an accuracy of 93.8%. The other classical classifiers have moderate performances ranging between 88.8% and 93.3%. The lowest accuracy is recorded for the Naïve Bayesian classifier, as shown in Fig. 6 and further illustrated in Tab. 2.
For the comparison between the DL and the Random Forest performances, it is noticed that only a slight improvement has been made by the DL classifier, which again raised the same question already noted in the first set of experiments. Therefore, a tradeoff between the improvement made by the DL classifier and the extra processing resources used is crucial. Decision-makers should have a valid justification to the use of additional processing resources and whether they are worth the cost? We believe that DL might be suitable for large datasets, but it provides a minimal advantage compared to the classical approaches for small datasets. We also note that the separating boundary between COVID-19 and Pneumonia Virus is complex compared to the COVID-19 versus normal cases. This is clear from the highly accurate model of 97.5% for normal versus COVID-19 cases. For the COVID-19 versus Pneumonia Virus, we get a maximum separating boundary with an accuracy of 94.5%, which is slightly lower than in the first scenario.

Figure 6: Cross validated accuracy of COVID-19 versus Pneumonia Virus with Auto Color Correlogram Features

5.3 Pneumonia Bacteria/Pneumonia Virus
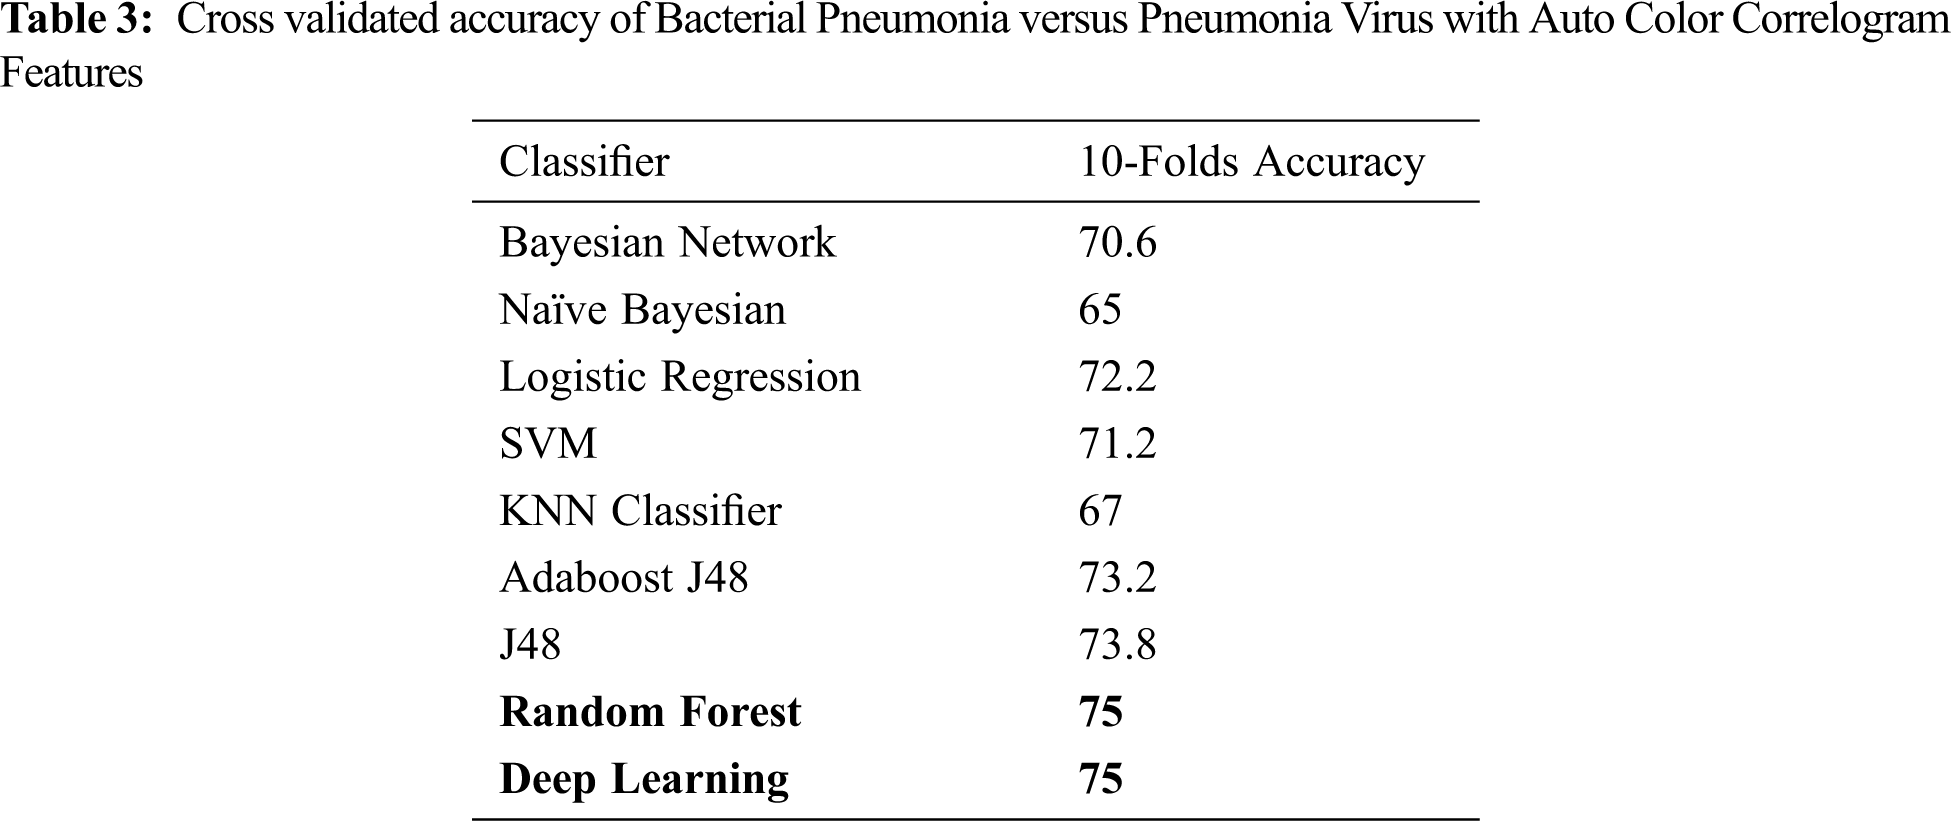
The evaluation of the Pneumonia Bacteria infected cases versus the Pneumonia Virus cases is performed in the third set of experiments. It also follows a similar pattern as that of the first and the second set of experiments, as shown in Fig. 7. The dataset used for these experiments consists of 250 images of Pneumonia Bacteria infected cases and 250 images of the Pneumonia Virus cases. Like the previous experiments, 90% of the 500 images are used for training in one step, and 10% are used for testing. The average performance of ten repeated classification processes is taken for each of the nine classifiers. Fig. 7 and Tab. 3 present the average performance of each classifier. The same set of classifiers is used in all sets of experiments. Unlike the previous experiments, the DL classifier does not perform better than the classical ML Random Forest classifier. Both classifiers have the same performance of 75%. Using a DL classifier will thus lead to using unnecessarily large processing resources. In this case, the DL does not represent the best solution for the decision-makers. It may not always be the case, as such a situation is subject to different factors where the dataset is one of them. As noticed in the earlier experiments, the DL classifier demonstrated better performance.
Another crucial point is that the best performance accuracy among all the used classifiers is 75%. It means that there is still an opportunity to improve the accuracy of the classifiers by considering other inputs. Different classical classifiers have moderate performance values ranging between 65% for the Naïve Bayesian classifier and 74% for the J48 classifier. This is the second time that the Naïve Bayesian classifier has the worst performance among the classical classifiers. It is an interesting point that needs to be investigated in further experiments.
We also note that the separating boundary between Pneumonia Bacteria and Pneumonia Virus is complex compared to the COVID-19 versus normal cases and the COVID-19 versus Pneumonia Virus. It is clear from the highly accurate model of 97.5% for normal versus COVID-19 cases. For the Pneumonia Bacteria versus Pneumonia Virus, we get a maximum separating boundary with an accuracy of 75%, which is comparatively lower than that for the COVID-19 versus normal cases and the COVID-19 versus Pneumonia Virus cases. Through visual analysis, we observed that even with the naked eye, it is apparent that the diseases of Pneumonia Bacteria and Pneumonia Virus have almost similar graphic patterns, which means that further inputs are needed to improve the accuracy of the classifier.

Figure 7: Cross validated accuracy of Bacterial Pneumonia versus Pneumonia Virus
The fast and early prediction of COVID-19 infected cases is necessary to prevent the spread of the disease through a population. This study proposed a DL-based approach to detect the COVID-19 positive patients from Chest X-ray images obtained from normal and Pneumonia patients to predict COVID-19 patients automatically. The proposed model has achieved a maximum accuracy of 97.5% for COVID-19 versus Normal cases. We believe that the extensive experimental evaluation performed in this article will facilitate for radiologists the creation of decisions in clinical observations using ML approaches alone. We also noted that the separating boundary between Pneumonia Bacteria and Pneumonia Virus is complex compared to the COVID-19 versus normal cases and the COVID-19 versus the Pneumonia Virus cases. For the Pneumonia Bacteria versus Pneumonia Virus, we get a maximum separating boundary with an accuracy of 75%. It is comparatively lower than that for the COVID-19 versus normal cases and the COVID-19 versus Pneumonia Virus cases. Through visual analysis, we observed that even with the naked eye, we could see that the disease of Pneumonia Bacteria and Pneumonia Virus have almost similar visual patterns, which means that further inputs are needed to improve the accuracy of the classifier. In subsequent studies, the classification performance of various CNN models can be applied while increasing the number of COVID-19 X-ray images. It may help improve performance in all combinations and learn an accurate boundary in Pneumonia Bacteria and Pneumonia Virus scenarios.
Funding Statement: The authors gratefully acknowledge Qassim University, represented by the Deanship of Scientific Research, on the financial support of this research under the number (coc–2020-1-1-L-9988) during the academic year 1441 AH/2020 AD.
Conflicts of Interest: The authors declare that they have no conflicts of interest to report regarding the present study.
1. Z. Xu, L. Shi, Y. Wang, J. Zhang, L. Huang et al., “Pathological findings of COVID-19 associated with acute respiratory distress syndrome,” Lancet Respiratory Medicine, vol. 8, no. 4, pp. 420–422, 2020. [Google Scholar]
2. D. D. Miller and E. W. Brown, “Artificial intelligence in medical practice: the question to the answer?,” American Journal of Medicine, vol. 131, no. 2, pp. 129–133, 2018. [Google Scholar]
3. I. D. Apostolopoulos and T. A. Mpesiana, “COVID-19: automatic detection from x-ray images utilizing transfer learning with convolutional neural networks,” Physical and Engineering Sciences in Medicine, vol. 43, pp. 635–640, 2020. [Google Scholar]
4. J. Zhang, Y. Xie, Y. Li, C. Shen and Y. Xia, “COVID-19 screening on chest x-ray images using deep learning based anomaly detection,” arXiv preprint, arXiv:2003.12338v1, 2020. [Google Scholar]
5. D. Singh, V. Kumar, Vaisali and M. Kaur, “Classification of COVID-19 patients from chest CT images using multi-objective differential evolution-based convolutional neural networks,” European Journal of Clinical Microbiology & Infectious Diseases, vol. 39, pp. 1379–1389, 2020. [Google Scholar]
6. X. Chen, L. Yao and Y. Zhang, “Residual attention U-Net for automated multi-class segmentation of COVID-19 chest CT images,” arXiv preprint, arXiv:2004.05645v1, 2020. [Google Scholar]
7. N. C. D. Adhikari, “Infection severity detection of COVID-19 from x-rays and CT scans using Artificial Intelligence,” International Journal of Computer, vol. 38, no. 1, pp. 73–92, 2020. [Google Scholar]
8. A. M. Alqudah, S. Qazan and A. Alqudah, “Automated systems for detection of COVID-19 using chest x-ray images and lightweight convolutional neural networks,” Research Square preprint, 2020. [Google Scholar]
9. A. I. Khan, J. L. Shah and M. M. Bhat, “Coronet: A deep neural network for detection and diagnosis of COVID-19 from chest x-ray images,” Computer Methods and Programs in Biomedicine, vol. 196, pp. 105581, 2020. [Google Scholar]
10. B. Ghoshal and A. Tucker, “Estimating uncertainty and interpretability in deep learning for coronavirus (COVID-19) detection,” arXiv preprint, arXiv:2003.10769v1, 2020. [Google Scholar]
11. E. E.-D. Hemdan, M. A. Shouman and M. E. Karar, “COVIDX-Net: A framework of deep learning classifiers to diagnose COVID-19 in x-ray images,” arXiv preprint, arXiv:2003.11055, 2020. [Google Scholar]
12. F. Ucar and D. Korkmaz, “COVIDiagnosis-Net: Deep Bayes-SqueezeNet based diagnosis of the coronavirus disease 2019 (COVID-19) from x-ray images,” Medical Hypotheses, vol. 140, pp. 109761, 2020. [Google Scholar]
13. I. D. Apostolopoulos, S. I. Aznaouridis and M. A. Tzani, “Extracting possibly representative COVID-19 biomarkers from x-ray images with deep learning approach and image data related to pulmonary diseases,” Journal of Medical and Biological Engineering, vol. 40, pp. 462–469, 2020. [Google Scholar]
14. K. Sahinbas and F. O. Catak, “Transfer learning based convolutional neural network for COVID-19 detection with x-ray images,” Elsevier Data Science for COVID-19, pp. 451–466, 2021. [Google Scholar]
15. K. Mehdi, M. Jamil and M. I. Hussain, “Automatic detection of COVID-19 infection from chest x-ray using deep learning,” medRxiv preprint, pp. 1–6, 2020. [Google Scholar]
16. M. Barstugan, U. Ozkaya and S. Ozturk, “Coronavirus (COVID-19) classification using CT images by machine learning methods,” arXiv preprint, arXiv:2003.09424, pp. 1–10, 2020. [Google Scholar]
17. N. S. Punn and S. Agarwal, “Automated diagnosis of COVID-19 with limited posteroanterior chest X-ray images using fine-tuned deep neural networks,” Applied Intelligence, vol. 51, pp. 2689–2702, 2021. [Google Scholar]
18. B. Karlik and A. V. Olgac, “Performance analysis of various activation functions in generalized MLP architectures of neural networks,” International Journal of Artificial Intelligence and Expert Systems, vol. 1, no. 4, pp. 111–122, 2010. [Google Scholar]
19. Q. Q. Tao, S. Zhan, X. H. Li and T. Kurihara, “Robust face detection using local CNN and SVM based on kernel combination,” Neurocomputing, vol. 211, pp. 98–105, 2016. [Google Scholar]
20. R. Chopra and S. S. Roy, “End-to-End reinforcement learning for self-driving car,” in Proc. Advanced Computing and Intelligent Engineering, Advances in Intelligent Systems and Computing, Singapore: Springer, vol. 1082, pp. 53–61, 2020. [Google Scholar]
21. S. S. Raj and M. Nandhini, “Ensemble human movement sequence prediction model with Apriori based Probability Tree Classifier (APTC) and bagged J48 on machine learning,” Journal of King Saud University-Computer and Information Sciences, vol. 32, no. 10, pp. 1210–1211, 2018. [Google Scholar]
22. E. V. Venkatesan and T. Velmurugan, “Performance analysis of decision tree algorithms for breast cancer classification,” Indian Journal of Science and Technology, vol. 8, no. 29, pp. 1–8, 2015. [Google Scholar]
23. P. Wu and H. Zhao, “Some analysis and research of the AdaBoost algorithm,” in Intelligent Computing and Information Science, Int. Conf., ICICIS. Proc., Berlin, Heidelberg: Springer, pp. 1–5, 2011. [Google Scholar]
24. O. Messai, F. Hachouf and Z. A. Seghir, “AdaBoost neural network and cyclopean view for no-reference stereoscopic image quality assessment,” Signal Processing: Image Communication, vol. 82, pp. 115772, 2020. [Google Scholar]
25. D. Xu, Y. Wang, P. Peng, S. Beilun, Z. Deng et al., “Real-time road traffic state prediction based on kernel-KNN,” Transportmetrica A: Transport Science, vol. 16, no. 1, pp. 104–118, 2020. [Google Scholar]
26. W. Shi, J. Du, X. Cao, Y. Yu, Y. Cao et al., “IKULDAS: An improved kNN-based UHF RFID indoor localization algorithm for directional radiation scenario,” Sensors, vol. 19, no. 4, pp. 968, 2019. [Google Scholar]
27. Y. P. Laptin, A. P. Likhovid and A. P. Vinogradov, “Approaches to construction of linear classifiers in the case of many classes,” Pattern Recognition and Image Analysis, vol. 20, no. 2, pp. 137–145, 2010. [Google Scholar]
28. Y. I. Zhuravlev, Y. Laptin and A. Vinogradov, “Minimization of empirical risk in linear classifier problem,” in New Trends in Classification and Data Mining, Sofia, Bulgaria: ITHEA, pp. 9–16, 2010. [Google Scholar]
29. E. P. Mwanga, E. G. Minja, E. Mrimi, M. G. Jiménez, J. K. Swai et al., “Detection of malaria parasites in dried human blood spots using mid-infrared spectroscopy and logistic regression analysis,” Malaria Journal, vol. 18, pp. 341, 2019. [Google Scholar]
30. S. Raschka, “Naïve Bayes and text classification I-Introduction and theory,” arXiv preprint, arXiv:1410.5329, 2014. [Google Scholar]
31. A. Rovinelli, M. D. Sangid, H. Proudhon, Y. Guilhem, R. A. Lebensohn et al., “Predicting the 3D fatigue crack growth rate of small cracks using multimodal data via Bayesian networks: In-situ experiments and crystal plasticity simulations,” Journal of the Mechanics and Physics of Solids, vol. 115, pp. 208–229, 2018. [Google Scholar]
32. K. Iqbal, X. C. Yin, H. W. Hao, Q. M. Ilyas and H. Ali, “An overview of Bayesian network applications in uncertain domains,” International Journal of Computer Theory and Engineering, vol. 7, no. 6, pp. 416–427, 2015. [Google Scholar]
33. J. P. Cohen, P. Morrison and L. Dao, “COVID-19 image data collection,” arXiv preprint, arXiv:2003.11597, pp. 1–4, 2020. [Google Scholar]
 | This work is licensed under a Creative Commons Attribution 4.0 International License, which permits unrestricted use, distribution, and reproduction in any medium, provided the original work is properly cited. |