DOI:10.32604/csse.2022.019633
| Computer Systems Science & Engineering DOI:10.32604/csse.2022.019633 | |
| Article |
Computerized Detection of Limbal Stem Cell Deficiency from Digital Cornea Images
Department of Computer Sciences, College of Computer and Information Sciences, Princess Nourah Bint Abdulrahman University, Riyadh, 11047, KSA
*Corresponding Author: Hanan A. Hosni Mahmoud. Email: hahosni@pnu.edu.sa
Received: 20 April 2021; Accepted: 29 May 2021
Abstract: Limbal Stem Cell Deficiency (LSCD) is an eye disease that can cause corneal opacity and vascularization. In its advanced stage it can lead to a degree of visual impairment. It involves the changing in the semispherical shape of the cornea to a drooping shape to downwards direction. LSCD is hard to be diagnosed at early stages. The color and texture of the cornea surface can provide significant information about the cornea affected by LSCD. Parameters such as shape and texture are very crucial to differentiate normal from LSCD cornea. Although several medical approaches exist, most of them requires complicated procedure and medical devices. Therefore, in this paper, we pursued the development of a LSCD detection technique (LDT) utilizing image processing methods. Early diagnosis of LSCD is very crucial for physicians to arrange for effective treatment. In the proposed technique, we developed a method for LSCD detection utilizing frontal eye images. A dataset of 280 eye images of frontal and lateral LSCD and normal patients were used in this research. First, the cornea region of both frontal and lateral images is segmented, and the geometric features are extracted through the automated active contour model and the spline curve. While the texture features are extracted using the feature selection algorithm. The experimental results exhibited that the combined features of the geometric and texture will exhibit accuracy of 95.95%, sensitivity of 97.91% and specificity of 94.05% with the random forest classifier of n = 40. As a result, this research developed a Limbal stem cell deficiency detection system utilizing features’ fusion using image processing techniques for frontal and lateral digital images of the eyes.
Keywords: Feature extraction; corneal opacity; geometric features; computerized detection; image processing
The corneal epithelium surface is always getting repopulated by limbal stem cells. If a deficiency in these stem cells occur, visual impairment can happen. This deficiency is called Limbal Stem Cell Deficiency (LSCD) [1]. Limbal stem cell deficiency is a medical condition that are caused by an inadequate quantity of Limbal stem cells. LSCD diagnosis relies on medical methods that can identify the stages of LSCD. Diagnosis methods such as ocular imaging and molecular diagnostic techniques [2]. Changes from normal, mild to moderate to severe in pathological LSCD is depicted in Fig. 1. As it can be seen, if the condition is diagnosed in the mild case, it would be a great path to treatment.

Figure 1: Changes from normal to mild to moderate to severe LSCD
LSCD can be caused by various and multi factors such as environmental, genetic and as by-product of medical condition (such as chemotherapy medications) factors [3].
LSCD is usually diagnosed by clinical manifestations. Signs of LSCD can be speckling fluorescein staining, opacity of the epithelial layers. Signs of persistent fluorescein is also found. The most apparent one that can be detected visually is the neovascularization of the cornea [4,5]. LSCD is reversible if diagnosed in a timely manner, therefore timely diagnosis is very crucial [6,7].
Corneal topography is one of the classical most sensitive technique for the early diagnosis of LSCD. Le et al. [6] presented the recently developed ocular imaging techniques as diagnostic techniques which leads to establishment of LSCD quantitative criteria for its different stages. Scheimpflug image techniques are also used in the diagnosis of LSCD [5]. The problem with these classical techniques is that they are costly and requires high maintenance costs. These machines require highly trained optometrists and also require specific clinical settings.
In this paper, we are proposing a method for diagnosing LSCD using image processing and machine learning techniques. Therefore, in this research we will explore the development of automated devices that utilize image processing technology with automated analysis and processing of digital image. Automated diagnosis can be held with the aid of machine learning. We are presenting a smart mobile application to aid in the diagnoses of LSCD ocular disease. In this paper we are proposing an image processing-based method by investigating the visual features of the eye with LSCD. These features are extracted from frontal segment eye images. Medical experts can conclude all important information from the geometrical features of the frontal eye segment image of LSCD-infected eyes. In this paper, we are concerned with geometric and color feature extraction to devise an automated system for LSCD diagnosis. Such features are categorized according to their significance to differentiate between LSCD and normal eyes, especially in early stages.
The rest of the paper is divided as follows. In Section 2, we are presenting a literature review of the recent methods for eye disease diagnosis through machine learning. In Section 3, we present the proposed feature extraction algorithm. In Section 4, the feature extraction algorithm and the ranked features are tested to classify the images into LSCD or normal groups. The experiments setting and the simulation results are depicted in Section 5. In Section 6, the conclusions are presented.
2 Limbal Stem Cell Deficiency Detection (LSCD) Methodologies
LSCD diagnosis is usually performed in a medical setting through diagnostic tools such as corneal topography medical devices [8]. These studies were conducted utilizing images from corneal topography imaging tools, which in turn are processed utilizing the topographic map through deep learning and image processing [9,10].
Fabijańska et al. [11] presented a new technique for automated corneal segmentation of endothelium images. The proposed technique utilizes a neural network with post-processing of the boundary map. Morphological reconstruction of the cornea can aid in the diagnosis of many corneal surface diseases using image processing. Nurzynska et al. [12], utilized image processing for analyzing the endothelial layer of the cornea by exploiting shape features utilizing spatial and topological properties. Their technique discovered and excluded high correlation features. They detailed their experiments and named few groups of shape and texture parameters to automatically classify LSCD and other corneal diseases, but one representative can always be selected. Daniel et al. [13] utilized the measurement of corneal endothelial density as an important metric in corneal diseases automated diagnosis. The medical measuring is usually done manually, which is a lengthy process that can lead to errors. They utilized U-Net image segmentation CNN medical image segmentation to differentiate between healthy and sick corneas. They measure their technique performance in CEC images with different corneal diseases. Sierra [14] performed cell segmentation from specular images of both healthy and LSCD corneas. Cell segmentation is processed through supervised segmentation of digital images. Fabijańska [15] utilized health status information of the endothelium extracted from the shape of the endothelial cornea cells in digital imagery. They utilized U-Net CNN for image skeletonized segmentation. While, Liang et al. [16] utilized central and limbal epithelium thickness of the cornea from digital AS-OCT images of both normal and LSCD affected eyes. Binotti et al. [17] investigated biomarkers of corneal diseases to obtain an automated diagnosis for LSCD and neurotrophic keratitis.
Twa et al. [18] classified topographical map images from Pentacam using ANNs, SVMs and decision trees to determine whether an eye was normal or exhibited LSCD. Islam et al. [19] implemented an SVM classifier for identifying LSCD in eyes using a combination of topographical map images from corneal topography and data from a Scheimpflug camera.
Smartphones were used to produce an eye image and utilize image processing techniques to capture many corneal abnormalities. Jiao et al. [20] captured frontal eye images using a smartphone. They had a success of 93% accuracy of identifying keratosis in 6 cases out of 20 cases, the other thirteen were normal with one patient with mild abnormality diagnosis as false negative. The method started by a preprocessing step where the cornea is cropped from the eye image, and then the corneal curve is detected utilizing edge detection method. The preprocessing step was followed by a classification step by computing the corneal curvature slope.
In our research, we conducted a successful methodology to diagnose LSCD through digital images from a smartphone camera. We compare our findings to those methods using topographic map imaging. Our research utilized color and texture extraction from the digital images to identify LSCD eyes from normal eyes. Our results were validated by comparing them to images for the same cases using corneal topography and have manual diagnosis by medical experts.
3 The Proposed Limbal Stem Cell Deficiency (LSCD) Detection Algorithm
In this section, we will describe the methodology used and the dataset. The proposed algorithm comprises of three major steps. The first step is the preprocessing of the acquired images of the frontal and lateral views for cases with different stages of LSCD including cornea segmentation, the second step is the processing of the digital images to obtain features relevant to the disease (learning process). The third step is the classification of new cases according to the output of the learning process, as shown in Fig. 2.
The development of the database is attained from images in the dataset in Bengio [21] (used by permission), total of 228 images, 34 out of them are normal cases. All the images are frontal and lateral view images of the eye. 20 of them are certified patients with severe cases of LSCD. Another 50 of the frontal and lateral images pair are of infected eyes with medium infection. The rest of 120 patients are mild infected eyes with LSCD. All the acquired images (both LSCD infected and healthy eyes) were of cases that were examined by ophthalmologists. All the eye images were captured from the frontal and lateral eye views using digital camera.
The dataset contains images of resolution 2048 × 1836 for each eye. The 228 images were 102 from female populations and 126 of male populations. The age range is from 22 to 45 years old.

Figure 2: Block diagram of proposed automated diagnosis system of LSCD
The proposed algorithm comprises of three phases involving the frontal images of the eye. The preprocessing of the images followed by segmentation and ends with feature extraction.
Preprocessing has an important task to improve images quality. The block diagram of the preprocessing algorithm is presented in Fig. 3. It encompasses three steps: the first step is to convert RGB images to normalized RGB images [22]. RGB encoding of colors is usually used as part of human perception. It utilizes chrominance components of reduced bandwidth. The normalized RGB masks errors and compression artifacts in a more efficient way than RGB encoding direct scheme [23–27]. The second step is the edge enhancement step because it is very crucial for image enhancement for the purpose of medical image analysis and recognition. Imaging usage in medical fields is getting high attention in automated diagnosis. Edge enhancement is employed to enhance unclear borders in noisy images [27]. We are presenting edge enhancement through image enhancement methods. The third step is image smoothing, requesting robust image filtering techniques to smooth medical images while preserving salient feature [28]. These steps are important for the preparation of the RGB images of eyes with LSCD for image segmentation. Eye lashes and part of skin should be taken out from the image and only keep the edges of the cornea for color and texture features extraction while keeping the contour of the Iris for geometric features.

Figure 3: The 3-step preprocessing algorithm
The eyes RGB images are converted into normalized RGB encoding. We chose the RGB color space because of its ability to differentiate the color and intensity information [29]. Normalized RGB has the ability to decrease the distortions due to shadows and lights in an image.
Normalized RGB is calculated as depicted in Eqs. (1)–(3).
Also, we converted the normalized RGB images into HUV, where the V component is used is utilized in the preprocessing step to extract the cornea from the eye images because the V component gives better contrast between the cornea and the sclera, and can extract the cornea edges better.
We utilize the Gaussian filter of σ = 0.015 V (x, y) to yield the image symbolized by Intensity (x, y). Smoothing procedure is followed utilizing the diffusion anisotropic function (DAF) defined by Cho et al. [30]. This depicts the DAF convolution (CON) methodology to identify the cornea edges. The function CON was extracted from the research done by Xu et al. [31]. Fig. 4 shows the results of the preprocessing technique.

Figure 4: Example of the preprocessing procedure
The cornea images undergo segmentation process to extract color and texture as well as geometric features. The features can thus be converted into quantitative measures. The segmentation process of cornea is depicted in Fig. 5. The corneal curvature is automatically extracted by edge augmentation utilizing the V component of the HUV encoding color space of the digital eye image.

Figure 5: A block diagram of the proposed cornea extraction process
We performed image normalization process to enhance the colors features in the cornea image due to degradation resultant from non-uniform illuminations. Image normalization was done utilizing Multi Scale Retinex [22]. This step will aid in enhancing the color contrast for images taken under great illumination variance and produce more consistent color space. This normalization will produce robust discrimination of the key features from the cornea segment against the background. Enhancement of contrast component of the colors in the image will minimize the noise interference. The cornea segment is detected where points are created as shown in Fig. 6, where the center of the cornea is localized and the edges surrounding the cornea are computed.
The following features: Horizontal and vertical Visible Iris Diameter, curvature radius, spherical aberration and solidity are measured using our segmentation method and compared to other methods in the literature. Solidity is an important unique feature of corneal surface [14]. These features characterize corneal surface structure where the Horizontal Visible Iris Diameter is longer than the vertical Visible Iris Diameter for a healthy cornea.

Figure 6: The detection of the cornea segment
The results of the segmentation procedure of the four methods are tabulated in Tab. 1. The four methods are our proposed method, the circular Hough transform [23,24], Chanvese and the Daugman procedures. The comparison utilizes the Dice similarity index [25–27]. Also, two doctors performed the segmentation procedure manually to inaugurate the ground truth. From the table, the proposed procedure achieved 0.87 Dice, while the circular Hough transform achieved lower Dice index of 0.5633, Chanvese has a Dice index of 0.5376, the Daugman procedures [25] achieves better dice similarity but lower than the proposed method the Daugman procedures achieved 0.7616. The manual segmentation by the two doctors is in agreement with the result of our proposed method. The Index for the Segmentation Results utilizing Dice Similarity is depicted in Tab. 1.

3.2.3 Corneal Feature Extraction
The shape, texture and color features represent the changes that can occur in the cornea due to LSCD. These features include the vertical and horizontal iris diameters. Also, Color eccentricity, cornea sphere completion shape and Cornea texture are important features. Color eccentricity is a very important feature that illustrates the course and color change of the cornea [32]. Eccentricity € is computed as a function of the shape factor, S, and the diameters of the iris (Eqs. (4) and (5)).
where,
The sphere completion shape of the front cornea exterior shows that the cornea form differs from a normal cornea versus a LSCD infected cornea.
4 Image Processing of Smartphone Captured Cornea
A frontally captured image utilizing a smartphone is used in this research. The procedure consists of two stages: preprocessing stage that utilize image contrast correction, second stage of feature extraction. The LSCD cornea can be clinically detected because the cornea would be bulged slightly outward in a downward trend, which leads to a conclusion that the corneal drooping can be detected, and the differentiation can be measured in a quantitative method.
4.1 Image Contrast Correction Method
In most LSCD ailment eyes, a frail contrast is found between the cornea and sclera especially that the sclera tends to be more yellowish. Therefore, an image contrast correction method namely gamma correction will be utilized on the captured RGB converted to RGB image [33]. The correction method will correct the captured image brightness. This stage is essential to extract the curvature precisely. The gamma correction is computed as in Eq. (6).
In Eq. (6), γ represents gamma factor and Image’ is the output with a corrected factor. The image brightness is enhanced with gamma factor equal or greater than 1 (γ ≥ 1) and decreases gradually with γ getting smaller than 1. In this research, the gamma value is chosen by a trial method based on brightness correction with respect to γ.
4.2 Corneal Shape Extraction and Curvature Computation
The shape identification of the frontal eye is done by computing texture differentiation and then the curvature is computed. The curvature is computed using an automated process which depends on third degree spline interpolation [34].
The proposed method probes the image in horizontally and can detect edges by the intensity differences in texture. The system changes from the Cartesian plane (x, y) to (Θ, Φ) which is polar coordinates. The origin can be detected easily which transform the edge detection problem to be straightforward. The problem is converted to an image processing one dimensional job.
The gray level intensities from 0 to 255 are converted to polar angles ranging from 0° to 360°. Therefore, curves with low to high gray levels can be obtained. The high levels are related to bright parts of the cornea texture, and low levels are related to more opaque parts of the cornea which is affected by the LCSD.
The curves should be smoothed and decrease the noise levels. In the second step we calculate the first derivative to the slopes at each point. The derivative will produce a curve with peaks characterizing the edge between dark and bright texture levels.
Color and texture analysis are used to extract iris features. Iris color palette is utilized to describe an illustration of all possible colors of the iris surface. Therefore, we defined Iris color palette to make a similar illustration of the colors on the iris surface. The iris color was used as a locus to extract color and texture features of the iris. The colors show that the iris surface can be represented by the color gamut which are not opaque in texture as opposite to iris that is affected by LSCD which is opaque in texture.
The method is based on the sensitivity of the iris texture extraction which convey important evidence that can differentiate between normal and LSCD eyes.
Texture portrayal operator utilizes Local binary pattern (LB) for classification [35]. LB portrayal operator is computed in a 3 × 3 zone, it includes the following steps:
a. The setting of the threshold
b. Encoding.
Threshold setting
c. In the first iteration, the pixels group of 3 × 3-pixel zone is usually set as the initial threshold value.
d. The other pixels are compared to the initial threshold value
e. Each pixel value will take a 0 or 1 binary value. If the value of the pixel is superior to the initial threshold, it will take a value of 1, otherwise, it will take the value of 0.
f. The eight pixels with values 1 or 0 will be arranged in a clockwise order not including the central pixel. The calculated value is depicted as the Local binary pattern code of the pixel at the center.
Local binary pattern is depicted in the example given in Fig. 7.

Figure 7: Local binary code
The Local binary pattern code is a texture feature. The Local binary pattern code is characterized by its statistical histogram which is considered as the final texture feature vector that is computed from the original Local binary pattern code image.
As a summary of the preprocessing step, the image is transformed into binary image of 0 and 1 according to the threshold. The Local binary pattern code of every pixel is computed and the output would be texture feature image and the Local binary pattern histogram is depicted as the feature vector of the cornea image.
5.2 Support Vector Machine Classification
Support vector machine is an influential classification solution to many problems. The key advantages of support vector machines are the generalization capability and the strong learning method. Support vector machine usually leads to identifying global minimum.
The Support vector machine is a linear high-dimensional feature space machine [36]. This is done by the representing the input vector in a nonlinear fashion to a K-dimensional space of the extracted features through a mapping function φ(x).
The hyperplane is depicted in Eq. (7) as follows:
where,
The Support vector machine’s learning process is the classification to the maximum of the margin between any two classes for separation.
It can be depicted as a procedure to minimize the cost function as defined in Eq. (8).
Subject to:
ξi ≥ 0 is a representation of the slack variable,
p is the count of the learning pairs xi, di.
The optimization problem is solved by the Lagrangian function [37]. This depicts the quadratic programming that utilizes Lagrange multipliers. The learning and testing operations utilize the kernel function, ensuring that the Mercer conditions are satisfied. The kernel is the inner product of the two vector φ (xi) and φ(x) (Ker (xi, x) = φ T(xi) φ(x)). Kernel functions usually utilize the Gaussian basis and the sigmoid functions. The learning problem of the Support vector machine is defined as the solution of the dual problem, as shown in Eq. (9).
Subject to
In this research, the training of the Support vector machine’s classifier utilizes the extracted features from training set.
In the following subsections, we present two algorithms to compute the curvature and characterize the ratio features of the horizontal and vertical diameter of the iris as the change in Cornea curvature will increase these measures. We utilize ratio computation and the numerical integration computation method [38].
For ratio computation, the initialization process is first normalized by extracting the farthest point of the cornea curve followed by calculating the reference ratio, R. the reference ratio is defined as the ratio of the width, w, to the width of the image, Imw, as shown in Eq. (10). Also, Imn is the computed value of the corneal curvature utilizing w, as shown in Eq. (11). The ratio is calculated in Eq. (12).
The required ratio is computed as follows:
The ratio “Ratio” is a characteristic of the droopiness of the cornea downwards and is based on the fact that the smaller the ratio is, the more is the dropping of the eye cornea downwards as shown in the following Fig. 8. This is in agreement with the clinical observation that the dropping of a LSCD cornea downwards increases as the severity of the LSCD increases [39].
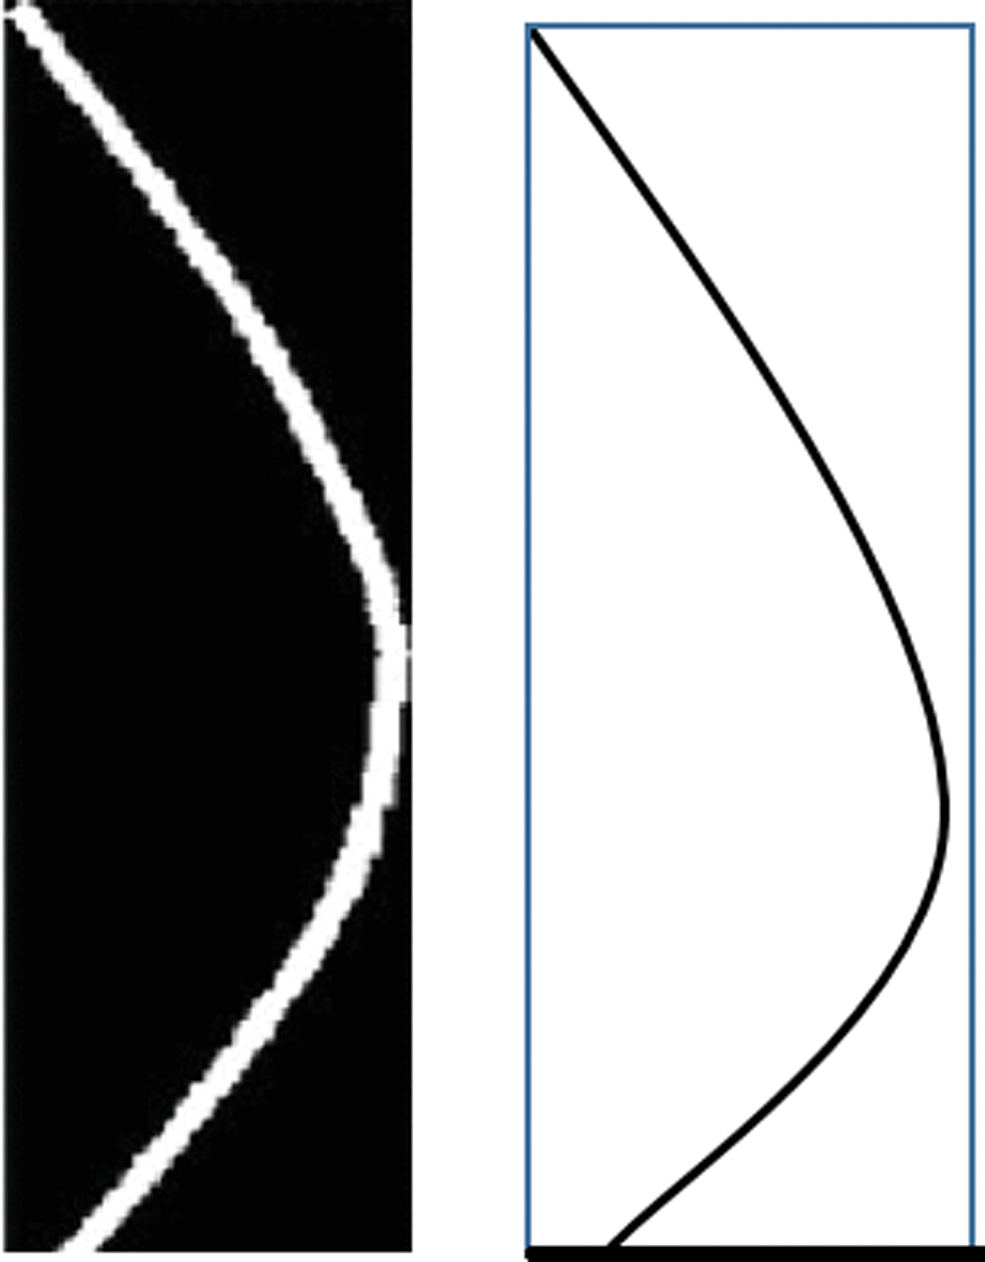
Figure 8: The ratio method using the length and width
We computed the ratio of the length to the width of the curve for a normal eye on the left and for an LSCD eye where the cornea is more dropped on the right.
The features from the curve extraction, are fused to select the most preeminent features. The selection methodology in the suggested system aids the evaluation of the impact of the implemented corneal feature selection based on the ranking of the features method. The adopted corneal features are sphericity, eccentricity, horizontal and vertical diameters. The adopted features are measured from the cornea utilizing the ratio calculation, and the numerical integration technique.
The features are selected to attain stability, scalability and minimize feature variability for classification purposes. The data size is the main reason for the instability or stability of the feature selection. Data size which is small with a high dimensionality can induce feature instability. Therefore, we select and rank the features accordingly. The most challenging problem is choosing the optimal features to form the feature model. In this research, Rclassify, latent feature selection algorithm methods will be utilized to define the impertinence of the features.
The proposed classification algorithm: Rclassify, which is an extension to the Relief algorithm. The major drawback of Relief algorithm is its limitation to binary classification and also its jeopardizing of losing data [40], our proposed method Rclassify is more robust against incomplete data. Rclassify is characterized by its filtering technique that can analyze intrinsic data features regardless of the classifier type. Rclassify is a similarity-based classifier and is capable of detecting the interactions of features. Since, Rclassify is not able to handle redundancy and have a tendency of reiterating through highly correlated features, other filters, such as latent feature selection algorithm, are combined to induce an overall probabilistic framework that can handle feature redundancy. The feature selection method is carefully chosen to be founded on the appropriateness of the data size.
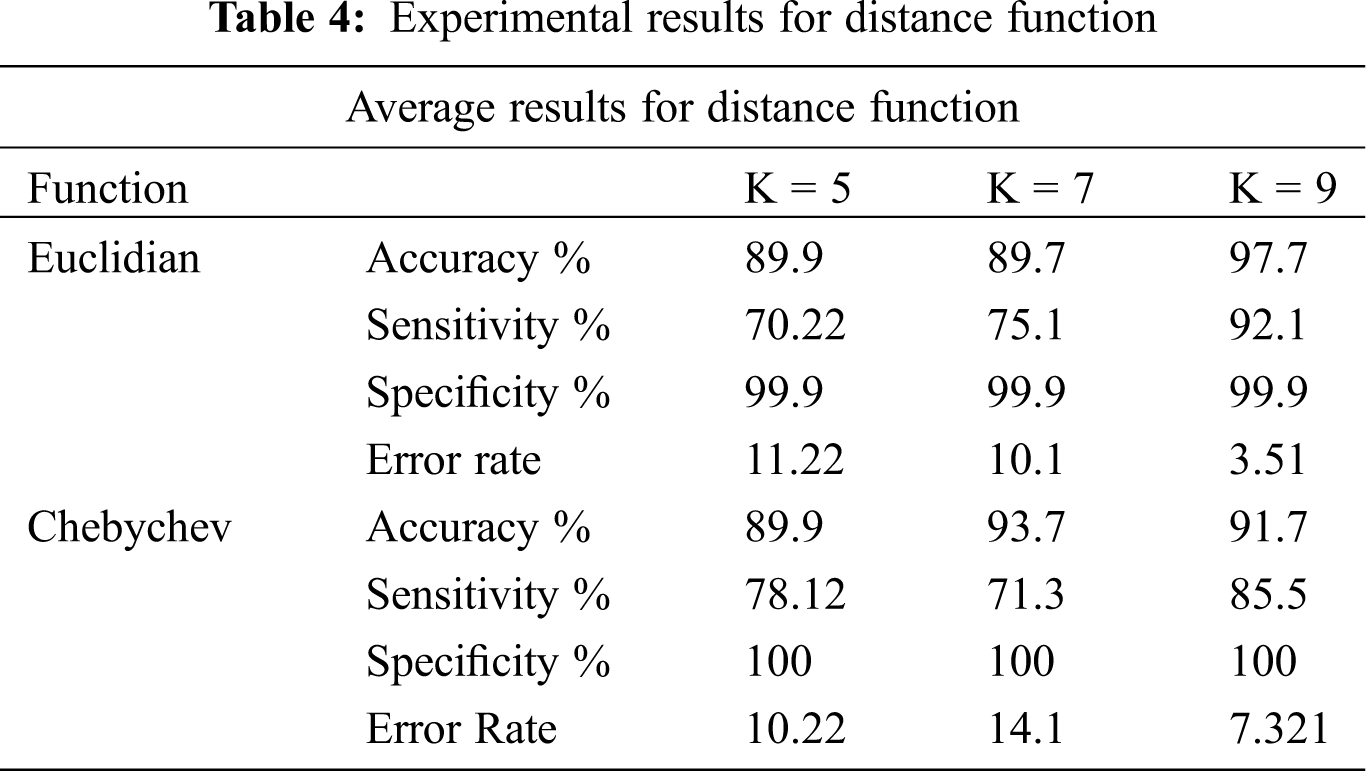
Classification methodology represents the class-predicting procedure for the data in question. In this research, the classification of LSCD eyes versus normal eyes are based on extracted and ranked features. The classification utilizes the feature selection methods. How well the classification performs is the actual representation of the performance of the whole system. It also characterizes the appropriateness of the data type and size. In this research, the classification study takes account of SVM classifier including linear, quadratic, and radial basis function as shown in Tab. 2. Where Random Forest utilizes n = 10, 34, 200 and 400, the experiments are designed to find the optimum number of trees, see Tab. 3. The experiments also tested k-NN models with the appropriate numbers of k. We also included experiments for Chebychev and Euclidean kernels, see Tab. 4. The experiments are designed to simulate the models to get the best features for the classifier. The number of features of the classifier has to be appropriate to the size of the data. We based our experiments ion on the holdout cross-validation test. The training set was represented by 70% holding of the whole data. The experiments utilized 30% for the test data set. Also, k-fold cross validation is utilized to train the classifier. Top ranked features were used for the experiments.


The ranked features are: <L5, L7, L6, L1, L4, L9, L8, A6, A7, A4, A1,A2, L3, A5, L2, A3> and are utilized to optimize the parameters for each classifier. The performance comparison among the algorithms are the accuracy, sensitivity, specificity, and error.
The experimental results in Tab. 2: SVM machine with the Radial Basis Function shows 95.24% accuracy. This method constantly outperforms the other kernels for data with nonlinear distribution. The experimental results of the random forest in Tab. 3, show that using n = 10 trees got the highest accuracy of 94.05%. Tab. 4 shows also that the sensitivity is higher with n = 40 trees. Thus, random forest with n = 40 will be utilized in the next round. In these experiments, sensitivity is more significant than the accuracy and specificity because LSCD patients cannot be classified as false negative. Tab. 4 indicates that the best nearest neighbors with the best kernel is the Chebychev model.
6.1 Simulation Results for Computing Ratio Computation (RC) of The Droopiness of the Cornea
The simulation results, of the Computing Ratio that indicate the diagnosis of infected eyes with LSCD, are presented in this subsection. The experiments are designed such that the correlation between the RC of the LSCD infected eyes and the Actual Ratio from an actual physician diagnosis, are extracted.
Simulation results presented in Fig. 9, depict the correlation between the Actual Ratio of LSCD in patients from an actual physician diagnosis from topographic images of the cornea, and the Computation Ratio of LSCD extracted from our proposed computing ratio algorithms from lateral images of the eye using a smartphone.
The Bland-Altman Plot, of the actual Ratio of LSCD in patients from an actual medical expert diagnosis versus the Computation Ratio of LSCD computed using our proposed algorithm, is depicted in Fig. 10.

Figure 9: The correlation between the Actual Ratio of LSCD in patients from an actual physician diagnosis from topographic images of the cornea, and the Computation Ratio of LSCD extracted from our proposed computing ratio algorithms from lateral images of the eye using a smartphone

Figure 10: The Bland-Altman Plot, of the Actual Ratio of LSCD in patients from an actual medical expert diagnosis versus the Computation Ratio of LSCD computed using our proposed algorithm
The correlation between the Actual Ratio and the computation Ratio, as plotted in Fig. 9, indicates the positive correlation between the Actual Ratio of LSCD in patients from an actual medical expert diagnosis versus the Computation Ratio of LSCD computed using our proposed algorithm.
The simulation results depict resilient strong linear relationship between the physician Actual Ratio and the predicted Computation Ratio diagnosis.
Positive correlation is indicated using Pearson’s r formula as presented in Eq. (13), where r is always is greater than 0 and always approaching 1.
“r” was calculated to be equal 0.925, which denotes high correlation between the Actual Ratio of LSCD in patients from an actual medical expert diagnosis versus the Computation Ratio of LSCD computed by our algorithm (utilizing the data presented in Fig. 9).
Bland-Altman metric usually denotes the positive correlation of two quantities. Bland-Altman plot is used constantly in correlating the predicted medical diagnosis (P) with actual diagnosis (D). The presented Bland-Altman between A and D in our case found that the values of the two tests are of highly similar.
6.2 The Classification Process Accuracy and Error
Results: We compared the diagnosis done by a medical expert for 228 cases. Their medical evaluation was found fully in the dataset:
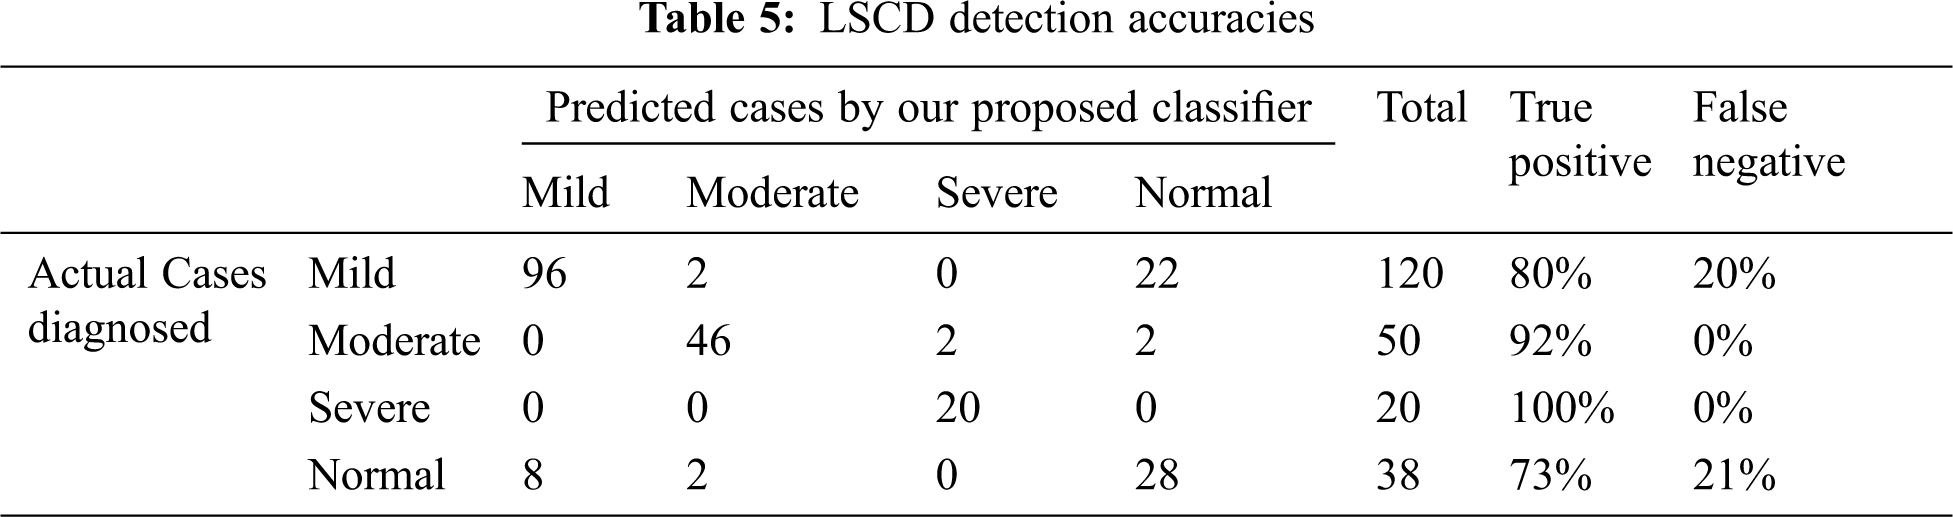
Comparison of the experimental results of actual medical diagnosis with our proposed method as shown in Tab. 5. The proposed classification process proved the prediction ability to correctly diagnose the 4 stages of LSCD with high accuracy especially for moderate to severe cases. The four stages are normal, mild, moderate, and severe LSCD cases, the accuracies are published as follows: 73.6%, 80%, 92%, and 100% for normal, mild, moderate, and severe cases respectively. Most the false negative in the mild and normal cases are in pale blue and green eyes.
We presented the development of an automated LSCD detection technique (LDT) approach using frontal and lateral eye image views captured by smartphones. Very few studies of LSCD automated diagnosis are found in the literature. Our study is one of the initial an automated LSCD detection techniques that utilize image processing techniques. A 3-step preprocessing and the cornea region segmentation algorithms were proposed. We developed a feature extraction algorithm from the training data set.
We developed a method for LSCD detection technique utilizing frontal eye images. A dataset of 280 eye images of frontal and lateral LSCD and normal patients were used in this research. First, the cornea region of both frontal and lateral images is segmented and the texture features are extracted using the feature selection algorithm. The experimental results exhibited that the combined features of the geometric and texture will exhibit accuracy of 95.95%, sensitivity of 97.91% and specificity of 94.05% with the random forest classifier of n = 40. As a result, this research developed a Limbal Stem Cell Deficiency detection system utilizing features’ fusion using image processing techniques for frontal and lateral digital images of the eyes.
Funding Statement: This research was funded by the Deanship of Scientific Research at Princess Nourah bint Abdulrahman University through the Fast-track Research Funding Program.
Conflicts of Interest: The authors declare that they have no conflicts of interest to report regarding the present study.
1. K. Sejpal, P. Bakhtiari and S. Deng, “Presentation, diagnosis and management of limbal stem cell deficiency,” Middle East African Journal of Ophthalmology, vol. 20, no. 11, pp. 5–10, 2013. [Google Scholar]
2. Q. Le and J. Xu, “The diagnosis of limbal stem cell deficiency,” Ocular Surface, vol. 16, no. 1, pp. 58–69, 2018. [Google Scholar]
3. Y. Dong and A. Horsch, “Emerging therapeutic strategies for limbal stem cell deficiency,” Journal of Ophthalmology, vol. 3, no. 2, pp. 110–119, 2018. [Google Scholar]
4. H. Dua and A. Blanco, “Limbal stem cells of the corneal epithelium,” Survey Ophthalmology, vol. 44, no. 1, pp. 415–425, 2000. [Google Scholar]
5. H. Dua, J. Gomes and A. Singh, “Corneal epithelial wound healing,” Briton Journal of Ophthalmology, vol. 78, pp. 401–408, 1994. [Google Scholar]
6. Q. Le and S. Deng, “The diagnosis of limbal stem cell deficiency,” Ocular Surface, vol. 16, no. 4, pp. 58–69, 2018. [Google Scholar]
7. K. Kim, A. Kyeong, B. Hwana and I. Shahzad, “Diagnosis of corneal limbal stem cell deficiency,” Opinion in Ophthalmology, vol. 28, no. 4, pp. 355–362, 2017. https://journals.lww.com/co-ophthalmology/fulltext/2017/07000/diagnosis_of_corneal_limbal_stem_cell_deficiency.11.aspxCurrent. [Google Scholar]
8. A. Abass, B. Lopes, A. Eliasy and J. Clamp, “Three-dimensional non-parametric method for limbus detection,” PLoS One, vol. 13, no. 7, pp. 11–24, 2018. [Google Scholar]
9. R. Katikireddy and J. Ula, “Limbal stem cell transplantation and corneal transplantation,” Briton Journal of Ophthalmology, vol. 79, no. 2, pp. 41–48, 1997. [Google Scholar]
10. L. Dudakova and S. Merjava, “Familial limbal stem cell deficiency: Clinical, cytological and genetic characterization,” Stem Cell Review and Representation, vol. 14, no. 1, pp. 148–152, 2018. [Google Scholar]
11. A. Fabijańska, “Automatic segmentation of corneal endothelial cells from microscopy images,” Biomedical Signal Processing and Control, vol. 10, no. 2, pp. 145–158, 2019. [Google Scholar]
12. K. Nurzynska and A. Piorkowski, “The correlation analysis of the shape parameters for endothelial image characterization,” Image Analysis, vol. 35, no. 3, pp. 149–158, 2016. [Google Scholar]
13. M. Daniel and F. Bucher, “Automated segmentation of the corneal endothelium in a large set of real-world specular microscopy images using the U-Net architecture,” Science Representation, vol. 9, no. 2, pp. 475–483, 2019. [Google Scholar]
14. J. Sierra, “Automated corneal endothelium image segmentation in the presence of cornea guttata via convolutional neural networks,” in Proc. of the SPIE of Applications of Machine Learning 2020, New York, NY, USA, pp. 115–123, 2020. [Google Scholar]
15. A. Fabijańska, “Segmentation of corneal endothelium images using a U-Net-based convolutional neural network,” Artificial Intelligence in Medicine, vol. 10, no. 2, pp. 1016–1024, 2018. [Google Scholar]
16. Q. Liang, C. Tseng and S. Deng, “Corneal epithelial thickness measured using anterior segment optical coherence tomography as a diagnostic parameter for limbal stem cell deficiency,” Ophthalmology, vol. 216, no. 1, pp. 132–139, 2020. [Google Scholar]
17. W. Binotti, S. Cox and P. Hamrah, “Review of imaging biomarkers of the ocular surface. eye contact lens,” Biomedical Signal Processing and Control, vol. 46, no. 1, pp. 84–105, 2018. [Google Scholar]
18. M. Twa, S. Parthasarathy, T. Raasch and M. Bullimore, “Decision tree classification of spatial data patterns from videokeratography using Zernike polynomials,” in Proc. of the SIAM Int. Conf. on Data Mining, Athens, Greece, pp. 3–12, 2020. [Google Scholar]
19. S. Islam and H. Mondal, “Image enhancement based medical image analysis,” in Proc. of the 10th Int. Conf. on Computing, Communication and Networking Technologies, Paris, France, pp. 1–5, 2019. [Google Scholar]
20. Z. Jiao, X. Gao, Y. Wang and J. Li, “A parasitic metric learning net for cornea classification,” Pattern Recognition, vol. 75, no. 1, pp. 292–301, 2018. [Google Scholar]
21. Y. Bengio, “Learning deep architectures for AI,” Foundation Trends in Machine Learning, vol. 2, no. 1, pp. 1–127, 2009. [Google Scholar]
22. B. Askarian, T. Fatemehsadat and J. Chong, “An affordable and easy-to-use diagnostic method for keratoconus detection using a smartphone,” in Proc. of the SPIE Medical Imaging, Cleveland, USA, pp. 201–221, 2018. [Google Scholar]
23. Z. Mahmood, N. Muhammad and A. Naseer, “Human visual enhancement using multi scale retinex,” Informatics in Medicine Unlocked, vol. 13, no. 2, pp. 9–20, 2018. [Google Scholar]
24. Q. Li and M. Wu, “An improved Hough transform for circle detection using circular inscribed direct triangle,” in Proc. of the 13th Int. Congress on Image and Signal Processing, Washington, USA, pp. 203–207, 2020. [Google Scholar]
25. X. Zhang, R. Mu, K. Chen and Y. Chen, “Intelligent Hough transform to detect the diameter of red-hot circular workpiece,” IEEE Sensors Journal, vol. 21, no. 1, pp. 560–567, 2021. [Google Scholar]
26. M. Alam, M. Khan, Z. Salehin and T. Khan, “Combined PCA-Daugman method: An efficient technique for face and iris recognition,” Journal of Advances in Mathematics and Computer Science, vol. 35, no. 5, pp. 105–121, 2020. [Google Scholar]
27. V. Prasath, R. Pelapur, G. Seetharaman and K. Palaniappan, “Multiscale structure tensor for improved feature extraction and image regularization,” IEEE Transactions on Image Processing, vol. 28, no. 12, pp. 6198–6210, 2019. [Google Scholar]
28. H. Chung, S. Jeon and J. Lee, “Automatic lung segmentation with juxta-pleural nodule identification using active contour model and Bayesian approach,” IEEE Journal of Translational Engineering in Health and Medicine, vol. 6, no. 2, pp. 1–13, 2018. [Google Scholar]
29. P. Ganesan, B. Sathish, V. Sivakumar and C. Ravi, “A comprehensive review of the impact of color space on image segmentation,” in Proc. of 5th Int. Conf. on Advanced Computing & Communication System, Florence, Italy, pp. 962–967, 2019. [Google Scholar]
30. S. Cho, B. Oh, K. Toh and Z. Lin, “Extraction and cross-matching of palm-vein and palmprint from the RGB and the NIR spectrums for identity verification,” IEEE Access, vol. 8, pp. 4005–4021, 2020. [Google Scholar]
31. Y. Xu and J. Yuan, “Anisotropic diffusion equation with a new diffusion coefficient for image Denoising,” Pattern Analytic Application, vol. 20, no. 1, pp. 579–586, 2017. [Google Scholar]
32. B. Zhao, “Evaluation of convolution operation based on the interpretation of deep learning on 3-D point cloud,” IEEE Journal of Selected Topics in Applied Earth Observations and Remote Sensing, vol. 13, no. 2, pp. 5088–5101, 2020. [Google Scholar]
33. C. Yaramothu, R. Jaswal and T. Alvarez, “Target eccentricity and form influences disparity vergence eye movements responses: A temporal and dynamic analysis,” Journal of Eye Movement Research, vol. 12, no. 4, pp. 7–15, 2019. [Google Scholar]
34. M. Atitallah, R. Kachouri, A. Atitallah and H. Mnif, “New Gamma correction method for real time image text extraction,” in Proc. of Ninth Int. Conf. on Image Processing Theory, Tools and Applications, NY, USA, pp. 1–6, 2019. [Google Scholar]
35. J. Lian, W. Yu, K. Xiao and W. Liu, “Cubic spline interpolation-based robot path planning using a chaotic adaptive particle swarm optimization algorithm,” Mathematical Problems in Engineering, vol. 20, no. 1, pp. 102–112, 2020. [Google Scholar]
36. W. Huang, Y. Huang, H. Wang and H. Shim, “Local binary patterns and superpixel-based multiple kernels for hyperspectral image classification,” IEEE Journal of Selected Topics in Applied Earth Observations and Remote Sensing, vol. 13, no. 1, pp. 4550–4563, 2020. [Google Scholar]
37. L. Liu, M. Chu, R. Gong and L. Zhang, “An improved nonparallel support vector machine,” IEEE Transactions on Neural Networks and Learning Systems, vol. 21, no. 1, pp. 145–156, 2019. [Google Scholar]
38. H. Everett, “Generalized Lagrange multiplier method for solving problems of optimal allocation of resources,” Operations Research, vol. 11, no. 3, pp. 45–57, 1963. [Google Scholar]
39. M. Moheuddin, M. Titu and S. Hossain, “A new analysis of approximate solutions for numerical integration problems with quadrature-based methods,” Pure and Applied Mathematics Journal, vol. 9, no. 3, pp. 46–54, 2020. [Google Scholar]
40. C. Aravena, K. Bozkurt, P. Chuephanich and F. Yu, “Classification of limbal stem cell deficiency using clinical and confocal grading,” Cornea, vol. 38, no. 1, pp. 1–7, 2019. [Google Scholar]
 | This work is licensed under a Creative Commons Attribution 4.0 International License, which permits unrestricted use, distribution, and reproduction in any medium, provided the original work is properly cited. |