DOI:10.32604/csse.2022.016376
| Computer Systems Science & Engineering DOI:10.32604/csse.2022.016376 | |
| Article |
Mammogram Learning System for Breast Cancer Diagnosis Using Deep Learning SVM
1Research Scholar, Anna University, Chennai, Tamilnadu, 600 025, India
2Velammal Engineering College, Chennai, Tamilnadu, 600 066, India
*Corresponding Author: G. Jayandhi. Email: g.jayandhi08@gmail.com
Received: 31 December 2020; Accepted: 01 May 2021
Abstract: The most common form of cancer for women is breast cancer. Recent advances in medical imaging technologies increase the use of digital mammograms to diagnose breast cancer. Thus, an automated computerized system with high accuracy is needed. In this study, an efficient Deep Learning Architecture (DLA) with a Support Vector Machine (SVM) is designed for breast cancer diagnosis. It combines the ideas from DLA with SVM. The state-of-the-art Visual Geometric Group (VGG) architecture with 16 layers is employed in this study as it uses the small size of 3 × 3 convolution filters that reduces system complexity. The softmax layer in VGG assumes that the training samples belong to exactly only one class, which is not valid in a real situation, such as in medical image diagnosis. To overcome this situation, SVM is employed instead of the softmax layer in VGG. Data augmentation is also employed as DLA usually requires a large number of samples. VGG model with different SVM kernels is built to classify the mammograms. Results show that the VGG-SVM model has good potential for the classification of Mammographic Image Analysis Society (MIAS) database images with an accuracy of 98.67%, sensitivity of 99.32%, and specificity of 98.34%.
Keywords: Deep learning architecture; support vector machine; breast cancer; visual geometric group; data augmentation
Breast cancer is the leading cause of death in India, accountable for 9% of non-communicable diseases [1]. The incidence of breast cancer in metropolitan cities increases every year compared to cervical cancer, which is on the decline. Thus, a multidisciplinary approach is required to diagnose breast cancer early, that includes screening programs and awareness programs that reduce mortality. The best possible screening method is mammography, which is inexpensive now and captures breast images quickly due to the digital revolution in recent years.
The advances in computing technology laid the fundamental methodology for medical image analysis in the medical domain, emphasizing cancer classification. There are two dominant designs; the class prediction model [2–13] and the class discovery model [11,14]. Each design is used as a different study’s objective. The former model is also known as supervised learning based on the classification technique using training samples associated with the training samples’ target output. The later model is also known as unsupervised learning, based on observing the correlation between samples in similar clusters.
Different supervised learning algorithms are developed and used in breast cancer diagnoses such as k-nearest neighbour [2], naive Bayes [3], support vector machine [4,5–7], Linear regression [8], artificial neural network [9–10], decision tree [11–12] and extreme learning machine [13]. These algorithms require a separate feature extraction module to extract dominant features from the training samples. Features from time-domain; Shape [5–8], texture [4–6,8], Gray level [5] and moment invariants [9–10] and frequency domain; Wavelet [3,13], Bandlet and Ripplet [2], Hough transform [6], and Surfacelet transform [12] are employed. Feature reduction techniques such as principal component analysis [11,13] and the Fisher score [9] are also employed to reduce the feature space if needed. The quality of any classification system depends on the extracted features and the classifiers as well. A poor classifier may waste the extracted powerful features.
Recent advances in DLA greatly help to design accurate classification systems in many research areas such as image classification, text classification, speech recognition, natural language processing, and mammogram image classification [15–16]. The state-of-the-art DLAs such as VGG [17], DenseNet [18], AlexNet [19], and GoogleNet [20] have a great achievement in classifying thousands of natural objects. These pre-trained models can be effectively analyzed for mammogram classification system using transfer learning approach. This approach uses the pre-trained weights for the classification of the mammogram. The number of layers in DenseNet, AlexNet, and GoogleNet are 201, 8, and 22. Among the models, VGG only uses a small-sized (3 × 3) convolution filter and different layers such as 11, 16, and 19 from input to output. Thus, VGG with 16 layers is employed in this study to extract deep features.
This study proposes a hybrid model based on DLA and SVM for diagnosing breast cancer. To extract the highly dominant features for breast cancer classification, the VGG model is utilized, and then SVM is incorporated at the output layer to improve the classification results. This article consists of four sections. Section 2 describes the design of the VGG-SVM model to deliver high accuracy for breast cancer diagnosis. The experimental studies that support the system, the original studies’ results, and the system’s evaluation by comparative studies with four commonly used SVM kernels are described in Section 3. The last section concludes the proposed work.
A mammogram learning system is a pattern recognition system that makes decisions based on previous experiences, i.e., with known class labels in training samples. In general, the classification process assigns the given input to one class or another. The input to the classification process may include readings from the sensors, features of any objects to be classified, such as signals and images. The learning system classifies the testing samples correctly by adapting a general classifier model based on the inputs. In this study, mammogram images are fed to the system to classify them into either normal or abnormal. The proposed breast cancer diagnostic system operates under two modes: Local Classification Mode (LCM) and Global Classification Mode (GCM). Though the system classifies the input mammograms into two classes, the former uses the Region of Interest (ROI) images, and then later uses the whole mammograms as inputs.
Generally, preprocessing is employed in medical images to remove undesirable information to ensure data integrity and improve classification performance. In this stage, the patient information in the digital X-ray is removed, and the contrast of mammograms is enhanced. Simple morphological operations are employed to remove the information embedded in the X-ray image. The previous studies in [2,4,9,11,12], Contrast Limited Adaptive Histogram Equalization (CLAHE), are chosen as a contrast enhancement technique. The over enhancement by AHE is removed by CLAHE as the enhancement is applied on a local intensity histogram. The window size used for making a local intensity histogram is 8 × 8 with a 0.01 contrast limit.
Fig. 1 shows the contrast-enhanced image by CLAHE. These images are utilized by the GCM of the proposed system for breast cancer diagnosis. The ground truth data [21–22], available in the MIAS database, is used to extract the ROI. In the ground truth, seven detailed information such as reference number, type of background tissue, type of abnormality, abnormal severity, abnormality center, and the abnormality size are given. Based on the center of the abnormality, the ROI of size 256 × 256 pixels is extracted. These images are utilized by the LCM of the proposed system for breast cancer diagnosis, whereas GCM uses the whole mammogram of 1024 × 1024 pixels. Based on the abnormality in the ground truth data, the images are split into two groups; normal and abnormal for classification. Fig. 2 shows the extracted ROI from the original mammograms shown in Fig. 1.

Figure 1: Mammograms (a) Acquired image (b) Contrast-enhanced

Figure 2: Extracted ROI of images of Fig. 1 (b)
The DLA allows a single model for feature extraction as well as classification of the input data. Features are extracted by a sequence of convolution layers of two or more, followed by pooling layers to reduce the feature map’s size. A Fully Connected Layer (FCL) interprets the features and the output layer with an activation function for predications. A simple DLA is shown in Fig. 3.

Figure 3: Simple DLA for a two-class problem
DLA has become more popular in the last decade in the pattern recognition and computer vision research area. Many DLAs are developed, such as the Visual Geometric Group (VGG), Alex Net, GoogleNet. Among these DLAs, VGG is employed in this study due to its simplicity. Fig. 4 shows the VGG-DLA with 16 layers where C-(SxS)-N represents convolution operation C of filter size of S with N filters, and MPL represents Max Pooling Layer. The main advantage of the VGG model with 16 layers is the use of smaller-sized (3 × 3) convolution filters throughout the architecture that reduces the computational complexity.

Figure 4: VGG-DLA with 16 layers
A stack of convolution filters in 5 blocks is employed for feature extraction, followed by three FCLs. In each block, the number of channels is increased from 64 to 512 by a multiplication factor of 2. Fig. 5 shows the obtained feature map at the first block of filters for the extracted ROI image shown in Fig. 1 (b). The activation function named Rectified Linear Units (ReLU) is used in the hidden layers to overcome the vanishing gradient problem. This function’s output is a linear function that returns the positive inputs only, a desirable property for the backpropagation neural network. The softmax layer is defined as
where
This process gives n output values, and the output layer with high value is considered the predicted class. The main drawback of the softmax layer is that the probabilistic-based approach assumes that the training samples belong to exactly only one class, i.e., features are independent of each other, and all are having equal importance to predict the outcomes. However, the above assumption is not valid in a real-time situation, such as in medical image diagnosis. In this study, the abnormal images containing different abnormalities such as masses of different types and micro-calcifications, and thus VGG-SVM is designed for breast cancer diagnosis.

Figure 5: Feature map at the first block of VGG architecture
Let us assume that the obtained features
For the linear case, the aim is to determine a weight vector
And for the non-linear case, the constraints are
where
where C is the controlling factor that controls the trade-off between model complexity and empirical risk. The formulation in Eq. (2) can be rewritten for the non-linear case as
where

Figure 6: VGG-SVM with 16 layers
Four different kernels are used in this study, and their performances are computed. They are summarized in Tab. 1.

The RBF-SVM parameters such as C in Eq. 7 and
The prototype of the VGG-SVM system for mammogram classification is explained in the previous section. It extracts deep features and classifies them using SVM with different kernels at the output layer. This section presents the experimental setup, performance metrics, and findings of the prototype with discussions of the experimental results.
The proposed VGG-SVM breast cancer diagnostic system is analyzed using the MIAS database [21–22]. It has 322 mammograms that include 207 normal images and 105 abnormal mammograms of different classes such as masses and micro-calcifications. Sample mammograms are shown in Fig. 1. It is well known that DLA usually requires a large number of samples to provide better classification. Data augmentation [23] is employed to increase the samples in the MIAS database. The samples are increased to seven times using flipping and rotating the samples by an angle of 900, 1800, and 2700. Data augmentation increases the normal samples from 207 to 1449 and abnormal samples from 105 to 735. The standard parameter settings for VGG architecture are shown in Tab. 2. The same settings are used for VGG-SVM architectures, and to validate the DLAs, k-fold (10-fold) cross-validation is employed.

The performance of the VGG-SVM system is analyzed in terms of sensitivity, specificity and accuracy. The definitions are as follows:
• Sensitivity: It gives the correct classification rate of abnormal mammograms and is given below:
where True Positive (TP) and False Negative (FN) are the correct and misclassified abnormal mammograms.
• Specificity: It gives the correct classification rate of normal mammograms and is given below:
where True Negative (TN) and False Positive (FP) are the correct and misclassified normal mammograms.
• Accuracy: It gives the overall classification rate of the system and is given below:
To show the trade-off between sensitivity and specificity, a plot called Receiver Operating Characteristics (ROC) is drawn in which the x-axis represents the true positive ratio (sensitivity), and the y-axis represents the false positive ratio (1-specificity). It can be used to visualize the system performances with ease.
The performances of the VGG-SVM architectures and the VGG-DLA are analyzed with the preprocessing stage and without preprocessing stage to demonstrate the effects of preprocessing on the mammograms. Tab. 3 shows the performances of GCM for different architecture without preprocessing stage.

It is observed from Tab. 3 that VGG-RBF-SVM architecture provides an accuracy of 81.27%, the highest among other VGG-SVM architectures. The VGG-16 model provides only 65.48% accuracy. The use of SVM in the output layer instead of using the softmax layer in VGG architecture increases the accuracy of mammogram classification by ~15%. Since there is no preprocessing, the performance of all architectures is less than 82% only. CLAHE enhances the micro-calcifications, masses, and other tissues in the mammograms, and their performances are evaluated again using the same set of images. Tab. 4 shows the performances of GCM for different architecture with the preprocessing stage.

It is evident from Tabs. 3 and 4 that the application of preprocessing on mammograms improves the classification accuracies of a minimum of 5% approximately on all architectures. The classification accuracy of VGG architecture is increased from 65.48% to 72.21%, while the performance of VGG-RBF-SVM is increased to 86.77%. After preprocessing the whole mammogram, a maximum sensitivity of 87.76% and specificity of 86.27% are achieved by VGG-RBF-SVM. The GCM provides only 86.77% accuracy, and the complexity is also high as it uses the whole image. To further increase the accuracy of mammogram classification, LCM is developed. Tab. 5 shows the performances of LCM for different architecture without preprocessing stage.

Tab. 5 shows that the LCM achieves significant improvement over GCM without preprocessing. When operated under LCM, the performance of VGG-RBF-SVM architecture has an improvement of 13.5% over GCM. This is because the whole image does not only have the breast tissues but also have pectoral muscle too. Thus, the LCM, which uses only the abnormalities’ ROI, can classify more accurately than GCM. Tab. 6 shows the performances of LCM for different architecture with a preprocessing stage.
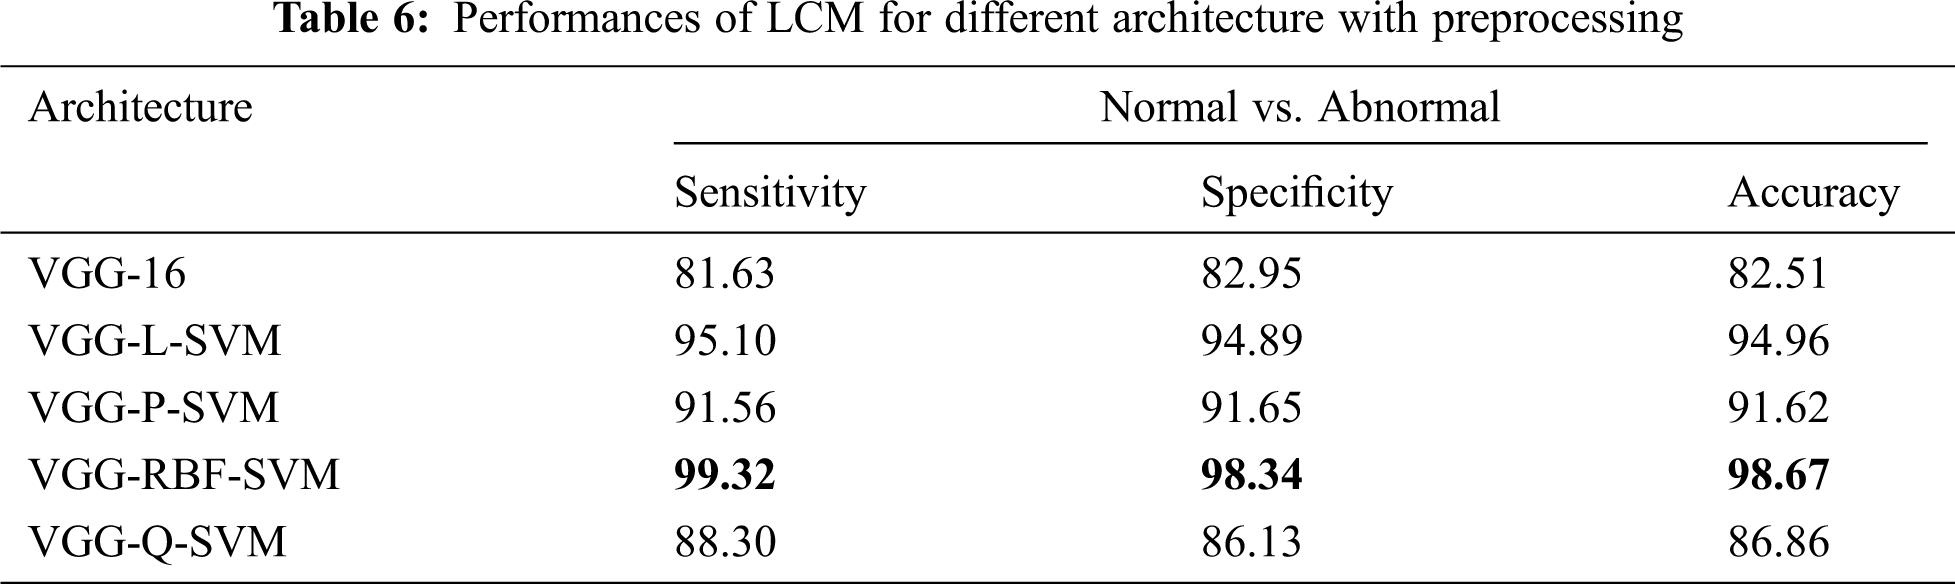
It is noted from Tab. 6 that best performance is obtained with an accuracy of 98.67%, sensitivity of 99.32%, and specificity of 98.34% when the mammograms are classified using LCM with preprocessing approach. The performances of architectures are in the order of VGG-RBF-SVM > VGG-L-SVM > VGG-P-SVM > VGG-Q-SVM > VGG-16. The performance of the RBF kernel is better than others because it projects the feature space into infinite features space. Also, it is invariant to translation and isotropic. A comparative analysis makes further analysis of the system with existing systems in the literature. Tab. 7 illustrates the comparative analysis.

It is noted from Tab. 7 that the VGG-RBF-SVM provides better performance than existing approaches in the literature. To visualize the performance, ROC curves of two modes, GCM and LCM are drawn and shown in Fig. 7.

Figure 7: ROCs (a) GCM without preprocessing (b) GCM with preprocessing (c) LCM without preprocessing (d) LCM with preprocessing
It can be seen from the ROCs in Fig. 7 that how the performance of the different architectures improved from GCM to LCM and with a preprocessing step. The ROCs are gradually moved toward the y-axis, which indicates better performance of the system. The ROC curve of VGG-RBF-SVM architecture under LCM with preprocessing of mammograms occupies more area under the curve as it is very close to the y-axis and the top border of the graph.
This paper presents an intelligent mammogram learning system via DLA and SVM for breast cancer diagnosis. Deep features are extracted from mammograms using the standard parameter settings in VGG with 16 layers. A series of preprocessing steps is applied before extracting deep features. The VGG-SVM system utilizes the SVM classifier in the output layer instead of using the softmax layer. The VGG-SVM system operates under two modes; LCM and GCM. Several VGG-SVM with different SVM kernels is trained using the deep features for performance evaluation. Among the four kernels, the RBF kernel in VGG-SVM is the most effective kernel to obtain the highest performance. Results show that the combination of DLA and SVM works efficiently for breast cancer diagnosis.
Funding Statement: The authors received no specific funding for this study.
Conflicts of Interest: The authors declare that they have no conflicts of interest to report regarding the present study.
1. P. Mathur, K. Sathishkumar, M. Chaturvedi, P. Das, K. L. Sudarshan et al., “Cancer statistics, 2020: Report from National Cancer Registry Programme, India,” JCO Global Oncology, vol. 6, pp. 1063–1075, 2020. [Google Scholar]
2. G. Prathibha and B. Chandra Mohan, “Classification of benign and malignant masses using bandelet and orthogonal ripplet type II transforms,” Computer Methods in Biomechanics and Biomedical Engineering: Imaging & Visualization, vol. 6, no. 6, pp. 704–717, 2018. [Google Scholar]
3. E. J. Kendall, M. G. Barnett and K. Chytyk-Praznik, “Automatic detection of anomalies in screening mammograms,” BMC Medical Imaging, vol. 13, no. 1, pp. 43, 2013. [Google Scholar]
4. A. A. Kayode, N. O. Akande, A. A. Adegun and M. O. Adebiyi, “An automated mammogram classification system using modified support vector machine,” Medical Devices, vol. 12, pp. 275, 2019. [Google Scholar]
5. W. J. Singh and B. Nagarajan, “Automatic diagnosis of mammographic abnormalities based on hybrid features with learning classifier,” Computer Methods in Biomechanics and Biomedical Engineering, vol. 16, no. 7, pp. 758–767, 2013. [Google Scholar]
6. R. Vijayarajeswari, P. Parthasarathy, S. Vivekanandan and A. A. Basha, “Classification of mammogram for early detection of breast cancer using SVM classifier and Hough transform,” Measurement, vol. 146, pp. 800–805, 2019. [Google Scholar]
7. W. Xie, Y. Li and Y. Ma, “Breast mass classification in digital mammography based on extreme learning machine,” Neurocomputing, vol. 173, pp. 930–941, 2016. [Google Scholar]
8. Y. Wang, F. Aghaei, A. Zarafshani, Y. Qiu, W. Qian et al., “Computer-aided classification of mammographic masses using visually sensitive image features,” Journal of X-ray Science and Technology, vol. 25, no. 1, pp. 171–186, 2017. [Google Scholar]
9. M. S. Mabrouk, H. M. Afify and S. Y. Marzouk, “Fully automated computer-aided diagnosis system for micro calcifications cancer based on improved mammographic image techniques,” Ain Shams Engineering Journal, vol. 10, no. 3, pp. 517–527, 2019. [Google Scholar]
10. S. P. Singh and S. Urooj, “An improved CAD system for breast cancer diagnosis based on generalized pseudo-Zernike moment and Ada-DEWNN classifier,” Journal of Medical Systems, vol. 40, no. 4, pp. 105, 2016. [Google Scholar]
11. M. Nilashi, O. Ibrahim, H. Ahmadi and L. Shahmoradi, “A knowledge-based system for breast cancer classification using fuzzy logic method,” Telematics and Informatics, vol. 34, no. 4, pp. 133–144, 2017. [Google Scholar]
12. J. S. Leena Jasmine, “Surfacelet transform based mammogram classification system,” International Journal of Advances in Signal and Image Sciences, vol. 2, no. 1, pp. 11–18, 2016. [Google Scholar]
13. F. Mohanty, S. Rup, B. Dash, B. Majhi and M. N. S. Swamy, “An improved scheme for digital mammogram classification using weighted chaotic salp swarm algorithm-based kernel extreme learning machine,” Applied Soft Computing, vol. 91, pp. 1–16, 2020. [Google Scholar]
14. P. Kaur, G. Singh and P. Kaur, “Intellectual detection and validation of automated mammogram breast cancer images by multi-class SVM using deep learning classification,” Informatics in Medicine Unlocked, vol. 16, pp. 100151, 2019. [Google Scholar]
15. V. S. Gnanasekaran, S. Joypaul, P. M. Sundaram and D. D. Chairman, “Deep learning algorithm for breast masses classification in mammograms,” IET Image Processing, vol. 14, no. 12, pp. 2860–2868, 2020. [Google Scholar]
16. H. Chougrad, H. Zouaki and O. Alheyane, “Deep convolutional neural networks for breast cancer screening,” Computer Methods and Programs in Biomedicine, vol. 157, pp. 19–30, 2018. [Google Scholar]
17. K. Simonyan and A. Zisserman, “Very deep convolutional networks for large-scale image recognition. arXiv preprint arXiv:1409.1556, 2014. [Google Scholar]
18. K. He, X. Zhang, S. Ren and J. Sun, “Deep residual learning for image recognition,” in IEEE Conference on Computer Vision and Pattern Recognition, Las Vegas, NV, USA, pp. 770–778, 2016. [Google Scholar]
19. C. Szegedy, V. Vanhoucke, S. Ioffe, J. Shlens and Z.Wojna, “Rethinking the inception architecture for computer vision,” in Proc. of the IEEE Conference on Computer Vision and Pattern Recognition, Las Vegas, NV, USA, pp. 2818–2826, 2016. [Google Scholar]
20. C. Szegedy, W. Liu, Y. Jia, P. Sermanet, S. Reed et al., “Going deeper with convolutions,” in Proc. of the IEEE Conference on Computer Vision and Pattern Recognition, Boston, MA, USA, pp. 1–9, 2015. [Google Scholar]
21. J. Suckling, S. Astley, D. Betal, N. Cerneaz, D. R. Dance et al., “The mammographic image analysis society digital mammogram database,” Exerpta Medica. International Congress Series 1069, York, England, pp. 375–378, 1994. [Google Scholar]
22. MIAS download link: http://peipa.essex.ac.uk/pix/mias/. [Google Scholar]
23. O. Russakovsky, J. Deng, H. Su, J. Krause, S. Satheesh et al., “Imagenet large scale visual recognition challenge,” International Journal of Computer Vision, vol. 115, no. 3, pp. 211–252, 2015. [Google Scholar]
 | This work is licensed under a Creative Commons Attribution 4.0 International License, which permits unrestricted use, distribution, and reproduction in any medium, provided the original work is properly cited. |