DOI:10.32604/csse.2022.018458
| Computer Systems Science & Engineering DOI:10.32604/csse.2022.018458 | |
| Article |
Smart Mina: LoRaWAN Technology for Smart Fire Detection Application for Hajj Pilgrimage
Computer Science Department, Computing College-Alqunfudah, UMM Al-QURA University, Mecca, Saudi Arabia
*Corresponding Author: Mohammad Al Mojamed. Email: mmmojamed@uqu.edu.sa
Received: 09 March 2021; Accepted: 01 May 2021
Abstract: The Long-Range Wide Area Network (LoRaWAN) is one of the used communication systems that serve and enables the deployment of the Internet of Things (IoT), which occasionally transmit small size data. As part of the Low Power Wide Area Network (LPWAN), LoRaWAN is characterized by its ability for low power consumption. In addition, it is built to provide more extended coverage and higher capacity with minimum cost. In this paper, we investigate the feasibility and scalability of LoRaWAN for the Mina area using a realistic network model. Mina, known as the world’s largest tent city, is a valley located in the east of Makkah city and surrounded by mountains. It accommodates up to 3 million pilgrims annually and contains more than 100000 tents. The performance was evaluated based on a fire detection-like application. Extensive simulations were conducted using the OMNeT++ simulator and Flora model to determine the delivery ratio, collision, and SF distribution for the simulated scenario with a network consisting of up to ten thousand end devices. The conducted simulations show a promising result for LoRaWAN technology for Mina city. It showed a consistent performance for LoRaWAN in most simulated scenarios when a high success ratio was achieved.
Keywords: LoRa; LoRaWAN; LPWAN; IOT; flora; smart city; Mina
Internet of things is increasingly being deployed to enhance functionalities for many businesses. IoT provides communications among heterogenous devices to enable smart services in different scenarios. Scenarios include smart cities, health care, smart home, environment monitoring, smart agriculture and farming, logistics, and transportations. According to Tran et al. [1], 500 billion IoT things by the year 2030 are estimated to be connected to the Internet, meaning that IoTs will constitute a vital role in future networking.
A variety of enabling communication technologies are used to construct the communication infrastructure with the wider global world. Such enabling technologies include Radio Frequency Identification (RFID), Bluetooth, Wireless Sensor Networks (WSN), IEEE 802.11 WLAN, Near Field Communication (NFC), IEEE 802.15.4 Low-Rate Wireless Personal Area Networks (LR-WPANs), Long Term Evolution (LTE), and IPv6 Low-Power Wireless Personal Area Network (6LowPAN) [2].
Generally, communication technologies such as RFID, Bluetooth, WLAN, NFC, LR-WPANs, and 6LowPAN are used to support IoTs optimized for short-range sensing scenarios. Bluetooth and WLAN were proposed for short-range and high-speed data rates, while others, such as LR-WPANs and 6LowPAN, aim to applications with low data rates in a short-range environment. However, different applications requiring different needs have appeared. An example of such a scenario is the application that requires long-range communication while maintaining power consumption to the minimum with low-bandwidth [3,4].
To meet the requirements mentioned above, a new communication model for IoTs named Low-Power Wide Area Networks (LPWAN) has emerged [5,6]. LPWAN is intended for a long-range area with low bandwidth and low power consumption as well. It mainly targets resource limited and battery-operated IoT devices. LPWAN is a promising solution to provide IoTs connectivity covering a geographical area that spans up to 10 km while offering a battery life of more than 10 years [7,8].
For IoTs connectivity based on LPWAN, the choice of which of the LPWAN technologies can be used is mainly dependent on the developed applications and their specific requirements. For example, coverage area, power consumption, data rate, and the cost [9]. LPWAN technology can be classified in general into two groups; standards-based LPWAN technologies and non-standards-based LPWAN technologies [3].
Standards-based LPWAN technologies constitute the larger part of existing LPWAN communication solutions. The standardization efforts are led by private industries as well as by different standardization bodies. European Telecommunications Standard Institute (ETSI), Institute of Electrical and Electronics Engineer (IEEE), Internet Engineering Task Force (IETF), and The Third Generation Partnership Project (3GPP) are the leading organizations that have developed standardized LPWAN systems. On the other hand, industrial bodies such as Lora Alliance, WEIGHTLESS Special Interest Group (WEIGHTLESS-SIG), and DASH-7 have also made efforts to standardize their proprietary solutions.
ETSI proposed a Low Throughput Network (LTN) standard for low throughput M2M communication and delay-tolerant networks. IEEE has extended some of its wireless solution systems to serve LPWAN. It proposes IEEE 802.15.4k for Low Energy Critical Infrastructure Monitoring Networks and IEEE 802.15.4g for Low Data Rate Wireless Smart Metering Utility Networks. Moreover, the IETF has also made an effort to standardize an IPv6-based Low power Wireless Personal Area Network (6LoWPAN) based on the IEEE 802.15.4. 3GPP, on the other hand, has different solutions for M2M and IoT communications, referred to as cellular-based solutions, including Narrow Band IoT (NB-IoT), Long Term Evolution (LTE), and Extended Coverage Global System for Mobile Communication (EC-GSM).
Private industries have also contributed towards developing LPWAN standards. LoRa Alliance has designed LoRa as a proprietary physical layer solution for IoTs LPWAN communication. It also designed the upper layer architecture on top of LoRa and names it LoRaWAN. The specifications were announced publicly in 2015. Moreover, WEIGHTLESS-SIG designed three standards for LPWAN connectivity: WEIGHTLESS-W, WEIGHTLESS-N, and WEIGHTLESS-P. The developed versions differ from each other in the power consumption, coverage areas, and their features. The proposed standards can operate in unlicensed and licensed spectrum. Dash-7 Alliance has also developed an open-source protocol named D7AP [10] for low-power devices with medium coverage areas. Their proposed solution is based on the ISO/IEC 18000-7, used initially by the department of defense—US for logistics.
This paper focuses on enhancing the Hajj pilgrimage safety through optimizing the most recent technologies. It investigates the feasibility, scalability of LoRaWAN technology for smart fire monitoring and detection application for Mina, Makkah. A realistic network model and design simulating the Mina layout are constructed. Moreover, the performance of LoRaWAN for Mina like environment is thoroughly investigated. The key contributions of this paper are:
• Comprehensive Investigation for LoRaWAN feasibility in Mina for Hajj pilgrimage safety.
• Develop and design a realistic network model to simulate the Mina map, including upload and download channel transmission for fire detection-like application.
• Evaluating LoRaWAN scalability and reliability in the case study using up to ten thousand end devices.
• A reference for future deployment of LoRaWAN technology for Hajj safety.
The rest of the article is organized as follows: The most recent and related works in the literature are presented in Section 2. In Section 3, A background of LoRaWAN, along with a summary of its architecture, are introduced. Section 4 covers the research design and methodology, simulation frameworks, and considered parameters in the simulated scenarios. The results are then introduced and discussed in Section 5. Finally, Section 6 concludes this article and highlights possible future works.
Many research and studies have been published in the literature covering different aspects of LoRaWAN. Some of the work involved using few numbers of end-devices in testbeds to evaluates some features of LoRaWAN. Others have used simulation tools to propose and evaluate their studies.
The performance of LoRaWAN in the industrial environment has been investigated by Haxhibeqiri et al. [11] with a focus on the coverage of such technology in the indoor flower industry. The measurement was carried out in 180 × 190 m, which is around 34000 m2 using only one gateway and 21 end nodes. However, the authors opt for simulation, Python script simulator, to investigate the scalability of LoRaWAN in a large industrial area. Based on the simulation result, the study concluded that one gateway could serve up to 6000 end nodes as long as three-quarters of them send one packet per hour and the others send it every five minutes. The study did not state any information regarding the distribution of the end nodes nor the coverage area.
Sendra et al. [12] proposes a fire risk evaluation system based on Lora WAN technology. A proposed LoRa node in the developed system is fitted with multiple sensors to sense humidity, temperature CO2, and wind speed. The work first evaluates the Received Signal Strength Indicator (RSSI) and Signal-to-noise ratio (SNR) for different positions in the studied area in Motril in Spain to find out the coverage area. The performance of one node sensing the different parameters was then investigated for 20 hours duration, where measurements were taken every 28 minutes. The result shows the proposed solution’s ability to cover an area with a 4 km radius using only one gateway.
The effect of cold weather on the performance of LoRaWAN was investigated by Bezerra et al. [13]. Four gateways and eight sensors were deployed in the city of Skellefteå, Sweden. The study focuses on evaluating the use of different propagation models, namely Okumura-Hata and ITM. Their experiments cover different scenarios where gateways were placed indoor and outdoor; some of the sensors were Adaptive Data Rate (ADR) enabled and worked with a different SF value. The results were then compared to the obtained result by Cloud-RF [14], which was used to estimate the coverage and calculate the RSSI. The study concluded that cold weather has a positive impact on the performance of LoRaWAN.
The feasibility and scalability of LoRaWAN were also studied by Yu et al. [15] using realistic simulation scenarios. General network topology was designed similar to London city within the simulator. The network layout was divided into cells, inner cells form central London, and were given a 1.14 km radius to consider the building’s height and density. The outer cells were regarded as urban areas and given a 5 km radius. Forty-seven cells were proposed in total to cover the London map having 11681 end nodes. The study considers different setting values like those required by smart city applications such as air quality monitoring and intelligent transportation system.
The work in Magrin et al. [16] studies the effects of different parameter configurations of LoRaWAN in some scenarios. It aims to identify some of the common trade-offs when designing LoRaWAN networks using realistic simulations (NS-3 Simulator). The study proposes some modifications to enhance LoRaWAN when deployed at a larger scale. Single gateway serving multiple end devices up to 7000 nodes was the adopted scenario. The study investigates the effect of MAC configuration, including gateway duty cycle, gateway prioritization of reception over transmission, acknowledgment mechanism, transmission attempts number, Full-duplex path, and the number of gateway receive paths. It concluded that using acknowledgment mechanisms such as sub-band swapping and prioritizing gateway traffic reception over traffic transmission would improve the system’s overall performance.
The suitability of LoRaWAN for monitoring applications in the field of IoT for indoor industries was also investigated by Luvisotto et al. [17]. Many assumptions were made when simulating the scenario using NS-3, like using uplink traffic only, no traffic acknowledgment, and hence, there were no retransmissions. Moreover, the sensors’ radio coverage was set to 200 m for up to 1000 end nodes. The study uses an accurate channel model for industrial IoT that considers fading, shadowing, and path loss. It evaluates different values of the SF for the proposed scenario. These were lowest SF, highest SF factor, randomly chosen SF, and the fair strategy, which is the static strategy proposed by the paper. The LoRaWAN based was then compared to IEEE 802.15.4 and showed better performance for such an industrial scenario.
Another work that analyses the scalability of LoRaWAN is Varsier et al. [18]. It uses MATLAB to investigates the capacity limit for smart metering applications using uplink and downlink transmission. The study does not consider retransmission where no acknowledgments were required. ADR was enforced to guarantee the distribution of spreading factors depending on the value of Signal-to-Interference-plus Noise Ratio (SINR). The study modeled an environment like central Paris, France, using 19 gateways with an inter-distance of 1 km to cover a total area of 17 km2. The number of end devices per gateway and value of the antenna gain was varied to constitutes two different simulated scenarios; 1500 end devices with −5 antenna gain and 1000 end devices with 0 antenna gain. The paper concluded that the use of retransmission could have extended the limit of the simulated scenarios.
A general performance evaluation of LoRaWAN was also conducted by Harwahyu et al. [19]. The study focuses on evaluating LoRaWAN in terms of traffic delivery and power consumption. It also investigates the wasted power by an end-device due to collision while transmitting. The work deployed a small LoRaWAN network consisting of 10 end-devices along with a gateway. Moreover, the work also examined the performance using network simulation to investigate the scalability of the system in a network consisting of up to 1000 end-nodes. The paper concluded that the performance of LoRa is highly dependent on the configuration of three parameters: SF, coding rate, and the chosen frequency. The study also suggested the usage of a random selection of the frequency to overcome the limitation of the pure ALOHA access mechanism.
The scalability of LoRaWAN in a dense urban environment was also investigated [20]. The paper investigated the effects of SF assignment when using acknowledged and un-acknowledged traffic in such high-density networks. In addition, the uplink and downlink traffic were also considered in the study. The work was conducted using an NS-3 network simulator. The simulated topology contains one gateway with a 7.5 km radius covering 100–1000 end-devices in a square-shaped area. In order to take the effect of building height into account, the paper proposed an algorithm that assigned an SF for an end-device based on the gateway sensitivity. The study’s findings were that networks operating on un-acknowledged communication perform better as no downlink traffic was needed, and using a high antenna improves the network performance in dense urban networks.
The suitability of LoRaWAN for smart metering applications was also studied in Jebroni et al. [21]. MATLAB simulation was used to model the feasibility in Oujda city, Morocco. A modified Okumural model was used to model the urban environment. The modifications were to consider the expected losses as a result of shadow fading. The work was limited in the first five SF, where SF 12 was avoided due to its transmission duration. In order to find out the maximum range for each SF, the work follows an incremental test using simulation. Each step used a ten-meter increase until simulation result in 5% packet loss.
Usage of LoRaWAN for pilot farm scenarios was also studied in the literature. The work in Miles et al. [22] analysis the performance of such technology using NS-3. It considers a gateway with a 7.5 km radius covering 10–2000 end-devices. The paper first carried out a set of simulations to study the impact of transmission interval duration on the packet delivery ratio. It then proposes a mathematical model that can predict the success ratio for a network scenario based on the number of end-devices and the transmission interval duration. The paper finally compares the result of the model to the obtained result from the simulator. The paper concluded that a gateway with up to 1000 end-devices using an hour as transmission interval is suitable for IoTs applications in the agricultural field.
LoRaWAN is one of the leading technologies in the LPWAN field. It is one of the most adopted and successful technologies for long-range IoTs [23]. Long Range (LoRa) was originally developed by the French Cycleo company and then acquired by the American company Semtech [24]. LoRa constitutes the physical layer as a communication medium between LoRa end nodes and gateways. It uses wireless technology to transmit small-size data that varies from 0.3 kbps to 50 kbps using a low-power transmitter to other devices over long-range distances. LoRa signals can travel to a long-distance up to 20 km in a rural area. However, the coverage of LoRa is affected by the surrounding building and materials where the signal can reach around 5 km in an urban area.
LoRa uses the globally available unlicensed sub-GHz Industrial, Scientific and Medical (ISM) band. It uses Frequency Shift Keying (FSK) and Chirp Spread Spectrum (CSS) as modulation technique that establishes bidirectional communication among devices with low noise level in the generated signals [25]. LoRa can be configured to use different Spreading Factors (SF) values between 7 and 12 when transmitting. The choice of the SF represents a trade-off between coverage range and data rate. With a higher value of SF, an end node can achieve longer coverage but at the cost of a lower data rate, whereas a higher data rate with shorter coverage can be achieved with a smaller value of the SF [8,26].
LoRaWAN is an open standard developed by LoRa Alliance [27], which operates as a Data Link Layer on top of physical LoRa for LoRaWAN networks, as shown in Fig. 1. The first specification for LoRaWAN was issued by LoRa Alliance in 2015, and the more recent specification is version 1.0.4, which was released in October 2020. Transmitted data by LoRaWAN end-devices are broadcast and can be received by all installed base stations providing that they are located within the coverage range of the devices. Therefore, LoRaWAN increases its communication reliability where a message can be received by more than a base station. Consequently, this would result in a redundant transmission which is handled by LoRaWAN using filtering at the backend system where transmitted data are filtered and then forwarded to the corresponding application server [25].
LoRaWAN offers three different classes that can be implemented by end-devices; class A, class B, and class C. Class A provides basic features and known as basic LoRaWAN, whereas class B and class C offer other optional features. All three classes of LoRaWAN allow bidirectional communications between entities. Class A employs that each uplink transmission window in communication between an end-device and a gateway is followed by two short receive windows that can be used for downlink transmission. Communication from the gateway towards an end-device can only be received during the two short receive windows. Communication from the gateway outside these receives windows must wait until the next uplink transmission started by the end-device. This, consequently, make the end-device unreachable while it is not transmitting. Operating class A system is regarded as the lowest-power option among the three classes.
Class B provides features that allow end-devices to open extra scheduled receive windows. The scheduled receives windows are open by an end-device once it receives time-synchronized bacon from a gateway. Thus, the network server will be aware of the listening time of the end-devices.
Class C end-devices open continuous receive windows, which make the end-device reachable most of the time. The only time that the receive window is closed for an end-device is when it is transmitting. This, however, comes with the cost of consuming higher power compared to class A and class B and is suitable for a device with no concern regarding power [28].
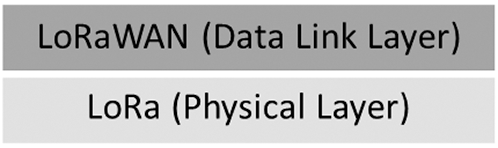
Figure 1: LoRaWAN stack
The topology of LoRaWAN is considered as a star of star topology where end-devices are allowed only to communicate with available gateways and cannot directly communicate with each other. Gateways can connect to the IP network (using ethernet, Wi-Fi, Satellite, or cellular network) and are responsible for relaying traffic between end-devices and a network server. Gateways convert LoRaWAN messages into IP messages and forward them to the cloud network server. It also receives IP packets and MAC commands from the network server, converts them to LoRaWAN packets, and distributes them among end-devices using LoRa infrastructure. Fig. 2 shows LoRaWAN architecture. It is mainly composed of the following components [29,30]:
• End devices: devices that consist of a microprocessor for processing data and a radio module. End-devices are battery-powered and placed where sensing takes place. They are not required to associate with a particular gateway and communicate with gateways following a single-hop communication.
• Gateways: works as a relay to relay traffic between end devices and the cloud-based network server. Gateways are not power restricted, and they support TCP/IP communication to communicate with the servers. They consist of microprocessor and radio components, including transmitter as well. Moreover, gateways do not require end-device registration to relay their traffic, and hence, no handover procedure between gateways is needed.
• Network Server: the complexity and intelligence of LoRaWAN are managed by the network server. A network server is responsible for filtering redundant arrived traffic, delivering acknowledgment through the most appropriate gateway, making decisions on optimal data rate for end devices and forwarding traffic to the corresponding application server, and delivering application server traffic to the correct end-devices.
• Application Server: represent the developer application where the end developer can obtain sensed data.
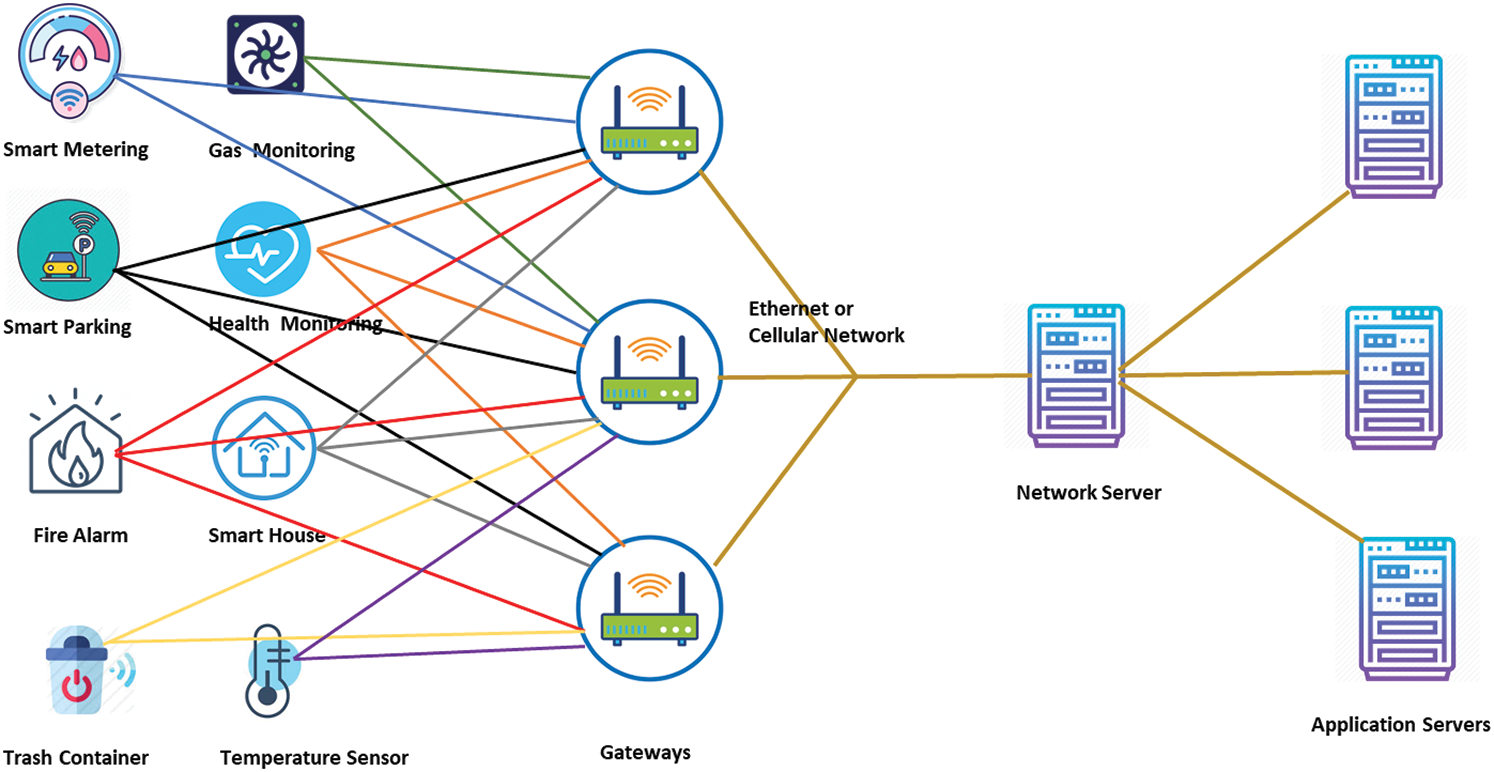
Figure 2: LoRaWAN architecture
4 Research Design and Methodology
The Framework for LoRa (FLoRa) [31] can be used to simulate LoRaWAN networks. FLoRa is based on the OMNeT++ network simulator and the INET framework, which provides a simulation environment for communication networks. FLoRa is an open-source simulator that implements the physical layer (LoRa) and the MAC layer (LoRaWAN), providing bi-directional communication between LoRaWAN network components, including network servers, gateways, and end-devices. It models and allows configuring physical layer features including SF, frequency, code rate, bandwidth and transmission power.
This research represents a scenario that reflects the Mina, Makkah layout to investigate the feasibility of LoRaWAN technology for fire monitoring and detection application. Mina, known as the world’s largest tent city, is a valley located in the east of Makkah city and surrounded by mountains. Fig. 3 shows the map of the Mina district using Google Maps. Mina is the place where the pilgrims spend most of their time during the spiritual Hajj season. It accommodates up to 3 million pilgrims annually. It contains more than 100000 tents that spread across the Mina valley [32] over the utilized area of Mina, which is about 5.8 km2.
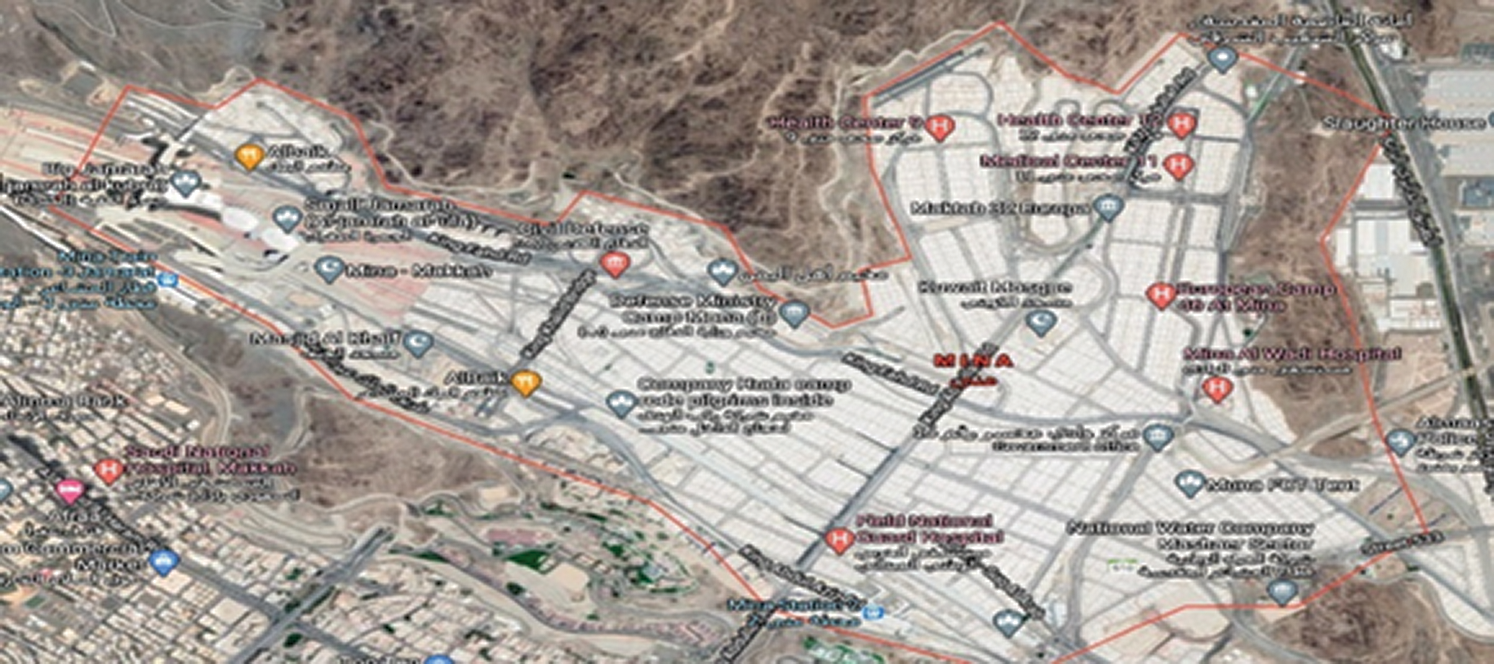
Figure 3: Map of Mina district
As Figs. 3 and 4 show, the utilized area of Mina is the valley itself and the edges of the mountains facing the valley. The area size is calculated using Google Maps, see Fig. 4, where the border was drawn around all the constructed tents. It is about 5.8 km2. The length and width were found to be 4.1 km and 2.6 km respectively. The center point, which can be seen from the whole area, is not at the middle of the length line since the area’s shape is not a regular rectangle. Therefore, a midpoint has been chosen where a gateway can be installed and seen from all over the Mina area. It is the highlighted blue mark in Fig. 4. The farthest point from the midpoint is about 2.6 km toward the northwest. The distance from the midpoint to each direction has been highlighted in the figure.

Figure 4: Mina LoRaWAN design
The Mina valley mostly consists of tents and few buildings. Therefore, the scenario can be considered a sub-urban environment where such materials need to be considered when calculating the propagation and path losses. The log-distance path loss is used in the carried-out experiments. It is a well-known logarithmically distance-based model that calculates path loss using the following formula:
where
Sensors can be used to collect several parameters related to fires in general. Common fire forecast parameters include temperature, wind average speed and humidity. Such parameters are used to calculate an index that identifies the potential of a fire. These critical parameters can be collected using LoRaWAN based end-devices. To simulate a realistic fire monitoring scenario, the considered traffic within the network follows a similar pattern to those implemented in real testbeds. The measurement is taken every 30 minutes, similar to Sendra et al. [12]. Send interval is drawn from an exponential distribution using 1800 s as a mean. The payload is set at 20 bytes which are commonly used by sensing applications.
A 2-dimensional topology is used in the simulator for deploying end-nodes and the main gateway. The topology is set as a rectangle of 2600 m × 4100 m to cover the whole area. The gateway is deployed at (800,1500) to cover the whole Mina area, as illustrated in Fig. 4. However, as the simulated area is not a regular shape, part of the rectangle (1000 m × 4100 m) which constitutes 70% of the Mina area, is used to deploy 70% of the end-devices. The rest of the end-devices (30%) are distributed in the right-wing, which is assumed to constitutes around 1.9 km2 (1600 m × 1200 m) of Mina size. Fig. 5 shows a GUI for an example of a simulated area with 100 end-devices and one gateway. The gateway is placed at (800,1500) position, 70% of the end-devices are distributed in 1000 m × 4100 m rectangle and the rest are distributed in the right rectangle facing the gateway location.

Figure 5: End-devices distribution within the area
As stated previously, LoRa operates on free-license Industry, Scientific and Medical frequency band which depends on the country. The frequency plan in Saudi Arabia for LoRaWAN is the EU 863-870 according to The Things Network [34] and the Communication and Information Technology Commission in Saudi Arabia [35]. In this frequency plan, the 500 kHz, 250 kHz and 125 kHz are the available bandwidth along with varying spreading factors from 7 to 12. Therefore, the channel frequency used in this research is 867, which comply with local regulations, with 7–12 spreading factors and 125 kHz bandwidth. Moreover, gateway and end-devices follow the rule of 1% duty cycle limitation imposed by the used frequency band as part of the ISM bands. Tab. 1 summarizes the used parameters.

The Success Ratio and the collision metrics were measured to investigate the performance of the simulated scenarios. The success ratio denotes the ratio between the total number of received packets successfully by the gateway to the total number of sent packets by all the end-devices in a specific network. It shows the ability of the system to deliver sensed data to the gateway and consequently to the network server. Regarding collision, it denotes the total number of packets that arrived at the gateway but dropped due to the interference from other arriving packets that disturb the reception process. a collision occurs when two transmissions using a similar spreading factor, non-orthogonal, overlap at the gateway. The distribution of the spreading factors for each scenario is also measured. This metric is used to analyze the success ratio for each one of the spreading factors within a specific network. It is also used to identify the impact of high-density scenarios.
Fig. 6 reports the packet delivery ratio for three different scenarios. The first scenario uses half an hour (1800 s) as transmission interval between sent packets. A whole hour (3600 s) is used in the second scenario, while an hour and a half (5400 s) was used in the third scenario. The network size was increased to contain up to 10000 end devices using one gateway and running for 864000 s (10 days). The plotted result is the average of 300 runs where every single scenario was repeated ten times.
As Fig. 6 shows, LoRaWAN for the simulated Mina case study achieves good performance for networks consisting of less than 5000 end devices. It manages to deliver more than 80% of the released traffic when end nodes released a packet every 30 minutes. However, for networks with more relax transmission intervals, LoRaWAN manages to achieve more than 90% success rate for 5000 and fewer networks and secure more than 70% for larger networks consisting of up to 10000 end devices.

Figure 6: Success Ratio versus network size with three transmission intervals
For the 1800 s interval scenario (marked with the square mark in Fig. 6), the network performance decreases dramatically as more end-devices were introduced in the network. This due to the parallel data transmissions by all end devices, causing more collisions at the gateway. The performance in such scenarios ended up with around 50% of sent traffic arrived successfully for networks consisting of 10000 end devices.
The average number of collisions for 5000, 6000, 7000, 8000, 9000 and 10000 networks are plotted in Fig. 7. The networks that send traffic every 1800 s experience the largest number of collisions than other networks because of generating large traffic by these scenarios. Moreover, increasing network size means more end-devices generating traffic simultaneously without knowing that others are sending packets at the same time to the gateway, thus increasing the chance of collision where it reaches about 2200 k collisions at the gateway for 10000 networks. It is reflected in the success ratio as shown in Fig. 6, where it drops to 50%.

Figure 7: Average collisions versus network size with three transmission intervals
The ratios of received traffic distributed among available SF for scenarios consisting of 4000 and 10000 end devices are presented in Figs. 8 and 9 respectively. The initial value of SF for each device is assigned randomly. However, it gets updated immediately using the employed Adaptive Date rate mechanism by LoRaWAN. As shown in the figures, most of the delivered traffic used SF 7, which entitles end devices to achieve a higher data rate with shorter coverage. Fig. 9 depicts that about 35% of received traffic was delivered using SF other than SF7. It indicates that more devices were far away from the gateway, or their signals were weakened. Therefore, the devices were assigned higher SF.

Figure 8: Received traffic per SF for 4000 network size with 1800 s transmission interval

Figure 9: Received traffic per SF for 10000 network size with 1800 s transmission interval
This paper evaluates the performance of the LoRaWAN technology as an IoT solution for Hajj Pilgrimage smart application using a real network simulator, OMNeT++. A thorough description of the studied use case was reported. In particular, the study considered the real layout of the targeted area. It deployed up to 10000 end devices covering 5.8 km2 which is equivalent to Mina city’s area. Devices are configured to send packets of 20-byte size at transmission intervals suitable for sensing applications such as fire detection application. The study also used the log-distance path loss model with setting suits environment has few buildings like our case study.
The conducted experiments show high potential for LoRaWAN technology as an IoT architecture for smart Hajj Pilgrimage applications. The result motivates the subsequent use of LoRaWAN in real smart city applications for Mina city. It showed a consistent performance for LoRaWAN in most simulated scenarios when a high success ratio was achieved. However, in dense network scenarios with short transmission intervals, LoRaWAN requires further investigation to improve performance. This could be done by proposing a suitable adaptive data rate model to reduce collision occurrence and hence improve the performance.
Funding Statement: The author received no specific funding for this study.
Conflicts of Interest: The authors declare that they have no conflicts of interest to report regarding the present study.
1. C. Tran and S. Misra, “Review: The technical foundations of IoT,” IEEE Wireless Communications, vol. 26, no. 3, pp. 8, 2019. [Google Scholar]
2. A. Khanna and S. Kaur, “Internet of Things (IoTapplications and challenges: A comprehensive review,” Wireless Personal Communications, vol. 114, no. 2, pp. 1687–1762, 2020. [Google Scholar]
3. B. S. Chaudhari, M. Zennaro and S. Borkar, “LPWAN technologies: Emerging application characteristics, requirements, and design considerations,” Future Internet, vol. 12, no. 3, pp. 46, 2020. [Google Scholar]
4. J. R. Cotrim and J. H. Kleinschmidt, “LoRaWAN Mesh networks: A review and classification of multihop communication,” Sensors, vol. 20, no. 15, pp. 1–21, 2020. [Google Scholar]
5. S. Farrell, Ed., “Low-Power Wide Area Network (LPWAN) Overview,” RFC 8376, 2018. [Online]. Available: https://www.rfc-editor.org/info/rfc8376. [Google Scholar]
6. U. Raza, P. Kulkarni, M. Sooriyabandara and S. Member, “Low power wide area networks: An overview,” IEEE Communications Surveys & Tutorials, vol. 19, no. 2, pp. 855–873, 2017. [Google Scholar]
7. J. Haxhibeqiri, E. De Poorter, I. Moerman and J. Hoebeke, “A survey of LoRaWAN for IoT: From technology to application,” Sensors, vol. 18, no. 11, pp. 3995, 2018. [Google Scholar]
8. G. Premsankar, B. Ghaddar, M. Slabicki and M. Di Francesco, “Optimal configuration of LoRa networks in smart cities,” IEEE Transactions on Industrial Informatics, vol. 16, no. 12, pp. 7243–7254, 2020. [Google Scholar]
9. N. Naik, “LPWAN technologies for IoT systems: Choice between ultra narrow band and spread spectrum,” in IEEE ISSE, Rome, Italy, pp. 1–8, 2018. [Google Scholar]
10. M. Weyn, G. Ergeerts and R. Berkvens, “DASH7 Alliance protocol 1.0: Low-power, Mid-range sensor and actuator communication,” in IEEE CSCN, Tokyo, Japan, pp. 54–59, 2015. [Google Scholar]
11. J. Haxhibeqiri, A. Karaagac, F. Van Den Abeele, W. Joseph, I. Moerman et al., “LoRa indoor coverage and performance in an industrial environment: Case study,” in IEEE ETFA, Limassol, Cyprus, pp. 1–8, 2017. [Google Scholar]
12. S. Sendra, L. García, J. Lloret, I. Bosch and R. Vega-Rodríguez, “LoRaWAN network for fire monitoring in rural environments,” Electronics, vol. 9, no. 3, pp. 1–29, 2020. [Google Scholar]
13. N. S. Bezerra, C. Åhlund, S. Saguna and V. A. de Sousa, “Temperature impact in LoraWAN—A case study in northern Sweden,” Sensors, vol. 19, no. 20, pp. 1–30, 2019. [Google Scholar]
14. CloudRF, “Online radio planning,” [Online]. Available: https://cloudrf.com/. [Accessed: 19-Jan-2021]. [Google Scholar]
15. F. Yu, Z. Zhu and Z. Fan, “Study on the feasibility of LoRaWAN for smart city applications,” in IEEE WiMob, Rome, Italy, pp. 334–340, 2017. [Google Scholar]
16. D. Magrin, M. Capuzzo and A. Zanella, “A thorough study of LoRaWAN performance under different parameter settings,” IEEE Internet of Things Journal, vol. 7, no. 1, pp. 116–127, 2019. [Google Scholar]
17. M. Luvisotto, F. Tramarin, L. Vangelista and S. Vitturi, “On the use of LoRaWAN for indoor industrial IoT applications,” Wireless Communications and Mobile Computing, vol. 2018, pp. 1–11, 2018. [Google Scholar]
18. N. Varsier and J. Schwoerer, “Capacity limits of LoRaWAN technology for smart metering applications,” in IEEE ICC, Paris, France, pp. 1–6, 2017. [Google Scholar]
19. R. Harwahyu, A. Presekal and R. F. Sari, “LoRaWAN performance evaluation with optimized configuration,” International Journal of Future Generation Communication and Networking, vol. 11, no. 4, pp. 51–68, 2018. [Google Scholar]
20. A. Farhad, D. H. Kim and J. Y. Pyun, “Scalability of LoRaWAN in an urban environment: A simulation study,” in ICUFN 2019, Zagreb, Croatia, pp. 677–681, 2019. [Google Scholar]
21. Z. Jebroni, H. Chadli, K. Salmi, M. Saber and B. Tidhaf, “Modeling and simulation of loRaWAN for smart metering network,” in SmartICT, Saidia, Morocco, pp. 687–695, 2019. [Google Scholar]
22. B. Miles, E. B. Bourennane, S. Boucherkha and S. Chikhi, “A study of LoRaWAN protocol performance for IoT applications in smart agriculture,” Computer Communications, vol. 164, pp. 148–157, 2020. [Google Scholar]
23. W. Ayoub, A. E. Samhat, F. Nouvel, M. Mroue and J. Prévotet, “Internet of mobile things: Overview of LoRaWAN, DASH7, and NB-IoT in LPWANs standards and supported mobility,” IEEE Communications Surveys & Tutorials, vol. 21, no. 2, pp. 1561–1581, 2019. [Google Scholar]
24. Semtech LoRa overview, 2019. [Online]. Available: https://www.semtech.com/lora. [Accessed: 19-Jan-2021]. [Google Scholar]
25. K. Mekki, E. Bajic, F. Chaxel and F. Meyer, “Overview of cellular LPWAN technologies for IoT deployment,” in IEEE PERCOM, Athens, Greece, pp. 197–202, 2018. [Google Scholar]
26. R. P. Centelles, F. Freitag, R. Meseguer, L. Navarro, S. F. Ochoa et al., “A LoRa-based communication system for coordinated response in an earthquake aftermath,” Proceedings, vol. 31, no. 1, pp. 73, 2019. [Google Scholar]
27. LoRaWAN, [Online]. Available: https://lora-alliance.org/. [Accessed: 04-Nov-2020]. [Google Scholar]
28. J. M. Marais, A. M. Abu-Mahfouz and G. P. Hancke, “A survey on the viability of confirmed traffic in a LoRaWAN,” IEEE Access, vol. 8, pp. 9296–9311, 2020. [Google Scholar]
29. Technical Marketing Workgroup, LoRaWAN what is it? A technical overview of LoRa and LoRaWAN.LoRa Alliance, 2015. [Google Scholar]
30. R. Kufakunesu, G. P. Hancke and A. M. Abu-Mahfouz, “A survey on adaptive data rate optimization in lorawan: Recent solutions and major challenges,” Sensors, vol. 20, no. 18, pp. 1–25, 2020. [Google Scholar]
31. M. Slabicki, G. Premsankar and M. Di Francesco, “Adaptive configuration of LoRa networks for dense IoT deployments,” in IEEE/IFIP NOMS, Taipei, Taiwan, pp. 1–9, 2018. [Google Scholar]
32. Ziyad Alarfaj,, “ThePlace: Mina, the valley of the Pilgrims,” 2018. [Online]. Available: https://www.arabnews.com/node/1361536/saudi-arabia. [Accessed: 24-Nov-2020]. [Google Scholar]
33. J. Petäjäjärvi, K. Mikhaylov, A. Roivainen, T. Hänninen and M. Pettissalo, “On the coverage of LPWANs: Range evaluation and channel attenuation model for LoRa technology,” in ITST, pp. 55–59, 2015. [Google Scholar]
34. The Things Network, 2020. [Online]. Available: https://www.thethingsnetwork.org/docs/lorawan/frequencies-by-country.html. [Accessed: 07-Dec-2020]. [Google Scholar]
35. Communication and Information Technology Commission, 2021. [Online]. Available: https://www.citc.gov.sa/en/Pages/default.aspx. [Accessed: 19-Jan-2021]. [Google Scholar]
 | This work is licensed under a Creative Commons Attribution 4.0 International License, which permits unrestricted use, distribution, and reproduction in any medium, provided the original work is properly cited. |