DOI:10.32604/csse.2021.014270
| Computer Systems Science & Engineering DOI:10.32604/csse.2021.014270 | |
| Article |
The Arcsine-X Family of Distributions with Applications to Financial Sciences
1Accounting Department, School of Business, Nanjing University, Nanjing 210093, China
2Department of Statistics, Yazd University, P.O. Box 89175-741, Yazd, Iran
*Corresponding Author: Eisa Mahmoudi, Email: emahmoudi@yazd.ac.ir
Received: 01 September 2020; Accepted: 09 October 2020
Abstract: The heavy-tailed distributions are very useful and play a major role in actuary and financial management problems. Actuaries are often searching for such distributions to provide the best fit to financial and economic data sets. In the current study, a prominent method to generate new distributions useful for modeling heavy-tailed data is considered. The proposed family is introduced using trigonometric function and can be named as the Arcsine-X family of distributions. For the purposes of the demonstration, a specific sub-model of the proposed family, called the Arcsine-Weibull distribution is considered. The maximum likelihood estimation method is adopted for estimating the parameters of the Arcsine-X distributions. The resultant estimators are evaluated in a detailed Monte Carlo simulation study. To illustrate the Arcsine-Weibull two insurance data sets are analyzed. Comparison of the Arcsine-Weibull model is done with the well-known two parameters and four parameters competitors. The competitive models including the Weibull, Lomax, Burr-XII and beta Weibull models. Different goodness of fit measures are taken into account to determine the usefulness of the Arcsine-Weibull and other considered models. Data analysis shows that the Arcsine-Weibull distribution works much better than competing models in financial data analysis.
Keywords: Weibull distribution; arcsine function; financial sciences; maximum likelihood estimation; Monte Carlo simulation; comparative study
One of the most important functions in actuarial and financial science is to have an accurate prediction of financial losses that occur with a significant heavy monetary value. Underestimation in such losses leads to serious operational risks such as underestimating premium, collapse bankruptcy, etc. Actuaries often seek to propose flexible heavy-tailed distributions to avoid such situations and to provide accurate predictions of financial science losses.
Actuarial and financial data sets are generally positive [1], right-handed, unimodal-shaped, and heavy tails [2]. Right skewness can be better modeled by the skewed distributions [3]. Therefore, new different unimodal positively skewed parametric distributions have been introduced to model such data; see [4–8]. The new distributions have been introduced in many different ways such as (i) transformation of variables; see [9,10], (ii) composition of two or more distributions; see [11,12], (iii) mixture distributions; see [13,14], and (iv) compounding of distributions; see [15,16]. For detailed information on proposing new methods, we refer to [17].
The introduction of new distributions using the methods mentioned above leads to a heavy-tailed distribution. Unfortunately, however, the above methods have certain limitations. For example, (i) the number of parameters is increased, causing difficulty in estimating the parameters of the model, (ii) the introduction of additional parameter(s) to the model brings more flexibility, however, usually such practices causing re-parameterization problems, (iii) using the method of composition and mixture distributions, the form of probability density function (pdf) becomes complicated, leading to computational problems, and (iv) some new proposed distributions using above methods do not have closed-form of cumulative distribution function (cdf) which makes the manual computation of statistical properties more difficult. The introduction of additional parameters to the existing models brings more flexibility which is a desirable feature. Unfortunately, it makes the inferences more complicated.
In the light of the above discussion, researchers are encouraged to introduce new distribution or distribution family with a simple pdf expression and a closed form of cdf. Therefore, in this article, an effort has been made to propose a new distributions family to avoid the issues discussed above and to provide the best fit to financial data sets. The proposed family is introduced using trigonometric function and can be called arcsine-X (with the short form of 'AS-X'). The proposed family can be found as a special model of the arcsine exponentiated-X family; see [18]. The AS-X family has a closed cdf form and a simple pdf expression. A random variable X is said to have the AS-X family, if its cdf is
where
The sf (survival function) and hrf (hazard rate function) of the AS-X distributions are
and
This paper is arranged as: A special case of the AS-X family is presented in Section 2. Mathematical properties of the AS-X distributions are presented in Section 3. The parameters of Arcsine-Weibull distribution are estimated in Section 4. In the same section, the Monte Carlo simulation study is provided. Real-life applications are analyzed in Section 5. Here, the proposed model is compared to the competitive model under various discriminatory measures and goodness of fit criteria. The last section concludes the article.
2 The Arcsine-Weibull Distribution
In this section, we introduce the AS-Weibull (AS-W) distribution. Consider the Weibull random variable say X, with cdf
The density function and corresponding to Eq. (3) is given by
The density plots of the AS-W distribution are sketched in Fig. 1.
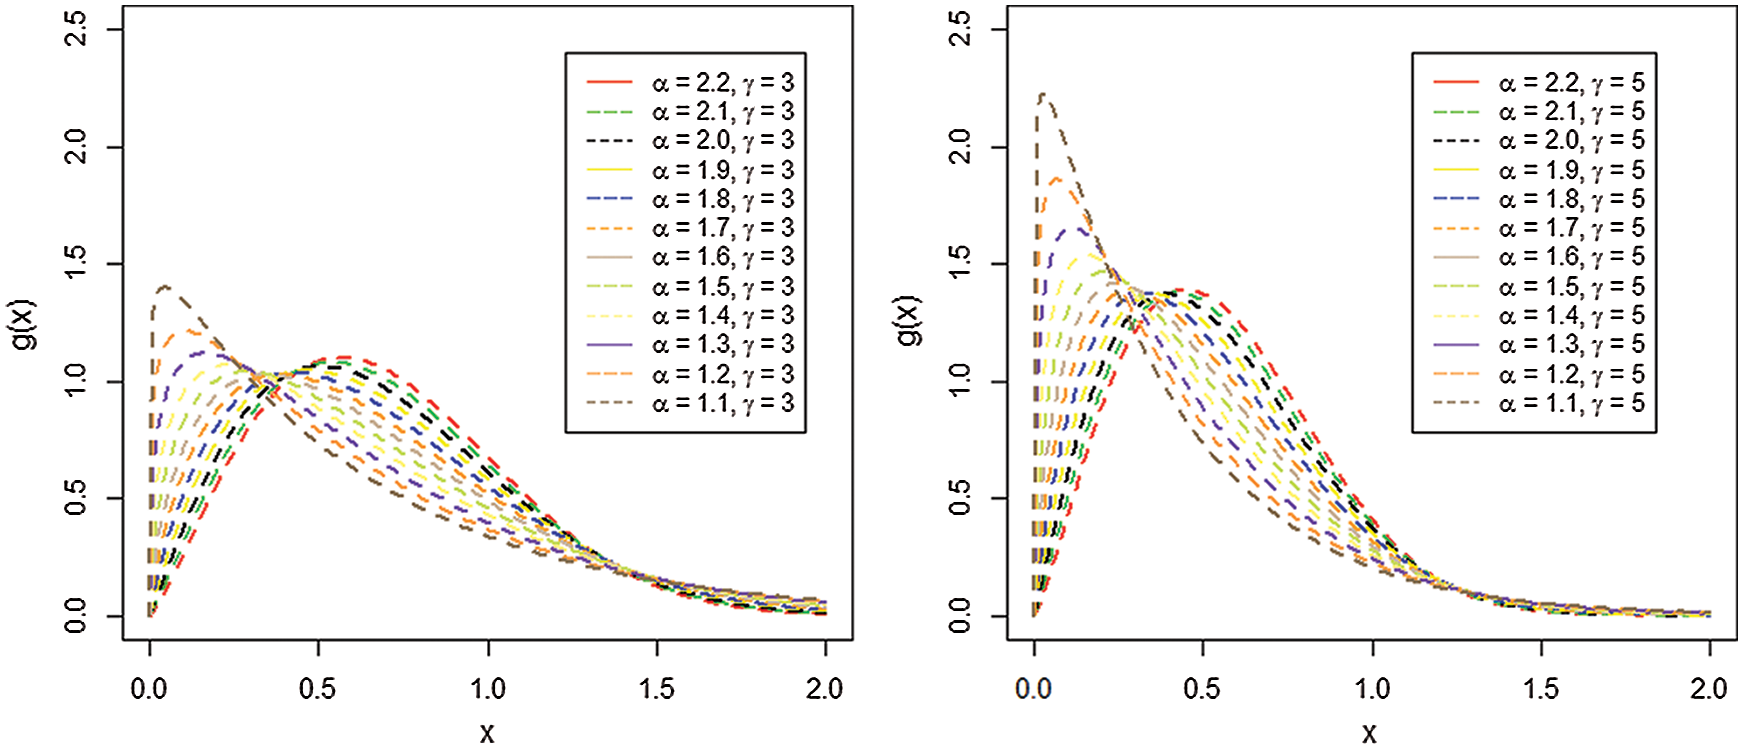
Figure 1: Plots for the pdf of the AS-W distribution for selected values of the model parameters
In this section, some statistical properties such as the quantile function and moments are derived. The quantile function is very useful in generating random number for the simulation study, where the first four moments offers the basic characteristics of the AS-X distributions.
Let X be the AS-X distributed random variable with pdf given by Eq. (2), the quantile function of X, say
where,
Moments play an essential role in statistical and financial analysis, especially in the applications. It helps to capture the essential features and characteristics of the distribution. The
Using Eq. (2) in Eq. (6), we get
Using the binomial expansion, we have
Let
Using Eq. (9) in Eq. (7), we get
Where
Furthermore, a general expression for moment generating function (mgf) of the AS-X family is given by
4 Maximum Likelihood Estimation and Monte Carlo Simulation
This section provides the maximum likelihood estimation and a brief Monte Carlo simulation study to test the performance of the estimators
4.1 Maximum Likelihood Estimation
This subsection deals with the MLEs (maximum likelihood estimators) of the parameters of AS-X distributions. Let
Obtaining the partial derivative of Eq. (11), we get
Setting
4.2 Monte Carlo Simulation Study
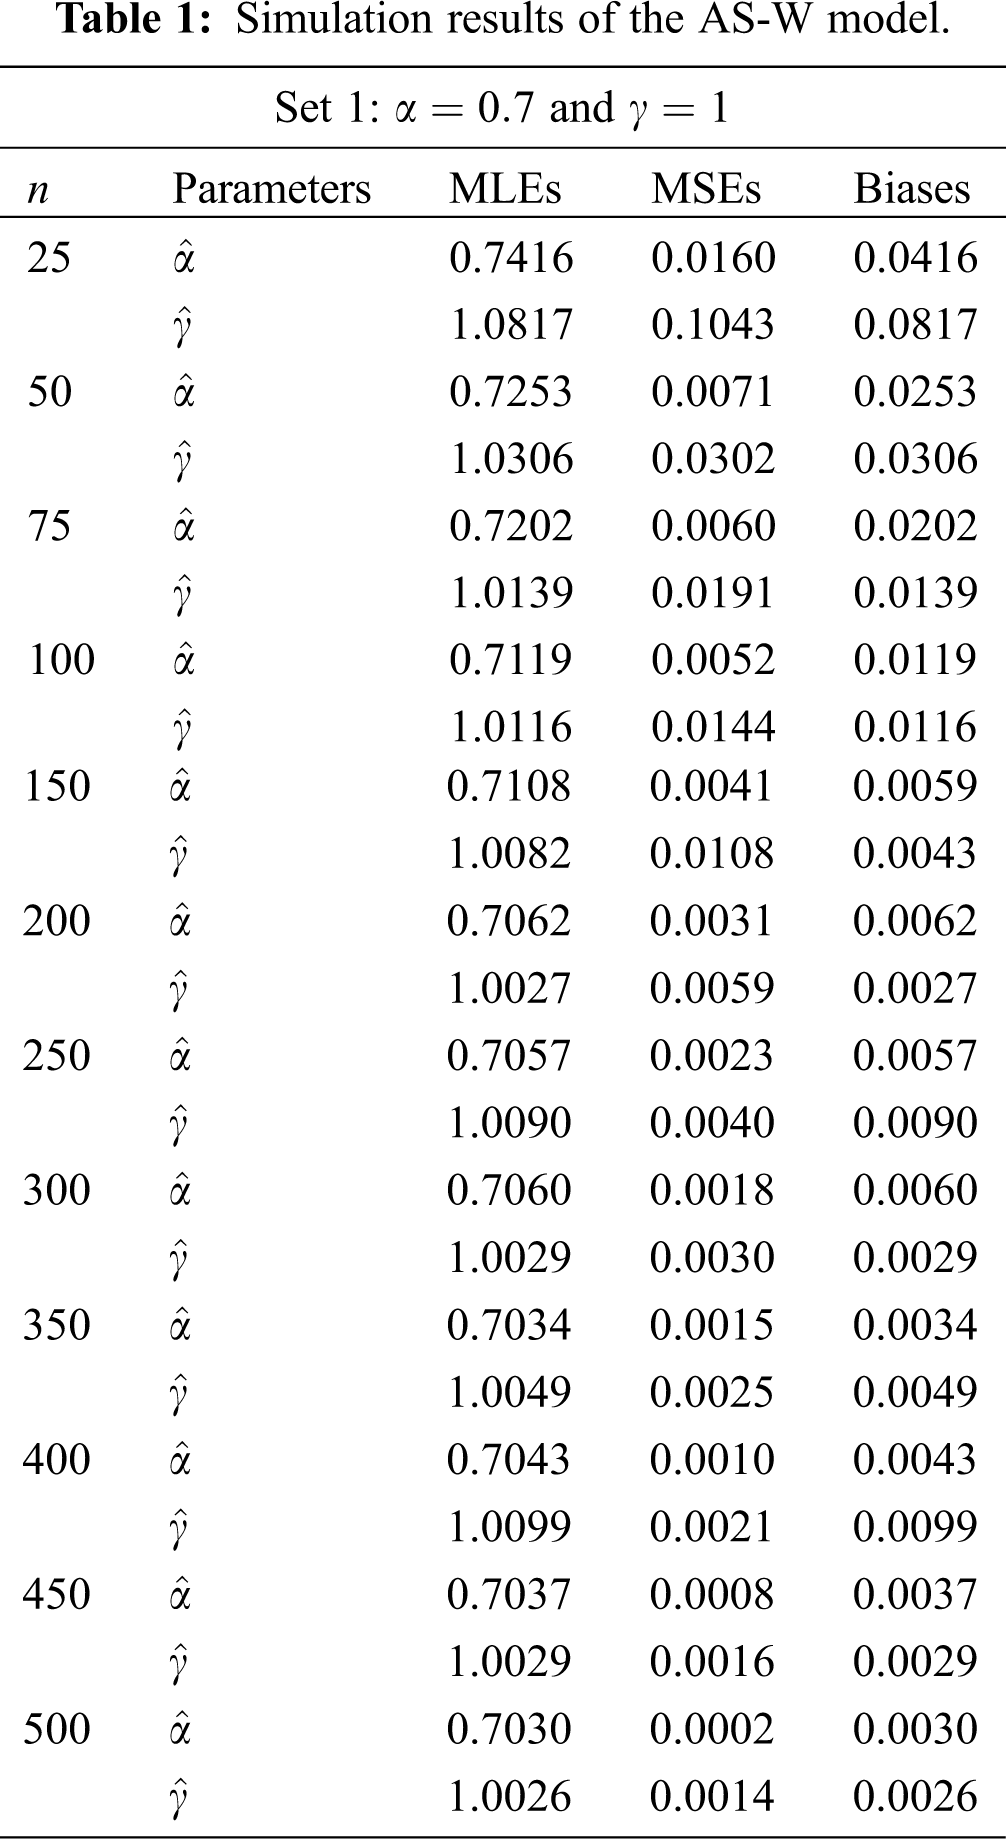
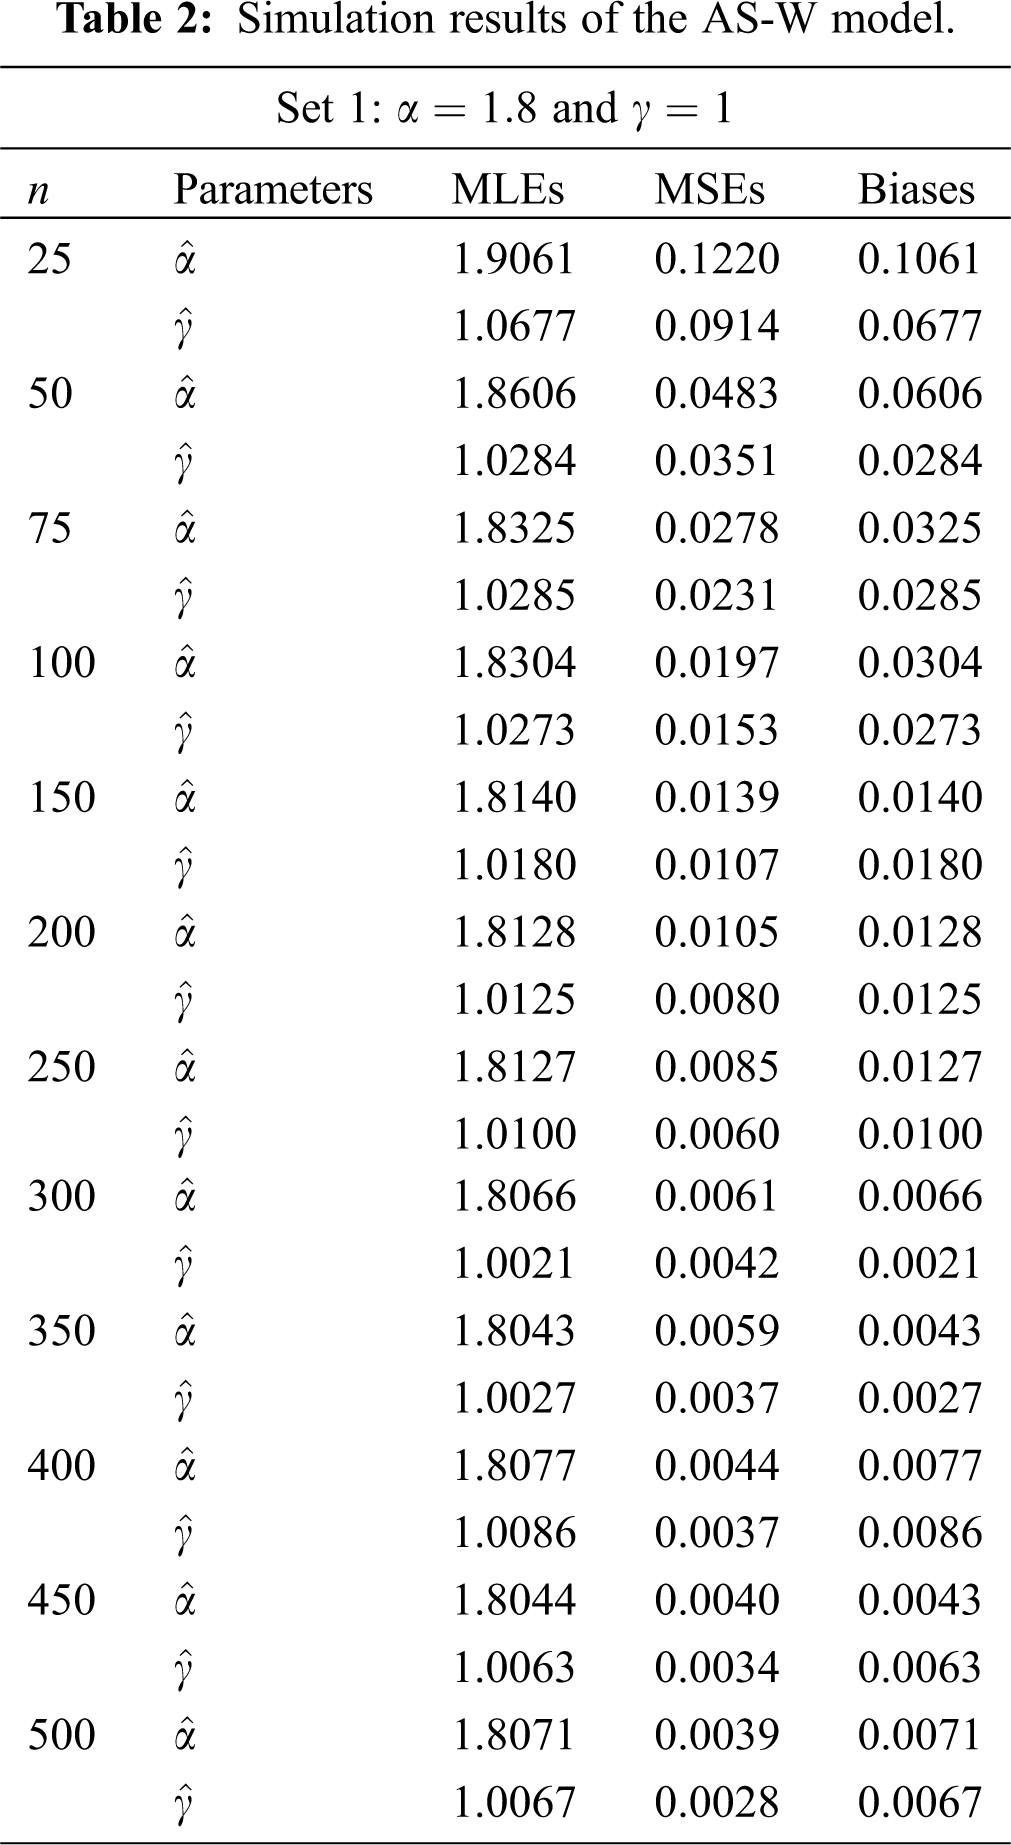
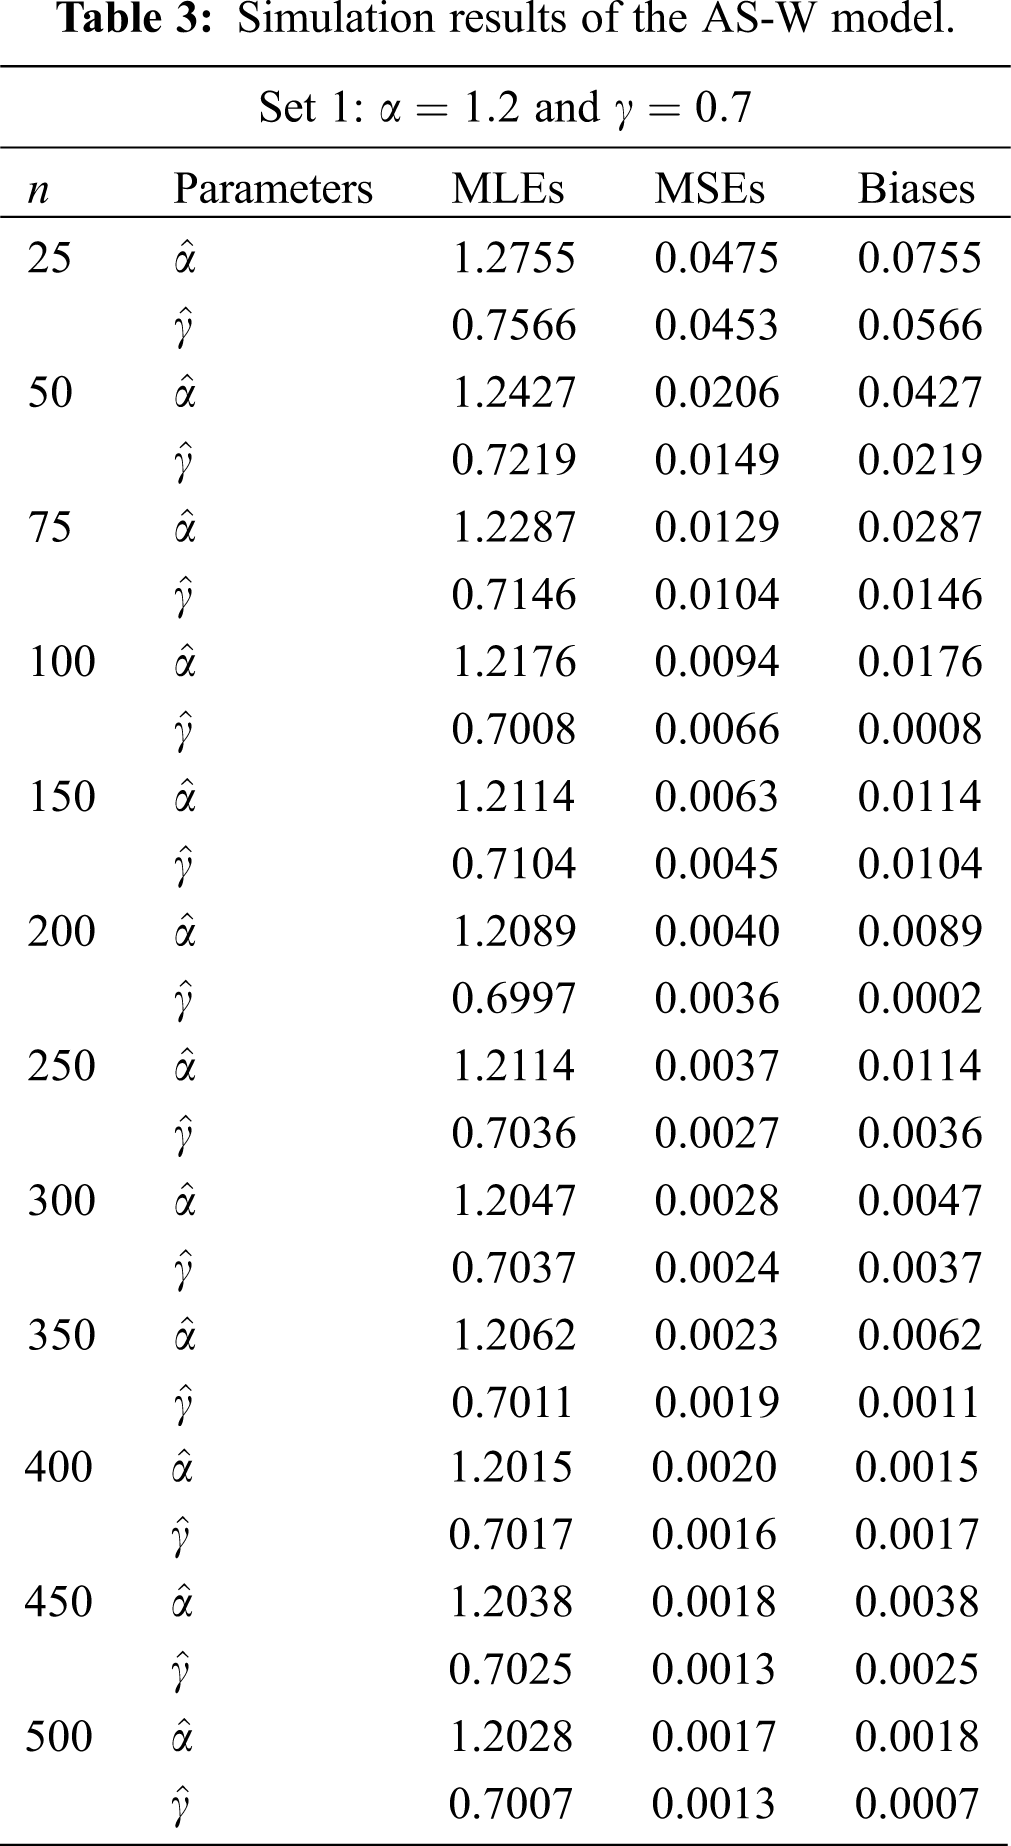
In this sub-section, we evaluate the MLEs of the AS-W distribution. A numerical evaluation is done to examine the performance of MLEs of the AS-W model via the optim() R-function with the argument method = "L-BFGS-B". The evaluation was performed based on the biases and the empirical mean square errors (MSEs) using the R package. The numerical steps are as follows:
i) A random sample
ii) The MLEs of AS-W model are obtained.
iii) 500 repetitions are made to calculate the biases and the MSE of these estimators.
iv) Formulas used for calculating bias and MSE are given by
v) Step (iv) is also repeated for the other parameter
vi)
The simulation results are provided in Tabs. 1-4. From the simulation study (Tabs. 1-4), we can detect that the estimates are relatively stable and are close to the actual value of the parameters as the sample sizes increases. We can also observe that as the sample size increase the Biases and MSEs decay to zero.

5 Applications to Financial Sciences
In this section, we consider two real life applications from financial sciences. For these data sets, the AS-W distribution is compared with the other well-known distributions such as two-parameter Weibull, two-parameter Lomax distribution, three-parameter Weibull-Loss (W-Loss) model, four-parameter Burr-XII (B-XII), and a four-parameter beta Weibull (BW) distribution. The cdfs of these models are:
• Weibull distribution
• Lomax distribution
• B-XII distribution
• BW distribution
• W-Loss distribution
To determine the best fitting capabilities of the applied distributions, we look at certain analytical measures. In this regard, we consider two measures of discrimination such as the Akaike information criterion (AIC) and Bayesian information criterion (BIC). In addition to the measures of discrimination, we also consider other goodness of fit measures such as Anderson Darling (AD) test statistic, Cramer Von-Messes (CM) test statistic and Kolmogorov-Smirnov (KS) test statistics with associating p-values.
A model with smallest analytical measures values is considered a good candidate model among the distributions taken for analyzing data sets. By looking at these analytical tools, we have noticed that the AS-W distribution provides the best fit compare to other distributions because the it has the smallest values of the considered measures.
5.1 The Vehicle Insurance Loss Data
This data set representing vehicle insurance losses taken from [19]. We fitted the AS-W and other distributions to this data set. The parameter values are reported in Tab. 5, and the analytical measures are presented in Tab. 6. From the results obtained in Tab. 6, we can see that for the AS-W distribution, the values of AIC=428.018, BIC=430.956, CM=0.024, AD=0.152, KS=0.103 and p-value is 0.846 against the model (W-Loss) with the second smallest values are AIC=430.856, BIC=433.965, CM=0.031, AD=0.208, KS=0.128 and p-value is 0.665.
The estimated cdf and Kaplan-Meier survival plots of the AS-W distribution are presented in Fig. 2. The PP (probability-probability) and the QQ (quantile-quantile) plots of the AS-W distribution are provided in Fig. 3.


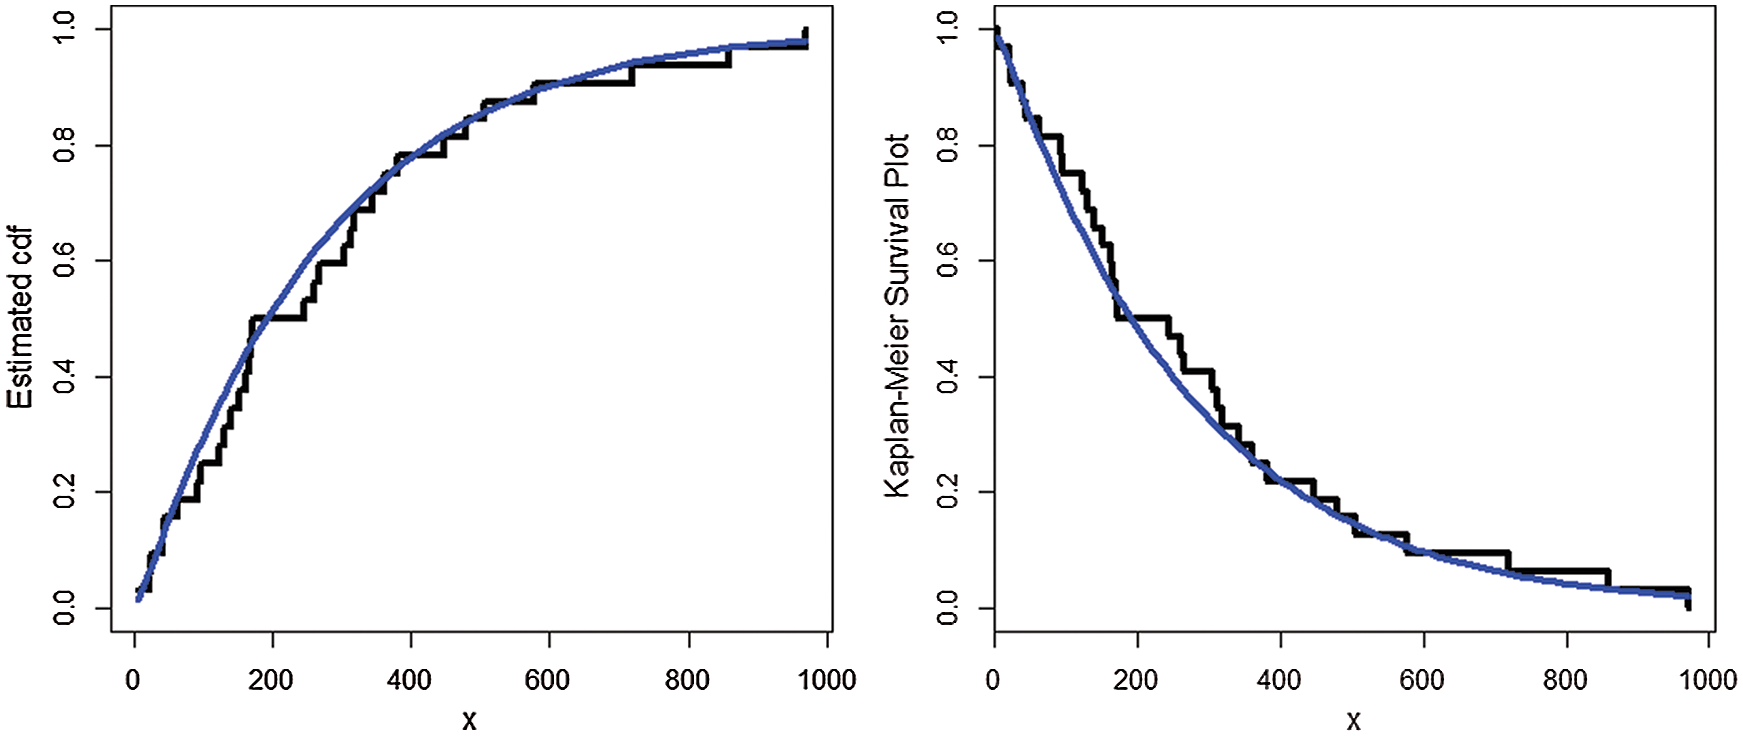
Figure 2: Estimated cdf and Kaplan-Meier survival plots of the AS-W distribution for the first data set
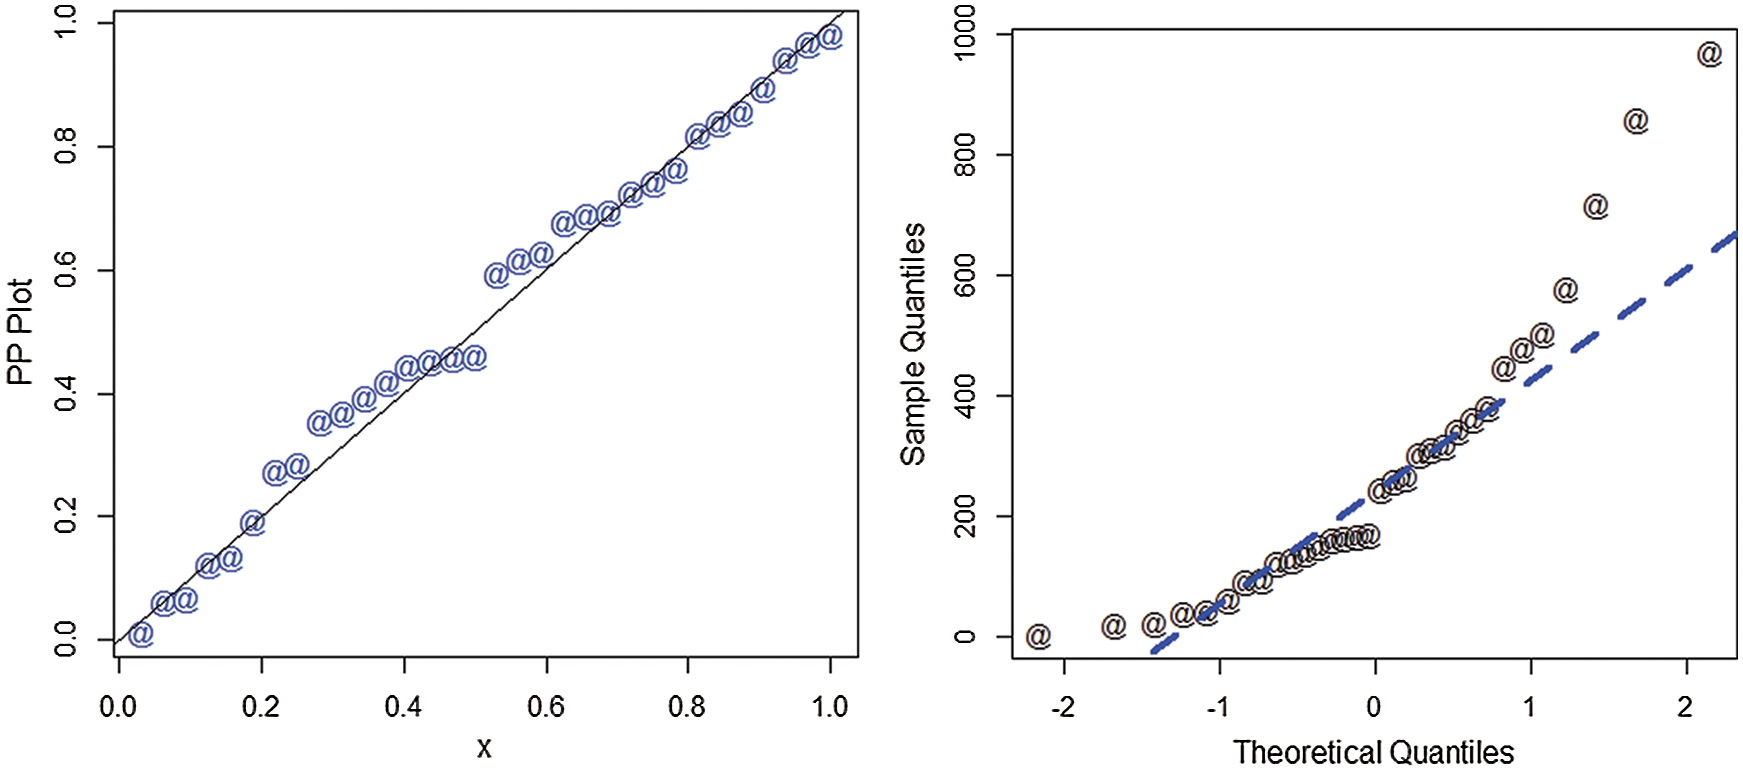
Figure 3: PP and QQ plots of the AS-W distribution for the first data set
5.2 The Earthquake Insurance Data Set
In this sub-section, we consider second data set related to the earthquake insurance available at: https://earthquake.usgs.gov/data/. The data has already been studied by [19]. For this data set, we also compared the AS-W distribution to other distributions mentioned above. For the second data set, the MLEs of the competing models are provided in Tab. 7. The discrimination measures and goodness of fit measures are provided in Tab. 8. From the results obtained in Tab. 8, we can see that for the AS-W distribution, the values of AIC = 27439.37, BIC = 27455.12, CM = 6.837, AD = 0.771, KS = 0.016 and p-value is 0.695 against the model (W-Loss) with the second smallest values are AIC = 27451.37, BIC=27461.12, CM = 7.185, AD = 0.813, KS = 0.019 and p-value is 0.598.
For this data set, the estimated cdf and Kaplan-Meier survival plots of the AS-W distribution are presented in Fig. 4. The PP and the QQ plots of the AS-W distribution are provided in Fig. 5.


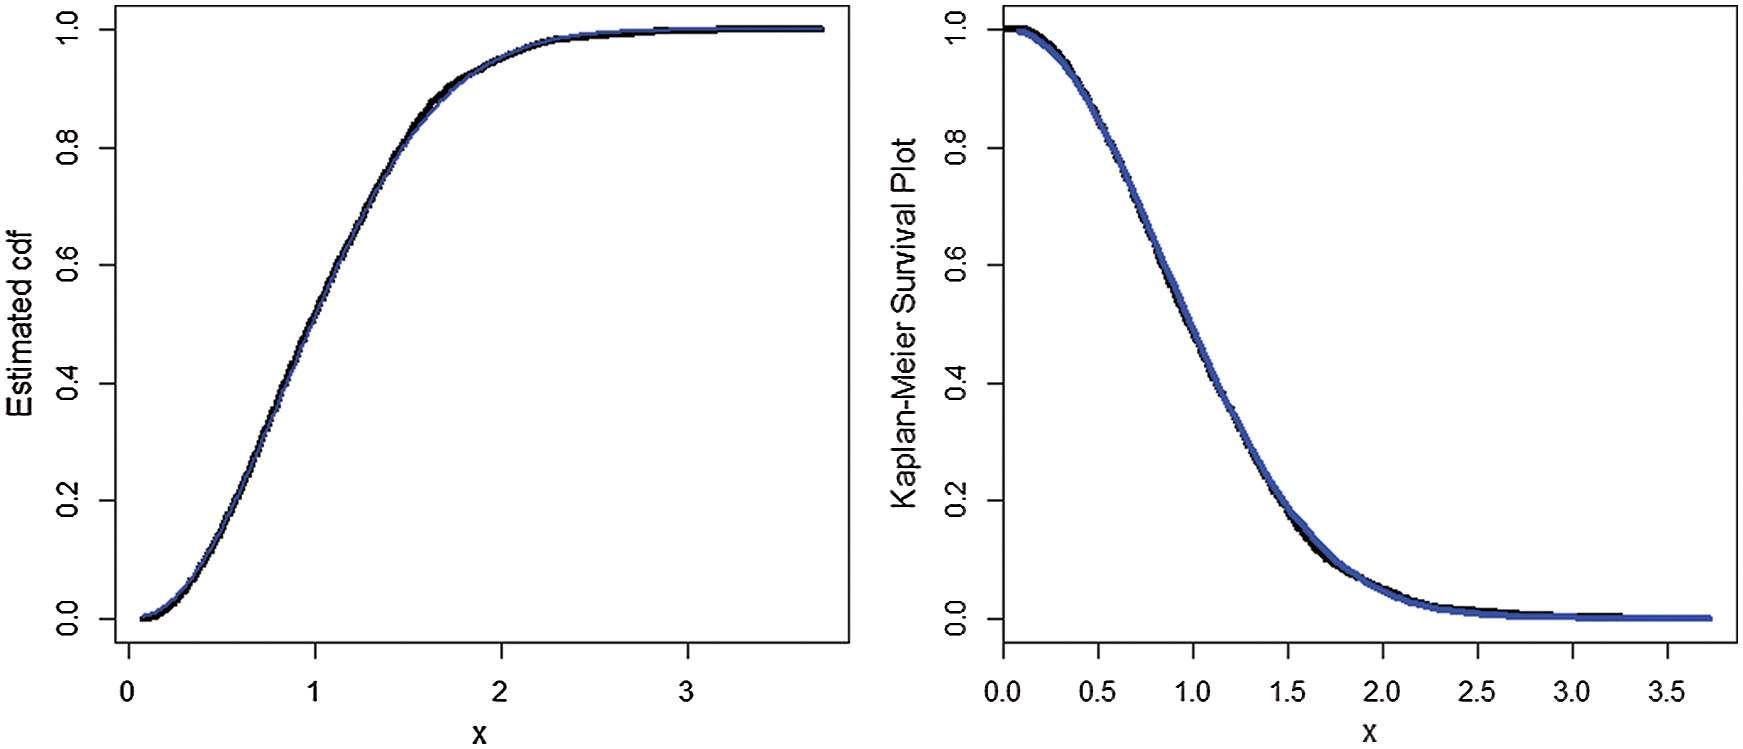
Figure 4: Estimated cdf and Kaplan-Meier survival plots of the AS-W distribution for the second data set
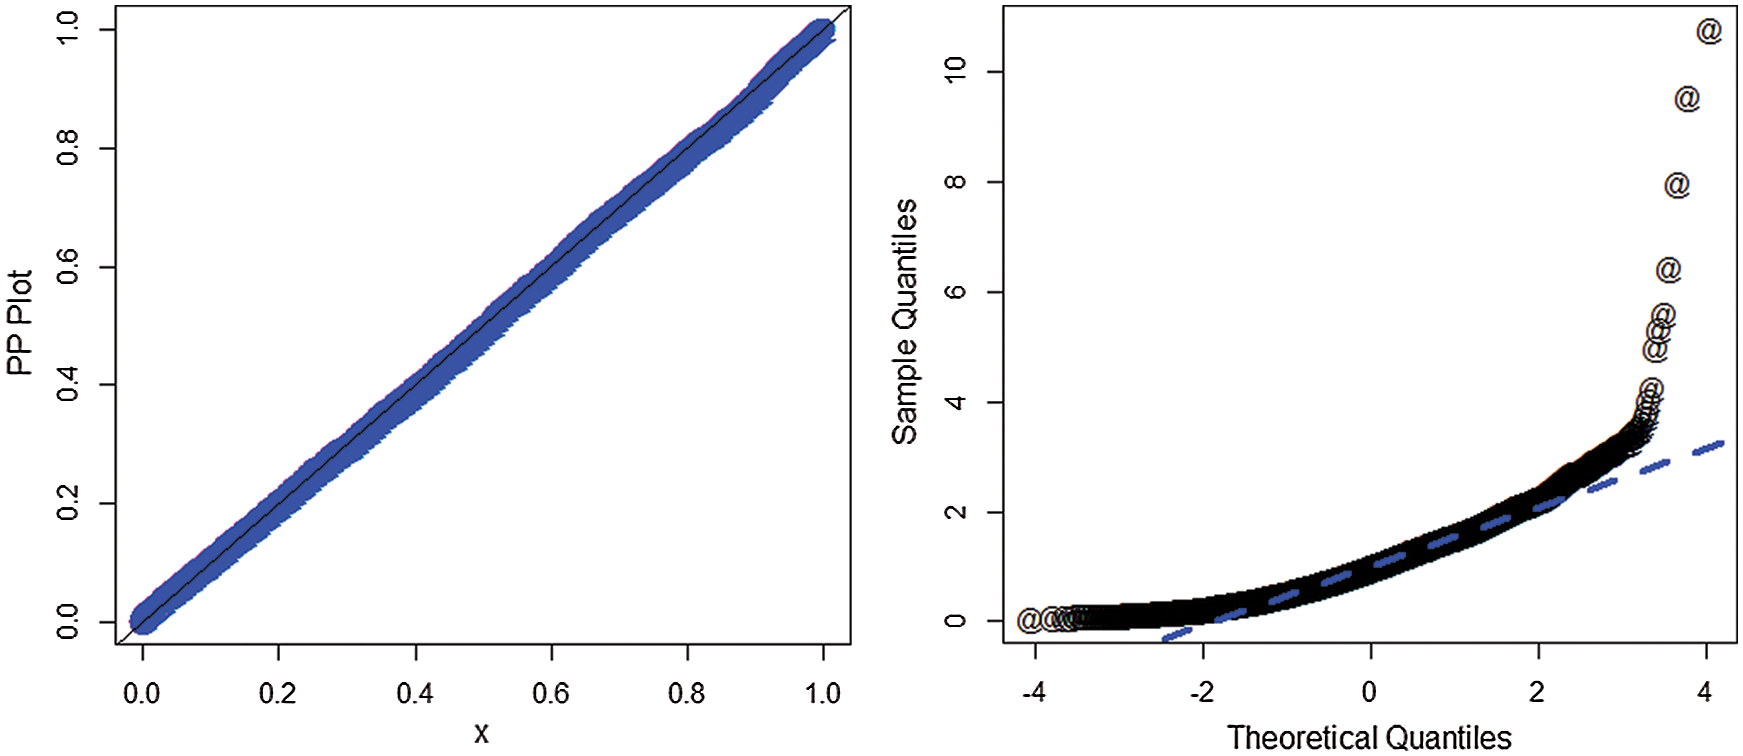
Figure 5: PP and QQ plots of the AS-W distribution for the second data set
Statistical theory addresses the nature of uncertainty and provides a rational framework for dealing with financial decision-making problems. Financial data sets are mostly skewed to the right, and the skewed distributions are reasonable candidate models for such type of data. Keeping in view the importance of statistical distributions, an attempt has been made to propose a new distribution family using the trigonometric function. The proposed method is called the AS-X distributions family. A special model of the AS-X family offers best fitting in financial data analysis. The AS-W distribution is applied to the vehicle insurance losses and earth quick insurance data sets. Comparison of the AS-W model was made to some well-known competitors such as Weibull, Lomax, BX-II and beta-Weibull distributions. Comparisons were made based on two discriminatory measures (AIC and BIC) and three goodness of fit measures (CM, AD and KS test statistics with corresponding p-values). Using these measures, it is observed that that the AS-W model could be a suitable model for analyzing heavy-tailed financial data.
Funding Statement: The author(s) received no specific funding for this study.
Conflicts of Interest: The authors declare that they have no conflicts of interest to report regarding the present study.
1. D. Bhati and S. Ravi, “On generalized log-moyal distribution: a new heavy tailed size distribution,” Insurance: Mathematics and Economics, vol. 79, no. 13–14, pp. 247–259, 2018. [Google Scholar]
2. Z. Ahmad, E. Mahmoudi and M. Alizadeh, “Modelling insurance losses using a new beta power transformed family of distributions,” Communications in Statistics-Simulation and Computation, vol. 49, no. 7, pp. 1898–1921, 2020. [Google Scholar]
3. M. Bernardi, A. Maruotti and L. Petrella, “Skew mixture models for loss distributions: a Bayesian approach,” Insurance: Mathematics and Economics, vol. 51, no. 3, pp. 617–623, 2012. [Google Scholar]
4. C. Adcock, M. Eling and N. Loperfido, “Skewed distributions in finance and actuarial science: a review,” European Journal of Finance, vol. 21, no. 13-14, pp. 1253–1281, 2012. [Google Scholar]
5. Z. Landsman, U. Makov and T. Shushi, “Tail conditional moments for elliptical and log-elliptical distributions,” Insurance: Mathematics and Economics, vol. 71, no. 42, pp. 179–188, 2016. [Google Scholar]
6. Z. Ahmad, E. Mahmoudi and S. Dey, “A new family of heavy tailed distributions with an application to the heavy tailed insurance loss data,” Communications in Statistics-Simulation and Computation, vol. 49, no. 7, pp. 1898–1921, 2020. [Google Scholar]
7. Z. Ahmad, E. Mahmoudi, S. Dey and S. K. Khosa, “Modeling vehicle insurance loss data using a new member of t-x family of distributions,” Journal of Statistical Theory and Applications, vol. 19, no. 2, pp. 133–147, 2020. [Google Scholar]
8. Z. Ahmad, E. Mahmoudi and G. G. Hamedani, “A class of claim distributions: properties, characterizations and applications to insurance claim data,” Communications in Statistics - Theory and Methods, vol. 715, pp. 1–26, 2020. [Google Scholar]
9. M. Eling, “Fitting insurance claims to skewed distributions: are the skew-normal and skew-student good models,” Insurance: Mathematics and Economics, vol. 51, no. 2, pp. 239–248, 2012. [Google Scholar]
10. T. Shushi, “Skew-elliptical distributions with applications in risk theory,” European Actuarial Journal, vol. 7, no. 1, pp. 277–296, 2017. [Google Scholar]
11. S. Nadarajah and S. A. Bakar, “New composite models for the Danish fire insurance data,” Scandinavian Actuarial Journal, vol. 2014, no. 2, pp. 180–187. [Google Scholar]
12. S. A. Bakar, N. A. Hamzah, M. Maghsoudi and S. Nadarajah, “Modeling loss data using composite models,” Insurance: Mathematics and Economics, vol. 61, no. 6, pp. 146–154, 2015. [Google Scholar]
13. A. Punzo, L. Bagnato and A. Maruotti, “Compound unimodal distributions for insurance losses,” Insurance: Mathematics and Economics, vol. 81, no. 13–14, pp. 95–107, 2018. [Google Scholar]
14. M. H. Tahir and G. M. Cordeiro, “Compounding of distributions: a survey and new generalized classes,” Journal of Statistical Distributions and Applications, vol. 3, no. 1, pp. 37, 2016. [Google Scholar]
15. T. Miljkovic and B. Grün, “Modeling loss data using mixtures of distributions,” Insurance: Mathematics and Economics, vol. 70, no. 6, pp. 387–396, 2016. [Google Scholar]
16. A. Punzo, A. Mazza and A. Maruotti, “Fitting insurance and economic data with outliers: a flexible approach based on finite mixtures of contaminated gamma distributions,” Journal of Applied Statistics, vol. 45, no. 14, pp. 2563–2584, 2018. [Google Scholar]
17. Z. Ahmad, G. G. Hamedani and N. S. Butt, “Recent developments in distribution theory: a brief survey and some new generalized classes of distributions,” Pakistan Journal of Statistics and Operation Research, vol. 15, no. 1, pp. 87–110, 2019. [Google Scholar]
18. W. He, Z. Ahmad, A. Z. Afify and H. Goual, “The arcsine exponentiated-x family: validation and insurance application,” Complexity, pp. 1–18, 2020. [Google Scholar]
19. Z. Ahmad, E. Mahmoudi, G. G. Hamedani and O. Kharazmi, “New methods to define heavy-tailed distributions with applications to insurance data,” Journal of Taibah University for Science, vol. 14, no. 1, pp. 359–382, 2020. [Google Scholar]
 | This work is licensed under a Creative Commons Attribution 4.0 International License, which permits unrestricted use, distribution, and reproduction in any medium, provided the original work is properly cited. |