DOI:10.32604/csse.2021.014464
| Computer Systems Science & Engineering DOI:10.32604/csse.2021.014464 | |
| Article |
Quantifying the Mechanical Properties of White Sandstone Based on Computer Fractal Theory
School of Mechanical and Electrical Engineering, Qingdao University of Science and Technology, Qingdao, 266061, China
*Corresponding Author: Yongyan Wang. Email: wangyongyan168@163.com
Received: 22 September 2020; Accepted: 27 October 2020
Abstract: The work presented in this paper was conducted to quantify the relationship between the pore characteristics and mechanical properties of white sandstone. The study include tests carried out under the coupling effects of chemical corrosion, temperature, nuclear magnetic resonance, and mechanical tests. Computer fractal theory was employed to describe and quantify the characteristics of the growth of pores in white sandstone under the same coupling effect. A custom developed program code, in the MATLAB software platform, was used for calculating the growths of the pores in white sandstone when subjected to coupling effects. The correlation between the computer fractal dimension of the growth of the pores in rock and characteristics of mechanical damage was accordingly analyzed. The results showed that when the temperature was set at a level lower than 100°C, it caused damage to the rock and strength reduction, primarily due to the rates of chemical reactions, the generation, and evolution of pores in the rock mass under the coupling effects of chemical corrosion and temperature. Overall, it was observed that the higher the value of the computer fractal dimension, the higher the growth of the pores, and the lower the uniaxial compressive strength of the white sandstone.
Keywords: White sandstone; pore characteristics; mechanical properties; MATLAB; chemical corrosion; temperature; fractal dimension; nuclear magnetic resonance
New pores usually appear in the rock mass due partly to chemical corrosion. As the corrosion further intensifies, additional pores will develop and grow, along with the previous pores inside the rock. Damage also concurrently occurs in the inside of the rock under the influence of temperature. The coupling effect of these two factors will further accelerate the deterioration of rock. Therefore, determining the growth status of the pore structures inside the rock and analyzing the relationship between the characteristics of the pore structure and the macro-mechanical properties of the rock in such conditions are of great significance as it sheds light on the mechanism of rock damage.
Fractal, a term derived from the Latin word Fractus, was first introduced to the field of natural sciences by Benoit Mandelbrot in the 1970s to characterize complicated graphics and complex processes. Without relenting, Mandelbrot promoted the fractal theory and its applications to a new evolutional stage in the subsequent years of his research [1,2]. Consequently, more and more researchers became cognizant that fractal theory constituted an effective methodology for quantifying complex and irregular pore structures. The theory has since been extended to more application fields [3–6].
Many researchers have devoted time to study the mechanical properties of rocks under the effects of a single environmental factor or the combined effects of multiple environmental factors, through the application of computer fractal theory in rock mechanics. Li et al. studied the damage characteristics of sandstone pore structure under freezing and thawing effects and associated the rock NMR results with mechanical failure characteristics [7–11]. Wang et al. conducted theoretical and experimental research on the damage model of deep soft rocks under multi-field coupling effects and analyzed its creep behavior [12–18]. Tang et al. conducted experimental studies on the macro-mechanical effects of rocks in a hydrochemical environment and analyzed the mechanism of rock damage caused by the hydrochemical environment [19–22]. Cai et al. [23] conducted an experimental study on the relationship between the mechanical properties and porosity of sandstone that had undergone hydrochemical corrosion. Concurrently, these researchers also conducted preliminary studies on the mechanism of chemical corrosion. The study results from other researchers show that the scale distribution and spatial distribution of mesoscopic defects (such as pores, cracks, etc.) in the rock structure and the distribution of rock fragmentation after macroscopic fracture featured distinctive fractal characteristics [24–28]. Computer fractal dimension can be used to quantitatively characterize the degree of damage and fragmentation of rocks. Chen et al. [29] conducted a fractal analysis on four types of artificial rock cores. With the computer fractal dimensions used, these researchers were able to satisfactorily classify the artificial rock cores into different categories. Xie et al. [30] concluded that the relationship between fluid flow and the heterogeneous structure and anisotropic physical properties of reservoir rocks can be better explained when the pore size distribution was employed in the analysis instead of fractal structure parameters.
However, the damage analysis in most of the above studies was based on the macro-mechanical parameters. The rock damage and degradation mechanism under the influence of a single environmental factor or multiple environmental factors were proposed based on conjecture, from the perspective of macroscopic appearance. In essence, this subjective deduction cannot fully nor accurately reflect the real damage of a rock from a mesoscopic perspective. Although some researchers have taken a lead in successfully using methods, such as nuclear magnetic resonance technology and computer fractal theory, to analyze the changing behavior of rock pore structure, under the influence of a single or the combined influence of multiple environmental factors. Besides, many researchers have also managed to successfully correlate the macro-mechanical parameters. However, the inaccurate processing of the pore image along with the existence of defects in the programming of computer fractal dimensions, often led to a certain deviation in the analysis results. Furthermore, there are relatively few studies on the mechanical properties of white sandstone under the coupling effects of chemical corrosion and temperature. Thus, the connection between the macroscopic mechanical properties of white sandstone and mesoscopic damage should be investigated along with the corresponding quantitative analysis.
Based on existing studies, white sandstone samples were first soaked in acidic, neutral, and alkaline solutions at different temperatures. The treated white sandstone samples were then subjected to nuclear magnetic resonance and uniaxial compression tests. The macroscopic mechanical property and mesoscopic damage of the white sandstone samples were then analyzed. Lastly, the fractal characteristics of the sandstone pore development were analyzed after the introduction of value filtering and edge processing to the programming of the computer fractal dimension. In this paper, the computer fractal dimension of pore evolution in the rock was successfully correlated to the macroscopic mechanical behavior. A quantitative analysis was also carried out to shed light on the mechanism of rock damage under the coupling effects of chemical corrosion and temperature.
2 Sample Preparation and Laboratory Test Scheme
2.1 Preparation of the Rock Samples
The rock samples were sourced from Zigong in Sichuan Province, China. The rock was characterized with good macroscopic homogeneousness. Thereafter, the rock was then fabricated into a standard rock sample with dimensions of 50 mm × 100 mm through cutting, coring, and sanding. This standard rock sample did not contain any obvious visual defects such as cracks or joints. The smoothness of its two ends was lower than 0.05 mm. Besides, the deviation of the angle between the two ends and the plane vertical axis was lower than 0.25°. XRD analysis (presented in Fig. 1) shows that the mineral composition of the rock sample comprised of 55.37% quartz, 41.6% kaolin, 2.3% polylithionite, and 0.7% calcite.
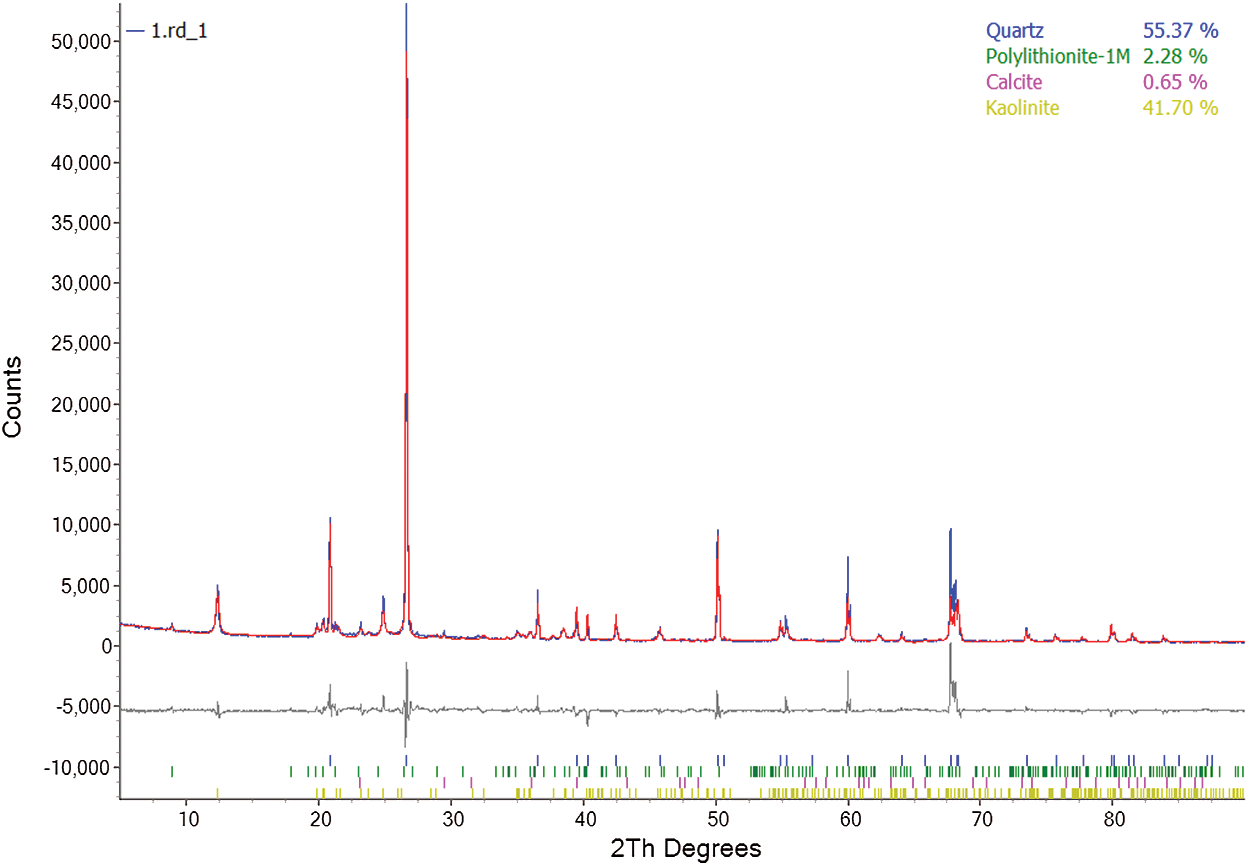
Figure 1: XRD spectra of the white sandstone samples
2.2 Rock Treatment and Laboratory Test Procedure
The steps of the test were as follows:
1. The rock samples were placed in an RPH-80, constant temperature and humidity chamber, and dried at a constant temperature of 25°C for 96 h.
2. About 20 L H2SO4 solution with a concentration of 0.1 mol/L and 20 L NaOH solution with the same concentration of 0.1 mol/L were prepared. Distilled water (20 L) was set as the control of the neutral pH environment.
3. The white sandstone samples were soaked in the as-prepared H2SO4 solution, NaOH solution, and distilled water, respectively. The solutions and distilled water with samples in them were then placed in the RPH-80 constant temperature and humidity chamber. The temperature inside the chamber was adjusted to 0, 25, 50, 75, and 100°C by adjusting the heating rate to different levels.
4. The samples will react with the chemicals during the soaking process, thus resulting in the shifting of the pH value of the solutions. Therefore, the pH value of the solutions should be monitored on daily basis during the soaking process. Besides, the pH value of the solutions should be adjusted to the original value by adding acidic or alkaline solutions into the original solutions. When the pH value of the 100°C H2SO4 solution no longer varied, the white sandstone samples were retrieved from the chemical solutions at different temperatures.
After the soaking treatment of the rock samples in the chemical solutions at different temperatures, the white sandstone samples were subjected to nuclear magnetic porosity test. This was done using a MesoMR23060HI magnetic resonance imaging analyzer. The samples were then subjected to a uniaxial compression test (with a monotonic loading rate of 50 N/S under the stress control mode) using a TAW-200 electronic multifunctional material mechanics testing machine. Lastly, the computer fractal dimension of the pores in the white sandstone, under the coupling effects, was obtained from computations using custom developed codes in the MATLAB software platform. The degree of pore development was analyzed and quantified using the fractal characteristics of the sandstone.
3 Analysis of NMR Images of White Sandstone
3.1 Macroscopic Mechanical Property of White Sandstone under the Coupling Effects
Tab. 1 shows the uniaxial compressive strength results of each rock sample under different coupling effects of chemical corrosion and temperature.
Table 1: Mechanical properties of the white sandstone under coupling effects

It can be seen from Tab. 1 that the uniaxial compressive strength of the rock samples under the coupling effects vary from one another. When the temperature was set at the same level, the uniaxial compressive strength of the samples in acidic and alkaline environments is lower than that in the neutral environment. In the same chemical (acid or alkali) environment, the uniaxial compressive strength of the samples decreases with an increase in the temperature and thereafter, remains constant at 0, 25, and 50°C, respectively. Once the temperature exceeds 75°C, the uniaxial compressive strength of the samples decrease sharply. In the neutral environment (pH = 7), the uniaxial compressive strength of the samples exhibit a gradually small declining trend with an increase in the temperature.
The reason is that when the temperature is lower than 100°C, the damage to the rock caused by temperature is negligible. At these temperature conditions, the rock damage and degradation is mostly due to the chemical (acid or alkali) environment, thus resulting in the decline in its uniaxial compressive strength. Higher temperature causes damage to the rock, thus reducing its strength mainly by affecting the rate of the chemical reactions.
3.2 Mesoscopic Damage of White Sandstone After the Coupling Effects
Two-dimensional nuclear magnetic resonance images that represent the position of the central cross-section of each rock sample are presented in Fig. 2. The information of the uniaxial compressive strength of each rock sample is also included in Fig. 2. The bright area in each image is the area where water molecules are located, and the surrounding area in black is the background of the image. The brightness of the image reflects the water content in the rock. Specifically, the brighter the color, the higher the water content in this area, which further indicates a higher porosity in the area. Based on these interpretive features, MRI can provide a visual distribution of pore sizes inside the rock sample.
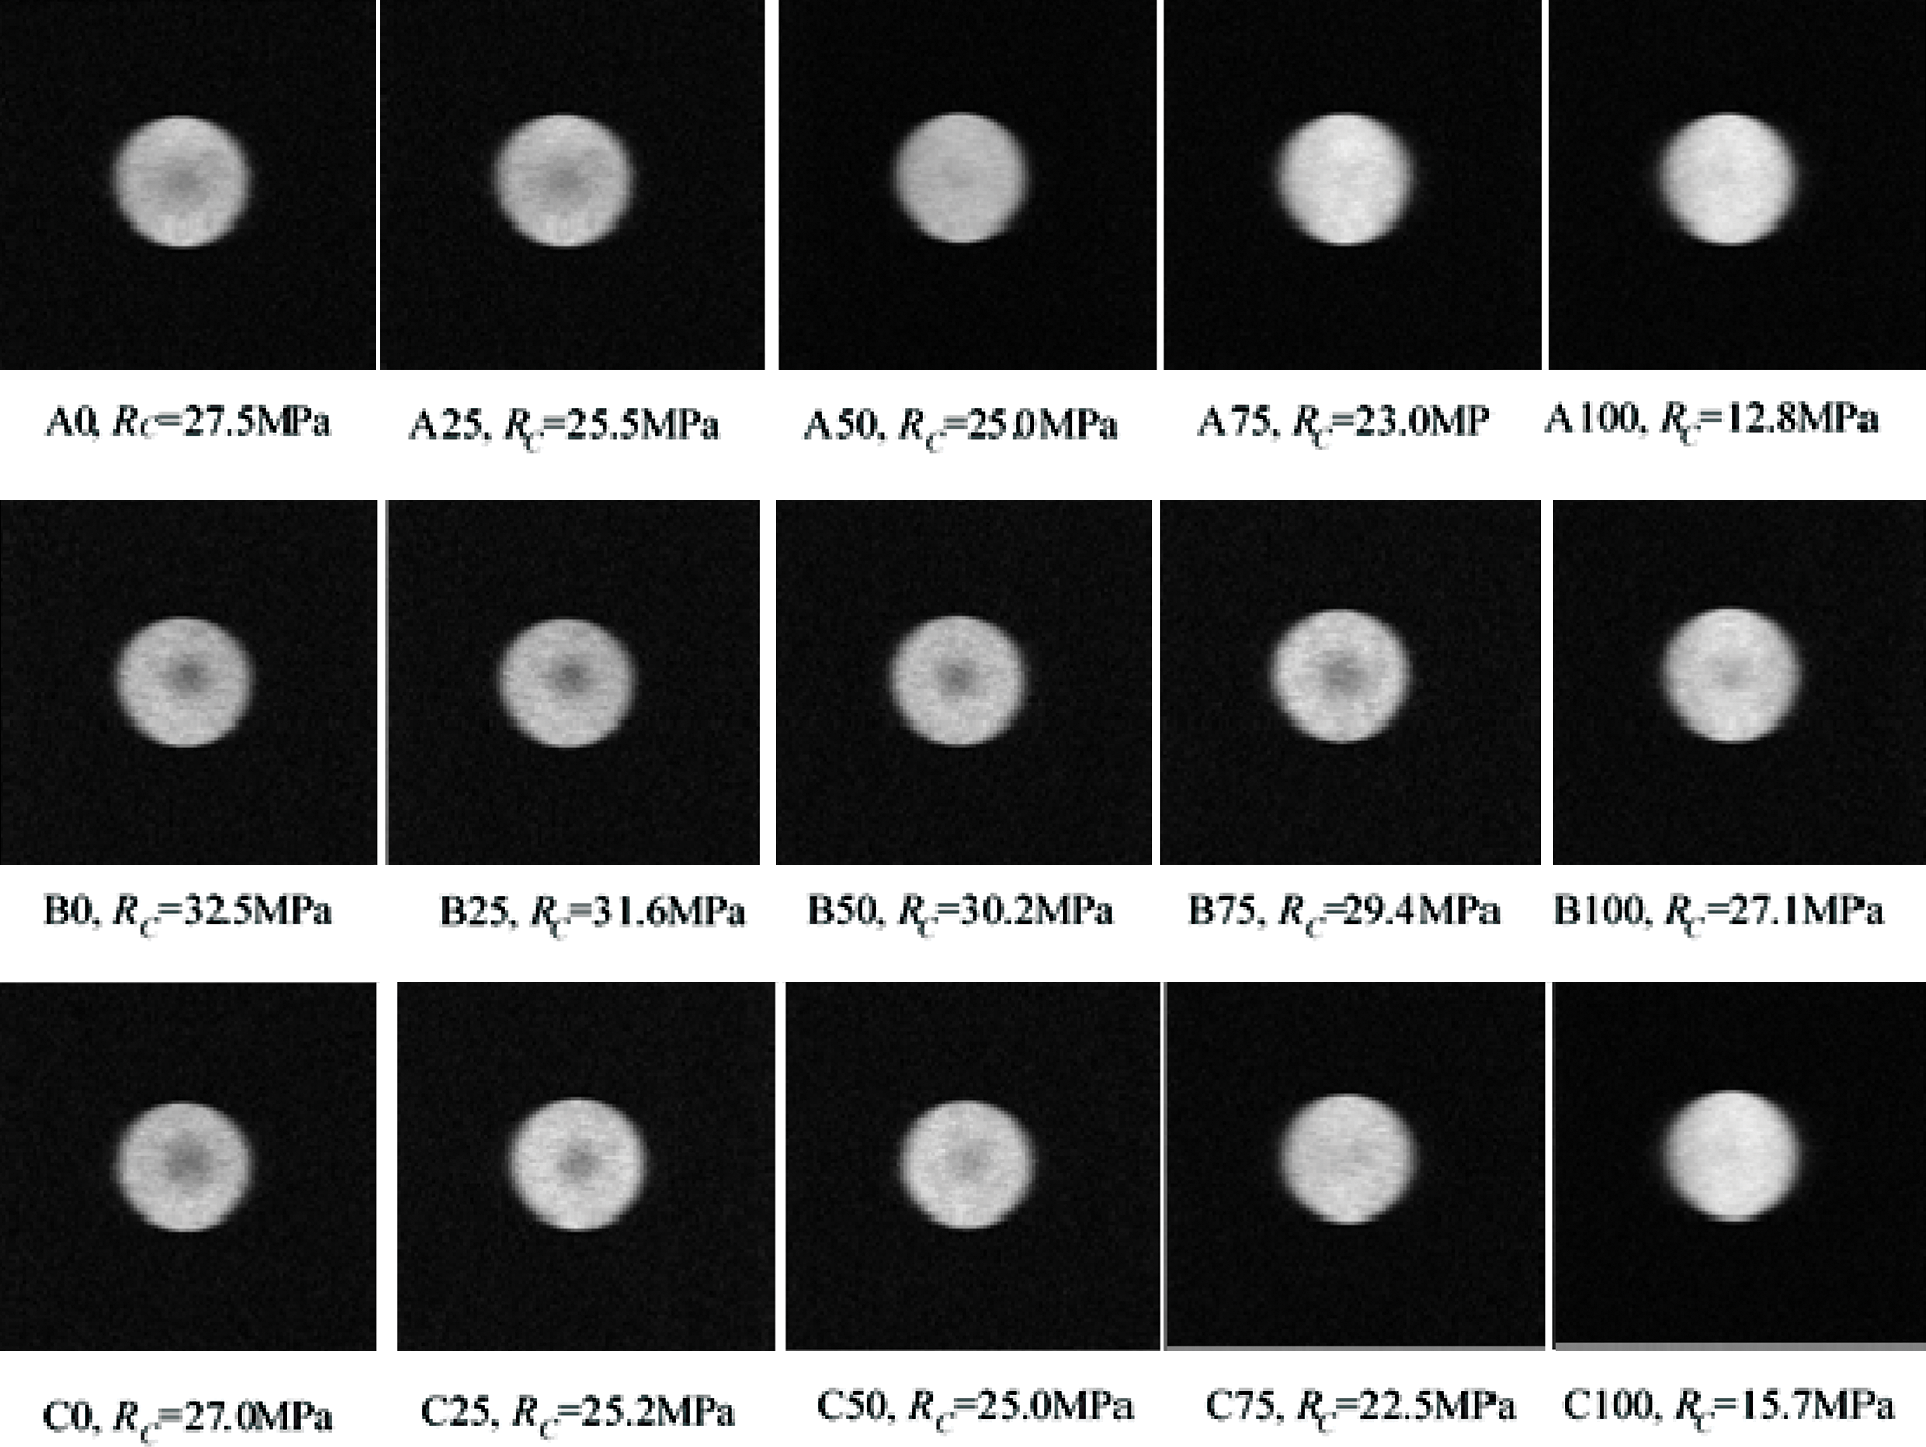
Figure 2: Relationship between the NMR images of different rock samples and their uniaxial compressive strength values
It can be seen from Fig. 2 that in an acidic or alkaline environment, the corrosion of the rock samples caused by the chemical solution gradually intensifies with an increase in the temperature. Specifically, new pores first appear in the rock samples and then, gradually develop and increase along with an increase of the initial pores in the whole rock mass. In a neutral environment, no distinct corrosion of the rock samples triggered by water can be observed as the temperature is increased. Besides, for the initial pores in the rock mass that remained unchanged there were no new pores that appeared in the rock samples.
The reason is that in an acidic or alkaline environment, minerals such as kaolin in the rock sample undergo chemical reactions with H2SO4 or NaOH to form water-soluble substances. Furthermore, an increase in temperature promotes the chemical reaction rate, resulting in the occurrence of new pores or an increase in the size of initial pores. In a neutral environment, minerals in the rock sample hardly dissolve in water or react with water.
4 Distribution Characteristics of White Sandstone
Various geometric properties of the rock, such as pore distribution, crack distribution, crack density, fracture toughness, etc., all exhibit fractal characteristics. Without doubt, fractal theory has become an indispensible bridge between macroscope and microscope. The coupling effects of chemical corrosion and temperature results in the appearance of new pores in the rock mass. These pores inherently affect and to some extent govern the mechanical properties of the rock. Therefore, fractal theory can be used to describe the characteristics of the pore distribution, thus quantitatively illustrating the relationship between pores and mechanical properties of the rock.
The NMR images of the rock obtained via MRI technology veritably reflect the characteristics of the pore growth. It raises the possibility for the calculation of the pore fractal dimension. In this paper, the box dimension was used to mathermatically characterize the fractal characteristics of the pores in the rock under the coupling effects of chemical corrosion and temperature. The computational characterization is based on Eq. (1) as expressed below:
where Ds is the fractal dimension of the pore in the rock under the coupling effects; r is the side length of the square box; N(r) is the number of boxes required in the coverage of the whole graph by the square boxes with a side length of r.
According to the MRI images in the center area of each rock sample presented in Fig. 2, the characteristic information of the pores in the images can be obtained. The computer fractal dimension was calculated using a custom developed program code in the MATLAB software platform. The box number N(r), which corresponds to the side length r was obtained. The logarithmic coordinates of r and N(r) were subjected to regression analysis. The absolute value of the slope of the fitted curve is the computer fractal dimension of the pore structure. The correlation coefficient (R) can also be determined from the regression analysis.
During program execution and running the MATLAB code, the data was subjected to median filtering after image binarization to improve accuracy and precision of the pore image. During computer fractal dimension programming, the edges were first marked out in the grayscale image. The computer fractal dimension of the area within this boundary area was calculated. The interference outside of the pore graphics was ruled out to ensure a more accurate and precise calculation of the computer fractal dimensions. The computer fractal dimension of a Sierpinski triangle is 1.58. The box dimension calculated in this study was 1.58210, indicating that computational results with very high precision can be obtained with custom developd program codes. This ultimately improves the accuracy of the calculation results of the computer fractal dimension analysis.
Each MRI image was subjected to the measurement of computer fractal dimension of the pores in the rock. The computer fractal dimension of each sample was thereafter calculated and the results are listed in Tab. 2.
Table 2: Results of fractal dimension analysis of the rock samples

It can be seen from Tab. 2 that the computer fractal dimension (D) of the pores in each rock sample is higher than 1.0. The computer fractal dimension varies within a short-range. The correlation coefficient of computer fractal dimension for each MRI image is greater than 0.97. This indicates that the spatial distribution of the rock pore growth under the different coupling effects has fractal characteristics within a certain consistent scale from a statistical perspective.
Fig. 3 shows the variation of the fractal dimension (D) under different coupling effects of chemical corrosion and temperature. In the figure, the Legend A represents acidic conditions, B neutral conditions, and C alkaline conditions.
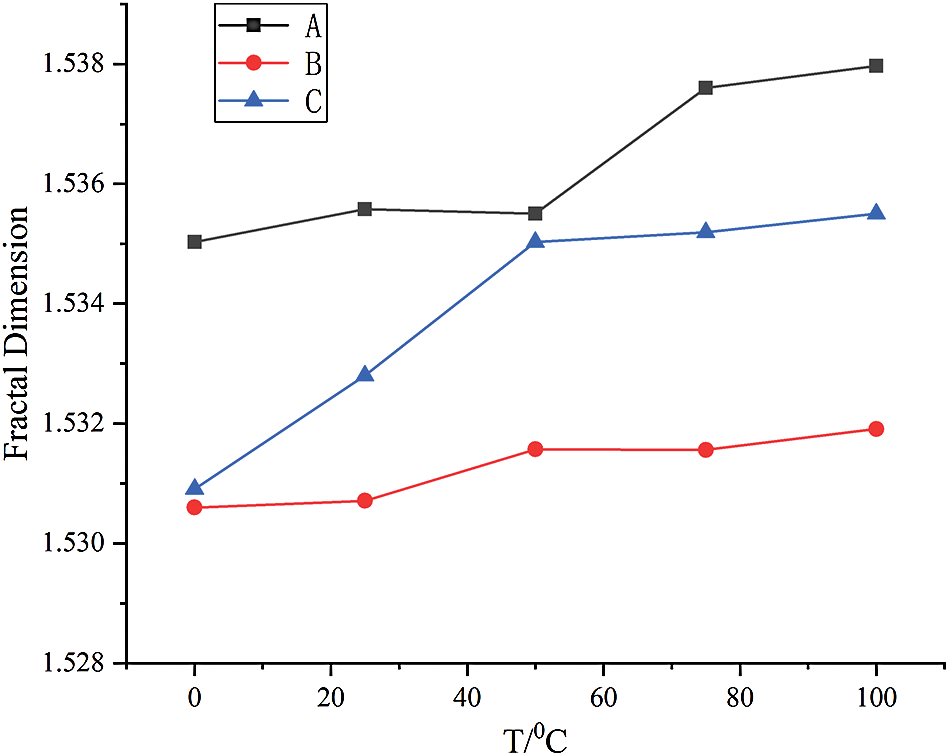
Figure 3: Variation of the fractal dimension (D) under different coupling effects of chemical corrosion and temperature
It can be seen from Fig. 3 that the computer fractal dimension under acidic (A) conditions is quantitatively larger than that under alkaline (C) or neutral (B) conditions. Also, the computer fractal dimensions under alkaline (C) conditions is larger than that under neutral (B) conditions (DAcidic > DAlkaline > DNeutral). Theoretically, the larger the computer fractal dimension (D) of the pore distribution in the rock, the more grown the pores are and the more irregular the distribution is. Therefore, the pores in the white sandstone under acidic and alkaline conditions have relatively larger sizes and more irregularly distributed. The results further infer that pores have smaller sizes and more evenly distributed under neutral conditions.
The computer fractal dimension (D) of the pores in the white sandstone under acidic and alkaline conditions exhibits an overall increasing trend with an increase in the temperature. Under neutral conditions, the computer fractal dimension (D) of the pores remains unchanged with an increase in the temperature. Overall, the above results suggest that as the number of pores in the white sandstone increases with an increase in temperature under acidic and alkaline conditions, the pore sizes become larger and the pore distribution becomes more uneven as well. Under neutral conditions, whilst the number of pores exhibited an increasing trend with increasing temperature, the pore distribution remained unchanged.
The probable reason is that the white sandstone underwent corrosion in acidic or alkaline environments. As a result, new pores appeared and the initial pores became larger. Besides, the high temperature accelerated the rate of chemical reactions. However, in the neutral environment (pH = 7), the white sandstone remains unchanged even with an increase in temperature.
Fig. 4 shows the relationship between the fractal dimension and the uniaxial compressive strength of white sandstone under different coupling effects of chemical corrosion and temperature. Similar to Fig. 3, Legend A represents acidic conditions, B neutral conditions, and C alkaline conditions.
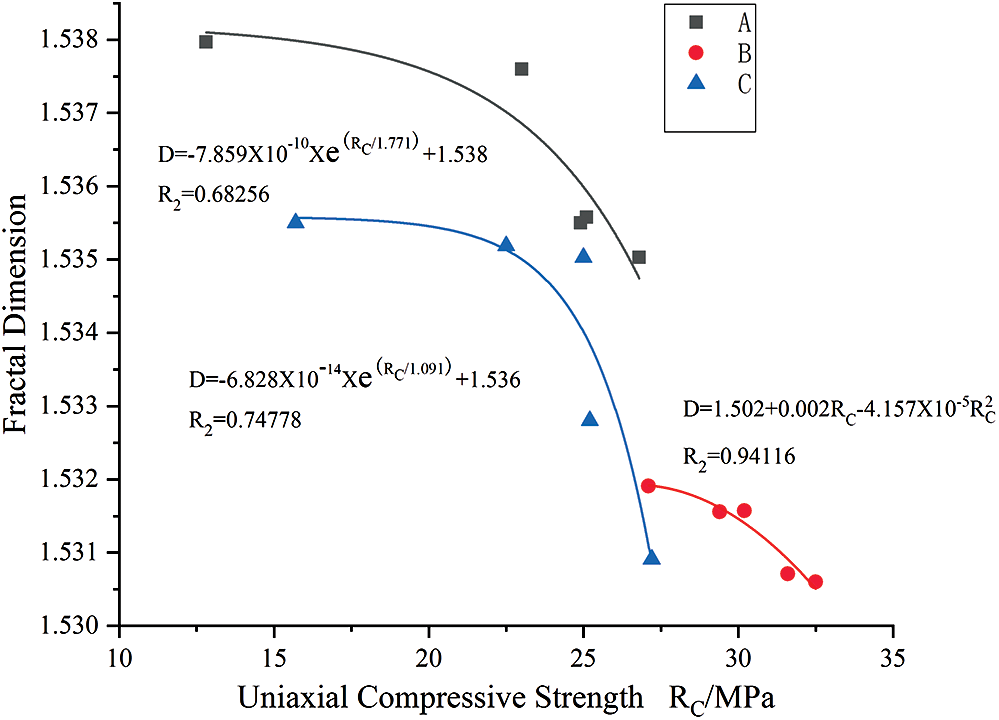
Figure 4: Relationship between the fractal dimension and uniaxial compressive strength of white sandstone under coupling effects
In response to the coupling effects of chemical corrosion and temperature, it can generally be observed from Fig. 4 that as the uniaxial compressive strength increases, the computer fractal dimension (D) of the pores in the white sandstone exhibits a gradually decreasing trend. Specifically, the larger the computer fractal dimension (D), the more grown the pores are and the smaller the uniaxial compressive strength is. When the graphical results are compared with the neutral environment, denoted as Legend B in the figure, more distinctive changes in the computer fractal dimension (D) of the pores in acidic or alkaline environments can be observed. These results indicate that the pore growth of white sandstone due to the coupling effects of chemical corrosion and temperature can be characterized and quantified based on computer fractal theory supplemented with uniaxial compressive strength tests. That is, a correlationship exists between pore development and strength decay. Overall, the findings substantiate the practical usage of computer fractal dimension to characterize the degree of pore development relative to the compressive strength in white sandstone when subjected to the coupling effects of chemical corrosion and temperature variations.
1. When the temperature was lower than 100°C, the damage to the rock caused by temperature was negligibly small. However, the damage under different chemicals (namely acidic and alkaline) environments resulted in a decline of the uniaxial compressive strength. Whilst the results indicated that that temperature could potentially cause rock damage, the decay in strength was predominantly driven by the rate of the chemical reactions.
2. The computer fractal dimension of the pores in the white sandstone under acidic and alkaline neutral conditions was larger than that under neutral conditions. In general, the computer fractal dimension (D) of the pores in the white sandstone exhibited an overall increasing trend with an increase in the temperature. With increasing temperature, the pore size increased with pore distribution becoming more uneven under both acidic and alkaline conditions. In the neutral environment (pH = 7), the computer fractal dimension (D) of the pores in the white sandstone increased in size, but the distribution remained unchanged.
3. The development of pores in the white sandstone exhibited good correlation with the strength decay due to the coupling effect of chemical corrosion and temperature variations. That is the larger the value of the computer fractal dimension, the more is the growth in the pores, and the smaller the uniaxial compressive strength of the white sandstone.
Data Availability: The data used to support the findings of this study are available from the corresponding author upon request.
Funding Statement: This work was supported by the National Natural Science Foundation of China (51674149), the Natural Science Foundation of Shandong Province (ZR2018PEE005), the Research Fund of the State Key Laboratory of Coal Resources and Safe Mining (SKLCRSM19KF015), the Research Fund of the Key Laboratory of Mine Disaster Prevention and Control of the Ministry of Education (MDPC201915).
Conflicts of Interest: The authors declare that there are no conflicts of interest regarding the publication of this article.
1. B. B. Mandelbrot and M. Aizenman, “Fractals: Form, chance, and dimension,” Physics Today, vol. 32, no. 5, pp. 65–66, 1979. [Google Scholar]
2. B. B. Mandelbrot and J. A. Wheeler, “The fractal geometry of nature,” American Journal of Physics, vol. 51, no. 3, pp. 286, 1983. [Google Scholar]
3. P. S. Theocaris and P. D. Panagiotopoulos, “The ‘fractal assumption’ in cracks: Bilateral calculation methods,” International Journal for Numerical Methods in Engineering, vol. 36, no. 9, pp. 1597–1604, 1993. [Google Scholar]
4. P. S. Theocaris and P. D. Panagiotopoulos, “Crack-interfaces of fractal type with friction,” Acta Mechanica, vol. 98, no. 1, pp. 63–78, 1993. [Google Scholar]
5. C. A. Pickover, “The fractal simulation of biological shapes,” in Proceedings Volume 1030, Biostereometrics ’88, Basel, Switzerland, pp. 212, 1989. [Google Scholar]
6. R. D. S. Yadava, “Fractal nature of defect clustering in gate oxides of MOS devices,” Journal of The Electrochemical Society, vol. 136, no. 3, pp. 889–890, 1989. [Google Scholar]
7. J. L. Li, K. P. Zhou, W. J. Liu and Y. J. Xu, “Experimental study of rock porous structure damage characteristics under condition of freezing-thawing cycles based on nuclear magnetic resonance technique,” Chinese Journal of Rock Mechanics and Engineering, vol. 31, no. 6, pp. 1208–1214, 2012. [Google Scholar]
8. J. L. Li, K. P. Zhou and B. Ke, “Correlation analysis of pore development characteristics and uniaxial compressive strength of granite after freezing and thawing,” Journal of China Coal Society, vol. 40, no. 008, pp. 1783–1789, 2015. [Google Scholar]
9. J. L. Li, K. P. Zhou, W. J. Liu and H. W. Deng, “NMR research on deterioration characteristics of microscopic structure of sandstones in freeze–thaw cycles,” Transactions of Nonferrous Metals Society of China, vol. 26, no. 11, pp. 2997–3003, 2016. [Google Scholar]
10. K. P. Zhou, B. Li, J. L. Li, H. W. Deng and F. Bin, “Microscopic damage and dynamic mechanical properties of rock under freeze–thaw environment,” Transactions of Nonferrous Metals Society of China, vol. 25, no. 4, pp. 1254–1261, 2015. [Google Scholar]
11. J. Li, K. Zhou, Y. Zhang and Y. Xu, “Experiment study on physical characteristics in weathered granite under freezing-thawing cycles,” Journal of Central South University (Science and Technology), vol. 45, no. 3, pp. 798–802, 2014. [Google Scholar]
12. P. Guo, “Study on the solid and flow characteristics of soft rock-like materials under multi-field coupling,” Ph.D. dissertation, Qingdao University of Science and Technology, China, 2019. [Google Scholar]
13. Y. C. Wang, “Study on the creep law of deep soft rock under the coupling action of temperature, stress and chemistry,” Ph.D. dissertation, Qingdao University of Science and Technology, China, 2013. [Google Scholar]
14. Y. Y. Wang, H. W. Wang and X. Shi, “Creep investigation on shale-like material with preexisting fissure under coupling temperatures and confining pressures,” Advances in Civil Engineering, vol. 2019, no. 11, pp. 1–10, 2019. [Google Scholar]
15. Y. C. Wang, Y. Y. Wang, J. G. Li, C. Q. Su and P. Guo, “Response analysis of solid - heat coupling in shale creep process based on COMSOL,” Chinese Journal of Applied Mechanics, vol. 36, no. 3, pp. 697–703, 2019. [Google Scholar]
16. Y. Y. Wang, Y. M. Lü, Z. J. Xiao, L. Zang and H. Q. Mao, “Study on creep model of Sandstone under chemical corrosion,” Journal of China Coal Society, vol. 2010, no. 7, pp. 1095–1098, 2010. [Google Scholar]
17. Y. C. Wang and Y. Y. Wang, “Numerical simulation of creep law of deep soft rock roadway under the coupling action of temperature-stress-chemical three fields,” Journal of China Coal Society, vol. 37, no. A02, pp. 275–279, 2012. [Google Scholar]
18. N. Qin, “Research on the influence of pressure and temperature on the strength, damage energy consumption and creep of soft rock,” Ph.D. dissertation, Qingdao University of Science and Technology, 2014. [Google Scholar]
19. L. S. Tang, P. C. Zhang and S. J. Wang, “Testing study on macroscopic mechanics effect of chemical action of water on rock,” Chinese Journal of Rock Mechanics and Engineering, vol. 21, no. 4, pp. 526–531, 2002. [Google Scholar]
20. W. Wang, X. H. Li, Q. Z. Zhu, C. Shi and W. Y. Xu, “Experimental study of mechanical characteristics of sandy slate under chemical corrosion,” Rock and Soil Mechanics, vol. 38, no. 9, pp. 2559–2566+2573, 2017. [Google Scholar]
21. B. R. Chen, X. T. Feng, H. Y. Yao and S. C. Xu, “Study on mechanical behavior of limestone and simulation using neural network model under different water-chemical environments,” Rock and Soil Mechanics, vol. 31, no. 4, pp. 1173–1180, 2010. [Google Scholar]
22. H. Y. Yao, X. T. Feng, Q. Cui, L. F. Shen and C. B. Cheng, “Experimental study of effect of chemical corrosion on strength and deformation of hard brittle limestone,” Rock and Soil Mechanics, vol. 30, no. 2, pp. 338–344, 2009. [Google Scholar]
23. Y. Cai, J. Yu, G. Fu and H. Li, “Experimental investigation on the relevance of mechanical properties and porosity of sandstone after hydrochemical erosion,” Journal of Mountain Science, vol. 13, no. 11, pp. 053–2068, 2016. [Google Scholar]
24. R. D. Peng, Y. Ju and H. P. Xie, “Fractal characterization of meso-structural evolution during tension of limestone,” Rock and Soil Mechanics, vol. 28, no. 12, pp. 2579–2588, 2007. [Google Scholar]
25. F. Gao, H. P. Xie and J. B. Wu, “Fractal analysis of the relation between rock and rock fragmentation,” Chinese Journal of Rock Mechanics and Engineering, vol. 18, no. 5, pp. 497–502, 1999. [Google Scholar]
26. B. Lu, J. Chen, X. Ge and S. Wang, “Fractal study on the structure of jointed rock mass,” Chinese Journal of Rock Mechanics and Engineering, vol. 24, no. 3, pp. 461–467, 2005. [Google Scholar]
27. J. Z. Zhou and X. H. Xu, “Fractal analysis of damage evolution rocess of rock,” Rock and Soil Mechanics, vol. 18, no. 4, pp. 36–40, 1997. [Google Scholar]
28. X. Yin, S. Wang, F. Dang, W. Ding and H. Chen, “Study on the fractal characteristics of sandstone fracture under CT experimental conditions,” Journal of Rock Mechanics and Geotechnical Engineering, vol. 27, no. S1, pp. 2721, 2008. [Google Scholar]
29. X. Chen, G. Yao, J. Cai, Y. Huang and X. Yuan, “Fractal and multifractal analysis of different hydraulic flow units based on micro-CT images,” Journal of Natural Gas Science and Engineering, vol. 48, pp. 145–156, 2017. [Google Scholar]
30. Y. Xia, J. Cai, E. Perfect, W. Wei, Q. Zhang et al., “Fractal dimension, lacunarity and succolarity analyses on CT images of reservoir rocks for permeability prediction,” Journal of Hydrology, vol. 579, article 124198, 2019. [Google Scholar]
 | This work is licensed under a Creative Commons Attribution 4.0 International License, which permits unrestricted use, distribution, and reproduction in any medium, provided the original work is properly cited. |