DOI:10.32604/csse.2021.015787
| Computer Systems Science & Engineering DOI:10.32604/csse.2021.015787 | |
| Article |
Multi-indicator Active Queue Management Method
Faculty of Information, Al-Ahliyya Amman University, Amman, 19328, Jordan
*Corresponding Author: Mosleh M. Abualhaj. Email: m.abualhaj@ammanu.edu.jo
Received: 01 December 2020; Accepted: 02 January 2021
Abstract: A considerable number of applications are running over IP networks. This increased the contention on the network resource, which ultimately results in congestion. Active queue management (AQM) aims to reduce the serious consequences of network congestion in the router buffer and its negative effects on network performance. AQM methods implement different techniques in accordance with congestion indicators, such as queue length and average queue length. The performance of the network is evaluated using delay, loss, and throughput. The gap between congestion indicators and network performance measurements leads to the decline in network performance. In this study, delay and loss predictions are used as congestion indicators in a novel stochastic approach for AQM. The proposed method estimates the congestion in the router buffer and then uses the indicators to calculate the dropping probability, which is responsible for managing the router buffer. The experimental results, based on two sets of experiments, have shown that the proposed method outperformed the existing benchmark algorithms including RED, ERED and BLUE algorithms. For instance, in the first experiment, the proposed method resides in the third-place in terms of delay when compared to the benchmark algorithms. In addition, the proposed method outperformed the benchmark algorithms in terms of packet loss, packet dropping, and packet retransmission. Overall, the proposed method outperformed the benchmark algorithms because it preserves packet loss while maintaining reasonable queuing delay.
Keywords: Congestion control; network performance; active queue management
The wide utilization of computer networks in application evolution that is associated with communications, resource controlling, monitoring, and information management leads to the extensive usage of network resources [1]. Congestion occurs in a computer network when the traffic load exceeds the capabilities of the resources (Fig. 1). The memory that is allocated by the network router or router buffer is one of the most critical network resources that are susceptible to the serious consequences of congestion that eventually lead to delay, packet loss (PL), and low network performance [2]. These consequences also degrade the quality of services provided to connected applications and users. Numerous active queue management (AQM) methods have been proposed to predict congestion before it occurs and affects the network performance [3]. AQM methods reduce the serious consequences of network congestion in the router buffer and improve the network performance [4–7].
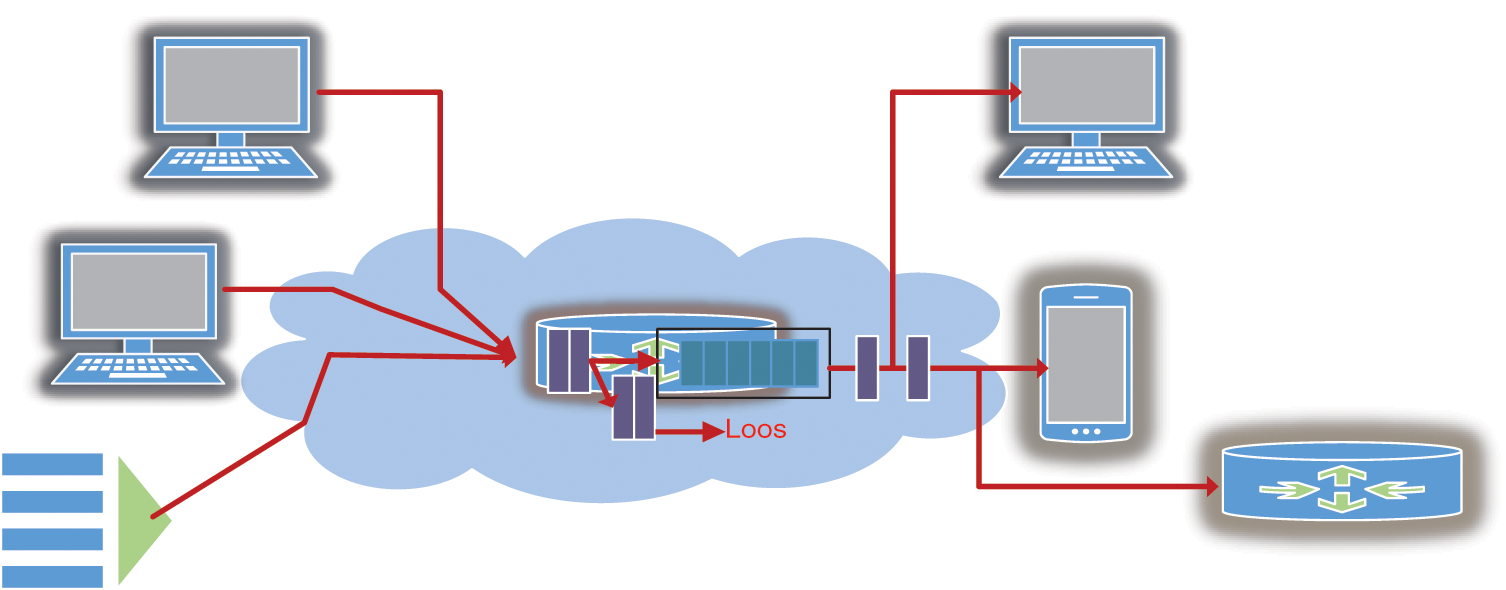
Figure 1: Congestion in the router buffer
AQM methods are operated in the router. The router accommodates the arriving packets and transfers them into the intended destination. AQM is used to monitor the status of the buffer, calculate the dropping probability (Dp) of each arriving packet, and implement stochastic packet dropping based on the calculated value. This approach allows either the accommodation or dropping of the arriving packets to avoid congestion. Unlike the default queue management method (i.e., drop-tail), AQM drops the packets at an early stage when buffer overflow and network performance degradation are expected. As shown in Fig. 2, AQM is implemented in three stages: (1) calculation of the indicators used to monitor the buffer/network status, (2) calculation of Dp, and (3) control stage, wherein the calculations are performed [8,9].
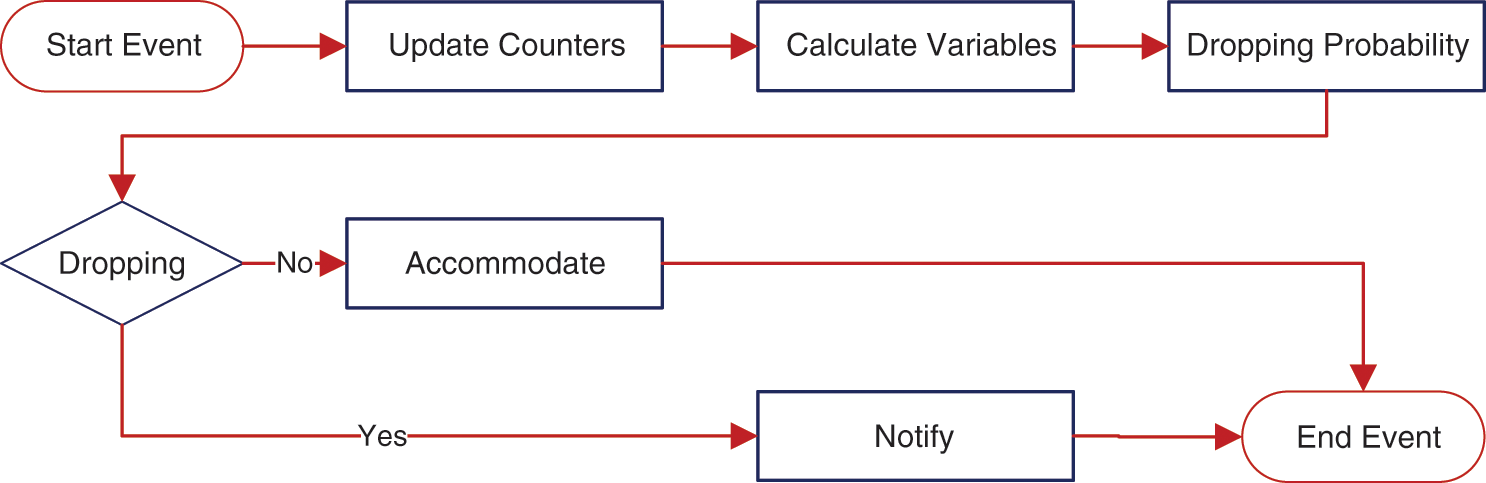
Figure 2: AQM mechanism
AQM methods are developed to overcome the limitations caused by the widespread utilization of network resources, including heavy network traffic, increased connected terminals, and overloaded resources. The limitations of AQM include 1) low performance during sudden congestion, 2) packet delay during heavy traffic because AQM does not monitor the delay in the router buffer, and 3) high packet dropping in some network statuses [3,10–12]. Several techniques and congestion indicators are being developed, modified, and replaced to address the abovementioned issues.
The bursty nature of traffic in real networks, which causes sudden high traffic and unalarmed congestions, reveals the limitations of the utilized congestion indicators. Various AQM methods perform differently in accordance with the congestion indicator used, such as queue length and average queue length (aql). The performance of the network is evaluated using common measures, including delay, loss, and throughput. The gap between the indicators and the measurements leads to a drop in network performance. Therefore, an enhanced AQM method is necessary to overcome the previously enumerated limitations.
The proposed method uses the estimated loss and delay with a novel technique for congestion control and queue management that focuses on resolving the problem of the slow reaction to the increasing number of queued packets in the buffer and bridging the gap between the target performance and congestion indicators. This approach utilizes two thresholds to differentiate among the three different dropping decisions, which is similar to the approach of random early detection (RED). However, the decision of the proposed method is made based on the value of Dp, not on aql. Dp-based decisions are used to replace the slowly reacting aql with more responsive indicators.
The remainder of this paper is organized as follows. Section 2 summarizes the similarities, dissimilarities, advantages, and disadvantages of the existing AQM methods. Sections 3–7 describes the components, processes, and algorithms of the proposed AQM method. Section 8 discusses the simulation environment, implementation results, and comparison of the proposed and existing AQM techniques. Lastly, Section 9 provides the conclusion.
RED is the first and most common method for queue management. This approach is a stable AQM technique that was adopted by the IETF in RFC 2309 [3]. RED calculates and uses the aql to monitor the status of the queue and compare it with two predefined thresholds, namely, the minimum and maximum thresholds. Moreover, aql is used to calculate Dp and is associated with the dropping decision. The first decision is the no-dropping decision, which is made if the calculated aql is less than the minimum threshold. In this case, Dp is set to 0 without calculation. The second decision is the stochastic dropping decision, which is made if the calculated aql is more than the minimum threshold but less than the maximum threshold. In this case, Dp is calculated based on the aql value, threshold values, and maximum dropping probability (Dmax). All values are predefined except for the aql. The third decision is the full dropping decision, which is made if the calculated aql is more than the maximum threshold. Dp is set to 1 without calculation in this decision.
Gentle RED (GRED) [13] uses a third threshold parameter called double maximum threshold in addition to the two thresholds set in RED. The comparison between RED and GRED is illustrated in Fig. 3. The utilized indicator (i.e., the aql) can fall in one of the four cases created by the three thresholds. However, the parameterization problem in RED aggravates due to the use of more parameters in GRED. As heavy congestion occurs in a bursty network, GRED shows a limited instant response with low adjustment of the dropping rate, which leads to PL. Adaptive RED (ARED) [14] represents the optimal target of the queue length by using a parameter called target aql along with aql and the minimum and maximum thresholds. Similar to GRED, the aql of every arriving packet is computed in ARED and compared with three values. Then, Dp is calculated using the same approach in RED. ARED adaptively modifies the value of Dmax, which can increase or decrease. Dynamic RED [15] adopts a single threshold value. When the aql is below this threshold, no dropping is implemented. Otherwise, Dp is adaptively increased or decreased. Fuzzy RED [16] uses aql with fuzzy inference problem to solve the problem regarding parameter settings. Double- slope RED [17] utilizes aql with multiple Dp calculations to reduce PL.
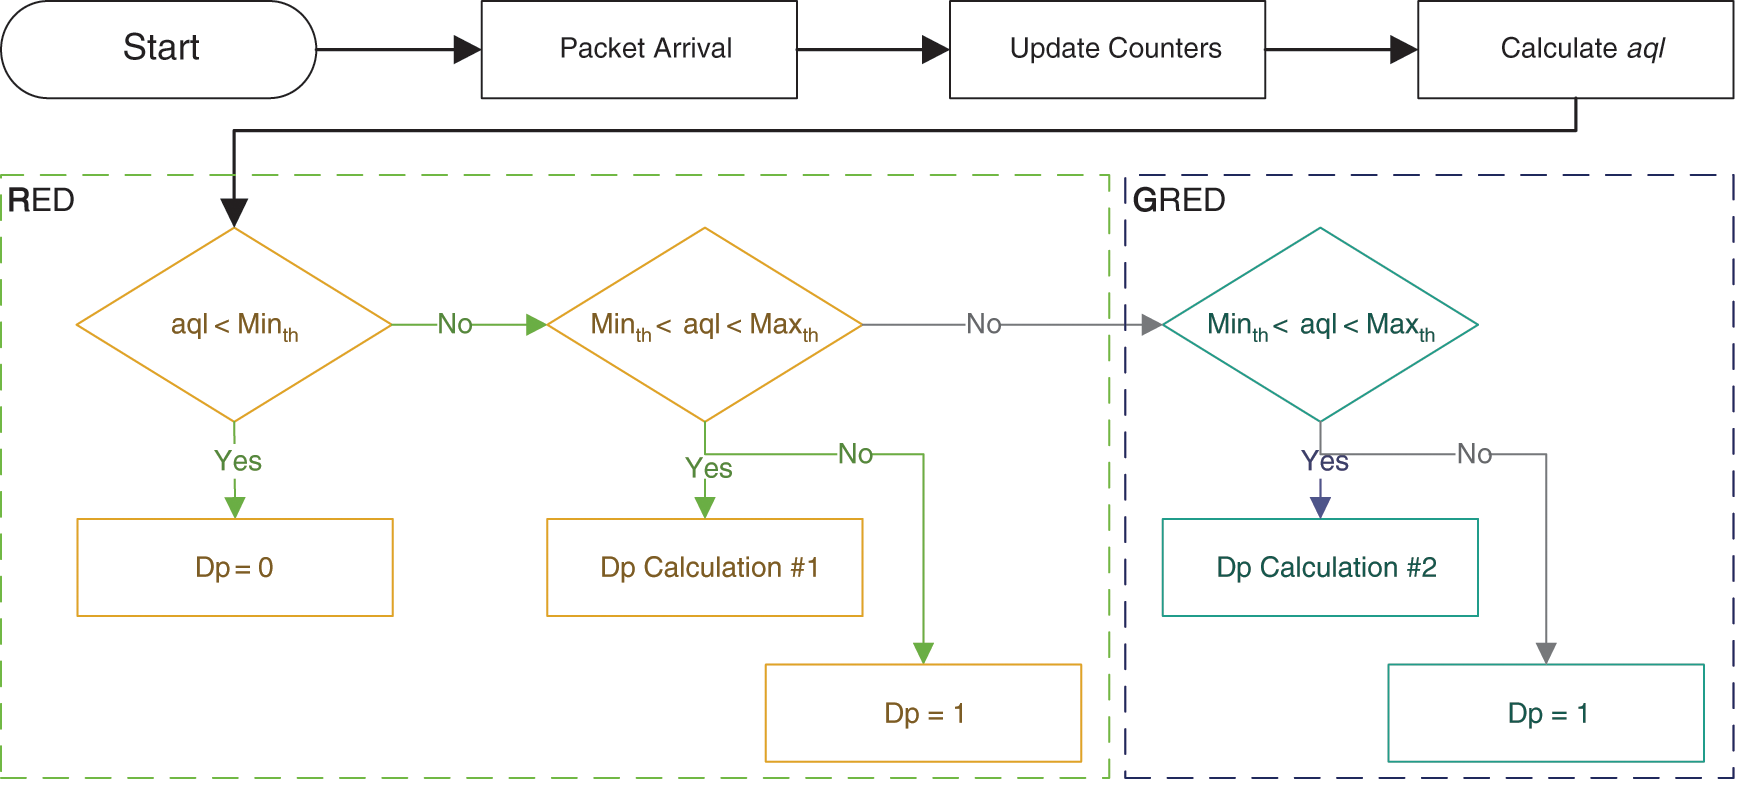
Figure 3: RED and GRED mechanisms
PI [18] uses the traffic load value with the aql in calculating Dp. Dropping increases when the traffic load increases, whereas aql is maintained low to reduce the delay. Random exponential marking [19] utilizes the instance queue length (q) instead of the aql and estimated load rate. The BLUE method [20] uses an adaptive value of Dp that increases and decreases based on the estimated congestion status. Stabilized RED [21] uses q to fairly allocate the available resources, whereas efficient RED (ERED) [22] combines the aql with q and multiple mechanisms to calculate Dp and reduce the PL rates and overcome the limitation of RED. BLUE [20] uses PL with adaptive Dp calculation to reduce this loss. Similarly, multilevel RED [23] uses PL with a novel Dp calculation to achieve PL reduction. Several methods, such as the adaptive virtual queue (AVQ) [24], stabilized AVQ [25], and enhanced AVQ [26], adopt the arrival rate as an indicator to reduce the delay. Other approaches, including link utilization-based approach [27], stabilized virtual buffer [28], rate-based AQM [29], robust active queue [30], and Yellow [31], utilize the load rate or the combination of the arrival rate and q to reduce delay.
The value of aql is calculated as the weighted average of q and the previously calculated aql, and thus allows the averaging of the queue length in a time frame. This mechanism overcomes the false indication of q that might lead to unnecessary packet dropping when short heavy traffic occurs. However, using aql as a congestion indicator is associated with two problems: (1) the requirement of setting the value of the weight parameter and (2) the slow adaptation that leads to a delay in reaction when sudden congestion occurs. On the contrary, q is a counter and therefore does not need any calculation or parameter initialization. By using q in solving the delay-related problem, the reaction when sudden congestion occurs can be resolved. However, as previously mentioned, the false indication of q might lead to unnecessary packet dropping when short heavy traffic occurs. Arrival and load rates are directly related to q and aql. These rates are calculated using different equations and require different parameters. Therefore, both indicators are similar to aql to some extent.
PL can be reduced by using it as an indicator along with other important performance measures. This indicator is calculated by maintaining a virtual queue with lower capacity compared with the queue in the router buffer. As the virtual queue starts to fill, PL starts accordingly to avoid losses in the original queue. However, such a mechanism does not react immediately to congestion and is less sensitive compared with other mechanisms used with aql in RED or in similar methods. PL can be estimated from the traffic load. Delay is a straightforward indicator because it depends on q and load rate. This indicator has been used in multiple methods to reduce the delay and round-trip time. However, delay must be in balance with the throughput because using the former as a sole indicator leads to unnecessary packet dropping.
In summary, AQM maintains a manageable buffer queue length and avoids the congestion caused by the increase in traffic load by using a stochastic technique for packet dropping that depends on an indicator that reflects the status of the buffer. Different congestion indicators and parameters are utilized in different AQM methods. These parameters include aql, q, load, delay, and loss. Similarly, different decision-making scenarios exist in various AQM methods, and different equations and methods are used to calculate Dp. These differences are motivated by different objectives that lead to the primary goal of improving the network performance. Therefore, the indicators and underlying mechanisms used in AQM must be linked to the network performance measures.
Consequently, this paper proposed a new method that utilizes both packet loss and delay to overcome the aforementioned limitations in congestion control and queue management. The proposed method resolves the problem of the slow reaction to the increasing number of the queued packet in the buffer and bridging the gap between the target performance and congestion indicators.
The proposed method is developed using two congestion indicators, namely, estimated loss and estimated delay. This approach aims to improve the performance of computer networks in terms of the common performance measurements. The values of the instance queue, remaining capacity, and packet arrival and departure proportions are used to calculate the indicators with minimum utilization of fixed parameters that lead to the parameterization issue. The proposed method selects among the three dropping decisions (i.e., no-dropping, fully dropping, and stochastic dropping) in accordance with these indicators. The calculated Dp controls the scenarios and the dropping decision; a decision is made with every arriving packet by implementing an algorithm with the following steps. First, the counter values are updated. Second, the values of the indicators are calculated based on the counter values. Lastly, the value of Dp is determined based on the indicators, and the dropping/accommodating decision is implemented stochastically.
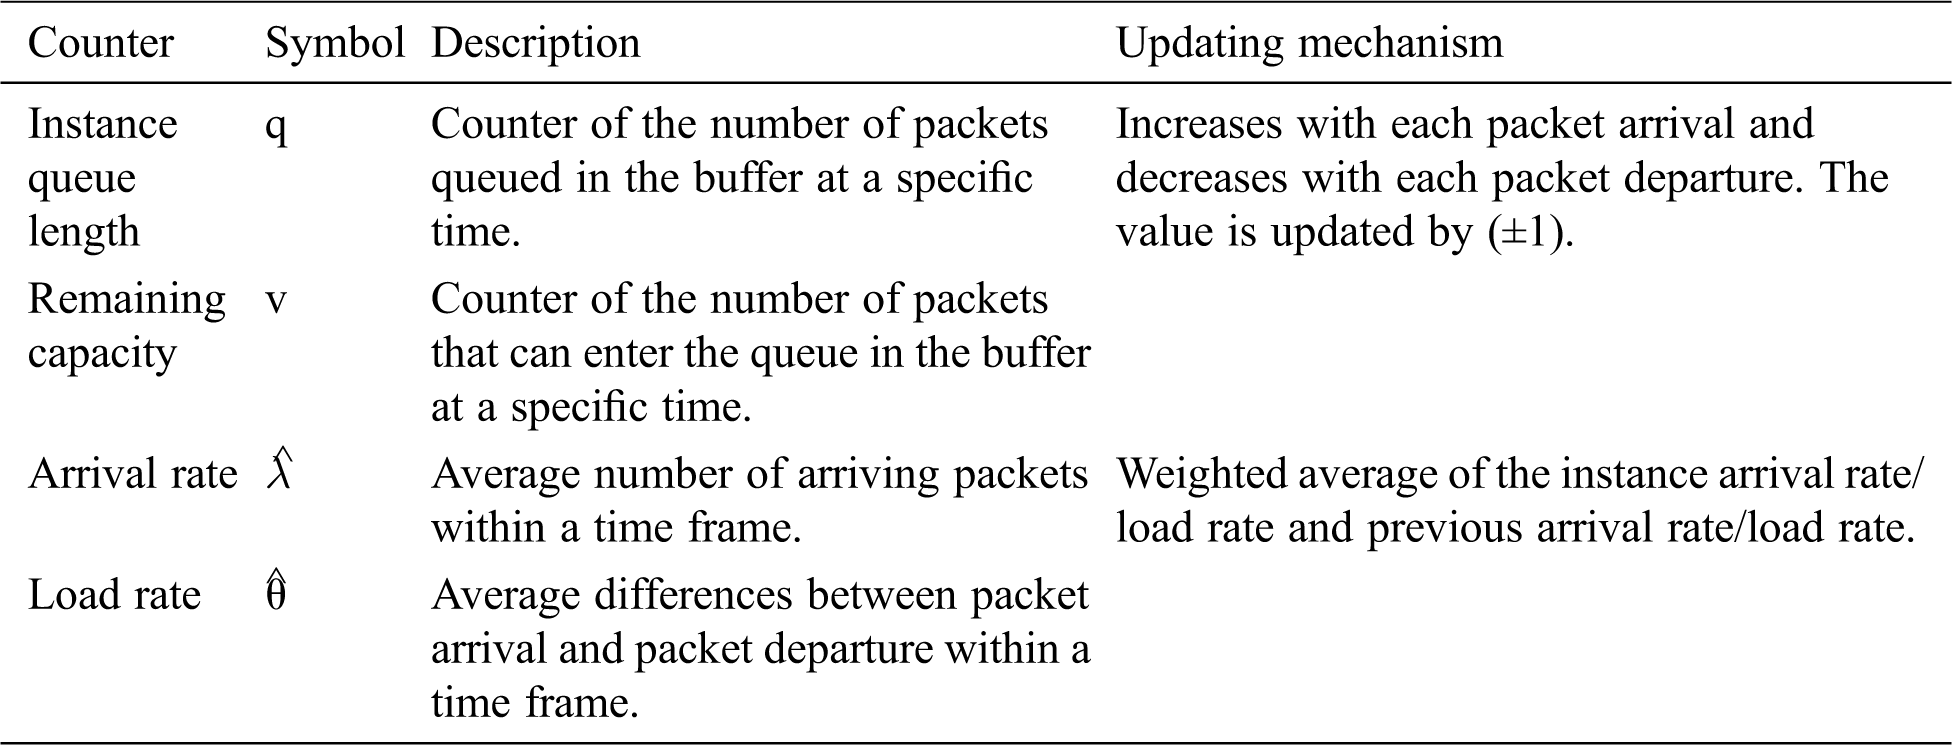
Considering that the queue is the main concern of the proposed method, the queue in the router buffer is monitored using counters that are updated with each event that occurs on the router. Tab. 1 defines the four counters used, namely, q, remaining capacity percentage (v), arrival proportion (
where c is the buffer capacity, λi is the number of arriving packets {0,1} at time i, θi is the difference between packet arrival and departure {0,1} at time i, and w is the weight factor. c, wλ, and wθ are fixed values that are utilized in the proposed method with the counters.
Table 1: Description of the utilized counters
To eliminate the parameters and ease the parameter initialization, w is set to 0.5. Therefore, Eqs. (2) and (3) are converted into normal average formulas.
The two indicators (i.e., estimated loss and estimated delay) used in the proposed method are calculated based on the counters. These indicators are related to the desired network performance, as shown in Tab. 2.
Table 2: Description of the indicators
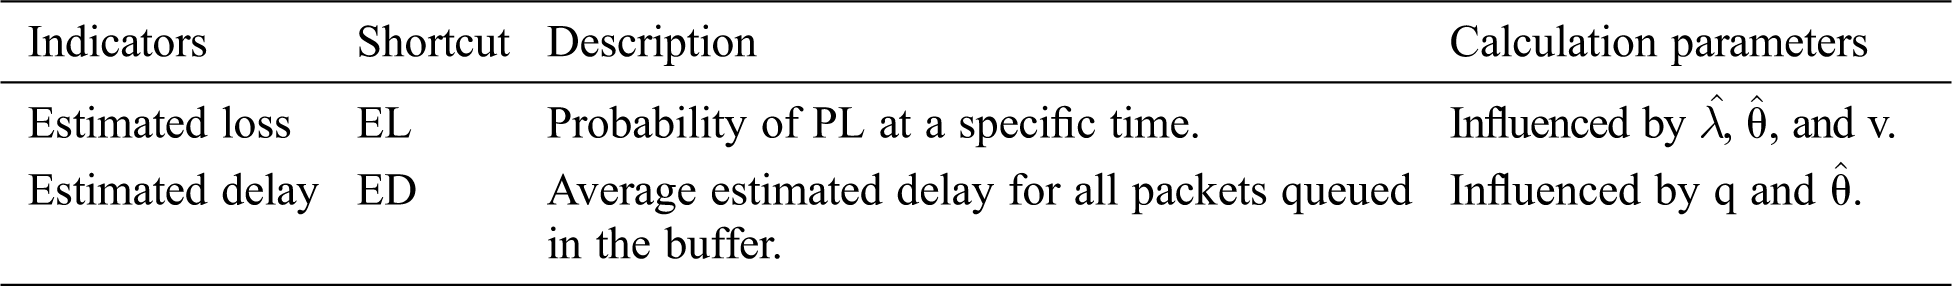
EL (or the probability of loss) is the probability of upcoming loss as the arriving packet is accommodated in the buffer. The value estimated with every packet arrival reflects the future PL. The generated loss value ranges within 0–1. On the basis of the counter descriptions, EL increases as v decreases and
From Eq. (4), EL is the average of
ED predicts the delay for all packets that are currently queued at the buffer. The value estimated with every packet arrival reflects the total delay in the queue. The generated value is calculated as the ratio of the current delay to the maximum delay when the packet overflows. This value ranges within 0–1. ED increases as q increases. Similarly, an increase in θ leads to an increase in ED because packet departure influences the delay. ED is calculated as
The above equation indicates that ED is the integration of q and θ divided by the capacity of the buffer, and thus reflects the maximum delay.
In general, the indicators of loss and delay are utilized and calculated based on the current and average load and queue status. As the arrival rate and load increase, the loss probability increases. If the load and queue increase, the delay increases and vice versa. The remaining counters help accurately estimate the indicators because the remaining capacity plays an important role in estimating the probability. By contrast, the capacity is an important factor in delay estimation.
According to literature, BLUE [20] also utilizes the loss indicator. However, this method does not initialize the loss as a probability value. Instead, the loss is treated as a counter based on a virtual queue with lower capacity compared with the original queue. Delay was used in other related studies [9,32] but was only calculated as the estimated delay of arriving packet. Both indicators have not been used in a single method to enhance network performance.
Dp is calculated based on the previously identified indicators. The value of this probability increases as EL and ED increases. Dp, which is calculated as the weighted average of the indicators, allows the manual setting up the preferences to consider the trade-off between delay and throughput. Accordingly, calculating Dp based on flexible mechanisms allows the selection of the significant of the delay in the underlying network. Dp is determined using a single equation to reduce the complexity of the proposed method (Eq. (6)). The value of wD sets the influence of ED on the output value of Dp. If wD is set to 0, Dp is equal to EL. If wD is set to 1, Dp is calculated as the average of EL and ED. The other values of wD range within 0–1. In such a case, ED assigns different weights in the calculation of Dp.
The proposed method uses a sequential counter to avoid global synchronization. The objective of this counter is to avoid as much dropping of sequential packets as possible. When a packet is dropped, the value of the counter is modified to decrease the probability of dropping the next packet and vice versa. Therefore, a sequential counter is used to modify the value of Dp.
The mechanism of the proposed method depends on three steps: updating the counters, calculating the indicators, and determining the value of Dp and comparing it with two thresholds (similar to the steps in RED). However, the proposed method compares Dp with the thresholds, whereas RED uses aql in the same comparison. The flow of the proposed method is given in Algorithm 1.
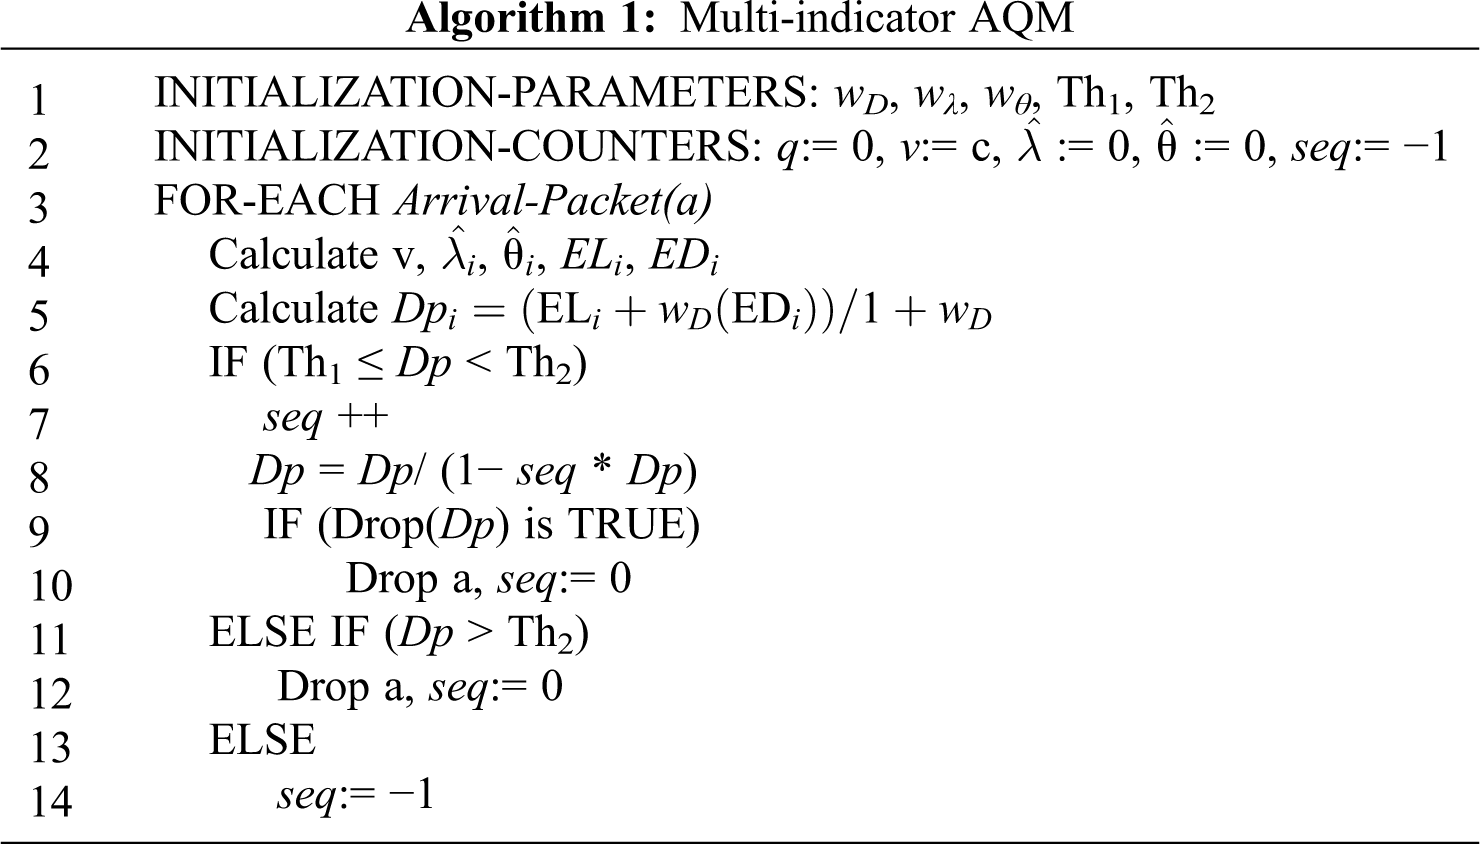
Lines 1 and 2 initialize the parameters and counters. The following processes are implemented with each packet arrival event (line 3). Then, the values of the indicators and related counters are calculated (line 4). The Dp calculation is shown in line 5, and the comparison of the obtained value with the two thresholds is described in line 6. In lines 6–7, if the value of Dp is between the two thresholds, the sequential counter is updated, and the value of Dp is modified based on this counter. The arriving packet is dropped stochastically in lines 9 and 10 based on the modified Dp value. If the value of Dp is greater than the second threshold, the packet is dropped (lines 11 and 12); no dropping occurs if the value of Dp is less than the first threshold. In this case, the sequential counter is set to 1 to increase the modified Dp value in the next cycle.
The proposed method is simulated in a network of a router with a small-capacity buffer (i.e., 20 packets). The buffer is modeled using the first-in, first-out approach. The discrete-time queue model, which consists of numerous slots (i.e., 2 million in the simulated environment, with a warm-up of 800,000 slots), is used to simulate the network events. An event of packet arrival or packet arrival and departure occurs in each slot. Packet arrival and departure are simulated as a stochastic process based on the arrival rate α and departure rate β [33]. To create different flow loads in the simulated network, departure rates of 0.3 and 0.5 are used. The arrival rate is assigned with many variants (0.3, 0.4, 0.5, 0.6, 0.7, 0.8, 0.9, and 0.95) to simulate congested and non-congested environments. The assigned values were used in recent AQM evaluations [9,32]. The parameters of the compared methods are as follows: queue weights of RED and ERED = 0.002, Dmax = 0.1, minimum threshold = 3, and maximum threshold = 9 [5,8,34]. For the proposed method, the minimum and maximum thresholds are set to 0.1 and 0.45, respectively, and the delay is set to 1. Consequently, the delay and loss have equal contributions to the final value of Dp. The algorithm is operated within the simulated environment, and the results are collected based on two sets of experiments, as well as on the delay, PL, and dropping measurements. The throughput can be obtained from the dropping and loss values.
Fig. 4 illustrates the results of the proposed and compared methods in term of the actual delay at all values of α when β = 0.5. The proposed method ranks third among the compared approaches and outperforms ERED in terms of the delay. The larger delay of the proposed method compared with RED and BLUE is not a drawback because the former drops and loses fewer packets compared with the other two techniques. Cutting unnecessary dropping and PL leads to reduced delay but deteriorates the performance of the network and consumes resources in the retransmission process.
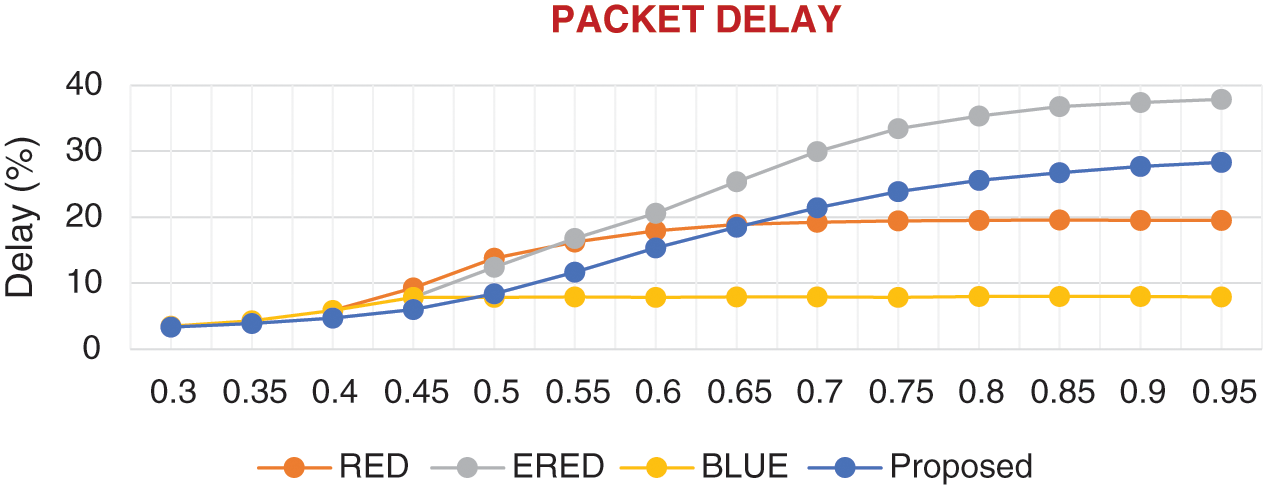
Figure 4: Comparison of the results of the proposed and existing methods in terms of delay
Fig. 5 depicts the results of the proposed and existing methods in terms of the actual PL. The PLs of the proposed method and BLUE are almost zero because both methods utilize PL to monitor the queue in the router buffer. ERED starts losing packets as the traffic load exceeds 0.6. Similarly, RED loses packets, but in a steady manner compared with the burst loss exhibited by ERED.
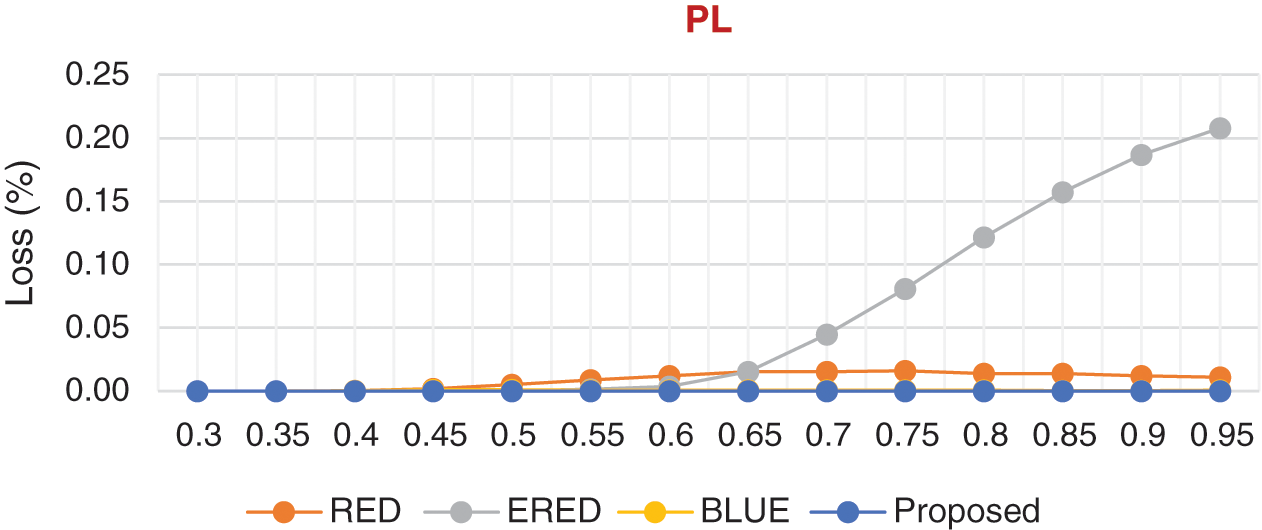
Figure 5: Comparison of the results of the proposed and existing methods in terms of PL
Fig. 6 shows the results of the proposed and existing methods in terms of the packet dropping rate. The proposed method and RED drop fewer packets compared with BLUE. This finding implies that the proposed method uses PL as an indicator more efficiently than BLUE. ERED drops few packets but loses more packets compared with the other three methods.
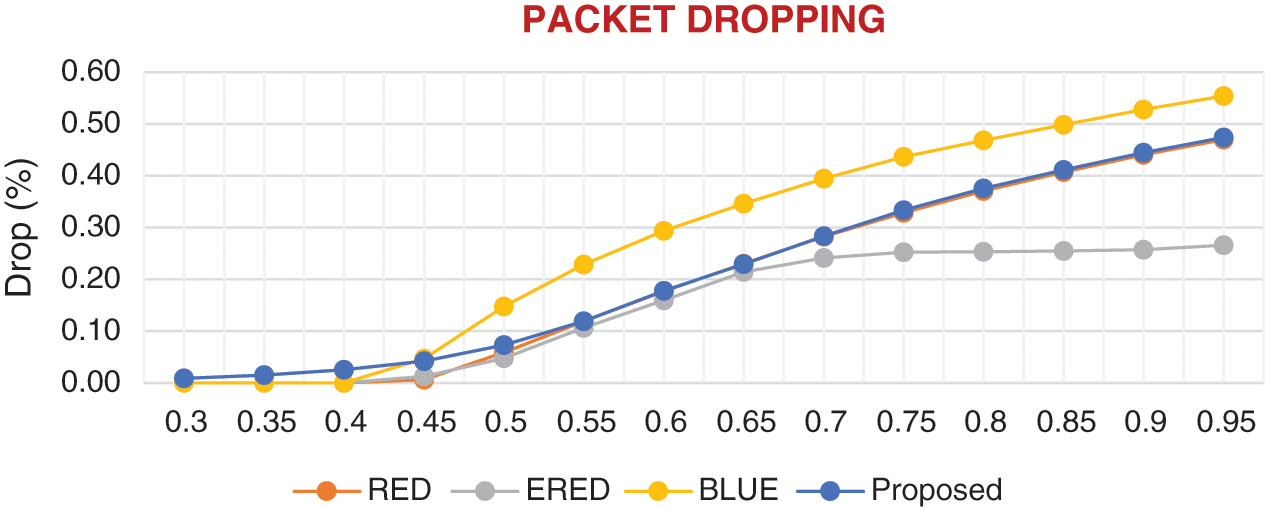
Figure 6: Comparison of the results of the proposed and existing methods in terms of packet dropping
PL and packet dropping rates are aggregated in each compared method to show the total amount of packets that must be transmitted through the simulated network (Fig. 7). The proposed method, RED, and ERED have almost identical retransmitted amounts. As shown in Figs. 5 and 6, the transmission in the proposed method is mainly for packet dropping, which is less computationally expensive compared with the loss incurred by RED and ERED. The retransmission rate of BLUE is high, and thus leads to small queuing delay but considerable end-to-end delay. In summary, the proposed method outperforms RED, ERED, and BLUE because of its ability to preserve PL while maintaining a reasonable queuing delay.
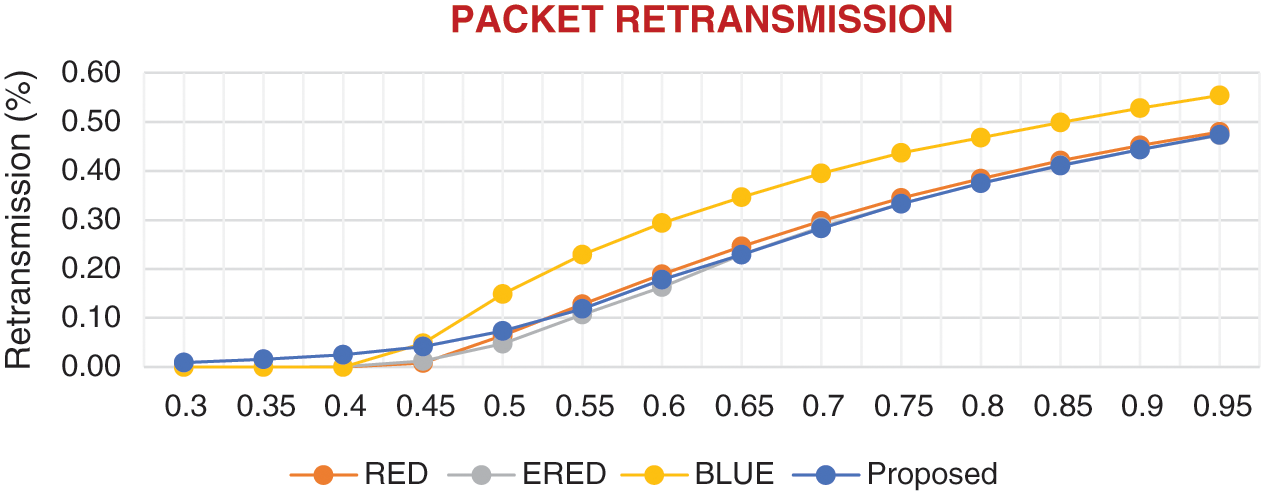
Figure 7: Comparison of the proposed and existing methods in terms of packet retransmission
The second set of experiments is conducted with a relatively extreme situation, where β is set to 0.3 and all values of α are equal or above 0.6. Fig. 8 illustrates the results of the proposed and existing methods in terms of the actual delay in heavy traffic conditions. The results reveal that the proposed method demonstrates smaller delay compared with ERED. However, RED and BLUE outperform the former because of their high loss rates.
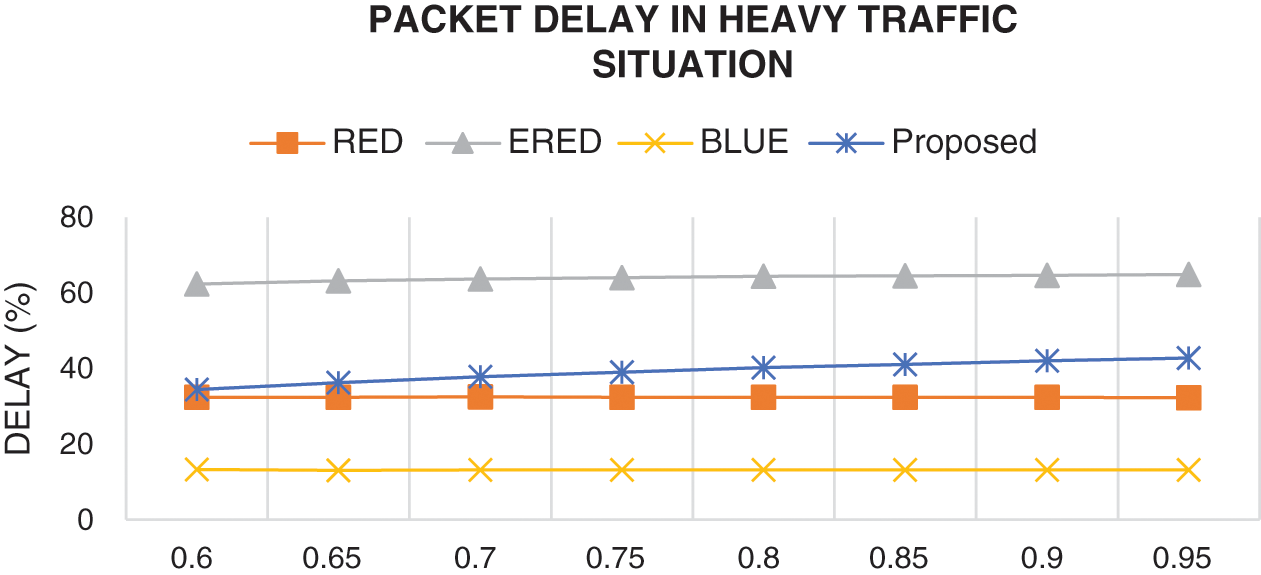
Figure 8: Comparison of the results of the proposed and existing methods in terms of packet delay in heavy traffic condition
Fig. 9 shows the results of the proposed and existing methods in terms of the actual PL in heavy traffic conditions. The results are consistent with the outcome of first set of experiments. Figs. 10 and 11 illustrate the results of the proposed and existing methods in terms of the packet dropping rate in heavy traffic conditions. The findings are also in good agreement with the results of the first set of experiments.
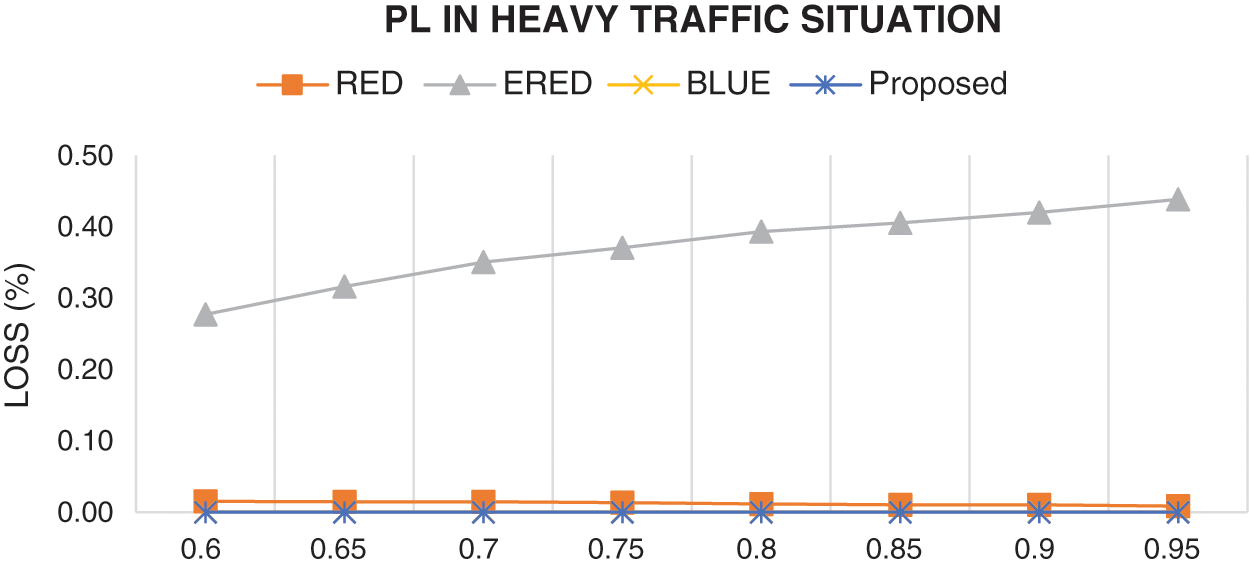
Figure 9: Comparison of the results of the proposed and existing methods in terms of PL in heavy traffic condition
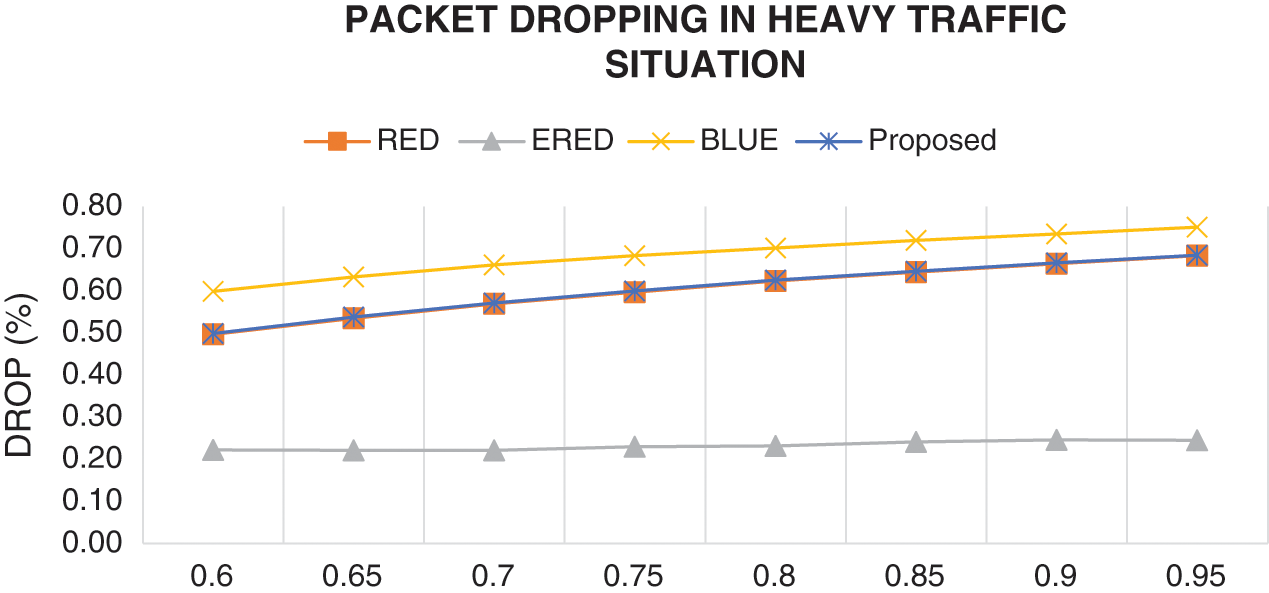
Figure 10: Comparison of the results of the proposed and existing methods in terms of dropping in heavy traffic condition
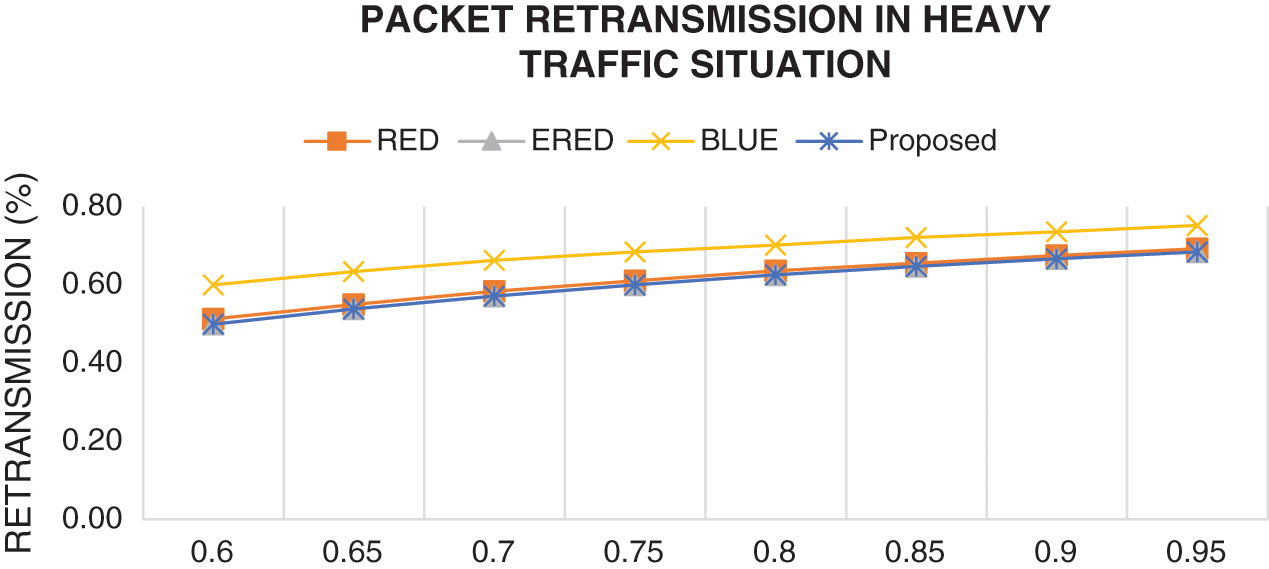
Figure 11: Comparison of the results of the proposed and existing methods in terms of retransmission in heavy traffic condition
A novel AQM method that combines two indicators related to performance measures is proposed in this study. The indicators refer to the variables that reflect the status of congestion and the loading at the buffer at any time. These indicators, which are calculated by monitoring counters, are utilized to control congestion, achieve the desired performance in accordance with the performance measures, and calculate Dp to make appropriate decisions regarding packet dropping. In addition, these indicators play an important role in queue management. The results reveal that the proposed method demonstrates better loss and retransmission rates compared with RED, ERED, and BLUE. However, the proposed method outperformed the benchmark algorithms in terms of packet loss, packet dropping, and packet retransmission, thus, maintaining a reasonable queuing delay. As future works, other congestion indicators will be also considered. Despite the fact that a discrete-time queue model was utilized in this study to deploy the proposed method, a real deployment environment in the presence of a TCP protocol is needed to be considered. Moreover, the implement the proposed method under multi-hop wireless networks would also be interesting to investigate.
Funding Statement: The authors received no specific funding for this study.
Conflicts of Interest: The authors declare that they have no conflicts of interest to report regarding the present study.
1. A. A. Abu-Shareha, “Enhanced random early detection using responsive congestion indicators,” International Journal Of Advanced Computer Science And Applications (Ijacsa), vol. 10, no. 3, pp. 358–367, 2019. [Google Scholar]
2. N. Sharma, S. S. Rajput, A. K. Dwivedi and M. Shrimali, “P-RED: Probability based random early detection algorithm for queue management in MANET,” in Advances in Computer and Computational Sciences. Springer,Singapore, Singapore, pp. 637–643,2018. [Google Scholar]
3. S. Floyd and V. Jacobson, “Random early detection gateways for congestion avoidance,” IEEE/ACM Transactions on Networking, vol. 1, no. 4, pp. 397–413, 1993. [Google Scholar]
4. Y. Zhao, Z. Ma, X. Zheng and X. Zheng, “An improved algorithm of nonlinear RED Based on membership cloud theory,” Chinese Journal of Electronics, vol. 26, no. 3, pp. 537–543, 2017. [Google Scholar]
5. Z. H. A. O. Yu-hong, Z. H. E. N. G. Xue-feng and T. U. Xu-yan, “Research on the improved way of RED algorithm S-RED,” International Journal of u-and e-Service, Science and Technology, vol. 9, no. 2, pp. 375–384, 2016. [Google Scholar]
6. B. Briscoe, “Insights from curvy random early detection (RED),” Technical report TR-TUB8-2015-003, BT, 2015. [Google Scholar]
7. S. Jamali, N. Alipasandi and B. Alipasandi, “An improvement over random early detection algorithm: A self-tuning approach,” Journal of Electrical and Computer Engineering Innovations (JECEI), vol. 2, no. 2, pp. 57–61, 2014. [Google Scholar]
8. M. Baklizi, H. Abdel-Jaber, A. A. Abu-Shareha, M. M. Abualhaj and S. Ramadass, “Fuzzy logic controller of gentle random early detection based on average queue length and delay rate,” International Journal of Fuzzy Systems, vol. 16, no. 1, pp. 9–19, 2014. [Google Scholar]
9. M. M. Abualhaj, A. A. Abu-Shareha and M. M. Al-Tahrawi, “FLRED: An efficient fuzzy logic based network congestion control method,” Neural Computing and Applications, vol. 30, no. 3, pp. 925–935, 2018. [Google Scholar]
10. W. Chen and S. H. Yang, “The mechanism of adapting RED parameters to TCP traffic,” Computer Communications, vol. 32, no. 13–14, pp. 1525–1530, 2009. [Google Scholar]
11. O. Seifaddini, A. Abdullah and H. Vosough, “AGRED congestion control algorithms in heterogeneous traffic types,” in proc. of 4th ICOCI, Sarawak, Malaysia, pp. 123–140, 2013. [Google Scholar]
12. A. H. Ismail, A. El-Sayed, Z. Elsaghir and I. Z. Morsi, “Enhanced random early detection (ENRED),” International Journal of Computer Applications, vol. 92, no. 9, pp. 20–24, 2014. [Google Scholar]
13. S. Floyd, “Recommendations on using the gentle variant of RED,” 2000. [Online]. Available at: http://www.aciri.org/floyd/red/gentle.html. [Google Scholar]
14. S. Floyd, “Adaptive RED: An algorithm for increment the robustness of RED’s active queue management,” AT&T Center for Internet Research Letter at ICSI, USA, California, 2001. [Google Scholar]
15. J. Aweya, M. Ouellette and D. Y. Montuno, “A control theoretic approach to active queue management,” Computer Networks, vol. 36, no. 2–3, pp. 203–235, 2001. [Google Scholar]
16. D. Lin and R. Morris, “Dynamics of random early detection,” in Proc. ACM SIGCOMM’97 conf. on Applications, technologies, architectures, and protocols for computer communication, France, Cannes, pp. 127–137, 1997. [Google Scholar]
17. B. Zheng and M. Atiquzzaman, “DSRED: An active queue management scheme for next generation networks,” in Proc. 25th Annual IEEE Conf. on Local Computer Networks. LCN 2000, Tampa, FL, USA: IEEE, pp. 242–251, 2000. [Google Scholar]
18. G. J. Silva, A. Datta and S. P. Bhattacharyya, “Stabilization of first-order systems with time delay using the PID controller,” in Proc. of the 2001 American Control Conference. (Cat. No. 01CH37148Arlington, VA, USA,6, pp. 4650–4655, 2001. [Google Scholar]
19. D. Lapsley and S. Low, “Random early marking: an optimisation approach to Internet congestion control,” in IEEE International Conf. on Networks. ICON’99 Proc. (Cat. No. PR00243Brisbane, QLD, Australia: IEEE, pp. 67–74, 1999. [Google Scholar]
20. W. C. Feng, D. Kandlur, D. Saha and K. Shin, “BLUE: A new class of active queue management algorithms, University of Michigan, Technical Report CSE-TR-387-99, 1999. [Google Scholar]
21. T. J. Ott, T. V. Lakshman and L. H. Wong, “SRED: Stabilized RED,” in IEEE INFOCOM’99 Conf. on Computer Communications. Proc. Eighteenth Annual Joint Conf. of the IEEE Computer and Communications Societies. The Future is Now (Cat. No. 99CH36320New York, NY, USA: IEEE, pp. 1346–1355, 1999. [Google Scholar]
22. B. Abbasov and S. Korukoglu, “Effective RED: An algorithm to improve RED’s performance by reducing packet loss rate,” Journal of Network and Computer Applications, vol. 32, no. 3, pp. 703–709, 2009. [Google Scholar]
23. J. Koo, B. Song, K. Chung, H. Lee and H. Kahng, “MRED: A new approach to random early detection,” in Proc. 15th Int. Conf. on Information Networking, Beppu, Japan: IEEE, pp. 347–352, 2001. [Google Scholar]
24. S. Kunniyur and R. Srikant, “End-to-end congestion control schemes: Utility functions, random losses and ECN marks,” IEEE/ACM Transactions on Networking, vol. 11, no. 5, pp. 689–702, 2003. [Google Scholar]
25. C. N. Long, B. Zhao and X. P. Guan, “SAVQ: Stabilized adaptive virtual queue management algorithm,” IEEE Communications Letters, vol. 9, no. 1, pp. 78–80, 2005. [Google Scholar]
26. Q. Yanping, L. Xiangze, L. Qi and J. Wei, “A stable enhanced adaptive virtual queue management algorithm for TCP networks,” in IEEE Int. Conf. on Control and Automation, Guangzhou, China: IEEE, pp. 360–365,2007, 2007. [Google Scholar]
27. M. K. Agarwal, R. Gupta and V. Kargaonkar, “Link utilization based AQM and its performance,” in IEEE Global Telecommunications Conf., 2004. GLOBECOM’04, Dallas, TX, USA: IEEE,2, pp. 713–718, 2004. [Google Scholar]
28. X. Deng, S. Yi, G. Kesidis and C. R. Das, “Stabilized virtual buffer (SVB)-an active queue management scheme for Internet quality-of-service,” in Global Telecommunications Conf., 2002. GLOBECOM’02. IEEE, Taipei, Taiwan: IEEE,2, pp. 1628–1632, 2002. [Google Scholar]
29. C. Wang, B. Li, Y. T. Hou, K. Sohraby and K. Long, “A stable rate-based algorithm for active queue management,” Computer Communications, vol. 28, no. 15, pp. 1731–1740, 2005. [Google Scholar]
30. J. Sun and M. Zukerman, “RaQ: A robust active queue management scheme based on rate and queue length,” Computer Communications, vol. 30, no. 8, pp. 1731–1741, 2007. [Google Scholar]
31. C. Long, B. Zhao, X. Guan and J. Yang, “The yellow active queue management algorithm,” Computer Networks, vol. 47, no. 4, pp. 525–550, 2005. [Google Scholar]
32. A. A. Abu-Shareha, “Controlling delay at the router buffer using modified random early detection,” International Journal of Computer Networks & Communications (IJCNC), vol. 11, no. 6, pp. 63–75, 2019. [Google Scholar]
33. M. Khatari and G. Samara, “Congestion control approach based on effective random early detection and fuzzy logic,” arXiv preprint arXiv: 1712.04247, 2017. [Google Scholar]
34. L. Tsavlidis, P. S. Efraimidis and R. A. Koutsiamanis, “Prince: An effective router mechanism for networks with selfish flows,” Journal of Internet Engineering, vol. 6, no. 1, pp. 355–362, 2016. [Google Scholar]
 | This work is licensed under a Creative Commons Attribution 4.0 International License, which permits unrestricted use, distribution, and reproduction in any medium, provided the original work is properly cited. |