DOI:10.32604/csse.2021.014933
| Computer Systems Science & Engineering DOI:10.32604/csse.2021.014933 | |
| Article |
Prediction of COVID-19 Pandemic Spread in Kingdom of Saudi Arabia
1Faculty of Computing and Information Technology, King Abdulaziz University, Jeddah, 21589, Kingdom of Saudi Arabia
2Department of Information Technology, Babasaheb Bhimrao Ambedkar University, Lucknow, 226025, Uttar Pradesh, India
*Corresponding Author: Alka Agrawal. Email: alka_csjmu@yahoo.co.in
Received: 28 October 2020; Accepted: 06 December 2020
Abstract: A significant increase in the number of coronavirus cases can easily be noticed in most of the countries around the world. Inspite of the consistent preventive initiatives being taken to contain the spread of this virus, the unabated increase in the cases is both alarming and intriguing. The role of mathematical models in predicting and estimating the spread of the virus, and identifying various preventive factors dependencies has been found important and effective in most of the previous pandemics like Severe Acute Respiratory Syndrome (SARS) 2003. In this research work, authors have proposed the Susceptible-Infectected-Removed (SIR) model variation in order to forecast the pattern of coronavirus disease (COVID-19) spread for the upcoming eight weeks in perspective of Saudi Arabia. The study has been performed by using SIR model with a proposed simplification using average progression for further estimation of β and γ values for better curve fittings ratios. The predictive results of this study clearly show that under the current public health interventions, there will be an increase in the COVID-19 cases in Saudi Arabia in the next four weeks. Hence, a set of strong health primitives and precautionary measures are recommended in order to avoid and prevent the further spread of COVID-19 in Saudi Arabia.
Keywords: COVID-19 pandemic; Saudi Arabia; SIR model; prediction model
Coronavirus disease, commonly named as (COVID-19), is caused by Severe Acute Respiratory Syndrome 2 (SARS-CoV-2) and the first case of the virus was detected in Wuhan city of south China. After few days, the World Health Organization (WHO) declared it to be a pandemic [1,2]. COVID-19 pandemic has brought the whole world at a standstill. The last few months have witnessed an exponential growth and spread around the globe. So far, the tally of COVID-19 cases around the world is 29487100. Since the COVID-19 cases continue to rise at a relentless pace, more inventive mechanisms need to be worked at to not only detect but also predict the possible spread of the contagion. Prompt prediction mechanisms of the disease will aid in the implementation of more effective countermeasures [3–5]. In this paper, the authors have discussed the prediction of the spread of COVID-19 cases in the coming months in Saudi Arabia. So far total number of cases on Johns Hopkins University (JHU) is 29487100, out of which 326930 are from Saudi Arabia. The rapid increase in cases can only be stemmed by efficacious vaccination. However as per several laboratories working on developing vaccines, even the earliest launch of any safe and inclusive vaccination campaign is not likely to happen in 2020. Continuous battle with the virus has already rendered the healthcare systems across the world fragile and the situation is likely to worsen in the coming months due to change in the climate and increase in human to human contact as the cities across the world open to the unlock mode. One possible solution in this league would be early prediction of the spread of the virus so that remedial interventions can be introduced to contain the infection. More specifically in the context of Saudi Arabia, it is one of the first twenty countries in the world. Hence, preemptive measures to predict the reach of virus and identify the more vulnerable zones will add to the steps being undertaken in Saudi Arabia for combating the spread of COVID-19.
The economy of Saudi Arabia is based on petroleum sector and 87% of the total revenue is generated from this sector alone [6]. 90% of this revenue is drawn from the earnings due to export, which is 42% of the country’s Gross Domestic Product (GDP). Saudi oil reserves are ranked second in the world and the country is the world’s leading oil exporter. The oil reserves are largely managed by stated owned corporation Saudi Amarco. The private sector of Saudi Arabia also plays a vital role in the economy and accounts for 40% of GDP. With a booming economy and a thriving petroleum industry, Saudi Arabia is known to be the prized destination for professionals from across the world. As per the last available data of 2013, 7.5 million foreigners work legally in petroleum industry in Saudi Arabia, forming an important part of the country’s workforce and economy. Unfortunately, COVID-19 has reversed the economic growth curve and the economists believe that more rude shocks are expected in the aftermath of the pandemic. Recession has already arrived in Saudi Arabia, and the oil prices are at all-time low in two decades. Lockdowns in almost all parts of the world deteriorated the condition of tourism and other industries, ultimately affecting the balance of demand and supply. Most of the countries are reeling under the pressure of economic crisis, and the global economy will take sufficient amount of time to revive. Many economists have stated that stable, complex and diverse economies will be able to cope and handle future shocks in an effective manner as they are more adaptable. Now almost all parts of the earth are exposed to this virus and so far large community of population has got infected. SARS-CoV-2 is the biggest challenge for humanity at present. Further, we propose forecasting the outbreak of COVID-19 in following next two months for public health practitioners in managing the COVID-19 crisis in Saudi Arabia. The study focuses on the analysis of data of COVID-19 confirmed cases, death cases and recovered cases and figure out the infection rate and removal rate in order to estimate the outbreak. The structure of this paper is as follows: Section 1 introduces COVID-19 situation around the globe, especially in Saudi Arabia. Section 2 describes the related works of different computational models that have been used for the prediction of COVID-19. Section 3 explains data collections and modelling. Section 4 defines the methodologies for performance measures estimation. Data analysis and validation is explained in Section 5. In Section 6 prediction and control measures are analyzed.
Huang, collected and analyzed data on patients with laboratory confirmed COVID-19 infection by real time Polymerase Chain Reaction (PCR) and next generation sequencing [1]. Lauer, estimated the incubation period of COVID-19 [2]. Alzahrani, implemented the epidemic situation and forecasting of COVID-19 in Saudi Arabia using Autoregressive Integrated Moving Average (ARIMA) model [3]. Cooper, purposed the assumption of COVID-19 spread in different communities using SIR model [4]. Yang, optimized the modified Susceptible-Exposed-Infectious-Removed (SEIR) model and Artificial Intelligence (AI) has been used to forecast the epidemic trends of in COVID-19. Here four parameters like susceptible, exposed, infectious and removed has taken into account to determine the probability of transmission and authors also used AI approach, trained on SARS data, to predict the epidemic [5]. Waqas [6], presented the prediction of COVID-19 for Pakistan and Zhong [7] predicted for mainland China using time dependent SIR model. Waqas and Zhong have determined input variables like infection rate β(t) by using Eq. (6) however Zhong added some modification in equation of β(t) and recovery rate γ(t) by using Eq. (7). Moreover analysis is then performed to predict the pandemic situation based on different value of recovery rate Y(t) respectively. Roda, estimated the impact of the Wuhan lockdown and traffic restriction in the Wuhan city after January 23 and February 6, 2020 and suggested if more restriction control and prevention measures were not implemented in the city, the epidemic will monotonically increase [8]. Malavika carried out the short term projection of new cases to predict the maximum number of active cases in India and high incidence states. Here authors used Logistic Growth Curve (LGC) model, SIR model and regression model to estimate the impact of lock down and other interventions [9]. Tuli, has explored several new directions of research for the current and future pandemics [10]. Ghosh, defined the data driven understanding of COVID-19 dynamics using optimized cellular data [11]. Similarly Hartono, explored the dynamics of COVID-19 using neural networks predictor namely Long Short Term Memory (LSTM) [12]. Finalli, forecasted the COVID-19 spreading in Italy, China and France in the time window of 22 January to 15 March 2020. Here authors has defined the predictive trends based on the fits of the Susceptible-Infected-Recovered-Deaths (SIRD) model [13]. D’Arienzo, studied the early spread of SARS-CoV-2 in Italy, and found the range of basic reproduction number associated with Italian outbreak [14]. Ceylan, defined the significance of different time series method for estimation of COVID-19 prevalence in Italy and found that ARIMA (0, 2, 1), ARIMA (1, 2, 0) are best model for Spain, France and Italy [15]. Mahajan, considered purely asymptomatic infected persons along with the symptomatic cases and also determined the impact of number of test case per and lock down on contamination of COVID-19 [16]. Mahajan, applied the SIR model for outbreak prediction of COVID-19 in India and USA [17]. Rafiq, studied the contamination spread of COVID-19 worst hit in 10 most affected states of India, authors has developed an epidemic model to simulate and predict the rapid increases in new infected cases in India for 30 days ahead prediction window [18]. Sarkar, explained the transmission dynamics of COVID-19 by conducting the sensitive analysis to identify the most effective parameters using the real data up to 30 April [19]. Bagal, studied the classical SIR model approach to identify the different parameters for India [20]. Authors defined the various assumptions for fitting of the model in the Python simulation for each lockdown scenario. Eikenberry, defined the pandemic peak scenario in New York and Washington and also discussed the impact of mask use by general and asymptomatic public [21]. Zhao, studied the MH optimization algorithm is used to predict the epidemic spreading spreads in six African countries [22]. Finally, analyzed and forecast the COVID-19 spreading in China, Italy and France [23]. He discussed the impact of returning back to work on the transmission of the disease and different strength of control measures [24]. Weissman, projected the different COVID-19 related demands like hospital beds, ICU, ventilators and when it would be sutured in 3 hospitals located in Philadelphia [25]. Ndairou, explained the case study of Wuhan by considering the sensitive of basic reproduction number with respect to the parameters of the model [26]. Albert, analyzed the epidemic evolution in China and Italy and predicted those extrapolations is not only depend on quality of data but also on stage of epidemics [27]. Wieczorek, presented the research result based on neural network model for COVID-19 spread prediction [28]. Vaishnav, analyzed the effect of lockdown relaxation on COVID-19 in India [29]. Huang, defined the impact of implement schedule and intensity of containment policies of the spread of COVID-19 [30]. Alrashed, described the impact of lock down on infection rate of COVID-19 in Saudi Arabia [31]. Now, the Fig. 2 demonstrate the situation of COVID-19 in Saudi Arabia till 15 September based the real data of confirmed, death and recovered data collected from JHU dashboard.

Figure 1: Total confirmed, death and recovered cases scenario in Saudi Arabia
3 Data Collection and Modeling
The first case in Saudi Arabia was detected in the month of March in 2020. From then on, the COVID-19 cases tally has reached to 326930 confirmed cases. There are 17570 active cases and 4338 deaths due to COVID-19. The data used in this paper has been taken from COVID-19 dashboard by the Center for System Science and Engineering (CSSE) at JHU. This university provides a daily update on the global map of the pandemic at- https://coronaviru s.jhu.edu/map.html. The dataset provided by the JHU is most widely used by researchers and journal media. This dashboard provides the latest epidemiological data from January 2020 onwards and the data includes the count of confirmed cases, deaths and the number of recovered patients. In this research work, the authors have collected daily number of confirmed cases, deaths and recovered COVID-19 cases data with specific reference to Saudi Arabia. The period which has been taken in account is from 1 March 2020 to 15 September 2020. Fig. 1 represents the situation of COVID-19 till present.
This research work focuses on forecasting the spread of COVID-19 by using the computation mathematical model. The simplest and most widely applied model structure is SIR model. SIR model is used for forecasting the spread of infectious disease, this mathematical model is helpful in defining the important concept of probability of disease to be an epidemic or not. SIR is the epidemiological model used to define the theoretical number of individuals contained within an infectious ailment in a closed period of time.
The model was given by Kermack and Mckendrick in 1927. In this research work, the standard SIR model is used to find out the spread of COVID-19 in the next 60 days. The growth index has been calculated from March 2020 to September 2020. The SIR model is one of the simplest models; it has three main components of: Susceptible (S), Infectious (I) and Removed (R).
i) Susceptible: are people who are most likely to be infected. In this case, it can be assumed from the very beginning itself that everybody is going to be in the susceptible category. Thus, around 34,937,072 are susceptible as this disease is contagious.
ii) Infected: represents the fraction of population that is infected
iii) Removed: represents number of removed individual who have good immune system and hence are not likely to be infected. or decrease individual
So, the assumption as an Eq. (1) by saying that sum of the susceptible, the infected and recovered people adds on to represent entire population N.

where, S(t), I(t) and R(t) represent the number of susceptible, infected, recovered individuals over time, respectively. The population of three classes is governed by the following system of differential equation means the rate of change with respect of T, dS/dt means how the number of susceptible is changing in time, dI/dt how the number of infected people is changing expect a time and likewise dR/dt the number of recovered people how that is changing with respect of time hence the equation for each of these in this model are

where [β] = contacts per infected person per day


where [γ] = recoveries per person per day
Notation of Eq. (2) means the change in S over the change in time which is going to decrease because the susceptible are getting smaller as the time goes on and as per the transition to being infected, it is a negative with constant β it is sort of proportionally constant and then multiply by S and I together because the larger that multiplication is the larger the number of interactions between susceptible and infected people are, that’s why dS/dt shows change in susceptible people that depend on the more there are connections between the S and the I. So, in this model, the unit β(t) constant represents infectious rate. The depletion in susceptible population depends upon both S and I.
The impact on infected population is as shown in Eq. (3), it defines the rate of change which is not negative in case of dI/dt but positive because the infected people is that susceptible people transition to infect it so if we lost -βSI out of the susceptible then there is gain in the infected as well get plus βSI but it is not the only factor that affects infecting people, but there are also losses of infected people when they get recovered from the disease when their immune system sort of kicks in, and they fight it off, and then they are no longer capable of infecting anybody so that happens there is loss of infected people therefore negative γI turn the more infected, there are the bigger the rate of change of infect. So, rate in change infected population is depended on both time variant constant β and γ. The rate of change of recovered population is represented in Eq. (4) this notation explains that it is just opposite of the rate at which transit to infected population so the dR/dt, the rate of change of recovered people with respect of change of time is just the rate at which the infected people get transit to recovered people that’s depends on how good the medical treatment or immunity of people, this model relates these two constants beta is contacts per infected person per day and γ is recoveries per person per day. Another most important parameter R0, which represents basic reproduction rate can be defined as β(t) over γ(t). Here R0 is actually used to define the peak position of distribution of infected population with reference to time. The parameter R0 is directly influenced by β(t) and γ(t), as R0 is directly proportional to β(t) and inversely proportional to γ(t). When R0 reaches equal to one, then the infection is going to spread in population, and if it is less than one, it will not spread exponentially in the population. The increase in the contact rate can exponentially increase the spread of disease, however it can be reduced by social distancing by reducing the contacts per day.
3.3 Model Performance Measures: β and γ
In order to implement the SIR model, the primary step is to estimate the parameters β and γ, where β is defined as the contacts per infected person per day and γ is rate of recovery and death in infected population. Using epidemic data of Saudi Arabia from JHU, we modeled the SIR model to determine the probability of COVID-19 transmission, for that β and γ are derived. The above set of equations can be further simplified for prediction of COVID-19 pandemic. Eq. (5) in the finite difference form by using discrete function is as follows:

where ∆t is interval of numerical integration and the change in susceptible in unit time is combined into infection rate β with the definition of:

The second parameter of the model γ represents the difference of recoveries can be described as:

For performing the prediction of cumulative infected cases, firstly both of the time variant β and γ are need to be set, then it can be determined by using Eq. (5). To estimate the situation of real epidemic transition, β can be estimated via fitting the epidemiological data. Another parameter, recovery rate (γ) can also be obtained using the similar method. Here, Eqs. (6) and (7) have been used for estimation of β and γ respectively. With the estimation of infection rate β(t) and removed infective γ(t), we can estimate the further cumulative number of infected cases I(t).
4 Method for Performance for Measures Estimation
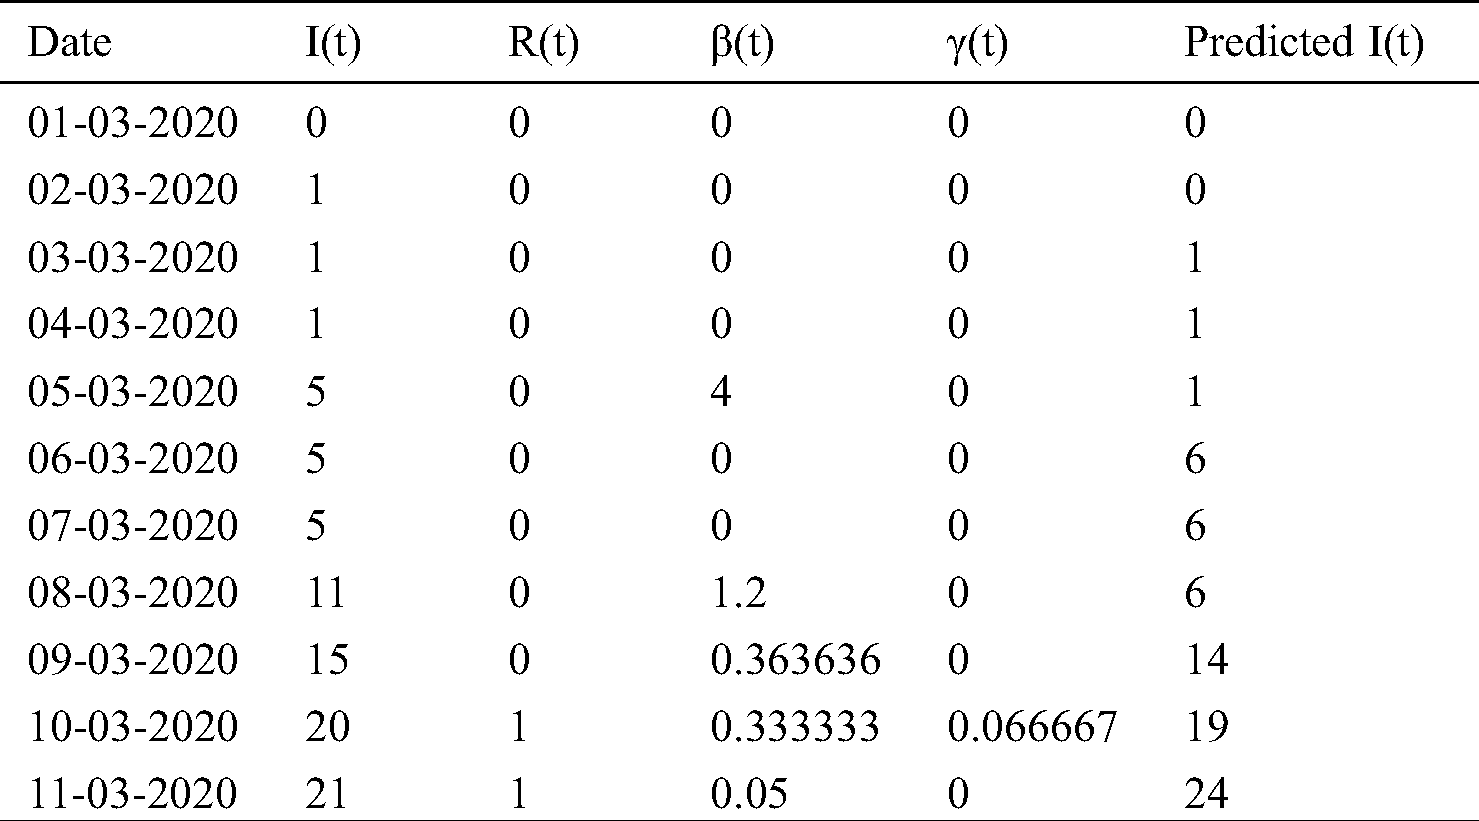
We collected the daily number of confirmed cases, deaths and recovered cases by JHU dashboard from 1 March to 15 September and create a real time database. In Saudi Arabia, the total infected population has increased from zero to 326930 in last seven months as shown in Tab. 1. By using the Eqs. (6) and (7), two important time variant constant infection rate β(t) and removal rate γ(t) have also been approximated.
Table 1: Cumulative infected cases and recovered cases estimated by SIR model


5 Data Analysis and Validation
The objective of data analysis is to figure out outbreak of the pandemic in Saudi Arabia in the next two months. Based on the information about the epidemic transition in Switzerland, Italy and Spain, the same model has been proposed to predict the outbreak of COVID-19 in October and November of 2020. In the above mentioned courtiers, the values of time variant constant β and γ have been optimized, The optimized values of β(t) and γ(t) align with the data of these countries apart from the peak date prediction which is based on active infected cases rate. The first model that was suggested for the validation purpose was implemented on the countries where the pandemic had either finished or was in the last stage, like Switzerland, Italy and Spain. The β(t) and γ(t) estimation procedure concur sensibly well with the information of these countries, apart from the peak date of pandemic which depends on the circulation of dynamic trained cases as appeared. The fixed value estimation of β(t) and γ(t) could cause the inconsistency in forecasting the pandemic. These parameters have been estimated from 1 March to 15 September for Spain, Switzerland and Italy. Accordingly the distribution of cumulative invectives with respect of time for Switzerland, Italy and Spain are shown in Figs. 2–4, respectively.

Figure 2: Cumulative infectives as function of time for Switzerland

Figure 3: Cumulative infectives as function of time for Italy

Figure 4: Cumulative infectives as function of time for Spain
First cases of COVID-19 were found on 25 February in Switzerland, 31 January in Italy and 1 February in Spain and the total cumulative tally was 50106, 307597, 736583, respectively, up to 15 September, which can be compared with the actual cumulative cases data available on JH are as 47751 in Switzerland, 289990 in Italy, 603167 in Spain. Prediction is very much closer, as demonstrated in Figs. 2–4. The outcome validates our procedure of analysis and also provides the confidence to precisely forecast the pandemic situation for Saudi Arabia. The first confirmed case of COVID-19 was identified on 3rd March in Saudi Arabia, so initially, the infection rate β(t) was zero, but on 5th March, the infective cases increased to 5. Subsequently, in 5 days on 10 March, it reached to 20, which led to the infection rate β(t) to be at 0.33. In the early phase, the recovery rate γ(t) was also zero, but on 10 March for the first time, it jumped to 0.66 when one person recovered. But in following two days, on 12th March, the infection rate β(t) increased sharply and reached to 1.12. From 10th March onwards, the infection cases became more than double. The spike in the number of infective cases reported on March 17 resulted in β(t) rising pointedly. In view of the sudden rise in the β(t), the number of infective led to more testing, especially at community level to determine the Corona cases. To figure out the scenario of COVID-19 in Saudi Arabia, the value of β(t) and γ(t) constants have been calculated with the help of Eqs. (6) and (7) for seven months as shown Tab. 1. These generated values are further passed as an input in SIR model. To build a model on training data, we first calculated the β(t) from March to September by using real data available on JHU, then average of time dependent variant infection rate β(t) was obtained for March 2020. Similarly, the average β(t) was calculated for April, May, June, July, August September. Similarly, by using the Eq. (6), the infected cases I(t) was calculated for March to September which was slightly on the higher side of actual infected cases because here the recovery cases are not considered. Fig. 5 explains the scenario of COVID-19 spread in case, if only β(t) is considered to estimate the infective cases. For pandemic prediction and evaluation in the coming months, the parameterization of β(t) and γ(t) both are required so that it can be passed in SIR model for precise prediction of actual infected cases. For this, we also need to find out the exponential fit of γ(t)parameter. γ(t) is slow varying variable so the average value of γ(t) from March to September has been estimated to find out the suitable fit of removal rate γ(t) parameter.

Figure 5: Cumulative infective cases based on parametrize β(t) and Y(t) as function of time
In this analysis, different optimize window of β(t) and γ(t) have been used instead of fix values for accurate prediction of cumulative I(t), optimized window of time varying variable β(t) and γ(t) is considered. The infected cases obtained by SIR model from March to September, is quite close to the actual data available on the dashboard of JHU, as shown in Fig. 5. This also provides the confidence to precisely forecast the pandemic situation for the following two months of Saudi Arabia. The modeling has been done for forecasting the outbreak of COVID-19 in next two months, based on the previous learning of β(t) and γ(t). The prediction has to be made by using several subset window of different value of β(t) and γ(t). Infection rate considered here is 0.003 in October, and 0.002 in November Similarly the Recovery Rate γ(t) is 0.004 in October, and 0.003 in November. Predictions show that there are likely to be 351082 COVID-19 cases in October, and 373142 cases in November in Saudi Arabia. Any changes in Safe Measures, Social Distancing could rapidly affect the prediction outcome. The cumulative infective cases with time varying variable β(t) and γ(t) are represented in Fig. 5. The recovery rate γ(t) with the value of 0.004 shows a significant change in cumulative infective cases. In October, the total number of infective cases may reach to a recovery rate of 0.003 in November. This suggests that better health care, and following the safety and precautionary measures can shorten the period of pandemic.
The input epidemiological data of COVID-19 spread has been discussed in Tab. 1 of this paper. Two inputs- infection rate β(t) and removal rate γ(t) have been estimated by Eqs. (6) and (7). For this, the parameterization of both variables β(t) and γ(t) exponential fits for model has been defined. The validation of analysis procedure is based on the data obtained through the use of similar model in Switzerland, Italy and Spain where COVID-19 cases are on decline. The agreeability of the prediction results obtained from the SIR in these countries further corroborates the use of SIR for the prediction of COVID-19 cases in Saudi Arabia. Following are the prediction and control measures:
In this study, the predictions have been made for infective cases of COVID-19 in Saudi Arabia in October and November by using mathematical modeling SIR and respective curve fittings. The estimate shows that at the beginning of the spread, the infection rate was around 0.26. After that, preventive measures have been taken and the infection rate further declined to 0.002. This implies that the transmission rate should also subside to some extent. In Fig. 5, the simulation shows the dynamics of the spread of COVID-19 after 197 days. With the help of this assumption and different important estimation, we can predict the trend of the spread of contagious diseases in Saudi Arabia
Various important measures have already been taken into consideration to prevent the transmission of COVID-19 disease. People are quarantined at home, most of the companies have stopped their working and schools have been closed as one of the preventive measures. These preventive steps have certainly reduced the transmission rate of COVID-19. But still there are questions for which there are yet no definitive answers like, how long will such situations linger on and when will the normalcy be restored. If people go back to their work and schools will reopen, will it increase the contact rate? Based on these assumptions and fixing other parameters according to data fitting, authors have numerically investigated the current dynamics of Corona spread in Saudi Arabia. In Fig. 4, the authors have demonstrated the total confirmed cases. As per the statistical analysis, continuous growth can be seen in the next two months as depicted in Fig. 4. Thus, for controlling the transmission rate further, we need to control the contact rate. So, a set of strong precautionary measures are recommended in order to prevent the further spread of COVID-19 in Saudi Arabia.
Funding Statement: The authors received no specific funding for this study.
Conflicts of Interest: The authors declare that they have no conflicts of interest to report regarding the present study.
1. C. Huang, Y. Wang, X. Li, L. Ren, J. Zhao et al. (2020). , “Clinical features of patients infected with 2019 novel coronavirus in Wuhan, China,” Lancet, vol. 395, no. 10223, pp. 497–506. [Google Scholar]
2. S. A. Lauer, K. H. Grantz, Q. Bi, F. K. Jones, Q. Zheng et al. (2020). , “The incubation period of coronavirus disease 2019 (COVID-19) from publicly reported confirmed cases: Estimation and application,” Annals of Internal Medicine, vol. 172, no. 9, pp. 577–582. [Google Scholar]
3. S. I. Alzahrani, I. A. Aljamaan and E. A. Al-Fakih. (2020). “Forecasting the spread of the COVID-19 pandemic in Saudi Arabia using ARIMA prediction model under current public health interventions,” Journal of Infection and Public Health, vol. 13, no. 7, pp. 914–919. [Google Scholar]
4. I. Cooper, A. Mondal and C. G. Antonopoulos. (2020). “A SIR model assumption for the spread of COVID-19 in different communities,” Chaos Solitons & Fractals, vol. 139, no. 7, pp. 110057. [Google Scholar]
5. Z. Yang, Z. Zeng, K. Wang, S. S. Wong, W. Liang et al. (2020). , “Modified SEIR and AI prediction of the epidemics trend of COVID-19 in China under public health interventions,” Journal of Thoracic Disease, vol. 12, no. 3, pp. 165–174. [Google Scholar]
6. M. Waqas, M. Farooq, R. Ahmad and A. Ahmad, “Analysis and prediction of COVID-19 pandemic in Pakistan using time-dependent SIR model,” Journal of Biological Dynamics, vol. 14, no. 1, pp. 730–747, 2020. [Google Scholar]
7. L. Zhong, L. Mu, J. Li, J. Wang, Z. Yin et al. (2020). , “Early prediction of the 2019 novel coronavirus outbreak in the mainland china based on simple mathematical model,” IEEE Access, vol. 8, no. 7, pp. 51761–51769. [Google Scholar]
8. W. C. Roda, M. B. Varughese, D. Han and M. Y. Li. (2020). “Why is it difficult to accurately predict the COVID-19 epidemic?,” Infectious Disease Modelling, vol. 5, no. 7, pp. 271–281. [Google Scholar]
9. B. Malavika, S. Marimuthu, M. Joy, A. Nadaraj, E. S. Asirvatham et al., “Forecasting COVID-19 epidemic in India and high incidence states using SIR and logistic growth models,” Clinical Epidemiology and Global Health, vol. 5, no. 8, pp. 1–8, 2020. [Google Scholar]
10. S. Tuli, S. Tuli, R. Tuli and S. S. Gill. (2020). “Predicting the growth and trend of COVID-19 pandemic using machine learning and cloud computing,” Internet of Things, vol. 11, no. 7, pp. 100222. [Google Scholar]
11. S. Ghosh and S. Bhattacharya. (2020). “A data-driven understanding of COVID-19 dynamics using sequential genetic algorithm based probabilistic cellular automata,” Applied Soft Computing, vol. 96, pp. 106692. [Google Scholar]
12. P. Hartono. (2020). “Similarity maps and pairwise predictions for transmission dynamics of COVID-19 with neural networks,” Informatics in Medicine Unlocked, vol. 20, pp. 100386. [Google Scholar]
13. D. Fanelli and F. Piazza. (2020). “Analysis and forecast of COVID-19 spreading in China, Italy and France,” Chaos, Solitons & Fractals, vol. 134, no. 7, pp. 109761. [Google Scholar]
14. M. D'Arienzo and A. Coniglio. (2020). “Assessment of the SARS-CoV-2 basic reproduction number, R0, based on the early phase of COVID-19 outbreak in Italy,” Biosafety and Health, vol. 2, no. 2, pp. 57–59. [Google Scholar]
15. Z. Ceylan. (2020). “Estimation of COVID-19 prevalence in Italy, Spain, and France,” Science of the Total Environment, vol. 729, pp. 138817. [Google Scholar]
16. A. Mahajan, N. A. Sivadas and R. Solanki. (2020). “An epidemic model SIPHERD and its application for prediction of the spread of COVID-19 infection in India,” Chaos, Solitons & Fractals, vol. 140, no. 7, pp. 110156. [Google Scholar]
17. A. Mahajan and R. Solanki, “An epidemic model SIPHERD and its application for prediction of the COVID-19 infection for India and USA,” Chaos, Solitons, and Fractals, vol. 140, pp. 110–156, 2020. [Google Scholar]
18. D. Rafiq, S. A. Suhail and M. A. Bazaz. (2020). “Evaluation and prediction of COVID-19 in India: A case study of worst hit states,” Chaos, Solitons & Fractals, vol. 139, no. 7, pp. 110014. [Google Scholar]
19. K. Sarkar, S. Khajanchi and J. J. Nieto. (2020). “Modeling and forecasting the COVID-19 pandemic in India,” Chaos, Solitons & Fractals, vol. 139, no. 7, pp. 110049. [Google Scholar]
20. D. K. Bagal, A. Rath, A. Barua and D. Patnaik. (2020). “Estimating the parameters of susceptible-infected-recovered model of COVID-19 cases in India during lockdown periods,” Chaos, Solitons & Fractals, vol. 140, no. 7, pp. 110154. [Google Scholar]
21. S. E. Eikenberry, M. Mancuso, E. Iboi, T. Phan, K. Eikenberry et al. (2020). , “To mask or not to mask: Modeling the potential for face mask use by the general public to curtail the COVID-19 pandemic,” Infectious Disease Modelling, vol. 5, no. 7, pp. 293–308. [Google Scholar]
22. Z. Zhao, X. Li, F. Liu, G. Zhu, C. Ma et al. (2020). , “Prediction of the COVID-19 spread in African countries and implications for prevention and controls: A case study in South Africa,” Science of the Total Environment, vol. 729, no. 7, pp. 138959. [Google Scholar]
23. D. Fanelli and F. Piazza. (2020). “Analysis and forecast of COVID-19 spreading in China, Italy and France,” Chaos, Solitons & Fractals, vol. 134, no. 7, pp. 109761. [Google Scholar]
24. S. He, S. Tang and L. Rong. (2020). “A discrete stochastic model of the COVID-19 outbreak: Forecast and control,” Mathematical Biosciences and Engineering, vol. 17, no. 4, pp. 2792–2804. [Google Scholar]
25. G. E. Weissman, A. C. Droesch, C. Chivers, T. Luong, A. Hanish et al. (2020). , “Locally informed simulation to predict hospital capacity needs during the COVID-19 pandemic,” Annals of Internal Medicine, vol. 173, no. 1, pp. 21–28. [Google Scholar]
26. F. Ndairou, I. Area, J. J. Nieto and D. F. Torres. (2020). “Mathematical modeling of COVID-19 transmission dynamics with a case study of Wuhan,” Chaos, Solitons & Fractals, vol. 135, no. 7, pp. 109846. [Google Scholar]
27. T. Alberti and D. Faranda. (2020). “On the uncertainty of real-time predictions of epidemic growths: A COVID-19 case study for China and Italy,” Communications in Nonlinear Science and Numerical Simulation, vol. 90, no. 7, pp. 105372. [Google Scholar]
28. M. Wieczorek, J. Siłka and M. Woźniak. (2020). “Neural network powered COVID-19 spread forecasting model,” Chaos, Solitons & Fractals, vol. 140, no. 7, pp. 110203. [Google Scholar]
29. V. Vaishnav and J. Vajpai. (2020). “Assessment of impact of relaxation in lockdown and forecast of preparation for combating COVID-19 pandemic in India using group method of data handling,” Chaos, Solitons & Fractals, vol. 140, no. 7, pp. 110191. [Google Scholar]
30. Y. Huang, Y. Wu and W. Zhang. (2020). “Comprehensive identification and isolation policies have effectively suppressed the spread of COVID-19,” Chaos, Solitons & Fractals, vol. 139, no. 7, pp. 110041. [Google Scholar]
31. S. Alrashed, N. M. Allah, A. Saxena, I. Ali and R. Mehmood. (2020). “Impact of lockdowns on the spread of COVID-19 in Saudi Arabia,” Informatics in Medicine Unlocked, vol. 20, no. 7, pp. 1004–1020. [Google Scholar]
 | This work is licensed under a Creative Commons Attribution 4.0 International License, which permits unrestricted use, distribution, and reproduction in any medium, provided the original work is properly cited. |